Vitamin D supplementation for chronic liver diseases in adults
Información
- DOI:
- https://doi.org/10.1002/14651858.CD011564.pub3Copiar DOI

- Base de datos:
-
- Cochrane Database of Systematic Reviews
- Versión publicada:
-
- 25 agosto 2021see what's new
- Tipo:
-
- Intervention
- Etapa:
-
- Review
- Grupo Editorial Cochrane:
-
Grupo Cochrane de Hepatobiliar
- Copyright:
-
- Copyright © 2021 The Cochrane Collaboration. Published by John Wiley & Sons, Ltd.
Cifras del artículo
Altmetric:
Citado por:
Autores
Contributions of authors
MB: took the lead in updating the review, performed data extraction, and drafted the review update.
DN: revised the protocol, performed data extraction, commented on and revised the review.
GB: initiated the review; drafted the protocol; performed the literature search, data extraction, and statistical analyses; updated and revised the review.
CG: revised the protocol, acted as arbiter for disagreements, and commented on and revised the review.
Sources of support
Internal sources
-
Copenhagen Trial Unit, Centre for Clinical Intervention Research, Rigshospitalet, Copenhagen, Denmark
Working place
External sources
-
Ministry of Education, Science and Technological Development of Republic of Serbia (Grant No: 451‐03‐9/2021‐14/200113), Serbia
Salary
-
Medical Faculty, University of Nis, Internal project 66, Serbia
No monetary support
-
Serbian Academy of Sciences and Arts ‐ branch in Nis Project O‐26‐20, Serbia
No monetary support
Declarations of interest
MB: none known.
DN is the Managing Editor of the Cochrane Hepato‐Biliary Group. However, the peer review process was dealt with through staff within the Cochrane Central Editorial Service Team.
GB: none known.
CG: none known.
Acknowledgements
We thank Marija Bjelakovic and Marko Bjelakovic for their work on the review. They were co‐authors of previously published versions of this review (2015, Marija Bjelakovic; 2017, Marko Bjelakovic).
Cochrane Review Group funding acknowledgement: the Danish State is the largest single funder of the Cochrane Hepato‐Biliary Group through its investment in the Copenhagen Trial Unit, Centre for Clinical Intervention Research, the Capital Region, Rigshospitalet, Copenhagen, Denmark. Disclaimer: the views and opinions expressed in this review are those of the authors and do not necessarily reflect those of the Danish State or the Copenhagen Trial Unit.
Peer reviewers of the first review version: Sohail Mushtaq, UK; Tony Bruns, Germany
Peer review of this update: Maria G. Grammatikopoulou, Department of Nutritional Sciences & Dietetics, International Hellenic University, Greece (peer review of the update was manged by the Cochrane Central Editorial Service).
Contact Editor: Vanja Giljaca, UK
Cochrane Abdomen and Endocrine Network Associate Editor: Rachel Richardson, UK
Cochrane Abdomen and Endocrine Network and Sign‐off Editor: Cindy Farquhar, New Zealand
Copy‐editor: Lisa Winer, USA
Version history
| Published | Title | Stage | Authors | Version |
| 2021 Aug 25 | Vitamin D supplementation for chronic liver diseases in adults | Review | Milica Bjelakovic, Dimitrinka Nikolova, Goran Bjelakovic, Christian Gluud | |
| 2017 Nov 03 | Vitamin D supplementation for chronic liver diseases in adults | Review | Goran Bjelakovic, Dimitrinka Nikolova, Marko Bjelakovic, Christian Gluud | |
| 2015 Mar 04 | Vitamin D supplementation for chronic liver diseases in adults | Protocol | Goran Bjelakovic, Dimitrinka Nikolova, Marija Bjelakovic, Christian Gluud | |
Differences between protocol and review
-
We updated the Methods section of the protocol part of the review, as follows.
-
We removed the sentence "We included such studies only for assessment of harms." from the first two risk of bias domains.
-
Types of outcome measures. We modified and changed the order of outcomes. In addition, we merged secondary and exploratory outcomes due to updated editorial recommendations.
-
We added subgroup analysis according to participant's vitamin D status at entry, comparing participants with normal vitamin D levels at entry to those with decreased levels, and comparing different forms of vitamin D (vitamin D3, vitamin D2, 25‐dihydroxyvitamin D, and 1,25‐dihydroxyvitamin D).
-
We increased the number of biochemical indices to mirror the expanding number of outcomes assessed in the included trials.
-
Data synthesis. In our Trial Sequential Analysis, the diversity‐adjusted required information size was based on the event proportion in the control group; assumption of a plausible relative risk reduction of 20%; a risk of type I error of 1.25% for the first seven outcomes; a risk of type II error of 10%; and the observed diversity of the included trials in the meta‐analysis (Jakobsen 2014a; Wetterslev 2017). We reduced the relative risk reduction from 28% in our primary analysis to 20% in the current update given that the higher number seems unrealistic, and we could not find any evidence supporting it. The alpha level in our review update has decreased to 1.25% in order to account for multiplicity, assuming seven outcomes in the summary of findings table (Jakobsen 2014a).
-
We used Trial Sequential Analysis as sensitivity analysis to assess imprecision.
-
-
Milica Bjelakovic joined the team of authors during the preparation of the review update.
Notes
Cochrane Reviews can be expected to have a high percentage of overlap in the Methods section due to the use of standardised methods. In addition, overlap may be observed across some of our protocols and reviews, as they share at least three common authors.
Keywords
MeSH
Medical Subject Headings (MeSH) Keywords
Medical Subject Headings Check Words
Adult; Female; Humans; Male; Middle Aged;
PICO

Study flow diagram.

Risk of bias summary: review authors' judgements about each risk of bias item for each included study.

Risk of bias graph: review authors' judgements about each risk of bias item presented as percentages across all included studies.

All‐cause mortality.
Trial Sequential Analysis was performed based on a mortality in the control group of 2%, a relative risk reduction of 20% in the experimental intervention group, a type I error of 1.25%, and a type II error of 10% (90% power). There was no diversity. The required information size was 63,116 participants. The cumulative Z‐curve (blue line) did not cross the trial sequential monitoring boundary for benefit or harm after the 27th trial. The trial sequential monitoring boundaries were ignored due to little information (3.14%). The blue line represents the cumulative Z‐score of the meta‐analysis. The green dotted lines represent the conventional statistical boundaries.

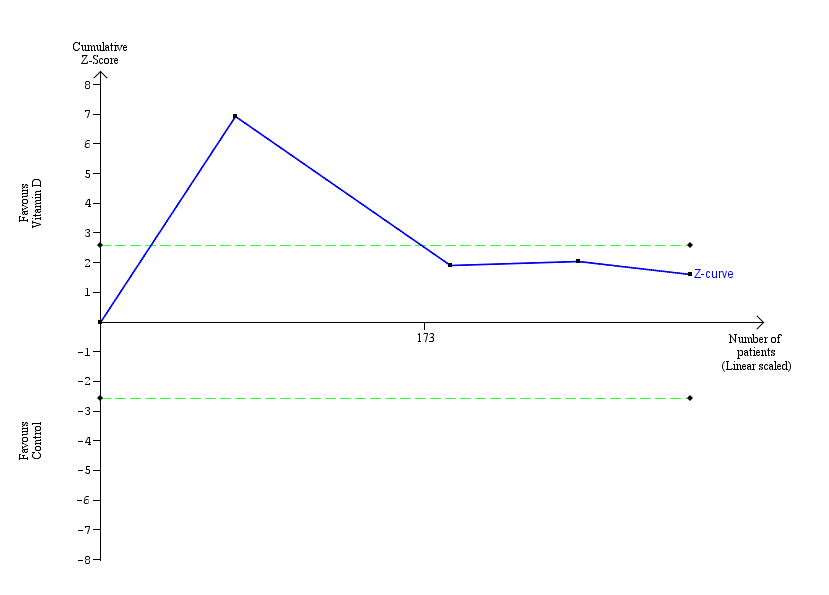
Rapid virological response.
Trial Sequential Analysis was performed based on a failure of rapid virological response in the control group of 53%, a relative risk reduction (RRR) of 20% in the intervention group, a type I error of 1.25%, and a type II error of 10% (90% power). There was no diversity. The required information size was 1269 participants. The cumulative Z‐curve (blue line) crossed the conventional monitoring boundary for benefit but did not cross the trial sequential monitoring boundary for benefit (red down‐sloping line). The blue line represents the cumulative Z‐score of the meta‐analysis. The green dotted lines represent the conventional statistical boundaries. The red inward‐sloping lines represent the trial sequential monitoring boundaries.
Early virological response.
Trial Sequential Analysis was performed based on failure of early virological response in the control group of 34%, a relative risk reduction of 20% in the intervention group, a type I error of 1.25%, and a type II error of 10% (90% power). The diversity was 88%. The required information size was 21,306 participants. The cumulative Z‐curve (blue line) crossed the conventional monitoring boundary for benefit. The trial sequential monitoring boundary was ignored due to little information (1.48%). The blue line represents the cumulative Z‐score of the meta‐analysis. The green lines represent the conventional statistical boundaries.

Sustained virological response.
Trial Sequential Analysis was performed based on failure of sustained virological response in the control group of 48%, a relative risk reduction (RRR) of 20% in the intervention group, a type I error of 1.25%, and a type II error of 10% (90% power). Diversity was 80%. The required information size was 7570 participants. The cumulative Z‐curve (blue line) crossed the conventional monitoring boundary for benefit. However, it did not cross any of the monitoring boundaries for benefit, harm, or futility. The blue line represents the cumulative Z‐score of the meta‐analysis. The green lines represent the conventional statistical boundaries. The red inward‐sloping lines represent the trial sequential monitoring boundaries for benefit and harm.

Comparison 1: Vitamin D versus placebo or no intervention, Outcome 1: 1.1 All‐cause mortality

Comparison 1: Vitamin D versus placebo or no intervention, Outcome 2: 1.1 All‐cause mortality according to vested interest

Comparison 1: Vitamin D versus placebo or no intervention, Outcome 3: All‐cause mortality according to vitamin D status at entry

Comparison 1: Vitamin D versus placebo or no intervention, Outcome 4: All‐cause mortality according to form of vitamin D

Comparison 1: Vitamin D versus placebo or no intervention, Outcome 5: All‐cause mortality (best‐worst‐case and worst‐best‐case scenarios)

Comparison 1: Vitamin D versus placebo or no intervention, Outcome 6: Liver‐related mortality

Comparison 1: Vitamin D versus placebo or no intervention, Outcome 7: Serious adverse events

Comparison 1: Vitamin D versus placebo or no intervention, Outcome 8: Liver‐related morbidity

Comparison 1: Vitamin D versus placebo or no intervention, Outcome 9: Health‐related quality of life

Comparison 1: Vitamin D versus placebo or no intervention, Outcome 10: Non‐serious adverse events

Comparison 1: Vitamin D versus placebo or no intervention, Outcome 11: Failure of rapid virological response

Comparison 1: Vitamin D versus placebo or no intervention, Outcome 12: Failure of early virological response

Comparison 1: Vitamin D versus placebo or no intervention, Outcome 13: Failure of sustained virological response

Comparison 1: Vitamin D versus placebo or no intervention, Outcome 14: Acute cellular rejection in liver transplant recipients

Comparison 1: Vitamin D versus placebo or no intervention, Outcome 15: Vitamin D status (ng/mL)

Comparison 1: Vitamin D versus placebo or no intervention, Outcome 16: Bone mineral density (g/cm)

Comparison 1: Vitamin D versus placebo or no intervention, Outcome 17: Aspartate aminotransferase (IU/L)

Comparison 1: Vitamin D versus placebo or no intervention, Outcome 18: Alanine aminotransferase (IU/L

Comparison 1: Vitamin D versus placebo or no intervention, Outcome 19: Alkaline phosphatases (IU/L)

Comparison 1: Vitamin D versus placebo or no intervention, Outcome 20: Gamma‐glutamyl transpeptidase (IU/L)

Comparison 1: Vitamin D versus placebo or no intervention, Outcome 21: Bilirubin (mg/dL)

Comparison 1: Vitamin D versus placebo or no intervention, Outcome 22: Triglyceride (mg/dL)

Comparison 1: Vitamin D versus placebo or no intervention, Outcome 23: Cholesterol (mg/dL)

Comparison 1: Vitamin D versus placebo or no intervention, Outcome 24: LDL cholesterol (mg/dL)

Comparison 1: Vitamin D versus placebo or no intervention, Outcome 25: Albumin (g/L)

Comparison 1: Vitamin D versus placebo or no intervention, Outcome 26: HDL cholesterol (mg/dL)

Comparison 1: Vitamin D versus placebo or no intervention, Outcome 27: Calcium (mg/dL)

Comparison 1: Vitamin D versus placebo or no intervention, Outcome 28: Glucose (mg/dL)

Comparison 1: Vitamin D versus placebo or no intervention, Outcome 29: Phosphorus (mg/dL)

Comparison 1: Vitamin D versus placebo or no intervention, Outcome 30: Adiponectin (µg/mL)

Comparison 1: Vitamin D versus placebo or no intervention, Outcome 31: Insulin (mIU/mL)

Comparison 1: Vitamin D versus placebo or no intervention, Outcome 32: Parathyroid hormone (pg/mL)

Comparison 1: Vitamin D versus placebo or no intervention, Outcome 33: C‐reactive protein (mg/L)
| Vitamin D compared with placebo or no intervention for chronic liver diseases in adults | ||||||
| Patient or population: people with chronic liver diseases | ||||||
| Outcomes | Anticipated absolute effects* (95% CI) | Relative effect | № of participants | Certainty of the evidence | Comments | |
|---|---|---|---|---|---|---|
| Risk with placebo or no intervention | Risk with vitamin D | |||||
| All‐cause mortality Follow‐up: mean 7 months (1 to 18 months) | Study population | RR 0.86 | 1979 | ⊕⊝⊝⊝ | ||
| 21 per 1000 | 18 per 1000 | |||||
| Liver‐related mortality Follow‐up: 12 months | Study population | RR 1.62 | 18 | ⊕⊝⊝⊝ | No information was available to calculate absolute effects. | |
| ‐ | ‐ | |||||
| Serious adverse events Follow‐up: mean 10.5 months (6 to 12 months) | Study population | ‐ | ‐ | ⊕⊝⊝⊝ | ||
| Several serious adverse events were reported: hypercalcaemia (RR 5.00, 95% CI 0.25 to 100.8; 1 trial; 76 participants); myocardial infarction (RR 0.75, 95% CI 0.08 to 6.81; 2 trials; 86 participants); thyroiditis (RR 0.33, 95% CI 0.01 to 7.91; 1 trial; 68 participants); circular haemorrhoidal prolapse (RR 3.00, 95% CI 0.14 to 65.9; 1 trial; 20 participants); bronchopneumonia (RR 0.33, 95% CI 0.02 to 7.32; 1 trial; 20 participants). | ||||||
| Liver‐related morbidity | Study population | ‐ | (0 RCTs) | ‐ | ||
| ‐ | ‐ | |||||
| Health‐related quality of life | Study population | ‐ | (0 RCTs) | ‐ | ||
| ‐ | ‐ | |||||
| Non‐serious adverse events Follow‐up: mean 7 months (3 to 12 months) | Study population | ‐ | ‐ | ⊕⊝⊝⊝ | ||
| 1 trial reported 1 single non‐serious adverse event, and another trial reported 16 single non‐serious adverse events, for a total of 17 types of non‐serious adverse events. | ||||||
| Failure of sustained virological response Follow‐up: mean 16 months (6 to 18 months) | Study population | RR 0.65 | 630 | ⊕⊝⊝⊝ | ||
| 484 per 1000 | 315 per 1000 | |||||
| *The risk in the intervention group (and its 95% CI) is based on the assumed risk in the comparison group and the relative effect of the intervention (and its 95% CI). | ||||||
| GRADE Working Group grades of evidence | ||||||
| 1Downgraded because of risk of bias (1 level) (all trials were at high risk of bias); and imprecision (2 levels) (few events, and the optimal information size of 63,116 participants (based on a proportion of 2% in the control group, a relative risk reduction of 20%, an alpha of 1.25%, and a beta of 10%) was not met; wide CI which included both benefits and harms). | ||||||
| Study ID | Protocol | Design | Groups | Bias | Blinding | Participants | Women | Mean |
|---|---|---|---|---|---|---|---|---|
| Yes | Parallel group | 2 | High | NI | 72 | 44 | 47 | |
| No | Parallel group | 2 | High | NI | 115 | 50 | 64 | |
| Yes | Parallel group | 2 | High | PL | 65 | 35 | 59 | |
| Yes | Parallel group | 2 | High | NI | 60 | 40 | 41 | |
| No | Parallel group | 2 | High | PL | 60 | ‐ | ‐ | |
| Yes | Parallel group | 2 | High | PL | 106 | 59 | 45 | |
| No | Parallel group | 2 | High | NI | 101 | 25 | 40 | |
| Yes | Parallel group | 2 | High | PL | 60 | 52 | 48 | |
| Yes | Parallel group | 2 | High | PL | 20 | ‐ | 44 | |
| Yes | Parallel group | 2 | High | NI | 82 | 100 | 34 | |
| No | Parallel group | 2 | High | PL | 109 | 36 | 28 | |
| Yes | Parallel group | 2 | High | NI | 148 | 49 | 52 | |
| No | Parallel group | 2 | High | NI | 101 | 24 | 45 | |
| Yes | Parallel group | 2 | High | PL | 80 | 46 | 52 | |
| Yes | Parallel group | 2 | High | PL | 58 | 38 | 50 | |
| Yes | Parallel group | 3 | High | PL | 120 | 38 | 41 | |
| No | Parallel group | 3 | High | NI | 18 | 0 | 61 | |
| No | Parallel group | 2 | High | NI | 50 | 58 | 47 | |
| Yes | Parallel group | 2 | High | PL | 36 | 25 | 61 | |
| No | Parallel group | 2 | High | NI | 81 | 32 | 38 | |
| No | Parallel group | 2 | High | PL | 60 | 51 | 60 | |
| No | Parallel group | 2 | High | NI | 76 | 66 | 61 | |
| No | Parallel group | 2 | High | NI | 34 | 100 | 56 | |
| Yes | Parallel group | 2 | High | NI | 40 | 50 | 42 | |
| Yes | Parallel group | 2 | High | NI | 68 | 13 | 42 | |
| No | Parallel group | 3 | High | PL | 75 | 17 | 48 | |
| No | Parallel group | 2 | High | NI | 84 | 49 | 59 | |
| n: number of participants | ||||||||
| Study ID | Participants | Outcome measures | Sponsor | Country |
|---|---|---|---|---|
| Chronic hepatitis C genotype 1 | Sustained virological response | No information | Israel | |
| Chronic hepatitis C genotype 1 | Sustained virological response | No information | Japan | |
| NAFLD | Liver steatosis, liver function | No | Italy | |
| Chronic hepatitis C genotype 1, 4 | Sustained virological response | No | India | |
| NAFLD | Biochemical indices, HOMA, FibroScan measurement | No information | Thailand | |
| NAFLD | Biochemical indices | No | Iran | |
| Chronic hepatitis C genotype 4 | Sustained virological response | No information | Egypt | |
| NAFLD | Liver steatosis, liver function | No | Iran | |
| NAFLD (NASH) | Liver steatosis, liver function | Yes | Switzerland | |
| NAFLD | Serum 25‐hydroxyvitamin D, adiponectin, HOMA‐IR, liver enzymes, and change in grade of NAFLD | No | Iran | |
| NAFLD | Body weight, BMI, insulin resistance, dyslipidaemia, hepatic enzymes, CRP, and adiponectin | No information | Pakistan | |
| Chronic hepatitis C genotype 1, 2, 3 | Sustained virological response | No information | Republic of Korea | |
| Liver cirrhosis | Mortality | No information | India | |
| Chronic hepatitis C | Serum levels of T‐helper cells associated cytokines | No | Thailand | |
| Chronic hepatitis C | Serum fibrotic markers | No | Thailand | |
| NAFLD | Liver function, body fat | No | Iran | |
| Liver cirrhosis | Bone mineral density | Yes | USA | |
| Chronic hepatitis C genotype 2 or 3 | Sustained virological response | No information | Israel | |
| Liver cirrhosis | Vitamin D status, liver function | No | Austria | |
| NAFLD | Insulin resistance and serum ALT | No | India | |
| NAFLD | Liver function, insulin resistance index | No | Iran | |
| Liver cirrhosis | Bone mineral density | No information | Japan | |
| Primary biliary cirrhosis | Bone mineral density | No information | Japan | |
| NAFLD | Biochemical indices, liver steatosis | No information | Iran | |
| Chronic hepatitis C genotype 1, 2, 3, 4 | Early virological response | No | Iran | |
| Liver transplant recipients | Acute cellular rejection rate | No | China | |
| Chronic hepatitis C genotype 1 | Sustained virological response | No information | Japan | |
| ALT: alanine aminotransferase | ||||
| Study ID | Vitamin | Calcium | Route | Regimen | Treatment | Follow‐up | Co‐intervention | |||
|---|---|---|---|---|---|---|---|---|---|---|
| D3 | D2 | 25(OH)D | 1,25(OH)2D | |||||||
| 2000 | ‐ | ‐ | ‐ | ‐ | Orally | Daily | 48 | 72 | PEG‐IFN, RBV | |
| 2000 | ‐ | ‐ | ‐ | ‐ | Orally | Daily | 16 | 24 | PEG‐IFN, RBV, SP | |
| 2000 | ‐ | ‐ | ‐ | ‐ | Orally | Daily | 24 | 24 | ‐ | |
| 2000 | ‐ | ‐ | ‐ | ‐ | Orally | Daily | 48 | 48 | PEG‐IFN, RBV | |
| ‐ | ‐ | ‐ | ‐ | ‐ | Orally | Daily | 20 | 20 | ||
| 50,000 | ‐ | ‐ | 0.25 | ‐ | Orally | Weekly and daily | 12 | 12 | ||
| 2143 | ‐ | ‐ | ‐ | ‐ | Orally | Weekly | 48 | 72 | PEG‐IFN, RBV | |
| 7143 | ‐ | ‐ | ‐ | ‐ | Orally | Weekly | 10 | 10 | ‐ | |
| 2100 | ‐ | ‐ | ‐ | ‐ | Orally | Daily | 48 | 48 | ||
| 600,000 | ‐ | ‐ | ‐ | ‐ | Intramuscularly | Single dose | Single dose | 4 | Vitamin E 400 IU/day | |
| 50,000 | ‐ | ‐ | ‐ | ‐ | Orally | Weekly | 12 | 12 | ||
| 800 | ‐ | ‐ | ‐ | ‐ | Orally | Daily | 24, 48 | 48, 72 | PEG‐IFN, RBV | |
| 300,000; 800 | ‐ | ‐ | ‐ | 1000 | Intramuscularly and orally | Single dose; daily | 24 | 24 | ||
| ‐ | 60,000; 80,000; 100,000 | ‐ | ‐ | ‐ | Orally | Weekly | 6 | 6 | ||
| ‐ | 60,000; 80,000; 100,000 | ‐ | ‐ | ‐ | Orally | Weekly | 6 | 6 | ||
| 1000 | ‐ | ‐ | ‐ | 500 | Orally | Daily | 10 | 12 | ‐ | |
| ‐ | 17,857 | 2400 | ‐ | ‐ | Orally | Daily | 52 | 52 | ‐ | |
| 2000 | ‐ | ‐ | ‐ | ‐ | Orally | Daily | 24 | 48 | PEG‐IFN, RBV | |
| 2800 | ‐ | ‐ | ‐ | ‐ | Orally | Daily | 8 | 8 | ‐ | |
| 600,000 | ‐ | ‐ | ‐ | ‐ | Intramuscularly | Single dose | Single dose | 24 | ||
| 3571 | ‐ | ‐ | ‐ | ‐ | Orally | Twice a week | 16 | 16 | ‐ | |
| ‐ | ‐ | ‐ | 1 | ‐ | Orally | Daily | 52 | 52 | ‐ | |
| ‐ | ‐ | ‐ | 1 | ‐ | Orally | Daily | 52 | 52 | ‐ | |
| 50,000 | ‐ | ‐ | ‐ | ‐ | Orally | Weekly | 12 | 72 | Lifestyle modification | |
| 1600 | ‐ | ‐ | ‐ | ‐ | Orally | Daily | 12 | 12 | PEG‐IFN, RBV | |
| ‐ | ‐ | ‐ | 0.25 | 1000 | Orally | Daily | 4 | 4 | ‐ | |
| 1000 | ‐ | ‐ | ‐ | ‐ | Orally | Daily | 16 | 24 | PEG‐IFN, RBV | |
| 1,25(OH)2D: calcitriol | ||||||||||
| Outcome or subgroup title | No. of studies | No. of participants | Statistical method | Effect size |
| 1.1 1.1 All‐cause mortality Show forest plot | 27 | 1979 | Risk Ratio (M‐H, Random, 95% CI) | 0.86 [0.51, 1.45] |
| 1.1.1 Non‐alcoholic fatty liver disease | 11 | 803 | Risk Ratio (M‐H, Random, 95% CI) | Not estimable |
| 1.1.2 Chronic hepatitis C | 10 | 836 | Risk Ratio (M‐H, Random, 95% CI) | 0.33 [0.04, 3.13] |
| 1.1.3 Liver cirrhosis | 5 | 265 | Risk Ratio (M‐H, Random, 95% CI) | 0.91 [0.53, 1.55] |
| 1.1.4 Liver transplant recipients | 1 | 75 | Risk Ratio (M‐H, Random, 95% CI) | Not estimable |
| 1.2 1.1 All‐cause mortality according to vested interest Show forest plot | 27 | 1979 | Risk Ratio (M‐H, Random, 95% CI) | 0.86 [0.51, 1.45] |
| 1.2.1 Trials with vested interest | 2 | 38 | Risk Ratio (M‐H, Random, 95% CI) | 2.69 [0.15, 48.64] |
| 1.2.2 Trials without vested interest | 25 | 1941 | Risk Ratio (M‐H, Random, 95% CI) | 0.83 [0.48, 1.41] |
| 1.3 All‐cause mortality according to vitamin D status at entry Show forest plot | 27 | 1979 | Risk Ratio (M‐H, Random, 95% CI) | 0.86 [0.51, 1.45] |
| 1.3.1 Normal vitamin D status | 8 | 549 | Risk Ratio (M‐H, Random, 95% CI) | 0.33 [0.04, 3.13] |
| 1.3.2 Low vitamin D status | 19 | 1430 | Risk Ratio (M‐H, Random, 95% CI) | 0.91 [0.53, 1.55] |
| 1.4 All‐cause mortality according to form of vitamin D Show forest plot | 26 | Risk Ratio (M‐H, Random, 95% CI) | Subtotals only | |
| 1.4.1 Vitamin D 3 | 20 | 1578 | Risk Ratio (M‐H, Random, 95% CI) | 0.83 [0.48, 1.41] |
| 1.4.2 Vitamin D 2 | 3 | 150 | Risk Ratio (M‐H, Random, 95% CI) | 3.00 [0.15, 61.74] |
| 1.4.3 1,25‐dihydroxyvitamin D | 4 | 291 | Risk Ratio (M‐H, Random, 95% CI) | Not estimable |
| 1.4.4 25‐hydroxyvitamin D | 1 | 12 | Risk Ratio (M‐H, Random, 95% CI) | 3.00 [0.15, 61.74] |
| 1.5 All‐cause mortality (best‐worst‐case and worst‐best‐case scenarios) Show forest plot | 24 | Risk Ratio (M‐H, Random, 95% CI) | Subtotals only | |
| 1.5.1 Best‐worst‐case scenario | 24 | 1737 | Risk Ratio (M‐H, Random, 95% CI) | 0.14 [0.06, 0.30] |
| 1.5.2 Worst‐best‐case scenario | 24 | 1737 | Risk Ratio (M‐H, Random, 95% CI) | 7.95 [3.55, 17.77] |
| 1.6 Liver‐related mortality Show forest plot | 1 | 18 | Risk Ratio (M‐H, Random, 95% CI) | 1.62 [0.08, 34.66] |
| 1.7 Serious adverse events Show forest plot | 4 | Risk Ratio (M‐H, Random, 95% CI) | Subtotals only | |
| 1.7.1 Hypercalcaemia | 1 | 76 | Risk Ratio (M‐H, Random, 95% CI) | 5.00 [0.25, 100.80] |
| 1.7.2 Myocardial infarction | 2 | 86 | Risk Ratio (M‐H, Random, 95% CI) | 0.75 [0.08, 6.81] |
| 1.7.3 Thyroiditis | 1 | 68 | Risk Ratio (M‐H, Random, 95% CI) | 0.33 [0.01, 7.91] |
| 1.7.4 Circular haemorrhoidal prolapse | 1 | 20 | Risk Ratio (M‐H, Random, 95% CI) | 3.00 [0.14, 65.90] |
| 1.7.5 Bronchopneumonia | 1 | 20 | Risk Ratio (M‐H, Random, 95% CI) | 0.33 [0.02, 7.32] |
| 1.8 Liver‐related morbidity Show forest plot | 0 | 0 | Risk Ratio (M‐H, Random, 95% CI) | Not estimable |
| 1.9 Health‐related quality of life Show forest plot | 0 | 0 | Risk Ratio (M‐H, Random, 95% CI) | Not estimable |
| 1.10 Non‐serious adverse events Show forest plot | 3 | Risk Ratio (M‐H, Random, 95% CI) | Subtotals only | |
| 1.10.1 Glossitis | 1 | 65 | Risk Ratio (M‐H, Random, 95% CI) | 3.70 [0.16, 87.58] |
| 1.10.2 Depression | 1 | 20 | Risk Ratio (M‐H, Random, 95% CI) | 3.00 [0.14, 65.90] |
| 1.10.3 Lower back pain | 1 | 20 | Risk Ratio (M‐H, Random, 95% CI) | 3.00 [0.14, 65.90] |
| 1.10.4 Abdominal bloating | 1 | 20 | Risk Ratio (M‐H, Random, 95% CI) | 0.33 [0.02, 7.32] |
| 1.10.5 Cold | 1 | 20 | Risk Ratio (M‐H, Random, 95% CI) | 0.33 [0.02, 7.32] |
| 1.10.6 Constipation | 1 | 20 | Risk Ratio (M‐H, Random, 95% CI) | 0.33 [0.02, 7.32] |
| 1.10.7 Sore throat | 1 | 20 | Risk Ratio (M‐H, Random, 95% CI) | 0.33 [0.02, 7.32] |
| 1.10.8 Sour taste in mouth | 1 | 20 | Risk Ratio (M‐H, Random, 95% CI) | 0.33 [0.02, 7.32] |
| 1.10.9 Contused lacerated wound | 1 | 20 | Risk Ratio (M‐H, Random, 95% CI) | 0.33 [0.02, 7.32] |
| 1.10.10 Multiple white matter lesions | 1 | 20 | Risk Ratio (M‐H, Random, 95% CI) | 0.33 [0.02, 7.32] |
| 1.10.11 Gastro‐oesophageal reflux | 1 | 20 | Risk Ratio (M‐H, Random, 95% CI) | 3.00 [0.14, 65.90] |
| 1.10.12 Abdominal menstrual cramps | 1 | 20 | Risk Ratio (M‐H, Random, 95% CI) | 3.00 [0.14, 65.90] |
| 1.10.13 Tubular colon adenoma | 1 | 20 | Risk Ratio (M‐H, Random, 95% CI) | 3.00 [0.14, 65.90] |
| 1.10.14 Gastric motility disturbance | 1 | 20 | Risk Ratio (M‐H, Random, 95% CI) | 3.00 [0.14, 65.90] |
| 1.10.15 Irritable bowel syndrome | 1 | 20 | Risk Ratio (M‐H, Random, 95% CI) | 5.00 [0.27, 92.62] |
| 1.10.16 Knee pain | 1 | 20 | Risk Ratio (M‐H, Random, 95% CI) | 3.00 [0.14, 65.90] |
| 1.10.17 Severe allergy | 1 | 109 | Risk Ratio (M‐H, Random, 95% CI) | 5.09 [0.25, 103.64] |
| 1.11 Failure of rapid virological response Show forest plot | 3 | 247 | Risk Ratio (M‐H, Random, 95% CI) | 0.75 [0.60, 0.95] |
| 1.12 Failure of early virological response Show forest plot | 4 | 315 | Risk Ratio (M‐H, Random, 95% CI) | 0.33 [0.11, 1.00] |
| 1.13 Failure of sustained virological response Show forest plot | 7 | 630 | Risk Ratio (M‐H, Random, 95% CI) | 0.65 [0.42, 1.01] |
| 1.14 Acute cellular rejection in liver transplant recipients Show forest plot | 1 | 75 | Risk Ratio (M‐H, Random, 95% CI) | 0.33 [0.04, 2.62] |
| 1.15 Vitamin D status (ng/mL) Show forest plot | 15 | 1078 | Mean Difference (IV, Random, 95% CI) | 18.49 [14.52, 22.47] |
| 1.16 Bone mineral density (g/cm) Show forest plot | 1 | 18 | Mean Difference (IV, Random, 95% CI) | 0.15 [0.04, 0.26] |
| 1.17 Aspartate aminotransferase (IU/L) Show forest plot | 12 | 774 | Mean Difference (IV, Random, 95% CI) | ‐1.75 [‐5.41, 1.91] |
| 1.18 Alanine aminotransferase (IU/L Show forest plot | 13 | 855 | Mean Difference (IV, Random, 95% CI) | ‐2.30 [‐7.60, 3.00] |
| 1.19 Alkaline phosphatases (IU/L) Show forest plot | 6 | 344 | Mean Difference (IV, Random, 95% CI) | ‐0.95 [‐15.10, 13.20] |
| 1.20 Gamma‐glutamyl transpeptidase (IU/L) Show forest plot | 4 | 227 | Mean Difference (IV, Random, 95% CI) | ‐2.69 [‐5.26, ‐0.11] |
| 1.21 Bilirubin (mg/dL) Show forest plot | 3 | 74 | Mean Difference (IV, Random, 95% CI) | 0.32 [0.00, 0.63] |
| 1.22 Triglyceride (mg/dL) Show forest plot | 5 | 460 | Mean Difference (IV, Random, 95% CI) | 11.27 [‐10.99, 33.53] |
| 1.23 Cholesterol (mg/dL) Show forest plot | 4 | 400 | Mean Difference (IV, Random, 95% CI) | 3.51 [‐2.83, 9.85] |
| 1.24 LDL cholesterol (mg/dL) Show forest plot | 4 | 400 | Mean Difference (IV, Random, 95% CI) | ‐0.97 [‐8.70, 6.76] |
| 1.25 Albumin (g/L) Show forest plot | 3 | 74 | Mean Difference (IV, Random, 95% CI) | ‐1.18 [‐2.96, 0.59] |
| 1.26 HDL cholesterol (mg/dL) Show forest plot | 4 | 400 | Mean Difference (IV, Random, 95% CI) | 1.14 [‐0.64, 2.92] |
| 1.27 Calcium (mg/dL) Show forest plot | 7 | 423 | Mean Difference (IV, Random, 95% CI) | 0.04 [‐0.12, 0.19] |
| 1.28 Glucose (mg/dL) Show forest plot | 6 | 469 | Mean Difference (IV, Random, 95% CI) | 1.44 [‐5.05, 7.94] |
| 1.29 Phosphorus (mg/dL) Show forest plot | 4 | 307 | Mean Difference (IV, Random, 95% CI) | 0.17 [‐0.16, 0.50] |
| 1.30 Adiponectin (µg/mL) Show forest plot | 4 | 276 | Mean Difference (IV, Random, 95% CI) | 1.02 [‐0.27, 2.30] |
| 1.31 Insulin (mIU/mL) Show forest plot | 6 | 428 | Mean Difference (IV, Random, 95% CI) | 0.03 [‐1.15, 1.21] |
| 1.32 Parathyroid hormone (pg/mL) Show forest plot | 2 | 118 | Mean Difference (IV, Random, 95% CI) | ‐15.18 [‐38.54, 8.18] |
| 1.33 C‐reactive protein (mg/L) Show forest plot | 4 | 254 | Mean Difference (IV, Random, 95% CI) | ‐0.50 [‐0.93, ‐0.07] |