Administración de suplementos de vitamina D para las hepatopatías crónicas en adultos
Referencias
Referencias de los estudios incluidos en esta revisión
Referencias de los estudios excluidos de esta revisión
Referencias de los estudios en curso
Referencias adicionales
Referencias de otras versiones publicadas de esta revisión
Characteristics of studies
Characteristics of included studies [ordered by study ID]
| Study characteristics | ||
| Methods | Randomised clinical trial with parallel‐group design (2 groups) | |
| Participants | 72 participants (44% women), aged 18 to 65 years, mean age 47 years, with chronic HCV genotype 1. Inclusion criteria: aged 18 to 65 years; chronic HCV genotype 1 infection; no previous treatment for HCV; seronegative for HBV, HDV, and HIV infections; absolute neutrophil count > 1500/mm3; platelet count > 90,000/mm3; and normal haemoglobin level Exclusion criteria: decompensated liver disease (cirrhosis with a Child‐Pugh score > 9), another cause of clinically significant liver disease, or presence of hepatocellular carcinoma | |
| Interventions | Intervention: PEG‐IFN‐α‐2b (1.5 μg/kg body weight) + oral ribavirin 1000 mg/day (for body weight < 75 kg) or 1200 mg/day (for body weight > 75 kg) and vitamin D3 2000 IU/day (n = 36) Control: PEG‐IFN‐α‐2b (1.5 μg/kg body weight) + oral ribavirin 1000 mg/day (for body weight < 75 kg) or 1200 mg/day (for body weight > 75 kg) (n = 36) For 48 weeks. All participants had ≥ 1 follow‐up visit at 24 weeks after completion of treatment. | |
| Outcomes | Outcomes reported in abstract of publication Primary outcome: SVR defined as undetectable HCV‐RNA at 24 weeks' post‐treatment Secondary outcomes: treatment efficacy at weeks 4 (RVR), and 12 (EVR) during therapy, and 24 weeks after cessation of therapy (SVR) | |
| Stated aim of study | To determine whether adding vitamin D improves HCV response to antiviral therapy | |
| Notes | All participants completed the trial. Vitamin D3 (Vitamidyne D, Fischer Pharmaceuticals, Israel) given by oral drops for 4 weeks before initiation of antiviral treatment and after serum levels had reached > 32 ng/mL in all participants in the treatment group. Registered at ClinicalTrials.gov NCT00804752 Additional information received through personal communication with authors on 8 February 2017. | |
| Risk of bias | ||
| Bias | Authors' judgement | Support for judgement |
| Random sequence generation (selection bias) | Low risk | Sequence generation performed using computer random number generation. |
| Allocation concealment (selection bias) | Low risk | Participant allocations could not have been foreseen in advance of, or during, enrolment. Allocation sequence hidden in sequentially numbered, opaque, and sealed envelopes. |
| Blinding of participants and personnel (performance bias) | High risk | No blinding, and the outcome is likely to have been influenced by lack of blinding. |
| Blinding of outcome assessment (detection bias) | High risk | No blinding of outcome assessment, and the outcome measurement is likely to have been influenced by lack of blinding. |
| Incomplete outcome data (attrition bias) | Low risk | Missing data unlikely to make treatment effects depart from plausible values. |
| Selective reporting (reporting bias) | Low risk | All predefined outcomes reported in full. |
| Other bias | Low risk | Trial appeared to be free of other factors that could put it at risk of bias. |
| Study characteristics | ||
| Methods | Open‐label randomised clinical trial with parallel‐group design (2 groups) | |
| Participants | Number of participants randomised: 115 participants (50% women), aged 31 to 82 years, mean age 64 years, with chronic hepatitis C Inclusion criteria: HCV genotype 1b as determined by the conventional PCR‐based method; IL28B SNP rs8099917 genotype TG or GG (designated as non‐TT); HCV RNA persistently detectable in serum by the real‐time PCR technique; white blood cell count of more than 2000 μL; platelet count of more than 50,000 μL; and haemoglobin levels of more than 9.0 g/dL at the time of enrolment. Patients could participate in the study regardless of whether they had received prior IFN‐based therapy. Patients who had not received PEG IFN/ribavirin combination therapy were considered naive patients. Exclusion criteria: decompensated liver cirrhosis, evidence of other forms of liver disease, presence of malignancy and other serious medical illness, evidence of hypercalcaemia or hyperparathyroidism, positive hepatitis B surface antigen and antibody to HIV type 1, medication with Chinese herbal medicine or other type of vitamin D, past medical history of interstitial pneumonia, pregnancy or possibility of pregnancy, lactating, and past medical history of allergy to biological preparations or antiviral agents | |
| Interventions | Intervention: lead‐in treatment with oral native vitamin D3 (Healthy Natural Products, Florence, KY, USA) at a dose of 2000 IU once daily for 4 weeks, followed by the addition of the vitamin D3 to the 12‐week triple therapy (PEG IFN‐α‐2a (Roche Group‐Chugai, Tokyo, Japan), ribavirin (Chugai), and simeprevir (Janssen, Tokyo, Japan)), followed by 12 weeks of PEG IFN‐α‐2a and ribavirin (n = 57) Control: 12‐week triple therapy (PEG IFN‐α‐2a (Roche Group‐Chugai, Tokyo, Japan), ribavirin (Chugai), and simeprevir (Janssen, Tokyo, Japan)) for 12 weeks, followed by 12 weeks of PEG IFN‐α‐2a and ribavirin (n = 58) PEG IFN‐α‐2a was administered subcutaneously at a dose of 180 μg once weekly. Ribavirin was administered orally twice daily, with doses adjusted according to body weight (600 mg daily for < 60 kg, 800 mg daily for 60 to 80 kg, and 1000 mg daily for > 80 kg). Simeprevir was administered orally once daily at a dose of 100 mg. Because of the low likelihood of achieving an SVR and high likelihood of developing antiviral resistance, treatment was stopped for participants with serum HCV RNA decline from baseline of less than 3 log IU/mL at 4 weeks of treatment, detectable HCV RNA at 12 weeks of treatment, or more than 2 log IU/mL increase in HCV RNA levels from the lowest levels during treatment (defined as viral breakthrough). | |
| Outcomes | Primary outcome: sustainability of undetectable viraemia 24 weeks after the end of treatment | |
| Stated aim of study | To clarify whether native vitamin D3 supplementation could improve SVR rate in PEG‐IFN/ribavirin therapy with simeprevir for people with treatment‐refractory genotype 1b HCV with the IL28B SNP rs8099917 non‐TT | |
| Notes | Study authors did not report any deaths. "No patient complained of vitamin D‐related symptoms or developed signs of a vitamin D‐related adverse reaction". | |
| Risk of bias | ||
| Bias | Authors' judgement | Support for judgement |
| Random sequence generation (selection bias) | Low risk | Used computer‐generated random number table |
| Allocation concealment (selection bias) | Unclear risk | Method used to conceal the allocation not described, so intervention allocations may have been foreseen before, or during, enrolment. |
| Blinding of participants and personnel (performance bias) | High risk | No blinding, and outcome is likely to have been influenced by lack of blinding. |
| Blinding of outcome assessment (detection bias) | High risk | No blinding, and outcome measurement is likely to have been influenced by lack of blinding. |
| Incomplete outcome data (attrition bias) | Unclear risk | Insufficient information to assess whether missing data in combination with method used to handle missing data was likely to induce bias |
| Selective reporting (reporting bias) | Unclear risk | Unclear whether all predefined and clinically relevant and reasonably expected outcomes were reported |
| Other bias | Low risk | Trial appeared to be free of other factors that could put it at risk of bias. |
| Study characteristics | ||
| Methods | Randomised clinical trial with parallel‐group design (2 groups) | |
| Participants | 65 participants (35% women), mean age 59 years, with NAFLD Inclusion criteria: men or women aged 25 to 70 years; diagnosis of type 2 diabetes according to American Diabetes Association 2009 criteria; presence of fatty liver detected by upper US and confirmed by MRI in people with clinical suspicion of NAFLD (increased serum transaminase levels in absence of known hepatic chronic disease, ALT > AST, presence of multiple components of metabolic syndrome); negative tests for hepatitis B surface antigen and antibody to HCV Exclusion criteria: history of alcohol abuse (defined by mean daily consumption of alcohol > 30 g/day in men and > 20 g/day in women), cirrhosis, autoimmune hepatitis and other causes of liver disease (haemochromatosis, Wilson's disease), chronic enteropathies, advanced renal failure, cancer, hyper/hypoparathyroidism, known hypersensitivity to cholecalciferol or any other excipients, hypercalcaemia, hypercalciuria, nephrolithiasis, nephrocalcinosis; ongoing/recent (previous 6 months) supplementation with vitamin D, calcium, multivitamin products; treatment with agents affecting bone and calcium/vitamin D metabolism (anticonvulsants, glucocorticoids, antacids containing aluminium, cholestyramine); ultraviolet radiation exposure; pregnancy and lactation; or severe psychiatric illnesses | |
| Interventions | Intervention: vitamin D3 2000 IU/day (n = 29) Control: placebo (n = 36) For 24 weeks | |
| Outcomes | Primary outcomes: reduction of hepatic fat fraction measured by MRI, changes in serum transaminases, CK18‐M30, N‐terminal procollagen III propeptide levels, and Fatty Liver Index Secondary outcomes: metabolic (fasting glycaemia, glycated haemoglobin, lipids, homeostasis model assessment ‐ insulin resistance, homeostasis model assessment ‐ beta cell function, adipose tissue insulin resistance, body fat distribution) and cardiovascular (ankle‐brachial index, intima‐media thickness, flow‐mediated dilatation) parameters | |
| Stated aim of study | To assess the efficacy and safety of 24‐week oral high‐dose vitamin D supplementation in people with type 2 diabetes and NAFLD | |
| Notes | Registered at www.clinicaltrialsregister.eu (number 2011‐003010‐17). Funded by research grants from the Sapienza University Ateneo Scientific Research (authors MGC and IB) and the Italian Minister of University and Research (authors MGC and MGB). Study authors did not report any deaths. Authors were not contacted, as information on our outcomes of interest was found in the publication: “As per the safety profile, no major adverse events occurred during the study”. | |
| Risk of bias | ||
| Bias | Authors' judgement | Support for judgement |
| Random sequence generation (selection bias) | Low risk | Randomisation performed by statistician using computer‐generated and centrally administered procedure |
| Allocation concealment (selection bias) | Low risk | Participant allocations could not have been foreseen in advance of, or during, enrolment. Used central and independent randomisation unit‐controlled allocation |
| Blinding of participants and personnel (performance bias) | Low risk | Participants, investigators, clinical site staff, laboratory staff, and radiologists were all masked to treatment assignment throughout study. Treatment and placebo provided in identical vials by an experienced independent pharmacist. |
| Blinding of outcome assessment (detection bias) | Low risk | Blinding of outcome assessment ensured, and it is unlikely that blinding could have been broken. |
| Incomplete outcome data (attrition bias) | Unclear risk | Insufficient information to assess whether missing data in combination with method used to handle missing data was likely to introduce bias on the results |
| Selective reporting (reporting bias) | Low risk | Study authors reported all predefined outcomes in full. |
| Other bias | Low risk | Trial appeared to be free of other factors that could put it at risk of bias. |
| Study characteristics | ||
| Methods | Randomised clinical trial with parallel‐group design (2 groups) | |
| Participants | Country: India 60 participants (40% women), mean age 41 years Inclusion criteria: age 18 to 65 years, chronic HCV genotype 1/4, infection with detectable HCV RNA for 6 months, and no previous treatment for hepatitis C Exclusion criteria: advanced cirrhosis (Child‐Pugh B or C), presence of HCC, HIV and hepatitis B co‐infection, autoimmune liver disease, Wilson disease, haemochromatosis, α1‐antitrypsin deficiency, concomitant use of medications known to affect serum vitamin D metabolism, and patients with active intravenous drug addiction | |
| Interventions | Intervention: PEG‐IFN alfa‐2a 180 μg per week, and RBV (1000 mg/day for participants weighing < 75 kg, 1200 mg/day for participants weighing > 75 kg) and vitamin D3 2000 IU/day (n = 28) Control: PEG‐IFN alfa‐2a 180 μg per week, and RBV (1000 mg/day for participants weighing < 75 kg, 1200 mg/day for participants weighing > 75 kg) (n = 32) For 48 weeks | |
| Outcomes | Primary outcomes: rapid, early and sustained viral response | |
| Stated aim of study | To assess the effect of vitamin D supplementation on treatment outcome in patients with genotype 1/4 chronic hepatitis C (CHC) infection | |
| Notes | All participants completed the trial. | |
| Risk of bias | ||
| Bias | Authors' judgement | Support for judgement |
| Random sequence generation (selection bias) | Low risk | Quote: "The computer‐generated block randomization schedule was prepared using random number generator to create a list of random numbers. Stat Trek programme (https://stattrek.com) was used to derive the randomization list." |
| Allocation concealment (selection bias) | Unclear risk | Study authors did not describe the method used to conceal the allocation, so the intervention allocations may have been foreseen before, or during, enrolment. |
| Blinding of participants and personnel (performance bias) | High risk | No blinding, and the outcome is likely to have been influenced by lack of blinding. |
| Blinding of outcome assessment (detection bias) | High risk | No blinding of outcome assessment, and the outcome measurement is likely to have been influenced by lack of blinding. |
| Incomplete outcome data (attrition bias) | Low risk | Missing data were unlikely to make treatment effects depart from plausible values. |
| Selective reporting (reporting bias) | Low risk | The study was registered in Clinical Trials Registry‐India (CTRI/2015/07/005992). |
| Other bias | Unclear risk | Trial may or may not have been free of other factors that could put it at risk of bias, such as competing interest bias. |
| Study characteristics | ||
| Methods | Randomised placebo‐controlled clinical trial with parallel‐group design (2 groups) | |
| Participants | Country: Thailand Number of participants randomised: 60 participants Inclusion criteria: NAFLD patients who have ALT elevation with vitamin D insufficiency Exclusion criteria: none stated | |
| Interventions | Intervention: vitamin D (n = 30) Control: placebo (n = 30) For 20 weeks | |
| Outcomes | Primary outcomes: serum ALT, inflammatory markers, and homeostasis model assessment and Fibroscan Secondary outcomes: none stated | |
| Stated aim of study | To demonstrate the effect of vitamin D replacement on liver enzymes and inflammatory markers in NAFLD patients | |
| Notes | Results were presented as an abstract. We were unable to find the address of the authors to contact them for the missing information. Study authors did not report any deaths. No information provided about adverse events. | |
| Risk of bias | ||
| Bias | Authors' judgement | Support for judgement |
| Random sequence generation (selection bias) | Unclear risk | Study authors did not specify the method of sequence generation. |
| Allocation concealment (selection bias) | Unclear risk | Study authors did not describe the method used to conceal the allocation, so the intervention allocations may have been foreseen before, or during, enrolment. |
| Blinding of participants and personnel (performance bias) | Unclear risk | Insufficient information to permit judgement of 'low risk' or 'high risk' |
| Blinding of outcome assessment (detection bias) | Unclear risk | Insufficient information to permit judgement of 'low risk' or 'high risk' |
| Incomplete outcome data (attrition bias) | Unclear risk | Information was insufficient to assess whether missing data in combination with the method used to handle missing data was likely to induce bias on the results. |
| Selective reporting (reporting bias) | Unclear risk | The protocol was not available. |
| Other bias | Unclear risk | Trial may or may not have been free of other factors that could put it at risk of bias, such as competing interest bias. |
| Study characteristics | ||
| Methods | Randomised double‐blind placebo‐controlled clinical trial with parallel‐group design (3 groups) | |
| Participants | Country: Iran Number of participants randomised: 106 participants (59% women), mean age 45 years Inclusion criteria: men and women aged between 20 and 75 years with presence of hepatic steatosis diagnosed by ultrasound Exclusion criteria: liver cirrhosis, with positive results for hepatitis B virus surface antigen or hepatitis C virus antibody, patients with alcohol consumption (> 10 g/day), patients with autoimmune hepatitis or other causes of chronic liver diseases such as Wilson’s disease and haemochromatosis, known cancer, nephrolithiasis, nephrocalcinosis, chronic renal failure, hypercalcaemia, hypercalciuria, pregnancy, lactation, hypersensitivity to vitamin D3, patients receiving oestrogen, tamoxifen, methotrexate, amiodarone, or tetracycline, and receiving vitamin D and calcium supplementations in previous 6 months | |
| Interventions | Intervention group 1: vitamin D3 (cholecalciferol) 50,000 IU pearl per week (n = 35) Intervention group 2: calcitriol 0.25 mg (1,25 dihydroxycholecalciferol) pearl per day (n = 35) Control: placebo (n = 36) For 12 weeks | |
| Outcomes | Primary outcomes: reduction of serum ALT, AST, GGT from baseline to 12 weeks Secondary outcomes: improvement of metabolic component of participants including fasting plasma glucose, LDL, HDL, triglyceride, and total cholesterol | |
| Stated aim of study | To investigate the role of vitamin D therapy in the amelioration of hepatic steatosis in people with NAFLD | |
| Notes | Study authors did not report any deaths. No information provided about adverse events. | |
| Risk of bias | ||
| Bias | Authors' judgement | Support for judgement |
| Random sequence generation (selection bias) | Low risk | Block randomisation with a block size of 5 was used through a computer‐based procedure. |
| Allocation concealment (selection bias) | Unclear risk | Study authors did not describe the method used to conceal the allocation, so the intervention allocations may have been foreseen before, or during, enrolment. |
| Blinding of participants and personnel (performance bias) | Low risk | Blinding of participants and key study personnel ensured, and it is unlikely that the blinding could have been broken. Quote: "Treatments and placebo were provided in identical packages and were given to the participants by an educated person who was blinded to the drug and patients." |
| Blinding of outcome assessment (detection bias) | Low risk | Blinding of outcome assessment ensured, and it is unlikely that the blinding could have been broken. |
| Incomplete outcome data (attrition bias) | Low risk | Missing data were unlikely to make treatment effects depart from plausible values. |
| Selective reporting (reporting bias) | Unclear risk | The protocol was not available. |
| Other bias | Low risk | Trial appeared to be free of other factors that could put it at risk of bias. |
| Study characteristics | ||
| Methods | Randomised clinical trial with parallel‐group design (2 groups) | |
| Participants | 101 participants (25% women) aged 18 to 60 years, mean age 40 years, with chronic HCV genotype 4 Inclusion criteria: aged 18 to 60 years, chronic HCV infection genotype 4 for > 6 months by detectable serum quantitative HCV‐RNA, naive to treatment, compensated liver disease with the following minimum haematological and biochemical criteria: haemoglobin ≥ 12 g/dL for men and ≥ 11 g/dL for women, WBC > 3500/mm3, granulocyte count > 1500/mm3, platelet count > 75,000/mm3, albumin and thyroid function tests within normal limit, and antinuclear antibody ≤ 1:80. US‐guided liver biopsy within 12 months prior to study entry, using a semiautomatic true‐cut needle (16G) Exclusion criteria: other liver diseases, decompensated liver cirrhosis, hepatocellular carcinoma, liver biopsy contraindication, unsuitable for combined IFN and ribavirin treatment due to persistent haematological abnormalities, receiving medications known to affect vitamin D3 level or metabolism (calcium, vitamin D supplementation, oestrogen, alendronate, isoniazid, thiazide diuretics, long‐term antacids, calcium channel blockers, cholestyramine, anticonvulsants, and orlistat), clinically evident osteomalacia (waddling gait, bone pain, and pathological fractures), renal diseases or parathyroid diseases, and BMI > 35 | |
| Interventions | Intervention: vitamin D3 15,000 IU/week + PEG‐IFN‐α‐2b + ribavirin (n = 50) Control: placebo + PEG‐IFN‐α‐2b + ribavirin (n = 51) PEG‐IFN‐α‐2b (PegIntron, MSD) at 1.5 mg/kg subcutaneous injection once/week. Ribavirin (Rebetol, MSD) dose determined by body weight (< 75 kg 1000 mg/day; ≥ 75 kg 1200 mg/day in 2 separate oral doses after meals morning and night) for 48 weeks. Vitamin D3 given as oral solution with juice once weekly for 48 weeks. | |
| Outcomes | Primary outcome: SVR Secondary outcome: stage of hepatic fibrosis | |
| Stated aim of study | To assess the role of vitamin D supplementation on response to treatment in people with chronic HCV 4 and its possible relation to stage of hepatic fibrosis | |
| Notes | Study authors did not report any deaths. “None of the missed patients had stopped the treatment due to adverse events”. Additional information received through personal communication with authors on 23 January 2017. | |
| Risk of bias | ||
| Bias | Authors' judgement | Support for judgement |
| Random sequence generation (selection bias) | Unclear risk | Method of sequence generation not specified. |
| Allocation concealment (selection bias) | Low risk | Allocation sequence hidden in sequentially numbered, opaque, and sealed envelopes. |
| Blinding of participants and personnel (performance bias) | Low risk | No blinding, but we judged that outcomes were not likely to have been influenced by lack of blinding |
| Blinding of outcome assessment (detection bias) | Low risk | No blinding of outcome assessment, but we judged that outcome measurements were not likely to have been influenced by lack of blinding |
| Incomplete outcome data (attrition bias) | Unclear risk | Insufficient information to assess whether missing data in combination with the method used to handle missing data was likely to induce bias |
| Selective reporting (reporting bias) | Unclear risk | Unclear whether all predefined and clinically relevant and reasonably expected outcomes were reported |
| Other bias | Low risk | Trial appeared to be free of other factors that could put it at risk of bias. |
| Study characteristics | ||
| Methods | Randomised clinical trial with parallel‐group design (2 groups) | |
| Participants | 60 participants (52% women), aged 30 to 70 years, mean age 48.5 years with NAFLD Inclusion criteria: NAFLD confirmed by US and normal range of ALT and AST (< 31 IU/L) Exclusion criteria: acute illnesses, chronic kidney disease, hyperparathyroidism, hypoparathyroidism, chronic heart failure, HCV or HBV, Wilson's syndrome, history of chronic liver diseases or disorders that affect gallbladder and bile ducts, pregnancy, history of taking any drugs affecting levels of ALT (e.g. valproic acid, tamoxifen, 3‐hydroxy‐3‐methylglutaryl‐coenzyme A reductase inhibitors, metformin, angiotensin‐converting enzyme 1 and angiotensin‐converting enzyme‐related 1). Furthermore, participants should not have followed any special diet, and should not take oral vitamin D, calcium, or multivitamin supplements. | |
| Interventions | Intervention: vitamin D3 50,000 IU (n = 30) Control: placebo (n = 30) Weekly for 10 weeks | |
| Outcomes | Primary outcomes: inflammatory markers, liver function, lipid profile, body composition, and liver steatosis Secondary outcomes: none stated | |
| Stated aim of study | To investigate the effect of vitamin D supplementation on inflammation, liver function, and liver steatosis in people with NAFLD | |
| Notes | All participants completed the trial. Clinical trial registered at Iranian Registry of Clinical Trials (IRCT2013060411763N8). Funded by Food Security Research Center and Department of Community Nutrition, School of Nutrition and Food Sciences, Isfahan University of Medical Sciences, Isfahan, Iran | |
| Risk of bias | ||
| Bias | Authors' judgement | Support for judgement |
| Random sequence generation (selection bias) | Low risk | Used computer‐generated random numbers |
| Allocation concealment (selection bias) | Unclear risk | Method used to conceal the allocation not described, so intervention allocations may have been foreseen before, or during, enrolment. |
| Blinding of participants and personnel (performance bias) | Unclear risk | Insufficient information to permit judgement of 'low risk' or 'high risk' |
| Blinding of outcome assessment (detection bias) | Unclear risk | Insufficient information to permit judgement of 'low risk' or 'high risk' |
| Incomplete outcome data (attrition bias) | Low risk | Missing data unlikely to make treatment effects depart from plausible values. |
| Selective reporting (reporting bias) | Low risk | All predefined outcomes reported in full. |
| Other bias | Unclear risk | Trial may or may not have been free of other factors that could put it at risk of bias, such as competing interest bias. |
| Study characteristics | ||
| Methods | Randomised double‐blind placebo‐controlled clinical trial with parallel‐group design (3 groups) | |
| Participants | Country: Switzerland Number of participants randomised: 20 participants, mean age 45 years Inclusion criteria: increased alanine aminotransferase level (1.2‐fold ULN), histological diagnosis of NASH diagnosed according to the SAF score obtained within 18 months preceding entry and decreased 25‐OH vitamin D level (< 30 ng/L). The definition of NASH included non‐excessive alcohol consumption as fewer than 21 standard drinks on average per week in males and fewer than 14 standard drinks on average per week in females. Exclusion criteria: cirrhosis, HCV RNA positivity, HBs antigen positivity, other liver disease including autoimmune hepatitis, hereditary haemochromatosis, alpha‐1‐antitrypsin deficiency, Wilson’s disease, drug‐induced fatty liver disease, serious diseases limiting life expectancy, pregnancy or breastfeeding, intention to become pregnant during the course of the study, or childbearing potential in women who were not using safe contraception | |
| Interventions | Intervention: 2100 IU vitamin D3 (cholecalciferol) (n = 10) Control: placebo (n = 10) Orally daily for 48 weeks | |
| Outcomes | Primary outcomes: change in ALT from baseline to end of treatment Secondary outcomes: absolute reduction of hepatic steatosis by at least 20% or by at least 1 point in NASH, serious adverse events, safety laboratory assessments, physical examination findings and vital signs | |
| Stated aim of study | To investigate the efficacy and safety of 48‐week treatment with vitamin D3 in NASH patients | |
| Notes | Study authors did not report any deaths. 2 serious adverse events were recorded: circular haemorrhoidal prolapse and bronchopneumonia. The study medication (vitamin D3 2100 IU daily) and placebo were produced and provided by Antistress AG, Rapperswil‐Jona, Switzerland. | |
| Risk of bias | ||
| Bias | Authors' judgement | Support for judgement |
| Random sequence generation (selection bias) | Unclear risk | Study authors did not specify the method of sequence generation. |
| Allocation concealment (selection bias) | Low risk | A central and independent randomisation unit controlled the allocation. Quote: "Randomisation (stratified for the presence of diabetes, block size 10, not stratified by center) was performed by the Cantonal Pharmacy Zurich." |
| Blinding of participants and personnel (performance bias) | Unclear risk | Insufficient information to permit judgement of 'low risk' or 'high risk' |
| Blinding of outcome assessment (detection bias) | Unclear risk | Insufficient information to permit judgement of 'low risk' or 'high risk' |
| Incomplete outcome data (attrition bias) | Low risk | Missing data were unlikely to make treatment effects depart from plausible values. |
| Selective reporting (reporting bias) | Low risk | The trial was registered (NCT01571063; KEK‐ZH‐Nr. 2011‐420). |
| Other bias | Unclear risk | Trial may or may not have been free of other factors that could have put it at risk of bias, such as competing interest bias. |
| Study characteristics | ||
| Methods | Randomised clinical trial with parallel‐group design (2 groups) | |
| Participants | Country: Iran Number of participants randomised: 82 women, aged 18 to 50 years, mean age 34 years Inclusion criteria: BMI between 25 and 40 kg/m2 with NAFLD confirmed by single ultrasonographist, vitamin D insufficiency (serum 25‐hydroxyvitamin D < 30 ng/mL), not taking dietary supplements including calcium and vitamin D over the last 6 months Exclusion criteria: renal, hepatic, other endocrine disorders, malignancies, pregnancy and lactation, alcohol consumption, menopause condition, receiving medications influencing vitamin D metabolism or insulin | |
| Interventions | Intervention: vitamin D3 (cholecalciferol) 600,000 IU single intramuscular injection (n = 41) Control: no intervention (n = 41) All participants received pearl of vitamin E 400 IU/day for 1 month. Participants were followed up for 1 month. | |
| Outcomes | Primary outcomes: changes in serum 25‐hydroxyvitamin D, serum adiponectin, HOMA‐IR, liver enzymes, and change in grade of NAFLD Secondary outcomes: change in anthropometric variables | |
| Stated aim of study | To examine the effect of single intramuscular injection of 600,000 IU of cholecalciferol on serum levels of vitamin D, adiponectin, insulin resistance, and liver function status of women with NAFLD | |
| Notes | Study authors did not report any deaths. No information provided about adverse events. | |
| Risk of bias | ||
| Bias | Authors' judgement | Support for judgement |
| Random sequence generation (selection bias) | Low risk | Quote: "The patients were randomly assigned in the random blocks of four subjects using a computer Random Allocation Software, version 1, with stratification by age." |
| Allocation concealment (selection bias) | Unclear risk | Method used to conceal the allocation not described, so intervention allocations may have been foreseen before, or during, enrolment. |
| Blinding of participants and personnel (performance bias) | Unclear risk | Insufficient information to permit judgement of 'low risk' or 'high risk' |
| Blinding of outcome assessment (detection bias) | Unclear risk | Insufficient information to permit judgement of 'low risk' or 'high risk' |
| Incomplete outcome data (attrition bias) | Low risk | Missing data unlikely to make treatment effects depart from plausible values. |
| Selective reporting (reporting bias) | Low risk | The trial was registered in the Iranian Registry of Clinical Trials with code number of IRCT201503163320N10. |
| Other bias | Low risk | Trial appeared to be free of other factors that could put it at risk of bias. |
| Study characteristics | ||
| Methods | Randomised double‐blind placebo‐controlled clinical trial with parallel‐group design (2 groups) | |
| Participants | Country: Pakistan Number of participants randomised: 109 (36% women), mean age 28 years Inclusion criteria: randomised selection based on age, sex, BMI > 28, fatty liver on sonographic findings, moderate increase in hepatic enzymes with altered serum lipid profile Exclusion criteria: pregnant and lactating women, smokers, type 2 diabetes, hypertension, chronic hepatitis B and C infection, alcoholic liver disease, chronic liver disease, decompensated liver disease and hepatocellular carcinoma, any history of cardiac, renal, and thyroid disorders, extremely abnormal ultrasound and liver enzymes that can indicate hereditary and autoimmune diseases of the liver | |
| Interventions | Intervention: vitamin D3 (cholecalciferol) 50,000 IU (n = 54) Control: placebo (n = 55) Orally, weekly for 12 weeks | |
| Outcomes | Primary outcomes: body weight, BMI, insulin resistance, dyslipidaemia, hepatic enzymes, CRP, and adiponectin | |
| Stated aim of study | To investigate the effects of oral vitamin D supplementation on body weight, BMI, insulin resistance, dyslipidaemia, hepatic enzymes, CRP, and adiponectin in NAFLD patients | |
| Notes | Study authors did not report any deaths. No information provided about adverse events. | |
| Risk of bias | ||
| Bias | Authors' judgement | Support for judgement |
| Random sequence generation (selection bias) | Low risk | Quote: "A computed generated number was given to each patients based upon randomization." |
| Allocation concealment (selection bias) | Unclear risk | Method used to conceal the allocation not described, so intervention allocations may have been foreseen before, or during, enrolment. |
| Blinding of participants and personnel (performance bias) | Unclear risk | Insufficient information to permit judgement of 'low risk' or 'high risk' |
| Blinding of outcome assessment (detection bias) | Unclear risk | Insufficient information to permit judgement of 'low risk' or 'high risk' |
| Incomplete outcome data (attrition bias) | Unclear risk | Insufficient information to assess whether missing data in combination with the method used to handle missing data was likely to induce bias |
| Selective reporting (reporting bias) | Unclear risk | The trial was not registered. Unclear whether all predefined and clinically relevant and reasonably expected outcomes were reported |
| Other bias | Low risk | Trial appeared to be free of other factors that could put it at risk of bias. |
| Study characteristics | ||
| Methods | Randomised clinical trial with parallel‐group design (2 groups) | |
| Participants | Country: Republic of Korea Number of participants randomised: 148 (49% women), aged 20 to 75 years, mean age 52 years Inclusion criteria: age 20 to 75 years, positive in hepatitis C virus‐RNA PCR screening, normal serum calcium level before treatment, and HCV genotypes 1, 2, and 3 Exclusion criteria: HCC at enrolment or past history of HCC within last 1 year, decompensated cirrhosis (Child‐Pugh class B or C), absolute neutrophil count < 1000/mm3 or platelet count < 70,000/mm3, serum creatinine level above 1.5 times to upper normal limit, present or past history of severe psychiatric diseases, parathyroid disease, uncontrolled thyroid disease, co‐infection with other hepatitis virus or HIV, history of malignant diseases besides HCC within last 2 years, patients who were considered unfit to perform clinical trial, and pregnancy | |
| Interventions | Intervention: PEG‐IFN‐α‐2a 180 μg weekly plus RBV daily plus vitamin D 800 IU daily (n = 77) Control: PEG‐IFN‐α plus RBV (n = 71) Ribavirin was given orally daily in a dose of 1000 mg (body weight < 75 kg) or 1200 mg (body weight ≥ 75 kg) daily in genotype 1, or 800 mg in genotype 2 and 3. All participants were followed up 24 weeks after the completion of treatment. | |
| Outcomes | Primary outcomes: rate of SVR Secondary outcomes: change in risk factors for SVR | |
| Stated aim of study | To assess the role of vitamin D supplementation in response to PEG‐IFN‐α plus RBV treatment in naive patients with chronic hepatitis C | |
| Notes | Study authors did not report any deaths. “Serious adverse events occurred in 10 patients, but all recovered.” | |
| Risk of bias | ||
| Bias | Authors' judgement | Support for judgement |
| Random sequence generation (selection bias) | Unclear risk | Study authors did not specify the method of sequence generation. |
| Allocation concealment (selection bias) | Unclear risk | Method used to conceal the allocation not described, so intervention allocations may have been foreseen before, or during, enrolment. |
| Blinding of participants and personnel (performance bias) | Unclear risk | Insufficient information to permit judgement of 'low risk' or 'high risk' |
| Blinding of outcome assessment (detection bias) | Unclear risk | Insufficient information to permit judgement of 'low risk' or 'high risk' |
| Incomplete outcome data (attrition bias) | High risk | 24 participants (33.8%) in the control group and 19 participants (24.7%) in the vitamin D group dropped out during the treatment period. |
| Selective reporting (reporting bias) | High risk | The study was registered at ClinicalTrials.gov (NCT01439776). No data about the early and rapid virological response |
| Other bias | Unclear risk | Trial may or may not have been free of other factors that could put it at risk of bias, such as competing interest bias. |
| Study characteristics | ||
| Methods | Randomised clinical trial with parallel‐group design (2 groups) | |
| Participants | Country: India Number of participants randomised: 101 (24% women), aged 18 to 70 years, mean age 45 years Inclusion criteria: decompensated cirrhosis of liver, Child Turcott Pugh (CTP) score ≥ 10, age between 18 years to 70 years Exclusion criteria: septicaemia, infection with HIV, episodes of variceal bleeding within 6 weeks, hepatocellular carcinoma or any malignancy, hepatorenal syndrome at the time of enrolment, significant cardiac and respiratory disease, pregnancy, patients being taken up for transplant, and refusal to participate in the study | |
| Interventions | Intervention: vitamin D (cholecalciferol 300,000 IU) intramuscularly, single dose plus 800 IU and calcium 1000 mg daily (n = 51) Control: no intervention (n = 50) For 6 months | |
| Outcomes | Primary outcomes: all‐cause mortality Secondary outcomes: clinical parameters, vitamin D level | |
| Stated aim of study | To assess vitamin D levels in a cohort of patients with decompensated liver cirrhosis and the effect of vitamin D level replenishment on all‐cause mortality in patients with vitamin D deficient decompensated cirrhosis | |
| Notes | ||
| Risk of bias | ||
| Bias | Authors' judgement | Support for judgement |
| Random sequence generation (selection bias) | Unclear risk | Study authors did not specify the method of sequence generation. |
| Allocation concealment (selection bias) | Unclear risk | Method used to conceal the allocation not described, so intervention allocations may have been foreseen before, or during, enrolment. |
| Blinding of participants and personnel (performance bias) | High risk | No blinding, and the outcome is likely to have been influenced by lack of blinding |
| Blinding of outcome assessment (detection bias) | High risk | No blinding of outcome assessment, and the outcome measurement is likely to have been influenced by lack of blinding |
| Incomplete outcome data (attrition bias) | Low risk | Missing data unlikely to make treatment effects depart from plausible values. |
| Selective reporting (reporting bias) | Unclear risk | The protocol was not available. |
| Other bias | Low risk | Trial appeared to be free of other factors that could put it at risk of bias. |
| Study characteristics | ||
| Methods | Randomised double‐blind, placebo‐controlled clinical trial with parallel‐group design (2 groups) | |
| Participants | Country: Thailand Number of participants randomised: 80 (46% women), aged 18 to 70 years, mean age 52 years Inclusion criteria: patients with CHC Exclusion criteria: none stated | |
| Interventions | Intervention: vitamin D2 (ergocalciferol 60,000 to 100,000 IU (depending on vitamin D status)) (n = 40) Control: placebo (n = 40) Orally, weekly for 6 weeks The dose of vitamin D2 was based on the ranges of vitamin D deficiency, as follows: mild deficiency (20 to ≤ 30 ng/mL) 60,000 IU/week; moderate deficiency (10 to ≤ 20 ng/mL) 80,000 IU/week; and severe deficiency (≤ 10 ng/mL) 100,000 IU/week. Each vitamin D2 capsule contained 20,000 units. The total dosage was divided into 2 separate doses given on Monday and Friday. | |
| Outcomes | Primary outcomes: T‐helper 1/2 cytokines, IP‐10 and DPP‐IV levels Secondary outcomes: vitamin D level | |
| Stated aim of study | To assess the changes in serum levels T‐helper cells associated cytokines, IP‐10 and DPP‐IV, without influences driven by interferon treatment, after a short‐term period for correction of vitamin D deficiency in chronic hepatitis C patients | |
| Notes | All participants completed the trial. The trial was conducted between April 2012 and April 2013. | |
| Risk of bias | ||
| Bias | Authors' judgement | Support for judgement |
| Random sequence generation (selection bias) | Low risk | Quote: "The randomization sequence was stratified with a 1:1 allocation using random block sizes of 4 based on computer generated method based (www.randomisation.com)." |
| Allocation concealment (selection bias) | Low risk | Quote: "The randomization was performed by a research assistant without involvement in clinical trial. Details of the allocated group were given in sequentially numbered, opaque, sealed envelopes. After patient enrollment, the research assistant will open the envelope and inform stratified groups (A or B) to the investigators." |
| Blinding of participants and personnel (performance bias) | Low risk | Quote: "The vitamin D2 (Ergocalciferol) and placebo were prepared by a pharmacist in a capsule form and identical in appearance. They were prepacked in a bottle for six‐week supplement and consecutively numbered for each CHC patient according to the randomised results." |
| Blinding of outcome assessment (detection bias) | Low risk | Blinding of outcome assessment ensured, and it is unlikely that the blinding could have been broken. |
| Incomplete outcome data (attrition bias) | Low risk | Missing data were unlikely to make treatment effects depart from plausible values. All participants completed the trial. |
| Selective reporting (reporting bias) | Low risk | The trial was registered in the Thai Clinical Trials Registry, which was based on World Health Organization criteria under registration number TCTR20160429001. |
| Other bias | Unclear risk | Trial may or may not have been free of other factors that could have put it at risk of bias, such as academic bias. |
| Study characteristics | ||
| Methods | Randomised double‐blind, placebo‐controlled clinical trial with parallel‐group design (2 groups) | |
| Participants | Country: Thailand Number of participants randomised: 58 (38% women), aged 18 to 70 years, mean age 50 years Inclusion criteria: patients with CHC, naive cases or non‐responder cases of CHC without decompensated cirrhosis, and serum 25‐hydroxyvitamin D levels less than 30 ng/mL Exclusion criteria: decompensated cirrhosis, HIV infection, autoimmune diseases, active infections from other pathogens, a history of steroid or immunosuppressive therapy, or a history of interferon treatment within 12 months | |
| Interventions | Intervention: vitamin D2 (ergocalciferol 20,000 IU orally, weekly) (n = 29) Control: placebo (n = 29) For 6 weeks The dose of vitamin D2 was based on the ranges of vitamin D deficiency, as follows: mild deficiency (20 to ≤ 30 ng/mL) 60,000 IU/week; moderate deficiency (10 to ≤ 20 ng/mL) 80,000 IU/week; and severe deficiency (≤ 10 ng/mL) 100,000 IU/week. Each vitamin D2 capsule contained 20,000 units. The total dosage was divided into 2 separate doses given on Monday and Friday. | |
| Outcomes | Primary outcomes: serum fibrotic markers Secondary outcomes: vitamin D level | |
| Stated aim of study | To assess the dynamic changes in serum fibrogenic cytokines/enzymes in CHC patients with vitamin D deficiency after short‐term supplementation with vitamin D | |
| Notes | All participants completed the trial. The trial was conducted between February and December 2014. | |
| Risk of bias | ||
| Bias | Authors' judgement | Support for judgement |
| Random sequence generation (selection bias) | Low risk | Quote: "The enrolled patients were randomized into two groups with a 1:1 allocation using a random block size of 4, which was generated by computer software based on www.randomisation.com." |
| Allocation concealment (selection bias) | Low risk | Quote: "The randomization was performed by a research assistant who was not involved in the clinical trial. Upon enrollment, the patients were stratified into two groups (A and B) with the details of the drugs placed in sealed envelopes." |
| Blinding of participants and personnel (performance bias) | Low risk | Quote: "Vitamin D2 and a placebo were prepared in identical capsules of the same weight by the Department of Pharmacy at King Chulalongkorn Memorial Hospital. All investigators and patients were blinded to the type of medication used until the end of the study." |
| Blinding of outcome assessment (detection bias) | Low risk | Blinding of outcome assessment ensured, and it is unlikely that the blinding could have been broken. |
| Incomplete outcome data (attrition bias) | Low risk | Missing data were unlikely to make treatment effects depart from plausible values. |
| Selective reporting (reporting bias) | Low risk | The clinical trial was retrospectively registered with the Thai Clinical Trials Registry, based on World Health Organization criteria on 2 November 2016 (TCTR20161103003). |
| Other bias | Unclear risk | Trial may or may not have been free of other factors that could have put it at risk of bias, such as academic bias. |
| Study characteristics | ||
| Methods | Randomised clinical trial with parallel‐group design (3 groups) | |
| Participants | 120 participants (38% women), aged 18 to 65 years, mean age 41 years, with NAFLD Inclusion criteria: BMI 25 kg/m2 to 35 kg/m2, serum 25‐hydroxyvitamin D3 level < 15 ng/mL, reporting a daily calcium intake 700 mg/day to 800 mg/day, and willingness to introduce a dietary change to lose weight Exclusion criteria: calcium intake < 700 mg/day or > 800 mg/day (in diet or as a supplement); drugs for blood glucose or lipid control; pregnancy or having given birth in the past year or planning a pregnancy in the next 6 months; lactation; weight loss ≥ 10% of body weight within the 6 months before enrolment; participation in competitive sport; abnormal thyroid hormone concentration; intake of medications that could affect body weight or energy expenditure (or both); allergy; smoking; diagnosis of chronic diseases including inflammatory diseases; heart, liver, and renal failure; cancer; acute myocardial infarction; diabetes; stroke; or serious injuries and any other conditions that were not suitable for the trial as evaluated by the physician | |
| Interventions | Intervention 1: vitamin D 25 μg/day as cholecalciferol (Jalinus Arya Co, Iran) + calcium carbonate placebo (25 mg/day as lactose; Jalinus Arya Co, Iran) (n = 40) Intervention 2: vitamin D 25 μg/day as cholecalciferol (Jalinus Arya Co, Iran) + calcium (500 mg/day as calcium carbonate; Jalinus Arya Co, Iran) (n = 40) Control: placebo of calcitriol + placebo of calcium (25 mg/day as lactose; Jalinus Arya Co, Iran) (n = 40) After lunch with a glass of water for 12 weeks | |
| Outcomes | Primary outcomes: weight loss, body fat, fasting plasma glucose, serum insulin concentrations, lipid profiles, and liver function tests Secondary outcomes: carbohydrate and lipid metabolism | |
| Stated aim of study | To compare the effect of vitamin D supplementation with and without calcium on anthropometric measures and biochemical parameters in people with NAFLD during a weight‐loss programme | |
| Notes | Study authors did not report any deaths. No information provided about adverse events. Clinical trial registered at Iranian Registry of Clinical Trials (IRCT201408312709N29). Trial did not receive any specific grant from funding agencies in the public, commercial, or not‐for‐profit sectors. Additional information received through personal communication with authors on 20 January 2017. | |
| Risk of bias | ||
| Bias | Authors' judgement | Support for judgement |
| Random sequence generation (selection bias) | Low risk | Participants randomly assigned using computer‐generated random‐numbers method by project co‐ordinator. |
| Allocation concealment (selection bias) | Low risk | Participant allocations could not have been foreseen in advance of, or during, enrolment. Allocation controlled by a central and independent randomisation unit. |
| Blinding of participants and personnel (performance bias) | Low risk | Products administered by blinded research assistant to blinded participants. Shape, colour, and packaging of placebo similar to supplements in the intervention group. |
| Blinding of outcome assessment (detection bias) | Unclear risk | Insufficient information to permit judgement of 'low risk' or 'high risk' |
| Incomplete outcome data (attrition bias) | Low risk | Missing data were unlikely to make treatment effects depart from plausible values. |
| Selective reporting (reporting bias) | Low risk | All predefined outcomes reported in full. |
| Other bias | Unclear risk | Trial may or may not have been free of other factors that could put it at risk of bias, such as competing interest bias. |
| Study characteristics | ||
| Methods | Randomised clinical trial with parallel‐group design (3 groups) | |
| Participants | 18 men, aged 32 to 61 years, mean age 52 years, with alcoholic cirrhosis Inclusion criteria: men with advanced biopsy‐confirmed alcoholic cirrhosis with low levels of serum 25‐hydroxyvitamin D (< 20 ng/mL) and decreased bone density (i.e. > 1.5 standard deviations below mean of healthy Baltimore men of same ages) Exclusion criteria: history of corticosteroid, anticonvulsant, or vitamin D intake; renal disease | |
| Interventions | Intervention 1: vitamin D2 50,000 IU 2 or 3 times weekly (n = 6) Intervention 2: 25‐hydroxyvitamin D3 800 IU/day to 2000 IU/day (prepared and supplied as identical soft elastic capsules (20 or 50 μg) by Upjohn Co) (n = 6) Control: no intervention (n = 6) For 1 year | |
| Outcomes | Outcomes reported in abstract of publication Primary outcomes: bone mineral density Secondary outcomes: none stated | |
| Stated aim of study | To compare the efficacy of 25‐hydroxyvitamin D3 or vitamin D2 in correcting the bone disease of people with alcoholic cirrhosis | |
| Notes | This study was supported by grants from Upjohn Co and the Veterans Administration. | |
| Risk of bias | ||
| Bias | Authors' judgement | Support for judgement |
| Random sequence generation (selection bias) | Unclear risk | The method of sequence generation was not specified. |
| Allocation concealment (selection bias) | Unclear risk | The method used to conceal the allocation was not described, so that intervention allocations may have been foreseen in advance of, or during, enrolment. |
| Blinding of participants and personnel (performance bias) | High risk | No blinding, and the outcome is likely to have been influenced by lack of blinding |
| Blinding of outcome assessment (detection bias) | High risk | No blinding of outcome assessment, and the outcome measurement is likely to have been influenced by lack of blinding |
| Incomplete outcome data (attrition bias) | Low risk | Missing data were unlikely to make treatment effects depart from plausible values. |
| Selective reporting (reporting bias) | Low risk | All clinically relevant and reasonably expected outcomes were reported. |
| Other bias | Low risk | Trial appeared to be free of other factors that could put it at risk of bias. |
| Study characteristics | ||
| Methods | Randomised clinical trial with parallel‐group design (2 groups) | |
| Participants | 50 participants (58% women), mean age 47 years, with chronic HCV genotype 2 or 3 Inclusion criteria: aged 18 to 65 years; chronic genotype 2 or 3 HCV infection; no previous treatment for HCV; seronegative for HBV, hepatitis A virus, and HIV infection; absolute neutrophil count > 1500/mm3; platelet count > 90,000/mm3; and normal haemoglobin level. Liver biopsies not required prior to study entrance. Exclusion criteria: decompensated liver disease (cirrhosis with Child‐Pugh score > 9), another cause of clinically significant liver disease, or presence of hepatocellular carcinoma | |
| Interventions | Intervention: PEG‐IFN‐α‐2a 180 μg weekly + oral ribavirin 800 mg/day + oral vitamin D3 2000 IU/day (Vitamidyne D, Fischer Pharmaceuticals, Israel), given by oral drops (n = 20) Control: PEG‐IFN‐α‐2a 180 μg weekly + oral ribavirin 800 mg/day (n = 30) For 24 weeks | |
| Outcomes | Outcomes reported in abstract of publication Primary outcome: SVR defined as undetectable HCV‐RNA at 24 weeks' post‐treatment Secondary outcomes: treatment efficacy at weeks 4 (RVR) and 12 (EVR) during therapy, and 24 weeks after cessation of therapy (SVR) | |
| Stated aim of study | To assess prospectively the influence of vitamin D supplementation on SVR in the treatment of people with chronic HCV with HCV genotype 2‐3 | |
| Notes | All participants completed the trial. Additional information received through personal communication with authors on 8 February 2017. | |
| Risk of bias | ||
| Bias | Authors' judgement | Support for judgement |
| Random sequence generation (selection bias) | Low risk | Sequence generation performed using computer random number generation. |
| Allocation concealment (selection bias) | Low risk | Participant allocations could not have been foreseen in advance of, or during, enrolment. Allocation sequence hidden in sequentially numbered, opaque, and sealed envelopes. |
| Blinding of participants and personnel (performance bias) | High risk | No blinding, and outcomes are likely to have been influenced by lack of blinding |
| Blinding of outcome assessment (detection bias) | High risk | No blinding, and outcome measurements are likely to have been influenced by lack of blinding |
| Incomplete outcome data (attrition bias) | Low risk | Missing data were unlikely to make treatment effects depart from plausible values. |
| Selective reporting (reporting bias) | Unclear risk | Unclear whether all predefined and clinically relevant and reasonably expected outcomes were reported |
| Other bias | Low risk | Trial appeared to be free of other factors that could put it at risk of bias. |
| Study characteristics | ||
| Methods | Randomised clinical trial with parallel‐group design (2 groups) | |
| Participants | 36 participants (25% women), aged 18 to 75 years, mean age 61 years, with liver cirrhosis Inclusion criteria: compensated cirrhosis, 25‐hydroxyvitamin D < 30 ng/mL, aged 18 to 75 years, and a negative pregnancy test in women of childbearing potential Exclusion criteria: presence of hepatocellular carcinoma, hypercalcaemia (plasma calcium concentrations > 2.65 mmol/L), pregnant or lactating women, drug intake as part of another clinical study, estimated glomerular filtration rate according to Modification of Diet in Renal Disease formula < 15 mL/min/1.73 m2, any clinically significant acute disease requiring drug treatment, regular intake (in addition to study medication) of vitamin D > 800 IU daily during the last 4 weeks before study entry | |
| Interventions | Intervention: vitamin D3 2800 IU/day (Oleovit D3, Fresenius Kabi, Austria) (n = 18) Control: placebo daily (n = 18) For 8 weeks | |
| Outcomes | Primary outcome: vitamin D status Secondary outcomes: liver function tests (i.e. AST, ALT, gamma glutamyl transpeptidase, and alkaline phosphatase), albumin, international normalised ratio, bilirubin, and hyaluronic acid; and parameters of mineral metabolism (i.e. parathyroid hormone, total plasma calcium, free plasma calcium, urinary midstream calcium to creatinine ratio, and plasma phosphate) | |
| Stated aim of study | To evaluate the effects of vitamin D supplementation on 25‐hydroxyvitamin D, parameters of liver function and synthesis, and hyaluronic acid as a marker of liver fibrosis | |
| Notes | “No patient died during the study and there was no excess of adverse events in the vitamin D group.” Study sponsored by the Medical University of Graz, Austria. | |
| Risk of bias | ||
| Bias | Authors' judgement | Support for judgement |
| Random sequence generation (selection bias) | Low risk | Sequence generation performed using computer random number generation. |
| Allocation concealment (selection bias) | Low risk | Participant allocations could not have been foreseen in advance of, or during, enrolment. Central and independent randomisation unit controlled allocation. Investigators were unaware of allocation sequence. |
| Blinding of participants and personnel (performance bias) | Low risk | Blinding of participants and key study personnel ensured, and it is unlikely that blinding could have been broken. |
| Blinding of outcome assessment (detection bias) | Low risk | Blinding of outcome assessment ensured, and it is unlikely that blinding could have been broken. |
| Incomplete outcome data (attrition bias) | Low risk | Missing data were unlikely to make treatment effects depart from plausible values. |
| Selective reporting (reporting bias) | Low risk | All predefined outcomes reported. |
| Other bias | Unclear risk | Trial may or may not have been free of other factors that could put it at risk of bias, such as small‐trial bias. |
| Study characteristics | ||
| Methods | Randomised clinical trial with parallel‐group design (2 groups) | |
| Participants | Country: India 81 participants (32% women), aged > 12 years, mean age 38 years with NAFLD Inclusion criteria: patients with NAFLD aged > 12 years, non‐alcoholic individuals defined as either total abstainers or individuals who consumed less than 20 g of alcohol per day, ultrasound showing features of steatosis, with or without raised ALT (> 40 IU/L), and negative viral markers (hepatitis B surface antigen and anti‐hepatitis C virus), patients with raised ALT who had negative autoimmune markers (antinuclear antibody, anti‐smooth muscle antibody, anti‐liver kidney microsomal antibody, and antimitochondrial antibody) and normal ceruloplasmin/negative Kayser–Fleischer ring with normal iron workup (serum iron, total iron‐binding capacity, ferritin, and transferrin saturation) Exclusion criteria: pregnant females, patients with a history of drug intake likely to cause NAFLD, patients with jejunoileal bypass or extensive small bowel resection or total parenteral nutrition at the time of liver biopsy, and those with clinical, laboratory, and imaging features of cirrhosis of liver and patients with renal, hepatic, respiratory, or congestive cardiac failure | |
| Interventions | Intervention: vitamin D single intramuscular injection 600,000 IU with lifestyle modifications (n = 51) Control: lifestyle modifications (n = 30) Participants were treated and followed up for 6 months. Lifestyle modifications in both groups included moderate‐to‐vigorous exercise in the form of brisk walking, jogging, swimming, cycling, etc. for 45 to 60 min at least 5 days per week in all participants, and calorie reduction (1000 to 1200 kcal/day for overweight women and 1200 to 1600 kcal/day for overweight men and heavier or more active women) in overweight and obese subjects. | |
| Outcomes | Primary outcomes: insulin resistance and serum ALT Secondary outcomes: serum levels of adiponectin and tumour necrosis factor‐α | |
| Stated aim of study | To evaluate the effect of vitamin D supplementation in patients with NAFLD | |
| Notes | All participants completed the trial. | |
| Risk of bias | ||
| Bias | Authors' judgement | Support for judgement |
| Random sequence generation (selection bias) | Unclear risk | The method of sequence generation was not specified. |
| Allocation concealment (selection bias) | Unclear risk | The method used to conceal the allocation was not described, so that intervention allocations may have been foreseen in advance of, or during, enrolment. |
| Blinding of participants and personnel (performance bias) | High risk | No blinding, and the outcome is likely to have been influenced by lack of blinding |
| Blinding of outcome assessment (detection bias) | High risk | No blinding of outcome assessment, and the outcome measurement is likely to have been influenced by lack of blinding |
| Incomplete outcome data (attrition bias) | Unclear risk | Missing data were unlikely to make treatment effects depart from plausible values. |
| Selective reporting (reporting bias) | Unclear risk | Trial protocol was not available. |
| Other bias | Unclear risk | Trial may or may not have been free of other factors that could have put it at risk of bias, such as competing interest bias. |
| Study characteristics | ||
| Methods | Randomised clinical trial with parallel‐group design (2 groups) | |
| Participants | 60 (51% women), aged 18 to 70 years, mean age 42 years, with NAFLD Inclusion criteria: diagnosis of NAFLD by US and increased serum levels of ALT (> 19 units/L for women and 30 units/L for men) Exclusion criteria: alcohol consumption > 20 g/day; pregnant and lactating women; hereditary haemochromatosis; Wilson's disease; α1‐antitrypsin deficiency; history of jejunoileal bypass surgery or gastroplasty; using total parenteral nutrition in the past 6 months; taking hepatotoxic drugs such as calcium channel blocker, high doses of synthetic oestrogens, methotrexate, amiodarone, and chloroquine; history of hypothyroidism, Cushing's syndrome, renal failure, and kidney stones; serum calcium levels > 10.6 mg/dL; and intake of vitamin D, vitamin E, and calcium supplements during the last 6 months | |
| Interventions | Intervention: vitamin D3 50,000 IU (D‐Vitin Zahravi Pharm Co, Tabriz, Iran) (n = 30) Control: placebo (Zahravi Pharm Co) (n = 30) Every 14 days for 4 months | |
| Outcomes | Primary outcomes: changes in serum ALT and changes in insulin resistance index Secondary outcomes: other liver enzymes, oxidative stress, and inflammatory biomarkers | |
| Stated aim of study | To determine the effect of vitamin D supplementation on serum liver enzymes, insulin resistance, oxidative stress, and inflammatory biomarkers in people with NAFLD | |
| Notes | Study authors did not report any deaths. “Participants did not report any adverse or side effects such as hypercalcemia.” Study financially supported by grant (No. RDC‐9105) from Vice‐Chancellor for Research Affairs of Jundishapur University of Medical Sciences and approved by the Research Institute for Infectious Diseases of the Digestive System, Jundishapur University of Medical Sciences, Ahvaz, Iran. | |
| Risk of bias | ||
| Bias | Authors' judgement | Support for judgement |
| Random sequence generation (selection bias) | Low risk | The study authors performed sequence generation using computer random number generation. |
| Allocation concealment (selection bias) | Low risk | An investigator with no clinical involvement in the trial packed the supplements and placebos in numbered bottles based on the random list. Another person, who was not involved in the trial and not aware of random sequences, assigned the participants to the numbered bottles of pearls. |
| Blinding of participants and personnel (performance bias) | Low risk | Blinding of participants and key study personnel ensured, and it is unlikely that the blinding could have been broken. |
| Blinding of outcome assessment (detection bias) | Low risk | Blinding of outcome assessment ensured, and it is unlikely that the blinding could have been broken. |
| Incomplete outcome data (attrition bias) | Low risk | Missing data were unlikely to make treatment effects depart from plausible values. |
| Selective reporting (reporting bias) | Unclear risk | It was unclear whether all predefined and clinically relevant and reasonably expected outcomes were reported. |
| Other bias | Low risk | Trial appeared to be free of other factors that could put it at risk of bias. |
| Study characteristics | ||
| Methods | Randomised clinical trial with parallel‐group design (2 groups) | |
| Participants | 76 participants (66% women), aged 38 to 84 years, mean age 61 years, with cirrhosis and an underlying infection of liver (HBV and HCV) Inclusion criteria: liver cirrhosis and an underlying infection of the liver (HBV and HCV) Exclusion criteria: none stated | |
| Interventions | Intervention: calcitriol 0.5 μg twice daily (n = 38) Control: no intervention (n = 38) For 1 year | |
| Outcomes | Outcomes reported in abstract of publication Primary outcome: bone mineral density of the lumbar vertebrae Secondary outcomes: none stated | |
| Stated aim of study | To evaluate the efficacy of calcitriol (1,25‐dihydroxyvitamin D) in the treatment of bone disease associated with cirrhosis and an underlying hepatitis viral infection | |
| Notes | All participants completed the trial. Additional information received through personal communication with the authors on 12 February 2014. | |
| Risk of bias | ||
| Bias | Authors' judgement | Support for judgement |
| Random sequence generation (selection bias) | Unclear risk | Method of sequence generation not specified. |
| Allocation concealment (selection bias) | Low risk | Allocation sequence hidden in sequentially numbered, opaque, and sealed envelopes. |
| Blinding of participants and personnel (performance bias) | High risk | No blinding, and outcome is likely to have been influenced by lack of blinding |
| Blinding of outcome assessment (detection bias) | High risk | No blinding of outcome assessment, and outcome measurement is likely to have been influenced by lack of blinding |
| Incomplete outcome data (attrition bias) | Low risk | Missing data were unlikely to make treatment effects depart from plausible values. |
| Selective reporting (reporting bias) | High risk | Not all predefined outcomes were reported in full. |
| Other bias | Unclear risk | Trial may or may not have been free of other components that could put it at risk of bias, such as competing interest bias. |
| Study characteristics | ||
| Methods | Randomised clinical trial with parallel‐group design (2 groups) | |
| Participants | 34 women, aged 36 to 72 years, mean age 56 years, with primary biliary cirrhosis Inclusion criteria: primary biliary cirrhosis Exclusion criteria: none stated | |
| Interventions | Intervention: calcitriol 0.5 μg twice a day (n = 17) Control: no intervention (n = 17) For 1 year | |
| Outcomes | Outcomes reported in abstract of publication Primary outcome: bone mineral density Secondary outcomes: none stated | |
| Stated aim of study | To evaluate the efficacy of calcitriol (1,25‐dihydroxyvitamin D) in the treatment of bone disease associated with primary biliary cirrhosis | |
| Notes | All participants completed the trial. Additional information received through personal communication with authors on 12 February 2014. | |
| Risk of bias | ||
| Bias | Authors' judgement | Support for judgement |
| Random sequence generation (selection bias) | Unclear risk | Method of sequence generation not specified. |
| Allocation concealment (selection bias) | Unclear risk | Method used to conceal allocation not described, so that intervention allocations may have been foreseen in advance of, or during, enrolment. |
| Blinding of participants and personnel (performance bias) | High risk | No blinding, and outcome is likely to have been influenced by lack of blinding |
| Blinding of outcome assessment (detection bias) | High risk | No blinding of outcome assessment, and outcome measurement is likely to have been influenced by lack of blinding |
| Incomplete outcome data (attrition bias) | Low risk | Missing data were unlikely to make treatment effects depart from plausible values. |
| Selective reporting (reporting bias) | High risk | Not all predefined outcomes reported in full. |
| Other bias | Unclear risk | Trial may or may not have been free of other components that could put it at risk of bias, such as competing interest bias. |
| Study characteristics | ||
| Methods | Randomised clinical trial with parallel‐group design (2 groups) | |
| Participants | 40 participants (50% women), aged between 30 to 70 years, mean age 42 years with NAFLD Inclusion criteria: age above 18 years, increased levels of alanine aminotransferase level (more than 30 in women and 40 in men), a diagnosis of NAFLD and ruling out other causes of increased liver enzymes, and vitamin D level less than 30 ng/mL Exclusion criteria: the presence of liver cirrhosis, pregnancy and lactation, alcohol consumption, drug abuse, administration of vitamins in the last 6 months and during the study, weight loss more than 5% over a year before entering the study, diabetes mellitus, weight‐lowering medications, hypercalcaemia, chronic kidney disease, end‐stage heart and lung disease, history of hyperlipidaemia which required treatment, history of medical therapies with impact on liver enzymes such as acetaminophen, statins, azathioprine, antibiotics such as sulfonamide and penicillin, amiodarone, methotrexate, anticonvulsants, isoniazid, steroids, and herbal medicines | |
| Interventions | Intervention: vitamin D3 50,000 IU weekly plus lifestyle modification (n = 20) Control: lifestyle modification (n = 20) For 12 weeks. Participants were followed up for 6 months. | |
| Outcomes | Primary outcomes: biochemical indices (ALT, AST, alkaline phosphatase, fasting blood sugar, triglycerides, cholesterol, LDL, creatinine, calcium, vitamin D) and level of liver steatosis on the basis of CAP score and fibrosis Secondary outcomes: none stated | |
| Stated aim of study | "Investigating the effects of vitamin D on NAFLD." | |
| Notes | All participants completed the trial. | |
| Risk of bias | ||
| Bias | Authors' judgement | Support for judgement |
| Random sequence generation (selection bias) | Low risk | Quote: "Random allocation of the patients in each group was performed using a random number table." |
| Allocation concealment (selection bias) | Unclear risk | Method used to conceal allocation not described, so that intervention allocations may have been foreseen in advance of, or during, enrolment. |
| Blinding of participants and personnel (performance bias) | Unclear risk | Quote: "Subjects and all study staffs were blinded to treatment group assignments." |
| Blinding of outcome assessment (detection bias) | Unclear risk | Insufficient information to permit judgement of 'low risk' or 'high risk' |
| Incomplete outcome data (attrition bias) | Low risk | Missing data unlikely to make treatment effects depart from plausible values. |
| Selective reporting (reporting bias) | Low risk | The research was also registered in Iranian Registry of Clinical Trials (2015102624725n1). |
| Other bias | Unclear risk | Trial may or may not have been free of other components that could put it at risk of bias, such as competing interest bias. |
| Study characteristics | ||
| Methods | Randomised clinical trial with parallel‐group design (2 groups) | |
| Participants | 68 participants (13% women), mean age 42 years, with chronic HCV genotype 1, 2, 3, 4 Inclusion criteria: adult patients with chronic HCV infection (> 6 months) and detectable serum levels of HCV RNA (genotype 1, 2, 3, or 4) with compensated liver disease fulfilling the following criteria: absolute neutrophil count above 1500/mm3, platelet count above 90,000/mm3, and normal haemoglobin level Exclusion criteria: co‐infection with hepatitis B virus or HIV, decompensated liver disease (Child‐Pugh classification B or C), autoimmune or metabolic liver disease, hepatocellular carcinoma, a history of anti‐HCV therapy or use of medications which alter vitamin D3 levels or metabolism (calcium, vitamin D supplementation, oestrogen, alendronate, isoniazid, anticonvulsants, and orlistat), a history of diarrhoea or malabsorption syndromes such as coeliac and chronic pancreatitis, or those with renal or parathyroid diseases | |
| Interventions | Intervention: PEG‐IFN‐α‐2a (180 μg) + oral ribavirin (Rebetol, MSD), at dosage determined based on participant’s weight and genotype, was administered for 48 weeks in participants with genotypes 1 and 4 and for 24 weeks in those with genotypes 2 and 3, and vitamin D3 1600 IU/day (n = 34) Control: PEG‐IFN‐α‐2a (180 μg) + oral ribavirin (Rebetol, MSD), at dosage determined based on participant’s weight and genotype PEG‐IFN‐α‐2a was administered for 48 weeks in participants with genotypes 1 and 4 and for 24 weeks in those with genotypes 2 and 3 (n = 34). Vitamin D3 was administered for 12 weeks. | |
| Outcomes | Primary outcome: EVR defined as undetectable HCV‐RNA at 12 weeks' post‐treatment | |
| Stated aim of study | To assess the influence of vitamin D supplementation on viral response to PEG‐IFN/RBV therapy | |
| Notes | The research council of Mashhad University of Medical Sciences, Mashhad, Iran financially supported this study. | |
| Risk of bias | ||
| Bias | Authors' judgement | Support for judgement |
| Random sequence generation (selection bias) | Unclear risk | Method of sequence generation not specified. |
| Allocation concealment (selection bias) | Low risk | Participant allocations could not have been foreseen in advance of, or during, enrolment. Allocation sequence hidden in sequentially numbered, opaque, and sealed envelopes. |
| Blinding of participants and personnel (performance bias) | High risk | No blinding, and the outcome is likely to have been influenced by lack of blinding |
| Blinding of outcome assessment (detection bias) | High risk | No blinding of outcome assessment, and the outcome measurement is likely to have been influenced by lack of blinding |
| Incomplete outcome data (attrition bias) | Low risk | Missing data unlikely to make treatment effects depart from plausible values. |
| Selective reporting (reporting bias) | Low risk | Registered under Iranian Registry of Clinical Trials Identifier no. IRCT201408312709N29. All predefined outcomes reported in full. |
| Other bias | Unclear risk | Trial may or may not have been free of other components that could put it at risk of bias, such as competing interest bias. |
| Study characteristics | ||
| Methods | Randomised clinical trial with parallel‐group design (3 groups) | |
| Participants | 75 participants (17% women), aged 28 to 65 years, mean age 48 years, undergoing liver transplantation Inclusion criteria: primary liver transplant recipients Exclusion criteria: history of corticosteroid, anticonvulsant, or vitamin D intake; renal disease | |
| Interventions | Intervention 1: calcitriol 0.25 μg/day + calcium gluconate (n = 25) Intervention 2: calcium gluconate (n = 25) Control: placebo (n = 25) For 1 month | |
| Outcomes | Outcomes reported in abstract of publication Primary outcomes: acute cellular rejection rate at 1 month post‐transplant Secondary outcomes: none stated | |
| Stated aim of study | To investigate the effects of calcitriol on acute cellular rejection rate of liver transplant recipients | |
| Notes | All participants completed the trial. Study sponsored by grants from Shanghai Nature Science Fund project and Science and Technology Department of Shanghai. Additional information received through personal communication with the authors on 13 February 2014. | |
| Risk of bias | ||
| Bias | Authors' judgement | Support for judgement |
| Random sequence generation (selection bias) | Unclear risk | Method of sequence generation not specified. |
| Allocation concealment (selection bias) | Unclear risk | Method used to conceal allocation not described, so that intervention allocations may have been foreseen in advance of, or during, enrolment. |
| Blinding of participants and personnel (performance bias) | Unclear risk | Insufficient information to permit judgement of 'low risk' or 'high risk' |
| Blinding of outcome assessment (detection bias) | Unclear risk | Insufficient information to permit judgement of 'low risk' or 'high risk' |
| Incomplete outcome data (attrition bias) | Low risk | Missing data unlikely to make treatment effects depart from plausible values. |
| Selective reporting (reporting bias) | Unclear risk | Unclear whether all predefined and clinically relevant and reasonably expected outcomes were reported |
| Other bias | Low risk | Trial appeared to be free of other factors that could put it at risk of bias. |
| Study characteristics | ||
| Methods | Randomised clinical trial with parallel‐group design (2 groups) | |
| Participants | 84 participants (49% women), aged 30 to 78 years, mean age 59 years, with HCV genotype 1b Inclusion criteria: aged ≥ 20 years, chronically infected with HCV genotype 1 and plasma HCV RNA concentrations ≥ 100 log IU/mL Exclusion criteria: decompensated cirrhosis, liver cancer, HBV or HIV infection, renal insufficiency, history of heart disease or cerebral infarction, pregnancy or breastfeeding | |
| Interventions | Intervention: subcutaneous injections of PEG‐IFN‐α‐2b (1.5 μg/kg body weight) once weekly, along with weight‐based oral ribavirin (600 mg/day to 1200 mg/day) + vitamin D3 1000 IU (n = 42) Control: subcutaneous injections of PEG‐IFN‐α‐2b (1.5 μg/kg body weight) once weekly, along with weight‐based oral ribavirin (600 mg/day to 1200 mg/day) (n = 42) For 16 weeks | |
| Outcomes | Primary outcome: undetectable HCV RNA at week 24 Secondary outcomes: none stated | |
| Stated aim of study | To rigorously evaluate the antiviral effects of vitamin D supplementation in people with HCV genotype‐1 infection being treated with PEG‐IFN + ribavirin | |
| Notes | No serious side effects were observed. | |
| Risk of bias | ||
| Bias | Authors' judgement | Support for judgement |
| Random sequence generation (selection bias) | Unclear risk | Method of sequence generation not specified. |
| Allocation concealment (selection bias) | Unclear risk | Method used to conceal the allocation not described, so intervention allocations may have been foreseen before, or during, enrolment. |
| Blinding of participants and personnel (performance bias) | High risk | No blinding, and outcome is likely to have been influenced by lack of blinding |
| Blinding of outcome assessment (detection bias) | High risk | No blinding of outcome assessment, and outcome measurement is likely to have been influenced by lack of blinding |
| Incomplete outcome data (attrition bias) | Low risk | Missing data were unlikely to make treatment effects depart from plausible values. |
| Selective reporting (reporting bias) | Unclear risk | Unclear whether all predefined and clinically relevant and reasonably expected outcomes were reported |
| Other bias | Low risk | Trial appeared to be free of other factors that could put it at risk of bias. |
ALT: alanine aminotransferase
AST: aspartate aminotransferase
BMI: body mass index
CAP: controlled attenuation parameter
CHC: chronic hepatitis C
CRP: C‐reactive protein
DPP‐IV: dipeptidyl peptidase IV
EVR: early virological response
GGT: gamma‐glutamyl transferase
HBs: hepatitis B surface
HBV: hepatitis B virus
HCC: hepatocellular carcinoma
HCV: hepatitis C virus
HDL: high‐density lipoprotein
HDV: hepatitis D virus
HOMA‐IR: homeostatic model assessment for insulin resistance
IFN: interferon
IP‐10: interferon gamma‐induced protein 10
IU: international unit
kcal: kilocalorie
LDL: low‐density lipoprotein
MRI: magnetic resonance imaging
n: number of participants
NAFLD: non‐alcoholic fatty liver disease
NASH: non‐alcoholic steatohepatitis
PCR: polymerase chain reaction
PEG: pegylated
RBV: ribavirin
RNA: ribonucleic acid
RVR: rapid viral response
SAF: steatosis‐activity‐fibrosis
SVR: sustained virological response
ULN: upper limit of normal
US: ultrasound
VD: vitamin D
WBC: white blood cell count
Characteristics of excluded studies [ordered by study ID]
| Study | Reason for exclusion |
| Not a randomised trial | |
| Not a randomised trial | |
| Not a randomised trial | |
| Not a randomised trial | |
| Not a randomised trial | |
| Not a randomised trial | |
| Not a randomised trial | |
| Did not fulfil inclusion criteria. This trial included antituberculosis therapy‑induced liver disorders amongst naive patients with pulmonary tuberculosis. | |
| Not a randomised trial | |
| Not a randomised trial | |
| Not a randomised trial | |
| Not a randomised trial | |
| Not a randomised trial | |
| Did not fulfil inclusion criteria. This trial included overweight or obese adults without chronic liver diseases. | |
| Not a randomised trial | |
| Not a randomised trial | |
| Not a randomised trial | |
| Not a randomised trial | |
| Not a randomised trial | |
| Did not fulfil inclusion criteria. This trial included adolescent girls. | |
| Not a randomised trial | |
| Not a randomised trial |
Characteristics of ongoing studies [ordered by study ID]
| Study name | Effectiveness of vitamin D supplementation on severity of cirrhosis based on CHILD and MELD scores in patients with decompensate cirrhosis |
| Methods | Randomised clinical trial using parallel‐group design (2 groups) |
| Participants | Country: Iran Estimated number of participants: 80 Inclusion criteria: people with HIV, renal failure due to reasons other than liver failure, malabsorption such as chronic diarrhoea, coeliac disease, chronic pancreatitis; people undergoing corticosteroid treatment; pregnancy; and people with cirrhosis secondary to cholestasis such as primary biliary cirrhosis |
| Interventions | Intervention: vitamin D3 (50,000 IU) and popular drugs using for liver cirrhosis Control: popular drugs using for liver cirrhosis Daily for 3 months |
| Outcomes | Primary outcome: liver function measured by Model for End‐Stage Liver Disease score Secondary outcomes: liver function measured by Child‐Turcotte‐Pugh score |
| Starting date | March 2016 |
| Contact information | Hossein Ali Abbasi, Emam Reza Hospital, Emam Reza Square, Ebne Sina Avenue, Mashhad, Iran |
| Notes |
| Study name | Study of oral vitamin D treatment for the prevention of hepatocellular carcinoma in patients with chronic hepatitis B |
| Methods | Randomised clinical trial using parallel‐group design (2 groups) |
| Participants | Country: China Estimated number of participants: 1500 Inclusion criteria: age 18 to 70 years; with chronic hepatitis B and under the oral antivirus treatment; no evidence of hepatocellular carcinoma on entry imaging study; Model for End‐Stage Liver Disease score < 22; not currently participating in another intervention study; not pregnant or lactating, and willing to use effective contraception during study period; absence of any psychological, familial, sociological, or geographical condition potentially hampering compliance with the study protocol and follow‐up schedule; and ability to provide written informed consent according to national or local regulations Exclusion criteria: evidence of hepatocellular carcinoma within 6 months after enrolment, serum alanine aminotransferase level > 10 times the upper limit of normal, elevated serum creatinine level, diagnosis of kidney stones, diagnosis of hyperparathyroidism or other serious disturbance of calcium metabolism in past 5 years, evidence of autoimmune hepatitis, co‐infection with hepatitis C or D virus or HIV, other serious concurrent illness (e.g. alcoholism, uncontrolled diabetes, cancer), treatment with immunomodulatory agent within 6 months before screening, treatment with any investigational drug within 30 days before the study began |
| Interventions | Intervention: vitamin D3 800 IU/day besides the antivirus treatment with nucleos(t)ide medicine Control: no intervention For 1 year |
| Outcomes | Primary outcomes: change in serum levels of 25‐hydroxyvitamin D at baseline and at 6 and 12 months, and change in serum levels of 25‐hydroxyvitamin D at 6 and 12 months compared to baseline Secondary outcomes: change in serum creatinine at baseline and at 6 and 12 months; change in serum creatinine at 6 and 12 months compared to baseline; change in fibrosis score at baseline and at 6 and 12 months; fibrosis score at 6 and 12 months compared to baseline; number of participants on vitamin D treatment with adverse events |
| Starting date | June 2016 |
| Contact information | Yutian Chong, MD, Third Affiliated Hospital, Sun Yat‐Sen University |
| Notes |
IU: international unit
Data and analyses
| Outcome or subgroup title | No. of studies | No. of participants | Statistical method | Effect size |
| 1.1 1.1 All‐cause mortality Show forest plot | 27 | 1979 | Risk Ratio (M‐H, Random, 95% CI) | 0.86 [0.51, 1.45] |
| Analysis 1.1  Comparison 1: Vitamin D versus placebo or no intervention, Outcome 1: 1.1 All‐cause mortality | ||||
| 1.1.1 Non‐alcoholic fatty liver disease | 11 | 803 | Risk Ratio (M‐H, Random, 95% CI) | Not estimable |
| 1.1.2 Chronic hepatitis C | 10 | 836 | Risk Ratio (M‐H, Random, 95% CI) | 0.33 [0.04, 3.13] |
| 1.1.3 Liver cirrhosis | 5 | 265 | Risk Ratio (M‐H, Random, 95% CI) | 0.91 [0.53, 1.55] |
| 1.1.4 Liver transplant recipients | 1 | 75 | Risk Ratio (M‐H, Random, 95% CI) | Not estimable |
| 1.2 1.1 All‐cause mortality according to vested interest Show forest plot | 27 | 1979 | Risk Ratio (M‐H, Random, 95% CI) | 0.86 [0.51, 1.45] |
| Analysis 1.2  Comparison 1: Vitamin D versus placebo or no intervention, Outcome 2: 1.1 All‐cause mortality according to vested interest | ||||
| 1.2.1 Trials with vested interest | 2 | 38 | Risk Ratio (M‐H, Random, 95% CI) | 2.69 [0.15, 48.64] |
| 1.2.2 Trials without vested interest | 25 | 1941 | Risk Ratio (M‐H, Random, 95% CI) | 0.83 [0.48, 1.41] |
| 1.3 All‐cause mortality according to vitamin D status at entry Show forest plot | 27 | 1979 | Risk Ratio (M‐H, Random, 95% CI) | 0.86 [0.51, 1.45] |
| Analysis 1.3  Comparison 1: Vitamin D versus placebo or no intervention, Outcome 3: All‐cause mortality according to vitamin D status at entry | ||||
| 1.3.1 Normal vitamin D status | 8 | 549 | Risk Ratio (M‐H, Random, 95% CI) | 0.33 [0.04, 3.13] |
| 1.3.2 Low vitamin D status | 19 | 1430 | Risk Ratio (M‐H, Random, 95% CI) | 0.91 [0.53, 1.55] |
| 1.4 All‐cause mortality according to form of vitamin D Show forest plot | 26 | Risk Ratio (M‐H, Random, 95% CI) | Subtotals only | |
| Analysis 1.4  Comparison 1: Vitamin D versus placebo or no intervention, Outcome 4: All‐cause mortality according to form of vitamin D | ||||
| 1.4.1 Vitamin D 3 | 20 | 1578 | Risk Ratio (M‐H, Random, 95% CI) | 0.83 [0.48, 1.41] |
| 1.4.2 Vitamin D 2 | 3 | 150 | Risk Ratio (M‐H, Random, 95% CI) | 3.00 [0.15, 61.74] |
| 1.4.3 1,25‐dihydroxyvitamin D | 4 | 291 | Risk Ratio (M‐H, Random, 95% CI) | Not estimable |
| 1.4.4 25‐hydroxyvitamin D | 1 | 12 | Risk Ratio (M‐H, Random, 95% CI) | 3.00 [0.15, 61.74] |
| 1.5 All‐cause mortality (best‐worst‐case and worst‐best‐case scenarios) Show forest plot | 24 | Risk Ratio (M‐H, Random, 95% CI) | Subtotals only | |
| Analysis 1.5  Comparison 1: Vitamin D versus placebo or no intervention, Outcome 5: All‐cause mortality (best‐worst‐case and worst‐best‐case scenarios) | ||||
| 1.5.1 Best‐worst‐case scenario | 24 | 1737 | Risk Ratio (M‐H, Random, 95% CI) | 0.14 [0.06, 0.30] |
| 1.5.2 Worst‐best‐case scenario | 24 | 1737 | Risk Ratio (M‐H, Random, 95% CI) | 7.95 [3.55, 17.77] |
| 1.6 Liver‐related mortality Show forest plot | 1 | 18 | Risk Ratio (M‐H, Random, 95% CI) | 1.62 [0.08, 34.66] |
| Analysis 1.6  Comparison 1: Vitamin D versus placebo or no intervention, Outcome 6: Liver‐related mortality | ||||
| 1.7 Serious adverse events Show forest plot | 4 | Risk Ratio (M‐H, Random, 95% CI) | Subtotals only | |
| Analysis 1.7  Comparison 1: Vitamin D versus placebo or no intervention, Outcome 7: Serious adverse events | ||||
| 1.7.1 Hypercalcaemia | 1 | 76 | Risk Ratio (M‐H, Random, 95% CI) | 5.00 [0.25, 100.80] |
| 1.7.2 Myocardial infarction | 2 | 86 | Risk Ratio (M‐H, Random, 95% CI) | 0.75 [0.08, 6.81] |
| 1.7.3 Thyroiditis | 1 | 68 | Risk Ratio (M‐H, Random, 95% CI) | 0.33 [0.01, 7.91] |
| 1.7.4 Circular haemorrhoidal prolapse | 1 | 20 | Risk Ratio (M‐H, Random, 95% CI) | 3.00 [0.14, 65.90] |
| 1.7.5 Bronchopneumonia | 1 | 20 | Risk Ratio (M‐H, Random, 95% CI) | 0.33 [0.02, 7.32] |
| 1.8 Liver‐related morbidity Show forest plot | 0 | 0 | Risk Ratio (M‐H, Random, 95% CI) | Not estimable |
| Analysis 1.8  Comparison 1: Vitamin D versus placebo or no intervention, Outcome 8: Liver‐related morbidity | ||||
| 1.9 Health‐related quality of life Show forest plot | 0 | 0 | Risk Ratio (M‐H, Random, 95% CI) | Not estimable |
| Analysis 1.9  Comparison 1: Vitamin D versus placebo or no intervention, Outcome 9: Health‐related quality of life | ||||
| 1.10 Non‐serious adverse events Show forest plot | 3 | Risk Ratio (M‐H, Random, 95% CI) | Subtotals only | |
| Analysis 1.10  Comparison 1: Vitamin D versus placebo or no intervention, Outcome 10: Non‐serious adverse events | ||||
| 1.10.1 Glossitis | 1 | 65 | Risk Ratio (M‐H, Random, 95% CI) | 3.70 [0.16, 87.58] |
| 1.10.2 Depression | 1 | 20 | Risk Ratio (M‐H, Random, 95% CI) | 3.00 [0.14, 65.90] |
| 1.10.3 Lower back pain | 1 | 20 | Risk Ratio (M‐H, Random, 95% CI) | 3.00 [0.14, 65.90] |
| 1.10.4 Abdominal bloating | 1 | 20 | Risk Ratio (M‐H, Random, 95% CI) | 0.33 [0.02, 7.32] |
| 1.10.5 Cold | 1 | 20 | Risk Ratio (M‐H, Random, 95% CI) | 0.33 [0.02, 7.32] |
| 1.10.6 Constipation | 1 | 20 | Risk Ratio (M‐H, Random, 95% CI) | 0.33 [0.02, 7.32] |
| 1.10.7 Sore throat | 1 | 20 | Risk Ratio (M‐H, Random, 95% CI) | 0.33 [0.02, 7.32] |
| 1.10.8 Sour taste in mouth | 1 | 20 | Risk Ratio (M‐H, Random, 95% CI) | 0.33 [0.02, 7.32] |
| 1.10.9 Contused lacerated wound | 1 | 20 | Risk Ratio (M‐H, Random, 95% CI) | 0.33 [0.02, 7.32] |
| 1.10.10 Multiple white matter lesions | 1 | 20 | Risk Ratio (M‐H, Random, 95% CI) | 0.33 [0.02, 7.32] |
| 1.10.11 Gastro‐oesophageal reflux | 1 | 20 | Risk Ratio (M‐H, Random, 95% CI) | 3.00 [0.14, 65.90] |
| 1.10.12 Abdominal menstrual cramps | 1 | 20 | Risk Ratio (M‐H, Random, 95% CI) | 3.00 [0.14, 65.90] |
| 1.10.13 Tubular colon adenoma | 1 | 20 | Risk Ratio (M‐H, Random, 95% CI) | 3.00 [0.14, 65.90] |
| 1.10.14 Gastric motility disturbance | 1 | 20 | Risk Ratio (M‐H, Random, 95% CI) | 3.00 [0.14, 65.90] |
| 1.10.15 Irritable bowel syndrome | 1 | 20 | Risk Ratio (M‐H, Random, 95% CI) | 5.00 [0.27, 92.62] |
| 1.10.16 Knee pain | 1 | 20 | Risk Ratio (M‐H, Random, 95% CI) | 3.00 [0.14, 65.90] |
| 1.10.17 Severe allergy | 1 | 109 | Risk Ratio (M‐H, Random, 95% CI) | 5.09 [0.25, 103.64] |
| 1.11 Failure of rapid virological response Show forest plot | 3 | 247 | Risk Ratio (M‐H, Random, 95% CI) | 0.75 [0.60, 0.95] |
| Analysis 1.11  Comparison 1: Vitamin D versus placebo or no intervention, Outcome 11: Failure of rapid virological response | ||||
| 1.12 Failure of early virological response Show forest plot | 4 | 315 | Risk Ratio (M‐H, Random, 95% CI) | 0.33 [0.11, 1.00] |
| Analysis 1.12  Comparison 1: Vitamin D versus placebo or no intervention, Outcome 12: Failure of early virological response | ||||
| 1.13 Failure of sustained virological response Show forest plot | 7 | 630 | Risk Ratio (M‐H, Random, 95% CI) | 0.65 [0.42, 1.01] |
| Analysis 1.13  Comparison 1: Vitamin D versus placebo or no intervention, Outcome 13: Failure of sustained virological response | ||||
| 1.14 Acute cellular rejection in liver transplant recipients Show forest plot | 1 | 75 | Risk Ratio (M‐H, Random, 95% CI) | 0.33 [0.04, 2.62] |
| Analysis 1.14  Comparison 1: Vitamin D versus placebo or no intervention, Outcome 14: Acute cellular rejection in liver transplant recipients | ||||
| 1.15 Vitamin D status (ng/mL) Show forest plot | 15 | 1078 | Mean Difference (IV, Random, 95% CI) | 18.49 [14.52, 22.47] |
| Analysis 1.15  Comparison 1: Vitamin D versus placebo or no intervention, Outcome 15: Vitamin D status (ng/mL) | ||||
| 1.16 Bone mineral density (g/cm) Show forest plot | 1 | 18 | Mean Difference (IV, Random, 95% CI) | 0.15 [0.04, 0.26] |
| Analysis 1.16  Comparison 1: Vitamin D versus placebo or no intervention, Outcome 16: Bone mineral density (g/cm) | ||||
| 1.17 Aspartate aminotransferase (IU/L) Show forest plot | 12 | 774 | Mean Difference (IV, Random, 95% CI) | ‐1.75 [‐5.41, 1.91] |
| Analysis 1.17  Comparison 1: Vitamin D versus placebo or no intervention, Outcome 17: Aspartate aminotransferase (IU/L) | ||||
| 1.18 Alanine aminotransferase (IU/L Show forest plot | 13 | 855 | Mean Difference (IV, Random, 95% CI) | ‐2.30 [‐7.60, 3.00] |
| Analysis 1.18  Comparison 1: Vitamin D versus placebo or no intervention, Outcome 18: Alanine aminotransferase (IU/L | ||||
| 1.19 Alkaline phosphatases (IU/L) Show forest plot | 6 | 344 | Mean Difference (IV, Random, 95% CI) | ‐0.95 [‐15.10, 13.20] |
| Analysis 1.19  Comparison 1: Vitamin D versus placebo or no intervention, Outcome 19: Alkaline phosphatases (IU/L) | ||||
| 1.20 Gamma‐glutamyl transpeptidase (IU/L) Show forest plot | 4 | 227 | Mean Difference (IV, Random, 95% CI) | ‐2.69 [‐5.26, ‐0.11] |
| Analysis 1.20  Comparison 1: Vitamin D versus placebo or no intervention, Outcome 20: Gamma‐glutamyl transpeptidase (IU/L) | ||||
| 1.21 Bilirubin (mg/dL) Show forest plot | 3 | 74 | Mean Difference (IV, Random, 95% CI) | 0.32 [0.00, 0.63] |
| Analysis 1.21  Comparison 1: Vitamin D versus placebo or no intervention, Outcome 21: Bilirubin (mg/dL) | ||||
| 1.22 Triglyceride (mg/dL) Show forest plot | 5 | 460 | Mean Difference (IV, Random, 95% CI) | 11.27 [‐10.99, 33.53] |
| Analysis 1.22  Comparison 1: Vitamin D versus placebo or no intervention, Outcome 22: Triglyceride (mg/dL) | ||||
| 1.23 Cholesterol (mg/dL) Show forest plot | 4 | 400 | Mean Difference (IV, Random, 95% CI) | 3.51 [‐2.83, 9.85] |
| Analysis 1.23  Comparison 1: Vitamin D versus placebo or no intervention, Outcome 23: Cholesterol (mg/dL) | ||||
| 1.24 LDL cholesterol (mg/dL) Show forest plot | 4 | 400 | Mean Difference (IV, Random, 95% CI) | ‐0.97 [‐8.70, 6.76] |
| Analysis 1.24  Comparison 1: Vitamin D versus placebo or no intervention, Outcome 24: LDL cholesterol (mg/dL) | ||||
| 1.25 Albumin (g/L) Show forest plot | 3 | 74 | Mean Difference (IV, Random, 95% CI) | ‐1.18 [‐2.96, 0.59] |
| Analysis 1.25  Comparison 1: Vitamin D versus placebo or no intervention, Outcome 25: Albumin (g/L) | ||||
| 1.26 HDL cholesterol (mg/dL) Show forest plot | 4 | 400 | Mean Difference (IV, Random, 95% CI) | 1.14 [‐0.64, 2.92] |
| Analysis 1.26  Comparison 1: Vitamin D versus placebo or no intervention, Outcome 26: HDL cholesterol (mg/dL) | ||||
| 1.27 Calcium (mg/dL) Show forest plot | 7 | 423 | Mean Difference (IV, Random, 95% CI) | 0.04 [‐0.12, 0.19] |
| Analysis 1.27  Comparison 1: Vitamin D versus placebo or no intervention, Outcome 27: Calcium (mg/dL) | ||||
| 1.28 Glucose (mg/dL) Show forest plot | 6 | 469 | Mean Difference (IV, Random, 95% CI) | 1.44 [‐5.05, 7.94] |
| Analysis 1.28  Comparison 1: Vitamin D versus placebo or no intervention, Outcome 28: Glucose (mg/dL) | ||||
| 1.29 Phosphorus (mg/dL) Show forest plot | 4 | 307 | Mean Difference (IV, Random, 95% CI) | 0.17 [‐0.16, 0.50] |
| Analysis 1.29  Comparison 1: Vitamin D versus placebo or no intervention, Outcome 29: Phosphorus (mg/dL) | ||||
| 1.30 Adiponectin (µg/mL) Show forest plot | 4 | 276 | Mean Difference (IV, Random, 95% CI) | 1.02 [‐0.27, 2.30] |
| Analysis 1.30  Comparison 1: Vitamin D versus placebo or no intervention, Outcome 30: Adiponectin (µg/mL) | ||||
| 1.31 Insulin (mIU/mL) Show forest plot | 6 | 428 | Mean Difference (IV, Random, 95% CI) | 0.03 [‐1.15, 1.21] |
| Analysis 1.31  Comparison 1: Vitamin D versus placebo or no intervention, Outcome 31: Insulin (mIU/mL) | ||||
| 1.32 Parathyroid hormone (pg/mL) Show forest plot | 2 | 118 | Mean Difference (IV, Random, 95% CI) | ‐15.18 [‐38.54, 8.18] |
| Analysis 1.32  Comparison 1: Vitamin D versus placebo or no intervention, Outcome 32: Parathyroid hormone (pg/mL) | ||||
| 1.33 C‐reactive protein (mg/L) Show forest plot | 4 | 254 | Mean Difference (IV, Random, 95% CI) | ‐0.50 [‐0.93, ‐0.07] |
| Analysis 1.33  Comparison 1: Vitamin D versus placebo or no intervention, Outcome 33: C‐reactive protein (mg/L) | ||||

Study flow diagram.

Risk of bias summary: review authors' judgements about each risk of bias item for each included study.

Risk of bias graph: review authors' judgements about each risk of bias item presented as percentages across all included studies.

All‐cause mortality.
Trial Sequential Analysis was performed based on a mortality in the control group of 2%, a relative risk reduction of 20% in the experimental intervention group, a type I error of 1.25%, and a type II error of 10% (90% power). There was no diversity. The required information size was 63,116 participants. The cumulative Z‐curve (blue line) did not cross the trial sequential monitoring boundary for benefit or harm after the 27th trial. The trial sequential monitoring boundaries were ignored due to little information (3.14%). The blue line represents the cumulative Z‐score of the meta‐analysis. The green dotted lines represent the conventional statistical boundaries.

Rapid virological response.
Trial Sequential Analysis was performed based on a failure of rapid virological response in the control group of 53%, a relative risk reduction (RRR) of 20% in the intervention group, a type I error of 1.25%, and a type II error of 10% (90% power). There was no diversity. The required information size was 1269 participants. The cumulative Z‐curve (blue line) crossed the conventional monitoring boundary for benefit but did not cross the trial sequential monitoring boundary for benefit (red down‐sloping line). The blue line represents the cumulative Z‐score of the meta‐analysis. The green dotted lines represent the conventional statistical boundaries. The red inward‐sloping lines represent the trial sequential monitoring boundaries.
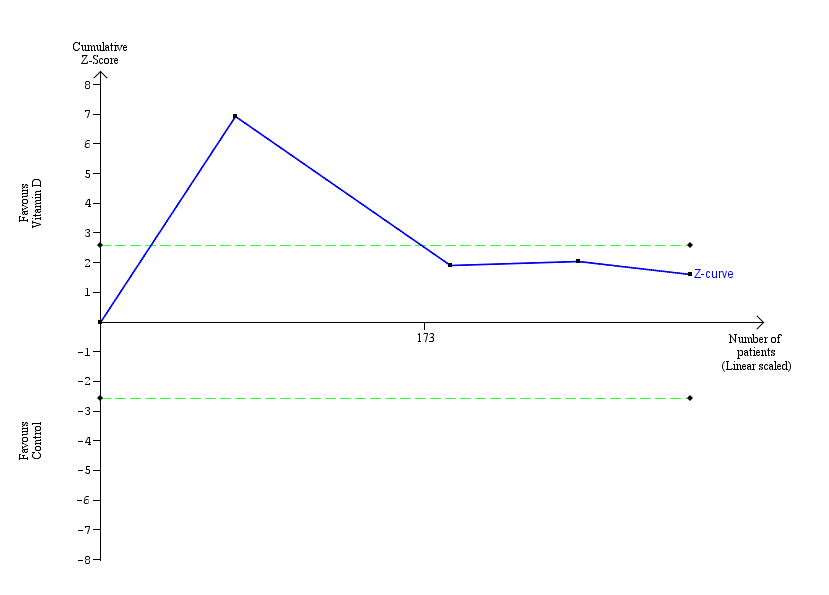
Early virological response.
Trial Sequential Analysis was performed based on failure of early virological response in the control group of 34%, a relative risk reduction of 20% in the intervention group, a type I error of 1.25%, and a type II error of 10% (90% power). The diversity was 88%. The required information size was 21,306 participants. The cumulative Z‐curve (blue line) crossed the conventional monitoring boundary for benefit. The trial sequential monitoring boundary was ignored due to little information (1.48%). The blue line represents the cumulative Z‐score of the meta‐analysis. The green lines represent the conventional statistical boundaries.

Sustained virological response.
Trial Sequential Analysis was performed based on failure of sustained virological response in the control group of 48%, a relative risk reduction (RRR) of 20% in the intervention group, a type I error of 1.25%, and a type II error of 10% (90% power). Diversity was 80%. The required information size was 7570 participants. The cumulative Z‐curve (blue line) crossed the conventional monitoring boundary for benefit. However, it did not cross any of the monitoring boundaries for benefit, harm, or futility. The blue line represents the cumulative Z‐score of the meta‐analysis. The green lines represent the conventional statistical boundaries. The red inward‐sloping lines represent the trial sequential monitoring boundaries for benefit and harm.

Comparison 1: Vitamin D versus placebo or no intervention, Outcome 1: 1.1 All‐cause mortality

Comparison 1: Vitamin D versus placebo or no intervention, Outcome 2: 1.1 All‐cause mortality according to vested interest

Comparison 1: Vitamin D versus placebo or no intervention, Outcome 3: All‐cause mortality according to vitamin D status at entry

Comparison 1: Vitamin D versus placebo or no intervention, Outcome 4: All‐cause mortality according to form of vitamin D

Comparison 1: Vitamin D versus placebo or no intervention, Outcome 5: All‐cause mortality (best‐worst‐case and worst‐best‐case scenarios)

Comparison 1: Vitamin D versus placebo or no intervention, Outcome 6: Liver‐related mortality

Comparison 1: Vitamin D versus placebo or no intervention, Outcome 7: Serious adverse events

Comparison 1: Vitamin D versus placebo or no intervention, Outcome 8: Liver‐related morbidity

Comparison 1: Vitamin D versus placebo or no intervention, Outcome 9: Health‐related quality of life

Comparison 1: Vitamin D versus placebo or no intervention, Outcome 10: Non‐serious adverse events

Comparison 1: Vitamin D versus placebo or no intervention, Outcome 11: Failure of rapid virological response

Comparison 1: Vitamin D versus placebo or no intervention, Outcome 12: Failure of early virological response

Comparison 1: Vitamin D versus placebo or no intervention, Outcome 13: Failure of sustained virological response

Comparison 1: Vitamin D versus placebo or no intervention, Outcome 14: Acute cellular rejection in liver transplant recipients

Comparison 1: Vitamin D versus placebo or no intervention, Outcome 15: Vitamin D status (ng/mL)

Comparison 1: Vitamin D versus placebo or no intervention, Outcome 16: Bone mineral density (g/cm)

Comparison 1: Vitamin D versus placebo or no intervention, Outcome 17: Aspartate aminotransferase (IU/L)

Comparison 1: Vitamin D versus placebo or no intervention, Outcome 18: Alanine aminotransferase (IU/L

Comparison 1: Vitamin D versus placebo or no intervention, Outcome 19: Alkaline phosphatases (IU/L)

Comparison 1: Vitamin D versus placebo or no intervention, Outcome 20: Gamma‐glutamyl transpeptidase (IU/L)

Comparison 1: Vitamin D versus placebo or no intervention, Outcome 21: Bilirubin (mg/dL)

Comparison 1: Vitamin D versus placebo or no intervention, Outcome 22: Triglyceride (mg/dL)

Comparison 1: Vitamin D versus placebo or no intervention, Outcome 23: Cholesterol (mg/dL)

Comparison 1: Vitamin D versus placebo or no intervention, Outcome 24: LDL cholesterol (mg/dL)

Comparison 1: Vitamin D versus placebo or no intervention, Outcome 25: Albumin (g/L)

Comparison 1: Vitamin D versus placebo or no intervention, Outcome 26: HDL cholesterol (mg/dL)

Comparison 1: Vitamin D versus placebo or no intervention, Outcome 27: Calcium (mg/dL)

Comparison 1: Vitamin D versus placebo or no intervention, Outcome 28: Glucose (mg/dL)

Comparison 1: Vitamin D versus placebo or no intervention, Outcome 29: Phosphorus (mg/dL)

Comparison 1: Vitamin D versus placebo or no intervention, Outcome 30: Adiponectin (µg/mL)

Comparison 1: Vitamin D versus placebo or no intervention, Outcome 31: Insulin (mIU/mL)

Comparison 1: Vitamin D versus placebo or no intervention, Outcome 32: Parathyroid hormone (pg/mL)

Comparison 1: Vitamin D versus placebo or no intervention, Outcome 33: C‐reactive protein (mg/L)
| Vitamin D compared with placebo or no intervention for chronic liver diseases in adults | ||||||
| Patient or population: people with chronic liver diseases | ||||||
| Outcomes | Anticipated absolute effects* (95% CI) | Relative effect | № of participants | Certainty of the evidence | Comments | |
|---|---|---|---|---|---|---|
| Risk with placebo or no intervention | Risk with vitamin D | |||||
| All‐cause mortality Follow‐up: mean 7 months (1 to 18 months) | Study population | RR 0.86 | 1979 | ⊕⊝⊝⊝ | ||
| 21 per 1000 | 18 per 1000 | |||||
| Liver‐related mortality Follow‐up: 12 months | Study population | RR 1.62 | 18 | ⊕⊝⊝⊝ | No information was available to calculate absolute effects. | |
| ‐ | ‐ | |||||
| Serious adverse events Follow‐up: mean 10.5 months (6 to 12 months) | Study population | ‐ | ‐ | ⊕⊝⊝⊝ | ||
| Several serious adverse events were reported: hypercalcaemia (RR 5.00, 95% CI 0.25 to 100.8; 1 trial; 76 participants); myocardial infarction (RR 0.75, 95% CI 0.08 to 6.81; 2 trials; 86 participants); thyroiditis (RR 0.33, 95% CI 0.01 to 7.91; 1 trial; 68 participants); circular haemorrhoidal prolapse (RR 3.00, 95% CI 0.14 to 65.9; 1 trial; 20 participants); bronchopneumonia (RR 0.33, 95% CI 0.02 to 7.32; 1 trial; 20 participants). | ||||||
| Liver‐related morbidity | Study population | ‐ | (0 RCTs) | ‐ | ||
| ‐ | ‐ | |||||
| Health‐related quality of life | Study population | ‐ | (0 RCTs) | ‐ | ||
| ‐ | ‐ | |||||
| Non‐serious adverse events Follow‐up: mean 7 months (3 to 12 months) | Study population | ‐ | ‐ | ⊕⊝⊝⊝ | ||
| 1 trial reported 1 single non‐serious adverse event, and another trial reported 16 single non‐serious adverse events, for a total of 17 types of non‐serious adverse events. | ||||||
| Failure of sustained virological response Follow‐up: mean 16 months (6 to 18 months) | Study population | RR 0.65 | 630 | ⊕⊝⊝⊝ | ||
| 484 per 1000 | 315 per 1000 | |||||
| *The risk in the intervention group (and its 95% CI) is based on the assumed risk in the comparison group and the relative effect of the intervention (and its 95% CI). | ||||||
| GRADE Working Group grades of evidence | ||||||
| 1Downgraded because of risk of bias (1 level) (all trials were at high risk of bias); and imprecision (2 levels) (few events, and the optimal information size of 63,116 participants (based on a proportion of 2% in the control group, a relative risk reduction of 20%, an alpha of 1.25%, and a beta of 10%) was not met; wide CI which included both benefits and harms). | ||||||
| Study ID | Protocol | Design | Groups | Bias | Blinding | Participants | Women | Mean |
|---|---|---|---|---|---|---|---|---|
| Yes | Parallel group | 2 | High | NI | 72 | 44 | 47 | |
| No | Parallel group | 2 | High | NI | 115 | 50 | 64 | |
| Yes | Parallel group | 2 | High | PL | 65 | 35 | 59 | |
| Yes | Parallel group | 2 | High | NI | 60 | 40 | 41 | |
| No | Parallel group | 2 | High | PL | 60 | ‐ | ‐ | |
| Yes | Parallel group | 2 | High | PL | 106 | 59 | 45 | |
| No | Parallel group | 2 | High | NI | 101 | 25 | 40 | |
| Yes | Parallel group | 2 | High | PL | 60 | 52 | 48 | |
| Yes | Parallel group | 2 | High | PL | 20 | ‐ | 44 | |
| Yes | Parallel group | 2 | High | NI | 82 | 100 | 34 | |
| No | Parallel group | 2 | High | PL | 109 | 36 | 28 | |
| Yes | Parallel group | 2 | High | NI | 148 | 49 | 52 | |
| No | Parallel group | 2 | High | NI | 101 | 24 | 45 | |
| Yes | Parallel group | 2 | High | PL | 80 | 46 | 52 | |
| Yes | Parallel group | 2 | High | PL | 58 | 38 | 50 | |
| Yes | Parallel group | 3 | High | PL | 120 | 38 | 41 | |
| No | Parallel group | 3 | High | NI | 18 | 0 | 61 | |
| No | Parallel group | 2 | High | NI | 50 | 58 | 47 | |
| Yes | Parallel group | 2 | High | PL | 36 | 25 | 61 | |
| No | Parallel group | 2 | High | NI | 81 | 32 | 38 | |
| No | Parallel group | 2 | High | PL | 60 | 51 | 60 | |
| No | Parallel group | 2 | High | NI | 76 | 66 | 61 | |
| No | Parallel group | 2 | High | NI | 34 | 100 | 56 | |
| Yes | Parallel group | 2 | High | NI | 40 | 50 | 42 | |
| Yes | Parallel group | 2 | High | NI | 68 | 13 | 42 | |
| No | Parallel group | 3 | High | PL | 75 | 17 | 48 | |
| No | Parallel group | 2 | High | NI | 84 | 49 | 59 | |
| n: number of participants | ||||||||
| Study ID | Participants | Outcome measures | Sponsor | Country |
|---|---|---|---|---|
| Chronic hepatitis C genotype 1 | Sustained virological response | No information | Israel | |
| Chronic hepatitis C genotype 1 | Sustained virological response | No information | Japan | |
| NAFLD | Liver steatosis, liver function | No | Italy | |
| Chronic hepatitis C genotype 1, 4 | Sustained virological response | No | India | |
| NAFLD | Biochemical indices, HOMA, FibroScan measurement | No information | Thailand | |
| NAFLD | Biochemical indices | No | Iran | |
| Chronic hepatitis C genotype 4 | Sustained virological response | No information | Egypt | |
| NAFLD | Liver steatosis, liver function | No | Iran | |
| NAFLD (NASH) | Liver steatosis, liver function | Yes | Switzerland | |
| NAFLD | Serum 25‐hydroxyvitamin D, adiponectin, HOMA‐IR, liver enzymes, and change in grade of NAFLD | No | Iran | |
| NAFLD | Body weight, BMI, insulin resistance, dyslipidaemia, hepatic enzymes, CRP, and adiponectin | No information | Pakistan | |
| Chronic hepatitis C genotype 1, 2, 3 | Sustained virological response | No information | Republic of Korea | |
| Liver cirrhosis | Mortality | No information | India | |
| Chronic hepatitis C | Serum levels of T‐helper cells associated cytokines | No | Thailand | |
| Chronic hepatitis C | Serum fibrotic markers | No | Thailand | |
| NAFLD | Liver function, body fat | No | Iran | |
| Liver cirrhosis | Bone mineral density | Yes | USA | |
| Chronic hepatitis C genotype 2 or 3 | Sustained virological response | No information | Israel | |
| Liver cirrhosis | Vitamin D status, liver function | No | Austria | |
| NAFLD | Insulin resistance and serum ALT | No | India | |
| NAFLD | Liver function, insulin resistance index | No | Iran | |
| Liver cirrhosis | Bone mineral density | No information | Japan | |
| Primary biliary cirrhosis | Bone mineral density | No information | Japan | |
| NAFLD | Biochemical indices, liver steatosis | No information | Iran | |
| Chronic hepatitis C genotype 1, 2, 3, 4 | Early virological response | No | Iran | |
| Liver transplant recipients | Acute cellular rejection rate | No | China | |
| Chronic hepatitis C genotype 1 | Sustained virological response | No information | Japan | |
| ALT: alanine aminotransferase | ||||
| Study ID | Vitamin | Calcium | Route | Regimen | Treatment | Follow‐up | Co‐intervention | |||
|---|---|---|---|---|---|---|---|---|---|---|
| D3 | D2 | 25(OH)D | 1,25(OH)2D | |||||||
| 2000 | ‐ | ‐ | ‐ | ‐ | Orally | Daily | 48 | 72 | PEG‐IFN, RBV | |
| 2000 | ‐ | ‐ | ‐ | ‐ | Orally | Daily | 16 | 24 | PEG‐IFN, RBV, SP | |
| 2000 | ‐ | ‐ | ‐ | ‐ | Orally | Daily | 24 | 24 | ‐ | |
| 2000 | ‐ | ‐ | ‐ | ‐ | Orally | Daily | 48 | 48 | PEG‐IFN, RBV | |
| ‐ | ‐ | ‐ | ‐ | ‐ | Orally | Daily | 20 | 20 | ||
| 50,000 | ‐ | ‐ | 0.25 | ‐ | Orally | Weekly and daily | 12 | 12 | ||
| 2143 | ‐ | ‐ | ‐ | ‐ | Orally | Weekly | 48 | 72 | PEG‐IFN, RBV | |
| 7143 | ‐ | ‐ | ‐ | ‐ | Orally | Weekly | 10 | 10 | ‐ | |
| 2100 | ‐ | ‐ | ‐ | ‐ | Orally | Daily | 48 | 48 | ||
| 600,000 | ‐ | ‐ | ‐ | ‐ | Intramuscularly | Single dose | Single dose | 4 | Vitamin E 400 IU/day | |
| 50,000 | ‐ | ‐ | ‐ | ‐ | Orally | Weekly | 12 | 12 | ||
| 800 | ‐ | ‐ | ‐ | ‐ | Orally | Daily | 24, 48 | 48, 72 | PEG‐IFN, RBV | |
| 300,000; 800 | ‐ | ‐ | ‐ | 1000 | Intramuscularly and orally | Single dose; daily | 24 | 24 | ||
| ‐ | 60,000; 80,000; 100,000 | ‐ | ‐ | ‐ | Orally | Weekly | 6 | 6 | ||
| ‐ | 60,000; 80,000; 100,000 | ‐ | ‐ | ‐ | Orally | Weekly | 6 | 6 | ||
| 1000 | ‐ | ‐ | ‐ | 500 | Orally | Daily | 10 | 12 | ‐ | |
| ‐ | 17,857 | 2400 | ‐ | ‐ | Orally | Daily | 52 | 52 | ‐ | |
| 2000 | ‐ | ‐ | ‐ | ‐ | Orally | Daily | 24 | 48 | PEG‐IFN, RBV | |
| 2800 | ‐ | ‐ | ‐ | ‐ | Orally | Daily | 8 | 8 | ‐ | |
| 600,000 | ‐ | ‐ | ‐ | ‐ | Intramuscularly | Single dose | Single dose | 24 | ||
| 3571 | ‐ | ‐ | ‐ | ‐ | Orally | Twice a week | 16 | 16 | ‐ | |
| ‐ | ‐ | ‐ | 1 | ‐ | Orally | Daily | 52 | 52 | ‐ | |
| ‐ | ‐ | ‐ | 1 | ‐ | Orally | Daily | 52 | 52 | ‐ | |
| 50,000 | ‐ | ‐ | ‐ | ‐ | Orally | Weekly | 12 | 72 | Lifestyle modification | |
| 1600 | ‐ | ‐ | ‐ | ‐ | Orally | Daily | 12 | 12 | PEG‐IFN, RBV | |
| ‐ | ‐ | ‐ | 0.25 | 1000 | Orally | Daily | 4 | 4 | ‐ | |
| 1000 | ‐ | ‐ | ‐ | ‐ | Orally | Daily | 16 | 24 | PEG‐IFN, RBV | |
| 1,25(OH)2D: calcitriol | ||||||||||
| Outcome or subgroup title | No. of studies | No. of participants | Statistical method | Effect size |
| 1.1 1.1 All‐cause mortality Show forest plot | 27 | 1979 | Risk Ratio (M‐H, Random, 95% CI) | 0.86 [0.51, 1.45] |
| 1.1.1 Non‐alcoholic fatty liver disease | 11 | 803 | Risk Ratio (M‐H, Random, 95% CI) | Not estimable |
| 1.1.2 Chronic hepatitis C | 10 | 836 | Risk Ratio (M‐H, Random, 95% CI) | 0.33 [0.04, 3.13] |
| 1.1.3 Liver cirrhosis | 5 | 265 | Risk Ratio (M‐H, Random, 95% CI) | 0.91 [0.53, 1.55] |
| 1.1.4 Liver transplant recipients | 1 | 75 | Risk Ratio (M‐H, Random, 95% CI) | Not estimable |
| 1.2 1.1 All‐cause mortality according to vested interest Show forest plot | 27 | 1979 | Risk Ratio (M‐H, Random, 95% CI) | 0.86 [0.51, 1.45] |
| 1.2.1 Trials with vested interest | 2 | 38 | Risk Ratio (M‐H, Random, 95% CI) | 2.69 [0.15, 48.64] |
| 1.2.2 Trials without vested interest | 25 | 1941 | Risk Ratio (M‐H, Random, 95% CI) | 0.83 [0.48, 1.41] |
| 1.3 All‐cause mortality according to vitamin D status at entry Show forest plot | 27 | 1979 | Risk Ratio (M‐H, Random, 95% CI) | 0.86 [0.51, 1.45] |
| 1.3.1 Normal vitamin D status | 8 | 549 | Risk Ratio (M‐H, Random, 95% CI) | 0.33 [0.04, 3.13] |
| 1.3.2 Low vitamin D status | 19 | 1430 | Risk Ratio (M‐H, Random, 95% CI) | 0.91 [0.53, 1.55] |
| 1.4 All‐cause mortality according to form of vitamin D Show forest plot | 26 | Risk Ratio (M‐H, Random, 95% CI) | Subtotals only | |
| 1.4.1 Vitamin D 3 | 20 | 1578 | Risk Ratio (M‐H, Random, 95% CI) | 0.83 [0.48, 1.41] |
| 1.4.2 Vitamin D 2 | 3 | 150 | Risk Ratio (M‐H, Random, 95% CI) | 3.00 [0.15, 61.74] |
| 1.4.3 1,25‐dihydroxyvitamin D | 4 | 291 | Risk Ratio (M‐H, Random, 95% CI) | Not estimable |
| 1.4.4 25‐hydroxyvitamin D | 1 | 12 | Risk Ratio (M‐H, Random, 95% CI) | 3.00 [0.15, 61.74] |
| 1.5 All‐cause mortality (best‐worst‐case and worst‐best‐case scenarios) Show forest plot | 24 | Risk Ratio (M‐H, Random, 95% CI) | Subtotals only | |
| 1.5.1 Best‐worst‐case scenario | 24 | 1737 | Risk Ratio (M‐H, Random, 95% CI) | 0.14 [0.06, 0.30] |
| 1.5.2 Worst‐best‐case scenario | 24 | 1737 | Risk Ratio (M‐H, Random, 95% CI) | 7.95 [3.55, 17.77] |
| 1.6 Liver‐related mortality Show forest plot | 1 | 18 | Risk Ratio (M‐H, Random, 95% CI) | 1.62 [0.08, 34.66] |
| 1.7 Serious adverse events Show forest plot | 4 | Risk Ratio (M‐H, Random, 95% CI) | Subtotals only | |
| 1.7.1 Hypercalcaemia | 1 | 76 | Risk Ratio (M‐H, Random, 95% CI) | 5.00 [0.25, 100.80] |
| 1.7.2 Myocardial infarction | 2 | 86 | Risk Ratio (M‐H, Random, 95% CI) | 0.75 [0.08, 6.81] |
| 1.7.3 Thyroiditis | 1 | 68 | Risk Ratio (M‐H, Random, 95% CI) | 0.33 [0.01, 7.91] |
| 1.7.4 Circular haemorrhoidal prolapse | 1 | 20 | Risk Ratio (M‐H, Random, 95% CI) | 3.00 [0.14, 65.90] |
| 1.7.5 Bronchopneumonia | 1 | 20 | Risk Ratio (M‐H, Random, 95% CI) | 0.33 [0.02, 7.32] |
| 1.8 Liver‐related morbidity Show forest plot | 0 | 0 | Risk Ratio (M‐H, Random, 95% CI) | Not estimable |
| 1.9 Health‐related quality of life Show forest plot | 0 | 0 | Risk Ratio (M‐H, Random, 95% CI) | Not estimable |
| 1.10 Non‐serious adverse events Show forest plot | 3 | Risk Ratio (M‐H, Random, 95% CI) | Subtotals only | |
| 1.10.1 Glossitis | 1 | 65 | Risk Ratio (M‐H, Random, 95% CI) | 3.70 [0.16, 87.58] |
| 1.10.2 Depression | 1 | 20 | Risk Ratio (M‐H, Random, 95% CI) | 3.00 [0.14, 65.90] |
| 1.10.3 Lower back pain | 1 | 20 | Risk Ratio (M‐H, Random, 95% CI) | 3.00 [0.14, 65.90] |
| 1.10.4 Abdominal bloating | 1 | 20 | Risk Ratio (M‐H, Random, 95% CI) | 0.33 [0.02, 7.32] |
| 1.10.5 Cold | 1 | 20 | Risk Ratio (M‐H, Random, 95% CI) | 0.33 [0.02, 7.32] |
| 1.10.6 Constipation | 1 | 20 | Risk Ratio (M‐H, Random, 95% CI) | 0.33 [0.02, 7.32] |
| 1.10.7 Sore throat | 1 | 20 | Risk Ratio (M‐H, Random, 95% CI) | 0.33 [0.02, 7.32] |
| 1.10.8 Sour taste in mouth | 1 | 20 | Risk Ratio (M‐H, Random, 95% CI) | 0.33 [0.02, 7.32] |
| 1.10.9 Contused lacerated wound | 1 | 20 | Risk Ratio (M‐H, Random, 95% CI) | 0.33 [0.02, 7.32] |
| 1.10.10 Multiple white matter lesions | 1 | 20 | Risk Ratio (M‐H, Random, 95% CI) | 0.33 [0.02, 7.32] |
| 1.10.11 Gastro‐oesophageal reflux | 1 | 20 | Risk Ratio (M‐H, Random, 95% CI) | 3.00 [0.14, 65.90] |
| 1.10.12 Abdominal menstrual cramps | 1 | 20 | Risk Ratio (M‐H, Random, 95% CI) | 3.00 [0.14, 65.90] |
| 1.10.13 Tubular colon adenoma | 1 | 20 | Risk Ratio (M‐H, Random, 95% CI) | 3.00 [0.14, 65.90] |
| 1.10.14 Gastric motility disturbance | 1 | 20 | Risk Ratio (M‐H, Random, 95% CI) | 3.00 [0.14, 65.90] |
| 1.10.15 Irritable bowel syndrome | 1 | 20 | Risk Ratio (M‐H, Random, 95% CI) | 5.00 [0.27, 92.62] |
| 1.10.16 Knee pain | 1 | 20 | Risk Ratio (M‐H, Random, 95% CI) | 3.00 [0.14, 65.90] |
| 1.10.17 Severe allergy | 1 | 109 | Risk Ratio (M‐H, Random, 95% CI) | 5.09 [0.25, 103.64] |
| 1.11 Failure of rapid virological response Show forest plot | 3 | 247 | Risk Ratio (M‐H, Random, 95% CI) | 0.75 [0.60, 0.95] |
| 1.12 Failure of early virological response Show forest plot | 4 | 315 | Risk Ratio (M‐H, Random, 95% CI) | 0.33 [0.11, 1.00] |
| 1.13 Failure of sustained virological response Show forest plot | 7 | 630 | Risk Ratio (M‐H, Random, 95% CI) | 0.65 [0.42, 1.01] |
| 1.14 Acute cellular rejection in liver transplant recipients Show forest plot | 1 | 75 | Risk Ratio (M‐H, Random, 95% CI) | 0.33 [0.04, 2.62] |
| 1.15 Vitamin D status (ng/mL) Show forest plot | 15 | 1078 | Mean Difference (IV, Random, 95% CI) | 18.49 [14.52, 22.47] |
| 1.16 Bone mineral density (g/cm) Show forest plot | 1 | 18 | Mean Difference (IV, Random, 95% CI) | 0.15 [0.04, 0.26] |
| 1.17 Aspartate aminotransferase (IU/L) Show forest plot | 12 | 774 | Mean Difference (IV, Random, 95% CI) | ‐1.75 [‐5.41, 1.91] |
| 1.18 Alanine aminotransferase (IU/L Show forest plot | 13 | 855 | Mean Difference (IV, Random, 95% CI) | ‐2.30 [‐7.60, 3.00] |
| 1.19 Alkaline phosphatases (IU/L) Show forest plot | 6 | 344 | Mean Difference (IV, Random, 95% CI) | ‐0.95 [‐15.10, 13.20] |
| 1.20 Gamma‐glutamyl transpeptidase (IU/L) Show forest plot | 4 | 227 | Mean Difference (IV, Random, 95% CI) | ‐2.69 [‐5.26, ‐0.11] |
| 1.21 Bilirubin (mg/dL) Show forest plot | 3 | 74 | Mean Difference (IV, Random, 95% CI) | 0.32 [0.00, 0.63] |
| 1.22 Triglyceride (mg/dL) Show forest plot | 5 | 460 | Mean Difference (IV, Random, 95% CI) | 11.27 [‐10.99, 33.53] |
| 1.23 Cholesterol (mg/dL) Show forest plot | 4 | 400 | Mean Difference (IV, Random, 95% CI) | 3.51 [‐2.83, 9.85] |
| 1.24 LDL cholesterol (mg/dL) Show forest plot | 4 | 400 | Mean Difference (IV, Random, 95% CI) | ‐0.97 [‐8.70, 6.76] |
| 1.25 Albumin (g/L) Show forest plot | 3 | 74 | Mean Difference (IV, Random, 95% CI) | ‐1.18 [‐2.96, 0.59] |
| 1.26 HDL cholesterol (mg/dL) Show forest plot | 4 | 400 | Mean Difference (IV, Random, 95% CI) | 1.14 [‐0.64, 2.92] |
| 1.27 Calcium (mg/dL) Show forest plot | 7 | 423 | Mean Difference (IV, Random, 95% CI) | 0.04 [‐0.12, 0.19] |
| 1.28 Glucose (mg/dL) Show forest plot | 6 | 469 | Mean Difference (IV, Random, 95% CI) | 1.44 [‐5.05, 7.94] |
| 1.29 Phosphorus (mg/dL) Show forest plot | 4 | 307 | Mean Difference (IV, Random, 95% CI) | 0.17 [‐0.16, 0.50] |
| 1.30 Adiponectin (µg/mL) Show forest plot | 4 | 276 | Mean Difference (IV, Random, 95% CI) | 1.02 [‐0.27, 2.30] |
| 1.31 Insulin (mIU/mL) Show forest plot | 6 | 428 | Mean Difference (IV, Random, 95% CI) | 0.03 [‐1.15, 1.21] |
| 1.32 Parathyroid hormone (pg/mL) Show forest plot | 2 | 118 | Mean Difference (IV, Random, 95% CI) | ‐15.18 [‐38.54, 8.18] |
| 1.33 C‐reactive protein (mg/L) Show forest plot | 4 | 254 | Mean Difference (IV, Random, 95% CI) | ‐0.50 [‐0.93, ‐0.07] |