Resonancia magnética de perfusión para diferenciar gliomas de bajo y alto grado en la primera consulta
Información
- DOI:
- https://doi.org/10.1002/14651858.CD011551.pub2Copiar DOI

- Base de datos:
-
- Cochrane Database of Systematic Reviews
- Versión publicada:
-
- 22 enero 2018see what's new
- Tipo:
-
- Diagnostic
- Etapa:
-
- Review
- Grupo Editorial Cochrane:
-
Grupo Cochrane de Cáncer ginecológico, neurooncología y otros cánceres
- Copyright:
-
- Copyright © 2018 The Cochrane Collaboration. Published by John Wiley & Sons, Ltd.
Cifras del artículo
Altmetric:
Citado por:
Autores
Contributions of authors
| Draft the protocol | All review authors |
| Develop a search strategy | JM Abrigo, JSW Kwong, Anne Eisinga |
| Search for trials | JM Abrigo, EKC Law, Anne Eisinga |
| Select which trials to include | JM Abrigo, D Fountain, EKC Law, MG Hart, JM Provenzale |
| Extract data from trials | JM Abrigo, D Fountain |
| Enter data into RevMan | D Fountain, JM Abrigo |
| Carry out the analysis | WWS Tam |
| Interpret the analysis | All review authors |
| Draft the final review | All review authors |
Sources of support
Internal sources
-
none, Other.
External sources
-
NIHR Cochrane Incentive Scheme 2016, UK.
Award reference 16/72/23
Declarations of interest
Jill M Abrigo ‐ Has no competing interest to declare
Wilson Wai San Tam ‐ None known
Dan Fountain ‐ None known
Michael G Hart ‐ None Known
Eric Ka Chai Law ‐ None Known
Joey SW Kwong ‐ None known
James M Provenzale ‐ Reports that he holds consultancies, industry‐sponsored lectures and grants but avows that they have no relationship to the research topic being studied herein.
Acknowledgements
We thank Clare Jess for the support and guidance and Anne Eisinga for her invaluable assistance with the search strategy. We are grateful to the authors who shared their perfusion data: Valeria Cuccarini, Anna Falk Delgado, Juan Guzman de Villoria, Meriam Koob, Kohsuke Kudo and Ikuko Iwano. We highly appreciate the valuable comments from the DTA Cochrane Team (Gianni Virgili, Clare Davenport, Sue Mallet), and peer reviewers Chris Tse, Mark Gilbert and Gerard Thompson. Our thanks also to Valerie Geisendorfer for providing copies of ASNR conference proceedings, Anneliese Arno for assisting with the screening feature of Covidence, Kevin Leung for providing Figure 1 and Qianyun Chen for additional Chinese translation and data handling.
This project was supported by the National Institute for Health Research, via Cochrane Infrastructure and Incentive funding to the Cochrane Gynaecological, Neuro‐oncology and Orphan Cancer Group. The views and opinions expressed therein are those of the authors and do not necessarily reflect those of the Systematic Reviews Programme, NIHR, NHS or the Department of Health.
Version history
| Published | Title | Stage | Authors | Version |
| 2018 Jan 22 | Magnetic resonance perfusion for differentiating low‐grade from high‐grade gliomas at first presentation | Review | Jill M Abrigo, Daniel M Fountain, James M Provenzale, Eric K Law, Joey SW Kwong, Michael G Hart, Wilson Wai San Tam | |
| 2015 Mar 09 | Magnetic resonance perfusion for differentiating low grade from high grade gliomas at first presentation | Protocol | Jill M Abrigo, Wilson Wai San Tam, Michael G Hart, Eric Ka Chai Law, Joey SW Kwong, James M Provenzale | |
Differences between protocol and review
No changes to the inclusion criteria were made. When the review was first conceived we intended to request a search of the Cochrane Register of Diagnostic Test Accuracy Studies, a resource developed and maintained by the Cochrane Renal Group (now Cochrane Kidney & Transplant). By the time the protocol was published and the searches approved to run, this resource had not been updated for several years and was no longer available to be searched. We added a step in the screening process due to the high volume of the database search results (32,338). A single review author performed preliminary screening of titles and abstracts to facilitate exclusion of outright irrelevant references. Potential and equivocal references were then included for screening in the next round by two independent review authors. We had originally intended to handsearch through conference proceedings of targeted radiology and neuroradiology societies, however most are now provided online through their respective websites or journals and were accessed instead. For missing years, we contacted the relevant societies for copies. For meta‐analysis, we used R instead of SAS.
Keywords
MeSH
Medical Subject Headings (MeSH) Keywords
Medical Subject Headings Check Words
Adult; Child; Humans;
PICO
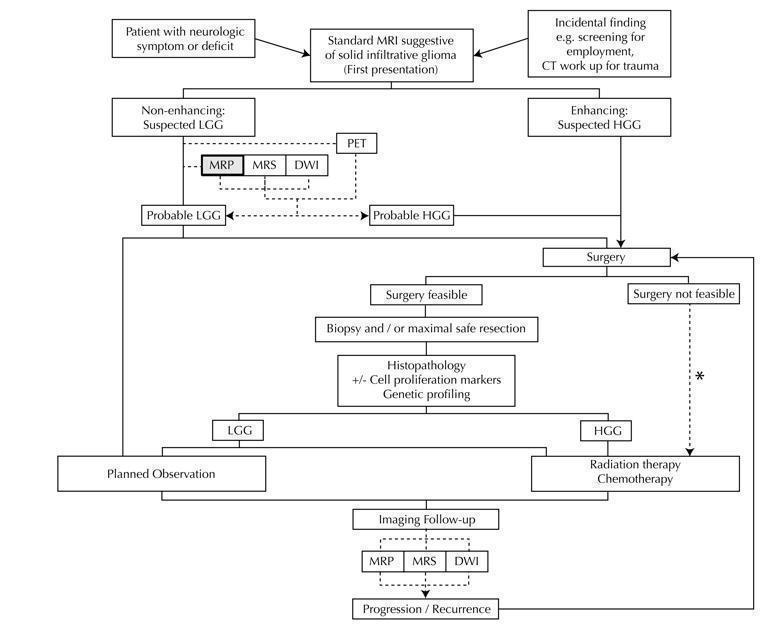
Diagram shows the clinical management algorithm for patients with infiltrative glioma. The role of the index test (MRP) for differentiating LGGs and HGGs at first presentation is shown with alternative tests (MRS, DWI, PET). These advanced MRI techniques are also used to identify progression or recurrence during interval scanning and are included, although they are outside the scope of this review. *May or may not be offered, depending on institutional/regional practice.
Abbreviations: LGG: Low‐grade glioma, HGG: High‐grade glioma,MRP: Magnetic resonance perfusion, MRS: magnetic resonance spectroscopy, DWI: Diffusion‐weighted imaging, PET: Positron emission tomography

Risk of bias and applicability concerns summary: review authors' judgements about each domain for each included study using QUADAS 2 tool, applied on study design and included patient data

Risk of bias and applicability concerns graph: review authors' judgements about each domain presented as percentages across included studies
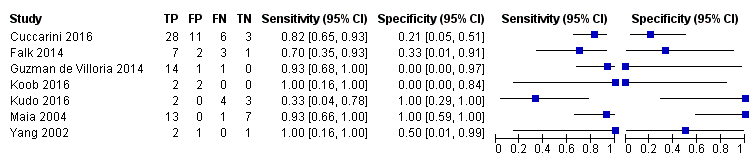
Coupled forest plots of included studies using rCBV threshold of < 1.75 for differentiating low grade gliomas from high‐grade gliomas.
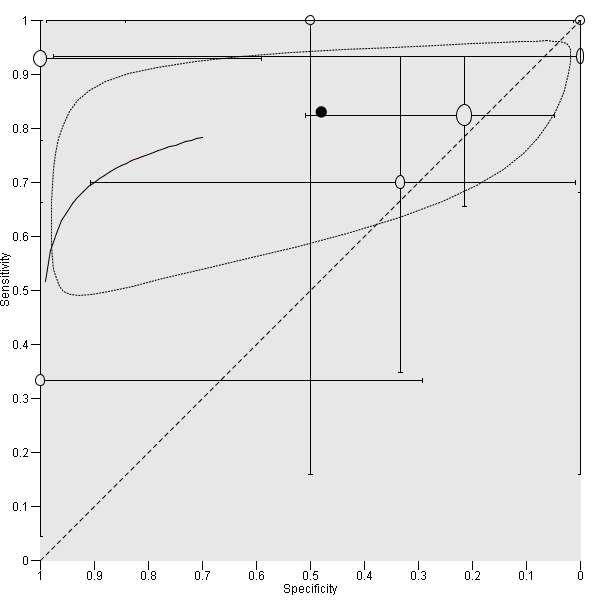
Summary ROC Plot of DSC MR perfusion using rCBV threshold of 1.75 for differentiating low grade gliomas from high‐grade gliomas. In this review, a positive test or rCBV < 1.75 implied an LGG diagnosis, while a negative test or rCBV > 1.75 suggested an HGG diagnosis. In the SROC plot, each study is represented by an open circle with emanating lines, representing the sensitivity and specificity with their confidence intervals. The size of the open circle is proportional to the study sample size. The shaded circle represents the pooled sensitivity and specificity surrounded by a 95% confidence ellipse (dotted line), which in this case is 0.830 (95% CI 0.657, 0.926) and 0.479 (95% CI 0.086, 0.900), respectively.

rCBV ‐ Law Threshold.
| Population | Almost all adults | |||||
| Setting | Mostly university hospitals, employing exclusively 1.5T or 3T MRI scanners | |||||
| Index test | Dynamic susceptibility contrast MR perfusion (commonly gradient echo rather than spin echo sequence acquisition), usually without contrast preload, typically using arterial input function or gamma variate function post‐processing algorithms, and preferentially using region‐of‐interest method to obtain Max rCBV values (CBV ratio of tumour: contralateral normal appearing white matter) | |||||
| Importance | For solid and non‐enhancing brain tumours with low rCBV, patients with no or little neurologic deficit may opt for conservative management over surgery to avoid early neurologic disability. Meanwhile, patients with high rCBV could favour early treatment for better tumour control. | |||||
| Reference standard | All with histologic examinations, majority with resection. | |||||
| Studies | Mostly prospective cross sectional studies (no case‐control studies) | |||||
| Positive Test | Summary accuracy | No. of study participants / selected patients | Prevalence | Implications | Quality of studies | Comments |
| rCBV threshold <1.75 indicates LGG | Sensitivity (proportion of LGG detected by MR perfusion) 0.83 (0.66, 0.93) (proportion of HGG detected by MR perfusion) 0.48 (0.09 to 0.90) | 392 patients / 115 with solid non‐enhancing Grade II‐IV gliomas who underwent tissue sampling within 2 months of MR perfusion (7 studies) | In a hypothetical population of solid and non‐enhancing Grade II‐IV gliomas, the prevalence of LGGs and HGGs is 72% and 28%, respectively. | Given 100 patients with solid and non‐enhancing infiltrative gliomas, 72 will have LGG and 28 with HGG. Of 72 patients with LGG, it is expected 12 patients will be misclassified to have HGG (but this could potentially be between 5 to 24 patients) and may undergo surgery, thus risking early neurologic deterioration. Meanwhile, of 28 patients with HGG, 15 will be misclassified to have LGG (but this could be between 3 to 25 patients), which may lead to a delay in treatment that can potentially adversely affect outcomes. | Generally low risk of bias in the patient selection domain, excepting 2 out of 7 studies with unclear patient sampling and inappropriate exclusion of small tumours. High risk of bias in the index test domain, mainly because 6 out of 7 studies did not use a pre‐specified threshold. However this did not affect meta‐analysis as we used a common rCBV threshold of 1.75. Low concerns of applicability for the patient selection, index test and reference standard domains by using patient‐level data. | Low numbers (4 to 48) with target and alternative conditions per study and only 2 studies had >20 patients. In general, individual studies had heterogeneous sensitivity and specificity, both with wide confidence intervals. Only 1 study had low risk of bias and low concern of applicability across all domains. Five studies were considered good quality (i.e., with low risk of bias in the domains of reference standard and flow & timing). Their sensitivity analysis yielded sensitivity 0.80 (95% CI 0.61 to 0.91) and specificity 0.67 (95% CI 0.07 to 0.98). Subgroup analysis showed sensitivity/specificity of [0.92 (95% CI 0.55 to 0.99)/ 0.42 (95% CI 0.02 to 0.95) in astrocytomas and 0.77 (95% CI 0.46 to 0.93)/0.53 (95% CI 0.14 to 0.88) in oligodendrogliomas + oligoastrocytomas. Data were too sparse to investigate any differences across subgroups. |
| HGG: high‐grade glioma, LGG: low‐grade glioma, rCBV: relative cerebral blood volume | ||||||
| WHO Grade | Tumour histology |
| I** | Pilocytic astrocytoma Subependymal giant cell astrocytoma Pleomorphic xanthoastrocytoma Ganglioglioma Ependymoma |
| II | Diffuse astrocytoma Oligodendroglioma Oligoastrocytoma |
| III | Anaplastic astrocytoma Anaplastic oligodendroglioma Anaplastic oligoastrocytoma |
| IV | Glioblastoma multiforme Gliomatosis cerebri |
| * Partial listing and specific to the tumour histology types relevant to this review. **These tumours are included in this table for reference only and are not part of the review. | |
| Included studies | LGG (Grade II) | HGG (Grade III+IV) | DA | OA | OG | AA | AOA | AOG |
| 1.15 ± 0.95 | 1.18 + 0.8 | 1.19 ± 0.76 | 1.12 ± 1.13 | 1.22 ± 0.57 | 1.15 ± 0.53 | 1.33 ± 0.98 | ||
| 1.30 + 0.48 | 1.76 + 0.93 | 1.48 + 0.69 | 1.20 + 0.21 | 1.19 + 0.32 | 2.22 + 1.18 | 0.86 | 1.76 | |
| 1.07 + 0.79 | 0.75 | 0.98 + 0.29 | 1.24 ±1.33 | 0.75 | ||||
| 0.8 + 0.04 | 0.8 + 0.6 | [0.77] | 0.82 | [0.41] | 1.28 | |||
| 3.1 ± 1.19 | 3.83 ± 2.34 | 2.31 ±1.23 | 3.88 ±.46 | 3.8 + 2.3 | ||||
| 1.16 ± 0.63 | 3.2 ± 0.35 | 0.9 ±.43 | 1.98 ± 0.57 | 1.27 | 3.24 ± 0.37 | 2.99 | ||
| 1.29 ± 0.17 | 1.76 ± 0.08 | 1.29 ± 0.17 | 1.81 | 1.7 | ||||
| LGG: Low‐grade glioma, HGG: high‐grade glioma, DA: diffuse astrocytoma, OA: oligoastrocytoma, OG: oligodendroglioma, AA: anaplastic astrocytoma, AOA: Anaplastic oligoastrocytoma, AOG: anaplastic oligodendroglioma. Nearly all HGGs are Grade III, except for one case of Grade IV/glioblastoma from Cuccarini 2016, with rCBV of 0.3. Bracketed values in Koob 2016 are included for completion but represent unspecified gliomas, with no reported histology. | ||||||||
| Test | No. of studies | No. of participants |
| 1 rCBV ‐ Law Threshold Show forest plot | 7 | 115 |