| 1 Mortality: bias control Show forest plot | 10 | 474 | Risk Ratio (M‐H, Random, 95% CI) | 0.96 [0.88, 1.06] |
|
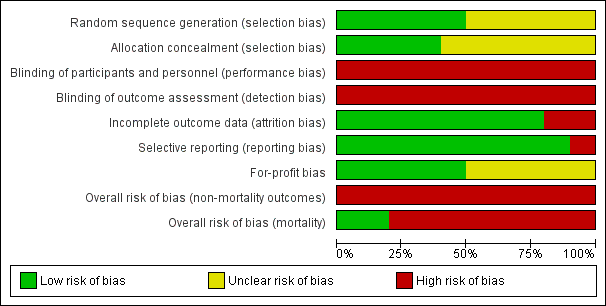
| 1.1 Low risk of bias | 2 | 94 | Risk Ratio (M‐H, Random, 95% CI) | 0.92 [0.63, 1.36] |
| 1.2 High risk of bias | 8 | 380 | Risk Ratio (M‐H, Random, 95% CI) | 0.97 [0.88, 1.07] |
| 2 Mortality: type of vasoactive drug Show forest plot | 10 | 474 | Risk Ratio (M‐H, Random, 95% CI) | 0.96 [0.88, 1.06] |
|
| 2.1 Noradrenaline | 7 | 306 | Risk Ratio (M‐H, Random, 95% CI) | 0.98 [0.88, 1.08] |
| 2.2 Midodrine/octreotide | 1 | 48 | Risk Ratio (M‐H, Random, 95% CI) | 0.71 [0.40, 1.28] |
| 2.3 Octreotide | 1 | 40 | Risk Ratio (M‐H, Random, 95% CI) | 0.75 [0.32, 1.77] |
| 2.4 Dopamine/furosemide | 1 | 80 | Risk Ratio (M‐H, Random, 95% CI) | 0.97 [0.77, 1.22] |
| 3 Mortality: type of hepatorenal syndrome Show forest plot | 10 | 474 | Risk Ratio (M‐H, Random, 95% CI) | 0.96 [0.88, 1.06] |
|
| 3.1 Type 1 hepatorenal syndrome | 9 | 375 | Risk Ratio (M‐H, Random, 95% CI) | 0.96 [0.87, 1.06] |
| 3.2 Type 2 hepatorenal syndrome | 3 | 99 | Risk Ratio (M‐H, Random, 95% CI) | 0.95 [0.68, 1.33] |
| 4 Mortality: publication status Show forest plot | 10 | | Risk Ratio (M‐H, Random, 95% CI) | Subtotals only |
|
| 4.1 Full paper | 8 | 374 | Risk Ratio (M‐H, Random, 95% CI) | 0.97 [0.83, 1.14] |
| 4.2 Abstract | 2 | 100 | Risk Ratio (M‐H, Random, 95% CI) | 0.96 [0.86, 1.08] |
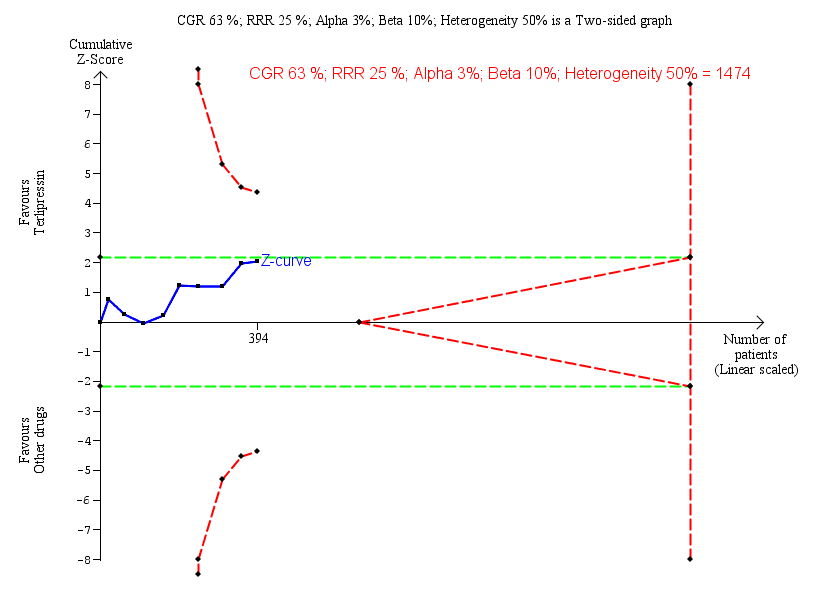
| 5 Hepatorenal syndrome: type of vasoactive drug Show forest plot | 9 | 394 | Risk Ratio (M‐H, Random, 95% CI) | 0.79 [0.63, 0.99] |
|
| 5.1 Noradrenaline | 7 | 306 | Risk Ratio (M‐H, Random, 95% CI) | 0.96 [0.76, 1.21] |
| 5.2 Midodrine/octreotide | 1 | 48 | Risk Ratio (M‐H, Random, 95% CI) | 0.47 [0.30, 0.72] |
| 5.3 Octreotide | 1 | 40 | Risk Ratio (M‐H, Random, 95% CI) | 0.56 [0.33, 0.96] |
| 6 Hepatorenal syndrome: type hepatorenal syndrome Show forest plot | 9 | 394 | Risk Ratio (M‐H, Random, 95% CI) | 0.79 [0.63, 0.98] |
|
| 6.1 Type 1 hepatorenal syndrome | 8 | 335 | Risk Ratio (M‐H, Random, 95% CI) | 0.79 [0.62, 1.01] |
| 6.2 Type 2 hepatorenal syndrome | 2 | 59 | Risk Ratio (M‐H, Random, 95% CI) | 0.86 [0.36, 2.10] |
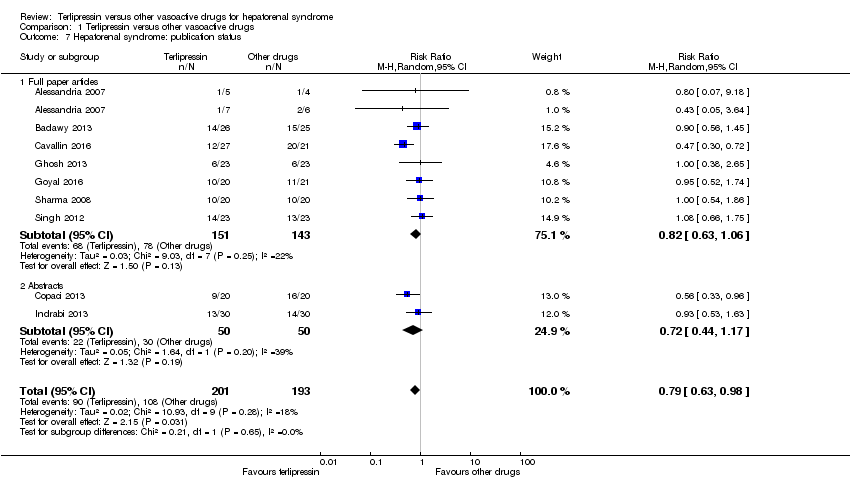
| 7 Hepatorenal syndrome: publication status Show forest plot | 9 | 394 | Risk Ratio (M‐H, Random, 95% CI) | 0.79 [0.63, 0.98] |
|
| 7.1 Full paper articles | 7 | 294 | Risk Ratio (M‐H, Random, 95% CI) | 0.82 [0.63, 1.06] |
| 7.2 Abstracts | 2 | 100 | Risk Ratio (M‐H, Random, 95% CI) | 0.72 [0.44, 1.17] |
| 8 Serious adverse events, type of vasoactive drug Show forest plot | 10 | 474 | Risk Ratio (M‐H, Random, 95% CI) | 0.96 [0.88, 1.06] |
|
| 8.1 Noradrenaline | 7 | 306 | Risk Ratio (M‐H, Random, 95% CI) | 0.98 [0.88, 1.08] |
| 8.2 Midodrine/octreotide | 1 | 48 | Risk Ratio (M‐H, Random, 95% CI) | 0.72 [0.42, 1.23] |
| 8.3 Octreotide | 1 | 40 | Risk Ratio (M‐H, Random, 95% CI) | 0.75 [0.32, 1.77] |
| 8.4 Dopamine/furosemide | 1 | 80 | Risk Ratio (M‐H, Random, 95% CI) | 0.97 [0.77, 1.22] |
| 9 Serious adverse events, type of event Show forest plot | 10 | | Risk Ratio (M‐H, Random, 95% CI) | Subtotals only |
|
| 9.1 Death | 10 | 474 | Risk Ratio (M‐H, Random, 95% CI) | 0.96 [0.88, 1.06] |
| 9.2 Major cardiovascular events | 7 | 323 | Risk Ratio (M‐H, Random, 95% CI) | 0.88 [0.13, 5.98] |
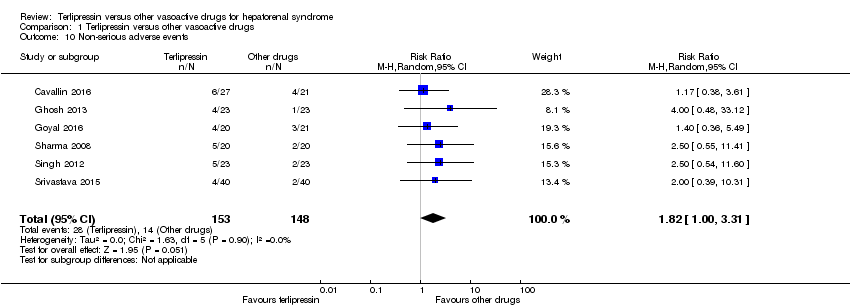
| 10 Non‐serious adverse events Show forest plot | 6 | 301 | Risk Ratio (M‐H, Random, 95% CI) | 1.82 [1.00, 3.31] |
|
| 11 Non‐serious adverse event: types Show forest plot | 6 | | Risk Ratio (M‐H, Random, 95% CI) | Subtotals only |
|
| 11.1 Diarrhoea or abdominal pain, or both | 5 | 221 | Risk Ratio (M‐H, Random, 95% CI) | 3.50 [1.19, 10.27] |
| 11.2 Peripheral cyanosis | 2 | 92 | Risk Ratio (M‐H, Random, 95% CI) | 3.0 [0.32, 27.83] |
| 11.3 Minor cardiovascular events | 6 | 301 | Risk Ratio (M‐H, Random, 95% CI) | 0.84 [0.37, 1.93] |