Esmectita para la diarrea infecciosa aguda en niños
Información
- DOI:
- https://doi.org/10.1002/14651858.CD011526.pub2Copiar DOI

- Base de datos:
-
- Cochrane Database of Systematic Reviews
- Versión publicada:
-
- 25 abril 2018see what's new
- Tipo:
-
- Intervention
- Etapa:
-
- Review
- Grupo Editorial Cochrane:
-
Grupo Cochrane de Enfermedades infecciosas
- Clasificada:
-
- Actualizada
All studies incorporated from most recent search
All eligible published studies found in the last search (27 Jun, 2017) were includedEvaluada: 2 April 2019
- Actualizada
- Copyright:
-
- Copyright © 2018 The Authors. Cochrane Database of Systematic Reviews published by John Wiley & Sons, Ltd. on behalf of The Cochrane Collaboration.
- This is an open access article under the terms of the Creative Commons Attribution‐Non‐Commercial Licence, which permits use, distribution and reproduction in any medium, provided the original work is properly cited and is not used for commercial purposes.
Cifras del artículo
Altmetric:
Citado por:
Autores
Contributions of authors
Giordano Pérez‐Gaxiola and Carlos Cuello‐García prepared the protocol and manuscript. Ivan D Florez checked the protocol and manuscript, and provided advice. Víctor Pérez‐Pico checked the protocol and provided advice as an infectious diseases specialist.
Sources of support
Internal sources
-
Liverpool School of Tropical Medicine, UK.
External sources
-
Department for International Development (DFID), UK.
Grant: 5242
Declarations of interest
Giordano Pérez‐Gaxiola, Carlos A Cuello‐García, Ivan D Florez, Víctor M Pérez‐Pico: we certify that we have no affiliations with or involvement in any organization or entity with a direct financial interest in the subject matter of this Cochrane Review (for example, employment, consultancy, stock ownership, honoraria, or expert testimony).
Acknowledgements
The editorial base for the Cochrane Infectious Diseases Group is funded by UK aid from the UK Government for the benefit of low‐ and middle‐income countries (Grant: 5242).
Version history
| Published | Title | Stage | Authors | Version |
| 2018 Apr 25 | Smectite for acute infectious diarrhoea in children | Review | Giordano Pérez‐Gaxiola, Carlos A Cuello‐García, Ivan D Florez, Víctor M Pérez‐Pico | |
| 2015 Feb 10 | Smectite for acute infectious diarrhoea in children | Protocol | Giordano Pérez‐Gaxiola, Carlos A Cuello‐García, Victor Pérez‐Pico | |
Differences between protocol and review
We added Ivan D Florez as an author.
Keywords
MeSH
Medical Subject Headings (MeSH) Keywords
Medical Subject Headings Check Words
Adolescent; Child; Child, Preschool; Humans; Infant;
PICO
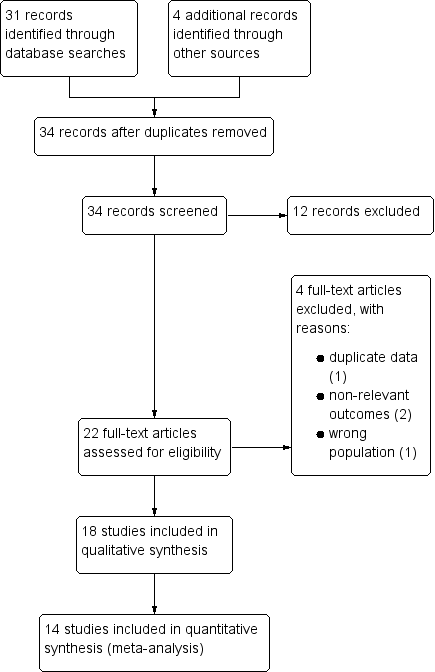
Study flow diagram.

‘Risk of bias' graph: review authors' judgements about each risk of bias item presented as percentages across all included studies.

‘Risk of bias' summary: review authors' judgements about each risk of bias item for each included study.

Forest plot of comparison: 1 Diarrhoea primary outcomes, outcome: 1.1 Mean duration of diarrhoea (hours).
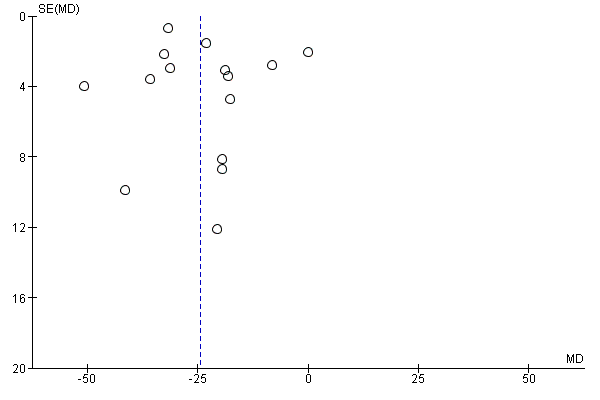
Funnel plot of comparison: 1 Diarrhoea primary outcomes, outcome: 1.1 Mean duration of diarrhoea (hours).

Forest plot of comparison: 1 Diarrhoea primary outcomes, outcome: 1.2 Mean duration of diarrhoea, studies including only infants < 2 years.

Forest plot of comparison: 1 Diarrhoea primary outcomes, outcome: 1.3 Clinical resolution at day 3 after starting treatment.

Forest plot of comparison: 2 Diarrhoea secondary outcomes, outcome: 2.1 Stool frequency, measured as number of depositions per day, on day 3 after starting treatment.
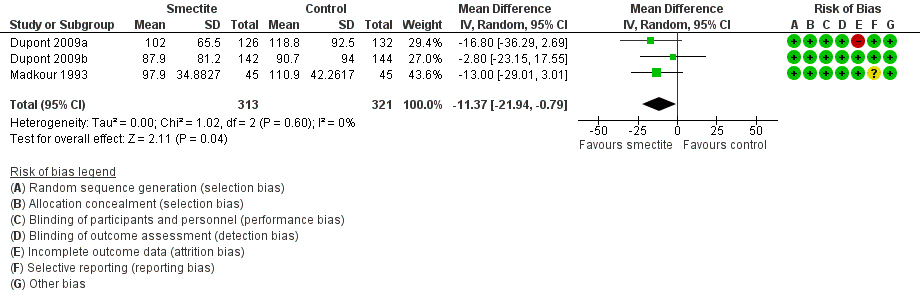
Forest plot of comparison: 2 Diarrhoea secondary outcomes, outcome: 2.2 Stool output, measured in g/kg at 72 hours.
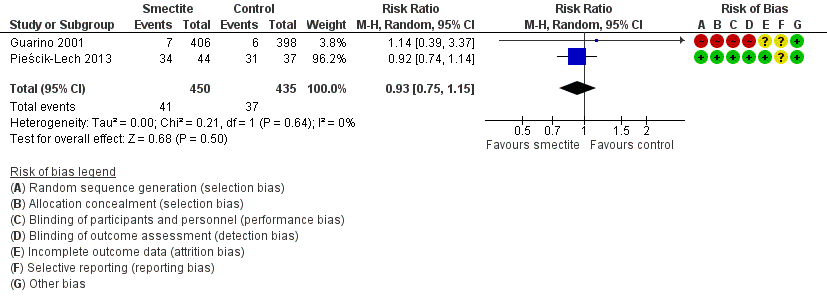
Forest plot of comparison: 2 Diarrhoea secondary outcomes, outcome: 2.3 Need for hospitalization.
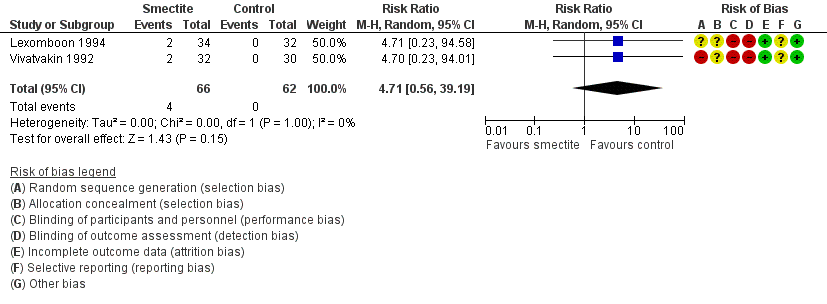
Forest plot of comparison: 2 Diarrhoea secondary outcomes, outcome: 2.5 Constipation.

Comparison 1 Diarrhoea primary outcomes, Outcome 1 Mean duration of diarrhoea.

Comparison 1 Diarrhoea primary outcomes, Outcome 2 Mean duration of diarrhoea, studies including only infants < 2 years.

Comparison 1 Diarrhoea primary outcomes, Outcome 3 Clinical resolution at day 3 after starting treatment.

Comparison 2 Diarrhoea secondary outcomes, Outcome 1 Stool frequency, measured as number of depositions per day, on day 3 after starting treatment.
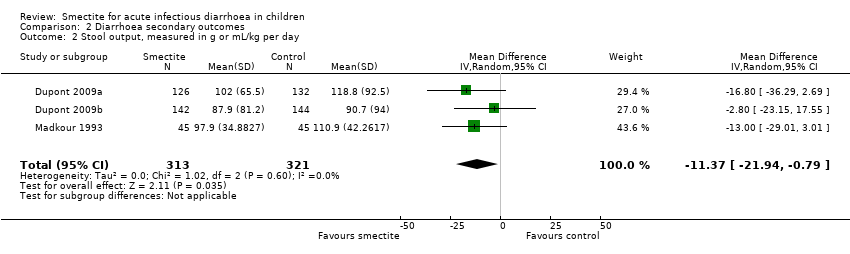
Comparison 2 Diarrhoea secondary outcomes, Outcome 2 Stool output, measured in g or mL/kg per day.
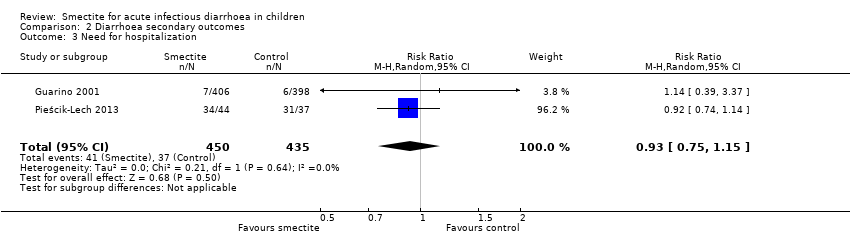
Comparison 2 Diarrhoea secondary outcomes, Outcome 3 Need for hospitalization.
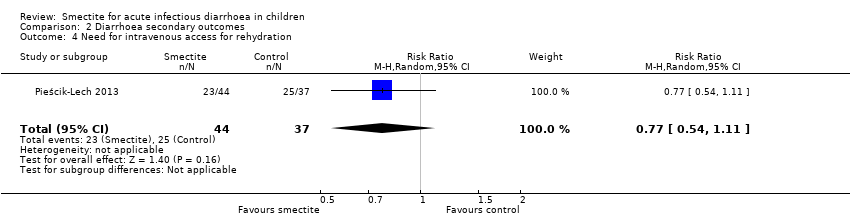
Comparison 2 Diarrhoea secondary outcomes, Outcome 4 Need for intravenous access for rehydration.

Comparison 2 Diarrhoea secondary outcomes, Outcome 5 Constipation.
| Smectite compared to control for acute infectious diarrhoea in children | ||||||
| Patient or population: acute infectious diarrhoea in children | ||||||
| Outcomes | Anticipated absolute effects* (95% CI) | Relative effect | Number of participants | Certainty of the evidence | Comments (compared with control) | |
| Risk with control | Risk with smectite | |||||
| Duration of diarrhoea | The mean duration of diarrhoea ranged from 32.6 to 118.92 hours | MD 24.38 hours fewer | ‐ | 2209 | ⊕⊕⊝⊝ | Smectite may reduce the duration of diarrhoea |
| Clinical resolution at day 3 | Study population | RR 2.10 | 312 | ⊕⊕⊝⊝ | Smectite may increase the resolution of diarrhoea by the third day | |
| 342 per 1000 | 718 per 1000 | |||||
| Stool frequency assessed with: clinical assessment as number of depositions per day | The mean stool frequency was 0 depositions per day | MD 1.33 depositions per day fewer | ‐ | 954 | ⊕⊝⊝⊝ | We are uncertain whether or not smectite reduces stool frequency |
| Stool output assessed with: grams of stool output per kg of body weight in a 72‐hour period | The mean stool output ranged from 90.7 to 118.8 g/kg | MD 11.37 g/kg fewer | ‐ | 634 | ⊕⊕⊝⊝ | Smectite may decrease stool output |
| Need for hospitalization | Study population | RR 0.93 | 885 | ⊕⊕⊝⊝ | Smectite may make little or no difference in the need for hospitalization | |
| 85 per 1000 | 79 per 1000 | |||||
| Need for intravenous access for rehydration | Study population | RR 0.77 | 81 | ⊕⊕⊕⊝ | Smectite probably makes little or no difference in the need for intravenoous access | |
| 676 per 1000 | 520 per 1000 | |||||
| Adverse events – constipation | Study population | RR 4.71 | 128 | ⊕⊕⊝⊝ | Smectite may make little or no difference in the appeareance of adverse events | |
| 0 per 1000 | 0 per 1000 | |||||
| Death | ‐ | ‐ | ‐ | ‐ | ‐ | There were no deaths in the included studies |
| Serious adverse events | ‐ | ‐ | ‐ | ‐ | ‐ | There were no serious side effects in the included studies |
| *The risk in the intervention group (and its 95% CI) is based on the assumed risk in the comparison group and the relative effect of the intervention (and its 95% CI). Abbreviations: CI: confidence interval; MD: mean difference; RCT: randomized controlled trial; RR: risk ratio | ||||||
| GRADE Working Group grades of evidence | ||||||
| 1Four trials are quasi‐randomized and without adequate blinding of participants. | ||||||
| Outcome or subgroup title | No. of studies | No. of participants | Statistical method | Effect size |
| 1 Mean duration of diarrhoea Show forest plot | 15 | 2209 | Mean Difference (IV, Random, 95% CI) | ‐24.38 [‐30.91, ‐17.85] |
| 2 Mean duration of diarrhoea, studies including only infants < 2 years Show forest plot | 6 | 441 | Mean Difference (IV, Random, 95% CI) | ‐24.11 [‐31.35, ‐16.87] |
| 3 Clinical resolution at day 3 after starting treatment Show forest plot | 5 | 312 | Risk Ratio (M‐H, Random, 95% CI) | 2.10 [1.30, 3.39] |
| Outcome or subgroup title | No. of studies | No. of participants | Statistical method | Effect size |
| 1 Stool frequency, measured as number of depositions per day, on day 3 after starting treatment Show forest plot | 3 | 954 | Mean Difference (IV, Random, 95% CI) | ‐1.33 [‐2.28, ‐0.38] |
| 2 Stool output, measured in g or mL/kg per day Show forest plot | 3 | 634 | Mean Difference (IV, Random, 95% CI) | ‐11.37 [‐21.94, ‐0.79] |
| 3 Need for hospitalization Show forest plot | 2 | 885 | Risk Ratio (M‐H, Random, 95% CI) | 0.93 [0.75, 1.15] |
| 4 Need for intravenous access for rehydration Show forest plot | 1 | 81 | Risk Ratio (M‐H, Random, 95% CI) | 0.77 [0.54, 1.11] |
| 5 Constipation Show forest plot | 2 | 128 | Risk Ratio (M‐H, Random, 95% CI) | 4.71 [0.56, 39.19] |