| Smectite compared to control for acute infectious diarrhoea in children |
| Patient or population: acute infectious diarrhoea in children
Setting: hospital and outpatients
Intervention: smectite
Comparison: control |
| Duration of diarrhoea
assessed with: clinical and parental assessment, measured in total hours
Follow‐up: mean 1 week | The mean duration of diarrhoea ranged from 32.6 to 118.92 hours | MD 24.38 hours fewer
(30.91 fewer to 17.85 fewer) | ‐ | 2209
(14 RCTs) | ⊕⊕⊝⊝
LOW1,2 | Smectite may reduce the duration of diarrhoea |
| Clinical resolution at day 3
assessed with: clinical assessment by parents and clinicians
Follow‐up: mean 3 days | Study population | RR 2.10
(1.30 to 3.39) | 312
(5 RCTs) | ⊕⊕⊝⊝
LOW3,4 | Smectite may increase the resolution of diarrhoea by the third day |
| 342 per 1000 | 718 per 1000
(445 to 1000) |
| Stool frequency assessed with: clinical assessment as number of depositions per day
Follow‐up: mean 1 week | The mean stool frequency was 0 depositions per day | MD 1.33 depositions per day fewer
(2.28 fewer to 0.38 fewer) | ‐ | 954
(3 RCTs) | ⊕⊝⊝⊝
VERY LOW5,6,7 | We are uncertain whether or not smectite reduces stool frequency |
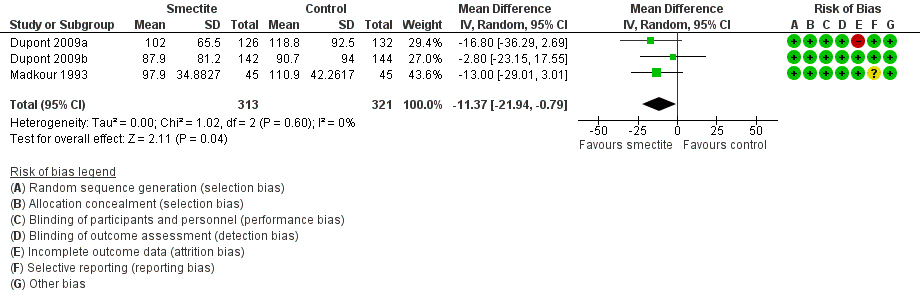
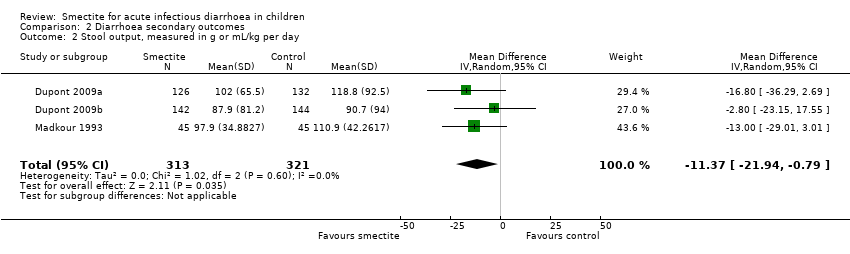
| Stool output assessed with: grams of stool output per kg of body weight in a 72‐hour period
Follow‐up: mean 1 week | The mean stool output ranged from 90.7 to 118.8 g/kg | MD 11.37 g/kg fewer
(21.94 fewer to 0.79 fewer) | ‐ | 634
(3 RCTs) | ⊕⊕⊝⊝
LOW7,8 | Smectite may decrease stool output |
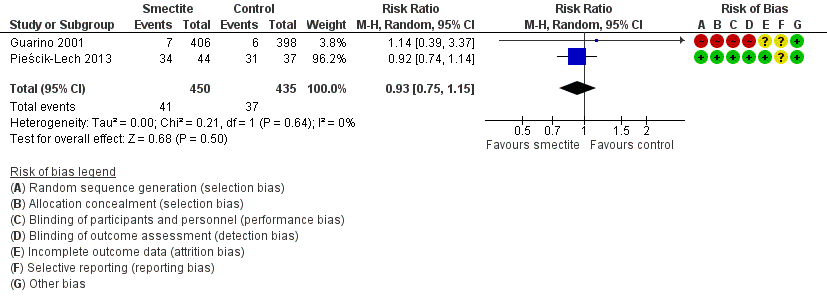
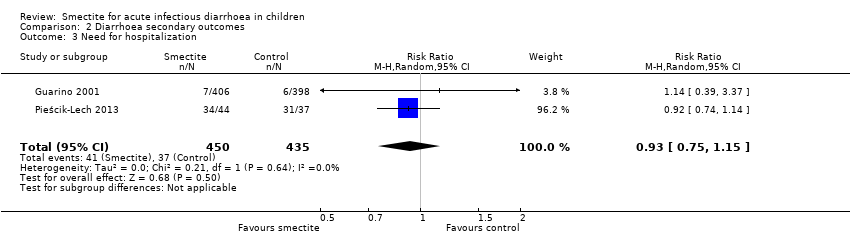
| Need for hospitalization
Follow‐up: mean 1 week | Study population | RR 0.93
(0.75 to 1.15) | 885
(2 RCTs) | ⊕⊕⊝⊝
LOW6,9 | Smectite may make little or no difference in the need for hospitalization |
| 85 per 1000 | 79 per 1000
(64 to 98) |
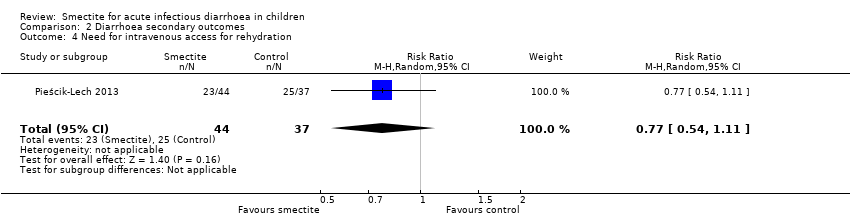
| Need for intravenous access for rehydration
Follow‐up: mean 1 week | Study population | RR 0.77
(0.54 to 1.11) | 81
(1 RCT) | ⊕⊕⊕⊝
MODERATE9 | Smectite probably makes little or no difference in the need for intravenoous access |
| 676 per 1000 | 520 per 1000
(365 to 750) |
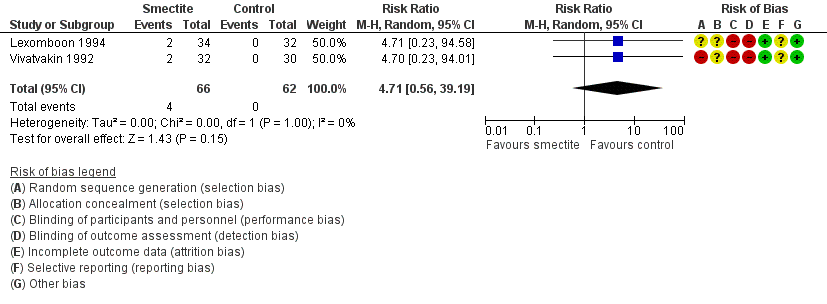
| Adverse events – constipation
Follow‐up: mean 1 week | Study population | RR 4.71
(0.56 to 39.19) | 128
(2 RCTs) | ⊕⊕⊝⊝
LOW3,9 | Smectite may make little or no difference in the appeareance of adverse events |
| 0 per 1000 | 0 per 1000
(0 to 0) |
| Death | ‐ | ‐ | ‐ | ‐ | ‐ | There were no deaths in the included studies |
| Serious adverse events | ‐ | ‐ | ‐ | ‐ | ‐ | There were no serious side effects in the included studies |
| *The risk in the intervention group (and its 95% CI) is based on the assumed risk in the comparison group and the relative effect of the intervention (and its 95% CI). Abbreviations: CI: confidence interval; MD: mean difference; RCT: randomized controlled trial; RR: risk ratio |
| GRADE Working Group grades of evidence
High certainty: We are very confident that the true effect lies close to that of the estimate of the effect.
Moderate certainty: We are moderately confident in the effect estimate: the true effect is likely to be close to the estimate of the effect, but there is a possibility that it is substantially different.
Low certainty: Our confidence in the effect estimate is limited: the true effect may be substantially different from the estimate of the effect.
Very low certainty: We have very little confidence in the effect estimate: the true effect is likely to be substantially different from the estimate of effect. |