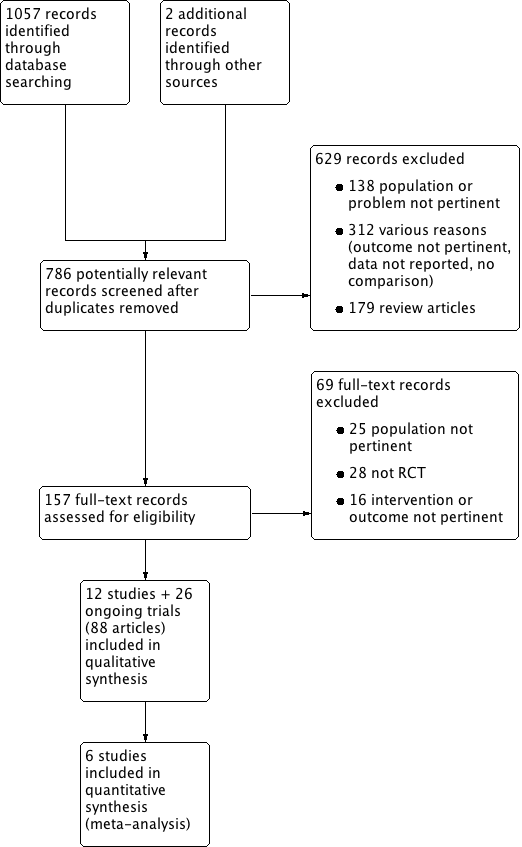
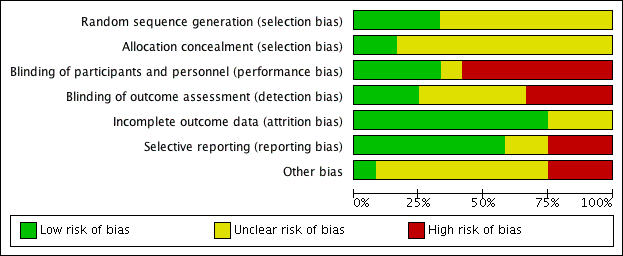
Scolaris Content Display Scolaris Content Display

Study flow diagram.
Figuras y tablas -
Figure 1

Study flow diagram.

Risk of bias graph: review authors' judgements about each risk of bias item presented as percentages across all included studies.
Figuras y tablas -
Figure 2

Risk of bias graph: review authors' judgements about each risk of bias item presented as percentages across all included studies.

Risk of bias summary: review authors' judgements about each risk of bias item for each included study.
Figuras y tablas -
Figure 3

Risk of bias summary: review authors' judgements about each risk of bias item for each included study.

Comparison 1 Renal denervation vs. sham/standard therapy, Outcome 1 Myocardial infarction.
Figuras y tablas -
Analysis 1.1

Comparison 1 Renal denervation vs. sham/standard therapy, Outcome 1 Myocardial infarction.

Comparison 1 Renal denervation vs. sham/standard therapy, Outcome 2 ischaemic stroke.
Figuras y tablas -
Analysis 1.2

Comparison 1 Renal denervation vs. sham/standard therapy, Outcome 2 ischaemic stroke.

Comparison 1 Renal denervation vs. sham/standard therapy, Outcome 3 unstable angina.
Figuras y tablas -
Analysis 1.3

Comparison 1 Renal denervation vs. sham/standard therapy, Outcome 3 unstable angina.

Comparison 1 Renal denervation vs. sham/standard therapy, Outcome 4 systolic 24‐hour ABPM.
Figuras y tablas -
Analysis 1.4

Comparison 1 Renal denervation vs. sham/standard therapy, Outcome 4 systolic 24‐hour ABPM.

Comparison 1 Renal denervation vs. sham/standard therapy, Outcome 5 diastolic 24‐hour ABPM.
Figuras y tablas -
Analysis 1.5

Comparison 1 Renal denervation vs. sham/standard therapy, Outcome 5 diastolic 24‐hour ABPM.

Comparison 1 Renal denervation vs. sham/standard therapy, Outcome 6 systolic office BP.
Figuras y tablas -
Analysis 1.6

Comparison 1 Renal denervation vs. sham/standard therapy, Outcome 6 systolic office BP.

Comparison 1 Renal denervation vs. sham/standard therapy, Outcome 7 diastolic office BP.
Figuras y tablas -
Analysis 1.7

Comparison 1 Renal denervation vs. sham/standard therapy, Outcome 7 diastolic office BP.

Comparison 1 Renal denervation vs. sham/standard therapy, Outcome 8 serum creatinine.
Figuras y tablas -
Analysis 1.8

Comparison 1 Renal denervation vs. sham/standard therapy, Outcome 8 serum creatinine.

Comparison 1 Renal denervation vs. sham/standard therapy, Outcome 9 eGFR/creatinine clearance.
Figuras y tablas -
Analysis 1.9

Comparison 1 Renal denervation vs. sham/standard therapy, Outcome 9 eGFR/creatinine clearance.

Comparison 1 Renal denervation vs. sham/standard therapy, Outcome 10 bradycardia.
Figuras y tablas -
Analysis 1.10

Comparison 1 Renal denervation vs. sham/standard therapy, Outcome 10 bradycardia.

Comparison 1 Renal denervation vs. sham/standard therapy, Outcome 11 femoral artery pseudoaneurysm.
Figuras y tablas -
Analysis 1.11

Comparison 1 Renal denervation vs. sham/standard therapy, Outcome 11 femoral artery pseudoaneurysm.

Comparison 1 Renal denervation vs. sham/standard therapy, Outcome 12 flank pain.
Figuras y tablas -
Analysis 1.12

Comparison 1 Renal denervation vs. sham/standard therapy, Outcome 12 flank pain.

Comparison 1 Renal denervation vs. sham/standard therapy, Outcome 13 hypotensive episodes.
Figuras y tablas -
Analysis 1.13

Comparison 1 Renal denervation vs. sham/standard therapy, Outcome 13 hypotensive episodes.

Comparison 1 Renal denervation vs. sham/standard therapy, Outcome 14 hypertensive crisis.
Figuras y tablas -
Analysis 1.14

Comparison 1 Renal denervation vs. sham/standard therapy, Outcome 14 hypertensive crisis.

Comparison 1 Renal denervation vs. sham/standard therapy, Outcome 15 hyperkalemia.
Figuras y tablas -
Analysis 1.15

Comparison 1 Renal denervation vs. sham/standard therapy, Outcome 15 hyperkalemia.

Renal denervation versus sham denervation or standard treatment

Patient or population: people with resistant hypertension
Setting: Outpatient
Intervention: renal denervation
Comparison: sham denervation or standard treatment

Outcomes

Illustrative comparative risks* (95% CI)

Effect estimate
(95% CI)

No of Participants
(studies)

Quality of the evidence
(GRADE)

Assumed risk

Corresponding risk

Sham denervation/

Standard treatment

Renal denervation

myocardial infarction

14 per 1000

18 per 1000 (6 to 54)

RR 1.31 (0.45 to 3.84)

742

(4 studies)

⊕⊕⊝⊝
low1,2

ischaemic stroke

12 per 1000

14 per 1000 (4 to 45)

RR 1.15 (0.36 to 3.72)

823

(4 studies)

⊕⊕⊝⊝
low1,2

unstable angina

20 per 1000

12 per 1000 (2 to 101)

RR 0.63 (0.08 to 5.06)

201

(2 studies)

⊕⊕⊝⊝
low1,2

systolic 24‐hour ABPM (mmHg)

MD 0.28 (‐3.74 to 4.29)

797
(5 studies)

⊕⊕⊕⊝
moderate1

diastolic 24‐hour ABPM (mmHg)

MD 0.93 (‐4.50 to 6.36)

756
(4 studies)

⊕⊕⊕⊝
moderate1

systolic office BP (mmHg)

MD ‐4.08 (‐15.26 to 7.11)

886
(6 studies)

⊕⊕⊕⊝
moderate1

diastolic office BP (mmHg)

MD ‐1.30 (‐7.30 to 4.69)

845
(5 studies)

⊕⊕⊕⊝
moderate1

eGFR or creatinine clearance (mL/min/1.73m²)

MD ‐2.09 (‐8.12 to 3.95)

837
(4 studies)

⊕⊕⊕⊝
moderate1

*The assumed risk is the observed risk in the reference (control) group. The corresponding risk (and its 95% confidence interval) is based on the assumed risk in the comparison group and the relative effect of the intervention (and its 95% CI).

GRADE Working Group grades of evidence
High quality: Further research is very unlikely to change our confidence in the estimate of effect.
Moderate quality: Further research is likely to have an important impact on our confidence in the estimate of effect and may change the estimate.
Low quality: Further research is very likely to have an important impact on our confidence in the estimate of effect and is likely to change the estimate.
Very low quality: We are very uncertain about the estimate.

Legend
ABPM: ambulatory blood pressure monitoring; BP: blood pressure; CI: Confidence interval; CV: cardiovascular; NA: information not available (data sparse or absent); eGFR: estimated glomerular filtration rate; MD: mean difference; RR: Risk Ratio.

1. Wide confidence intervals.

2. Only reported by less than half of the studies.

Figuras y tablas -
Comparison 1. Renal denervation vs. sham/standard therapy

Outcome or subgroup title

No. of studies

No. of participants

Statistical method

Effect size

1 Myocardial infarction Show forest plot

4

742

Risk Ratio (M‐H, Random, 95% CI)

1.31 [0.45, 3.84]

2 ischaemic stroke Show forest plot

4

823

Risk Ratio (M‐H, Random, 95% CI)

1.15 [0.36, 3.72]

3 unstable angina Show forest plot

2

201

Risk Ratio (M‐H, Random, 95% CI)

0.63 [0.08, 5.06]

4 systolic 24‐hour ABPM Show forest plot

5

797

Mean Difference (IV, Random, 95% CI)

0.28 [‐3.74, 4.29]

5 diastolic 24‐hour ABPM Show forest plot

4

756

Mean Difference (IV, Random, 95% CI)

0.93 [‐4.50, 6.36]

6 systolic office BP Show forest plot

6

886

Mean Difference (IV, Random, 95% CI)

‐4.08 [‐15.26, 7.11]

7 diastolic office BP Show forest plot

5

845

Mean Difference (IV, Random, 95% CI)

‐1.30 [‐7.30, 4.69]

8 serum creatinine Show forest plot

3

736

Mean Difference (IV, Random, 95% CI)

0.01 [‐0.12, 0.14]

9 eGFR/creatinine clearance Show forest plot

4

837

Mean Difference (IV, Random, 95% CI)

‐2.09 [‐8.12, 3.95]

10 bradycardia Show forest plot

3

220

Risk Ratio (M‐H, Random, 95% CI)

6.63 [1.19, 36.84]

11 femoral artery pseudoaneurysm Show forest plot

2

201

Risk Ratio (M‐H, Random, 95% CI)

3.96 [0.44, 35.22]

12 flank pain Show forest plot

2

199

Risk Ratio (M‐H, Random, 95% CI)

4.30 [0.48, 38.28]

13 hypotensive episodes Show forest plot

2

119

Risk Ratio (M‐H, Random, 95% CI)

0.67 [0.07, 6.64]

14 hypertensive crisis Show forest plot

3

722

Risk Ratio (M‐H, Random, 95% CI)

0.71 [0.35, 1.45]

15 hyperkalemia Show forest plot

2

200

Risk Ratio (M‐H, Random, 95% CI)

0.48 [0.01, 21.33]

Figuras y tablas -
Comparison 1. Renal denervation vs. sham/standard therapy