Denervación renal para la hipertensión resistente
Información
- DOI:
- https://doi.org/10.1002/14651858.CD011499.pub2Copiar DOI

- Base de datos:
-
- Cochrane Database of Systematic Reviews
- Versión publicada:
-
- 21 febrero 2017see what's new
- Tipo:
-
- Intervention
- Etapa:
-
- Review
- Grupo Editorial Cochrane:
-
Grupo Cochrane de Hipertensión
- Copyright:
-
- Copyright © 2017 The Cochrane Collaboration. Published by John Wiley & Sons, Ltd.
Cifras del artículo
Altmetric:
Citado por:
Autores
Contributions of authors
-
Drafting the protocol: GC, DB, LR
-
Study selection: AP, LR
-
Extracting data from studies: AP, LR
-
Entering data into Review Manager: AP, LR
-
Carrying out the analysis: DB, AP
-
Interpreting the analysis: DB, AP, GC
-
Drafting the final review: DB, GC, AP, LR
-
Resolution of disagreements: DB
-
Updating the review: DB, LR, AP, GC
Sources of support
Internal sources
-
Department of Medical and Surgical Sciences, Nephrology and Dialysis Unit, University 'Magna Graecia', Catanzaro, Italy.
-
Institute of Clinical Physiology, CNR ‐ Italian National Council of Research, Reggio Calabria, Italy.
External sources
-
No sources of support supplied
Declarations of interest
DB: in 2012, received an Honorary Fellowship from the Cochrane Renal Group as Fellow of the European Renal Best Practice (ERBP) group.
AP: None known.
GC: None known.
LR: None known.
Acknowledgements
We thank Dr Murray Esler, Dr Michel Azizi, and Dr Jan Rosa for providing additional trial data. We would also like to thank the Cochrane Hypertension Group, particularly Mr Ciprian Jauca and Mr Douglas Salzwedel, for their valuable support, and the referees for their feedback and advice during the preparation of the review.
Version history
| Published | Title | Stage | Authors | Version |
| 2021 Nov 22 | Renal denervation for resistant hypertension | Review | Anna Pisano, Luigi Francesco Iannone, Antonio Leo, Emilio Russo, Giuseppe Coppolino, Davide Bolignano | |
| 2017 Feb 21 | Renal denervation for resistant hypertension | Review | Giuseppe Coppolino, Anna Pisano, Laura Rivoli, Davide Bolignano | |
| 2015 Jan 28 | Renal denervation for resistant hypertension | Protocol | Giuseppe Coppolino, Laura Rivoli, Davide Bolignano | |
Differences between protocol and review
Authors order and contribution was updated after finalizing the last revision of the review to best reflect individual contributions to this new version.
Keywords
MeSH
Medical Subject Headings (MeSH) Keywords
Medical Subject Headings Check Words
Humans;
PICO
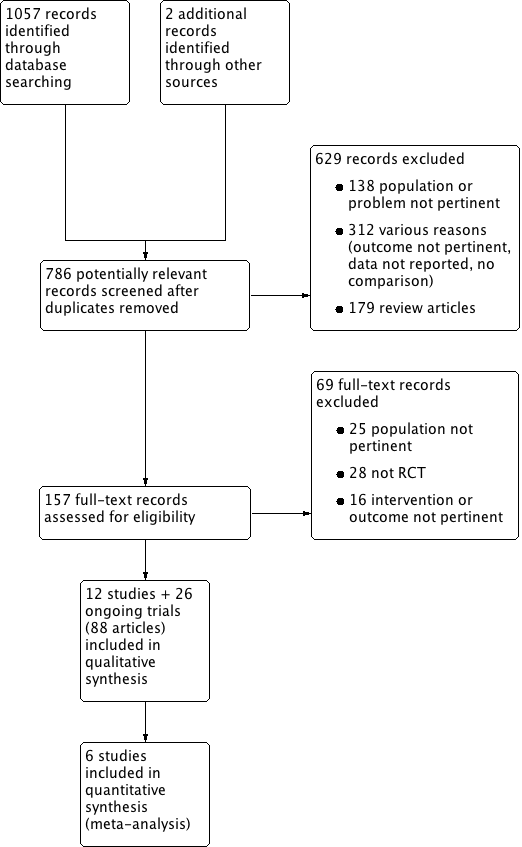
Study flow diagram.
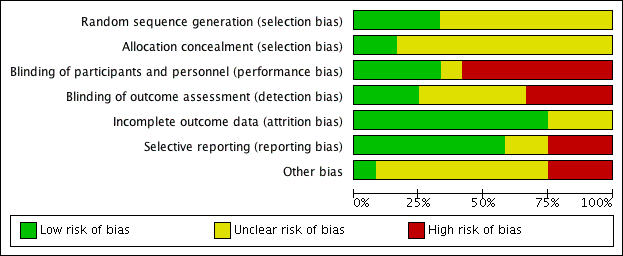
Risk of bias graph: review authors' judgements about each risk of bias item presented as percentages across all included studies.

Risk of bias summary: review authors' judgements about each risk of bias item for each included study.

Comparison 1 Renal denervation vs. sham/standard therapy, Outcome 1 Myocardial infarction.

Comparison 1 Renal denervation vs. sham/standard therapy, Outcome 2 ischaemic stroke.
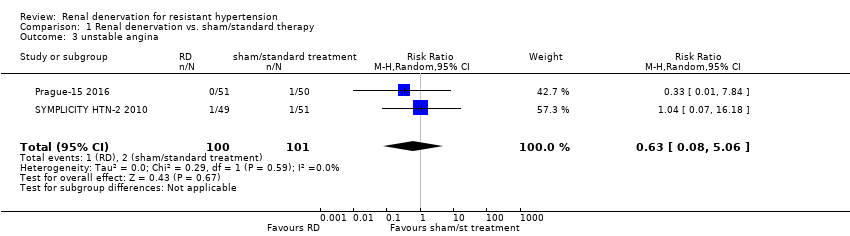
Comparison 1 Renal denervation vs. sham/standard therapy, Outcome 3 unstable angina.

Comparison 1 Renal denervation vs. sham/standard therapy, Outcome 4 systolic 24‐hour ABPM.

Comparison 1 Renal denervation vs. sham/standard therapy, Outcome 5 diastolic 24‐hour ABPM.
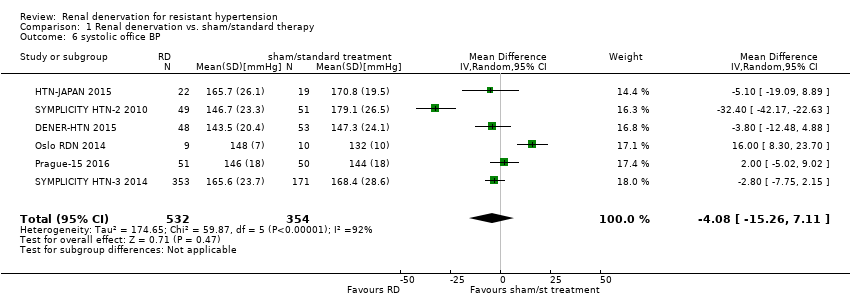
Comparison 1 Renal denervation vs. sham/standard therapy, Outcome 6 systolic office BP.

Comparison 1 Renal denervation vs. sham/standard therapy, Outcome 7 diastolic office BP.

Comparison 1 Renal denervation vs. sham/standard therapy, Outcome 8 serum creatinine.

Comparison 1 Renal denervation vs. sham/standard therapy, Outcome 9 eGFR/creatinine clearance.

Comparison 1 Renal denervation vs. sham/standard therapy, Outcome 10 bradycardia.
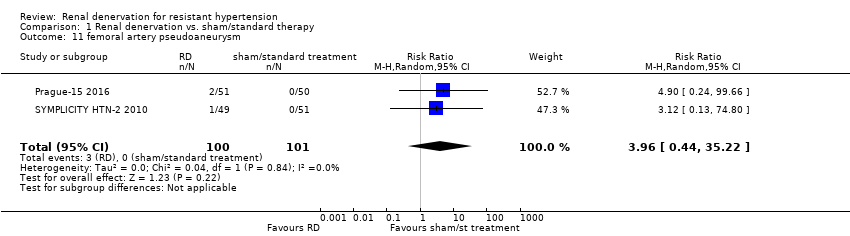
Comparison 1 Renal denervation vs. sham/standard therapy, Outcome 11 femoral artery pseudoaneurysm.
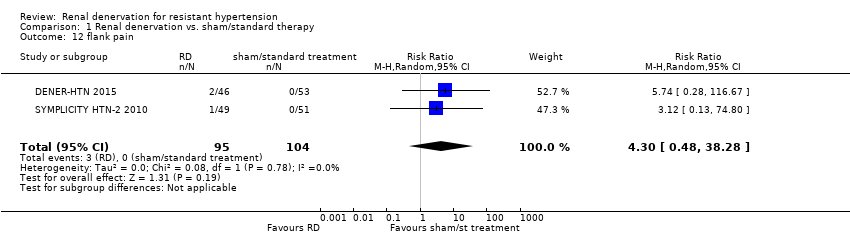
Comparison 1 Renal denervation vs. sham/standard therapy, Outcome 12 flank pain.

Comparison 1 Renal denervation vs. sham/standard therapy, Outcome 13 hypotensive episodes.
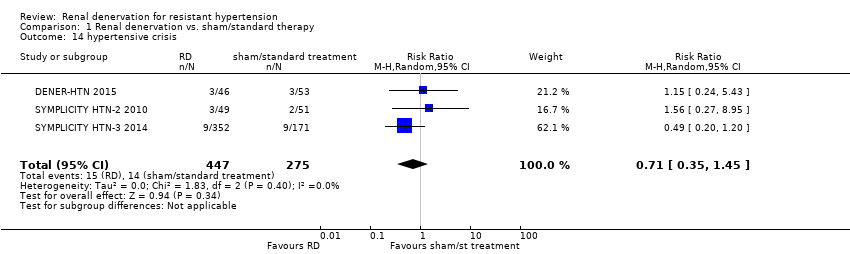
Comparison 1 Renal denervation vs. sham/standard therapy, Outcome 14 hypertensive crisis.

Comparison 1 Renal denervation vs. sham/standard therapy, Outcome 15 hyperkalemia.
| Renal denervation versus sham denervation or standard treatment | |||||
| Patient or population: people with resistant hypertension | |||||
| Outcomes | Illustrative comparative risks* (95% CI) | Effect estimate | No of Participants | Quality of the evidence | |
| Assumed risk | Corresponding risk | ||||
| Sham denervation/ Standard treatment | Renal denervation | ||||
| myocardial infarction | 14 per 1000 | 18 per 1000 (6 to 54) | RR 1.31 (0.45 to 3.84) | 742 (4 studies) | ⊕⊕⊝⊝ |
| ischaemic stroke | 12 per 1000 | 14 per 1000 (4 to 45) | RR 1.15 (0.36 to 3.72) | 823 (4 studies) | ⊕⊕⊝⊝ |
| unstable angina | 20 per 1000 | 12 per 1000 (2 to 101) | RR 0.63 (0.08 to 5.06) | 201 (2 studies) | ⊕⊕⊝⊝ |
| systolic 24‐hour ABPM (mmHg) | ‐ | ‐ | MD 0.28 (‐3.74 to 4.29) | 797 | ⊕⊕⊕⊝ |
| diastolic 24‐hour ABPM (mmHg) | ‐ | ‐ | MD 0.93 (‐4.50 to 6.36) | 756 | ⊕⊕⊕⊝ |
| systolic office BP (mmHg) | ‐ | ‐ | MD ‐4.08 (‐15.26 to 7.11) | 886 | ⊕⊕⊕⊝ |
| diastolic office BP (mmHg) | ‐ | ‐ | MD ‐1.30 (‐7.30 to 4.69) | 845 | ⊕⊕⊕⊝ |
| eGFR or creatinine clearance (mL/min/1.73m²) | ‐ | ‐ | MD ‐2.09 (‐8.12 to 3.95) | 837 | ⊕⊕⊕⊝ |
| *The assumed risk is the observed risk in the reference (control) group. The corresponding risk (and its 95% confidence interval) is based on the assumed risk in the comparison group and the relative effect of the intervention (and its 95% CI). GRADE Working Group grades of evidence Legend 1. Wide confidence intervals. 2. Only reported by less than half of the studies. | |||||
| Outcome or subgroup title | No. of studies | No. of participants | Statistical method | Effect size |
| 1 Myocardial infarction Show forest plot | 4 | 742 | Risk Ratio (M‐H, Random, 95% CI) | 1.31 [0.45, 3.84] |
| 2 ischaemic stroke Show forest plot | 4 | 823 | Risk Ratio (M‐H, Random, 95% CI) | 1.15 [0.36, 3.72] |
| 3 unstable angina Show forest plot | 2 | 201 | Risk Ratio (M‐H, Random, 95% CI) | 0.63 [0.08, 5.06] |
| 4 systolic 24‐hour ABPM Show forest plot | 5 | 797 | Mean Difference (IV, Random, 95% CI) | 0.28 [‐3.74, 4.29] |
| 5 diastolic 24‐hour ABPM Show forest plot | 4 | 756 | Mean Difference (IV, Random, 95% CI) | 0.93 [‐4.50, 6.36] |
| 6 systolic office BP Show forest plot | 6 | 886 | Mean Difference (IV, Random, 95% CI) | ‐4.08 [‐15.26, 7.11] |
| 7 diastolic office BP Show forest plot | 5 | 845 | Mean Difference (IV, Random, 95% CI) | ‐1.30 [‐7.30, 4.69] |
| 8 serum creatinine Show forest plot | 3 | 736 | Mean Difference (IV, Random, 95% CI) | 0.01 [‐0.12, 0.14] |
| 9 eGFR/creatinine clearance Show forest plot | 4 | 837 | Mean Difference (IV, Random, 95% CI) | ‐2.09 [‐8.12, 3.95] |
| 10 bradycardia Show forest plot | 3 | 220 | Risk Ratio (M‐H, Random, 95% CI) | 6.63 [1.19, 36.84] |
| 11 femoral artery pseudoaneurysm Show forest plot | 2 | 201 | Risk Ratio (M‐H, Random, 95% CI) | 3.96 [0.44, 35.22] |
| 12 flank pain Show forest plot | 2 | 199 | Risk Ratio (M‐H, Random, 95% CI) | 4.30 [0.48, 38.28] |
| 13 hypotensive episodes Show forest plot | 2 | 119 | Risk Ratio (M‐H, Random, 95% CI) | 0.67 [0.07, 6.64] |
| 14 hypertensive crisis Show forest plot | 3 | 722 | Risk Ratio (M‐H, Random, 95% CI) | 0.71 [0.35, 1.45] |
| 15 hyperkalemia Show forest plot | 2 | 200 | Risk Ratio (M‐H, Random, 95% CI) | 0.48 [0.01, 21.33] |