Mefloquina para la prevención del paludismo en embarazadas
Información
- DOI:
- https://doi.org/10.1002/14651858.CD011444.pub2Copiar DOI

- Base de datos:
-
- Cochrane Database of Systematic Reviews
- Versión publicada:
-
- 21 marzo 2018see what's new
- Tipo:
-
- Intervention
- Etapa:
-
- Review
- Grupo Editorial Cochrane:
-
Grupo Cochrane de Enfermedades infecciosas
- Copyright:
-
- Copyright © 2018 The Authors. Cochrane Database of Systematic Reviews published by John Wiley & Sons, Ltd. on behalf of The Cochrane Collaboration.
- This is an open access article under the terms of the Creative Commons Attribution‐Non‐Commercial Licence, which permits use, distribution and reproduction in any medium, provided the original work is properly cited and is not used for commercial purposes.
Cifras del artículo
Altmetric:
Citado por:
Autores
Contributions of authors
RG, JJA, FtK, and CM designed the study. RG, JJA, and FtK wrote the protocol. RG, CPD, and MP assessed trial eligibility and risk of bias. RG, CPD, and MP extracted data. RG and CPD performed analyses. RG and CPD wrote the first version of the review. All review authors interpreted trial results, contributed to writing of this review, and approved the final version of the review.
Sources of support
Internal sources
-
Barcelona Institute of Global Health (ISGlobal), Hospital Clínic‐ Universitat de Barcelona, Spain.
-
Liverpool School of Tropical Medicine, UK.
External sources
-
Department for International Development, UK.
Grant: 5242
Declarations of interest
RG, JJA, and CM are authors of two trials of mefloquine to prevent malaria in pregnancy (published in 2014) that are candidates for inclusion in this review.
MP has no known conflicts of interest.
CPD has no known conflicts of interest.
FtK has no known conflicts of interest.
Acknowledgements
We thank David Sinclair and Ragna Boerma for their contributions to protocol development and analysis inputs for this review. We thank Valérie Briand, Michel Cot, and Lise Denoeud‐Ndam for contributing unpublished data. Finally, we thank Vittoria Lutje, Anne‐Marie Stephani, and Paul Garner from the Cochrane Infectious Diseases Group, and Marta Roqué from the Iberoamerican Cochrane Centre. for support and help provided throughout all phases of development of this Cochrane Review.
The editorial base of the Cochrane Infectious Diseases Group is funded by UK aid from the UK Government for the benefit of low‐ and middle‐income countries (Grant: 5242). The views expressed in this review do not necessarily reflect UK government policy.
Version history
| Published | Title | Stage | Authors | Version |
| 2018 Nov 14 | Mefloquine for preventing malaria in pregnant women | Review | Raquel González, Clara Pons‐Duran, Mireia Piqueras, John J Aponte, Feiko O ter Kuile, Clara Menéndez | |
| 2018 Mar 21 | Mefloquine for preventing malaria in pregnant women | Review | Raquel González, Clara Pons‐Duran, Mireia Piqueras, John J Aponte, Feiko O ter Kuile, Clara Menéndez | |
| 2015 Jan 14 | Mefloquine for preventing malaria in pregnant women | Protocol | Raquel González, Ragna S Boerma, David Sinclair, John J Aponte, Feiko O ter Kuile, Clara Menéndez | |
Differences between protocol and review
In the protocol, we indicated that for the safety evaluation of mefloquine in pregnancy, we would include studies that used mefloquine to prevent malaria in pregnant women travelling to malaria‐endemic areas. However, evaluation of mefloquine safety compared with the safety of other antimalarials was not possible because of the study design employed by retrieved studies. Consequently, no observational studies met the inclusion criteria and only randomized controlled trials met the inclusion criteria of this review.
In the protocol, we listed neonatal morbidity in the first 28 days of life as an analysis outcome. Similarly, we listed mean haemoglobin and maternal anaemia during pregnancy were as outcomes. However, the included trials did not report on these effects; consequently, we were unable to perform the analyses.
One included trial reported an unexpected increased risk of mother‐to‐child transmission (MTCT) of HIV associated with IPTp‐mefloquine. Given the clinical relevance of this finding, we included the frequency of MTCT of HIV as an outcome of the analysis.
Keywords
MeSH
Medical Subject Headings (MeSH) Keywords
- Anemia [epidemiology];
- Antimalarials [adverse effects, *therapeutic use];
- Drug Combinations;
- Drug Therapy, Combination;
- HIV Seronegativity;
- Malaria [*prevention & control];
- Mefloquine [adverse effects, *therapeutic use];
- Parasitemia [drug therapy];
- Placenta Diseases [epidemiology, parasitology];
- Pregnancy Complications [chemically induced];
- Pregnancy Complications, Infectious [epidemiology, *prevention & control];
- Pyrimethamine [therapeutic use];
- Randomized Controlled Trials as Topic;
- Stillbirth;
- Sulfadoxine [therapeutic use];
- Trimethoprim, Sulfamethoxazole Drug Combination [therapeutic use];
- Vomiting [chemically induced];
Medical Subject Headings Check Words
Female; Humans; Pregnancy;
PICO

Indicators and impact of malaria infection in mothers and infants.
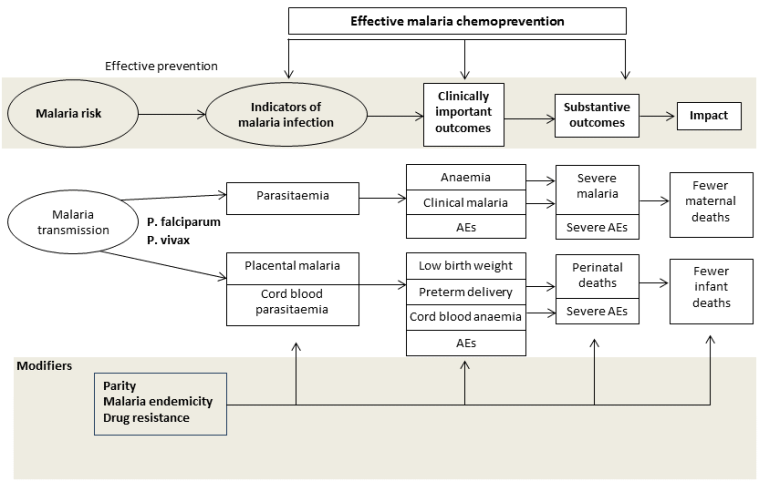
Conceptual framework of malaria chemoprevention. Reproduced under the terms of a Creative Commons Licence from Radeva‐Petrova 2014.

Study flow diagram.

‘Risk of bias' summary: review authors' judgements about each risk of bias item for each included study.

‘Risk of bias' graph: review authors' judgements about each risk of bias item presented as percentages across all included studies.

Comparison 1 Mefloquine versus sulfadoxine‐pyrimethamine, Outcome 1 Clinical malaria episodes during pregnancy.

Comparison 1 Mefloquine versus sulfadoxine‐pyrimethamine, Outcome 2 Maternal peripheral parasitaemia at delivery.

Comparison 1 Mefloquine versus sulfadoxine‐pyrimethamine, Outcome 3 Placental malaria.
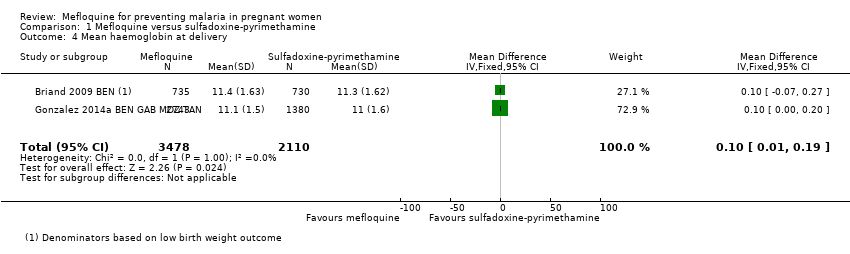
Comparison 1 Mefloquine versus sulfadoxine‐pyrimethamine, Outcome 4 Mean haemoglobin at delivery.

Comparison 1 Mefloquine versus sulfadoxine‐pyrimethamine, Outcome 5 Maternal anaemia at delivery.

Comparison 1 Mefloquine versus sulfadoxine‐pyrimethamine, Outcome 6 Severe maternal anaemia at delivery.

Comparison 1 Mefloquine versus sulfadoxine‐pyrimethamine, Outcome 7 Cord blood parasitaemia.

Comparison 1 Mefloquine versus sulfadoxine‐pyrimethamine, Outcome 8 Cord blood anaemia.

Comparison 1 Mefloquine versus sulfadoxine‐pyrimethamine, Outcome 9 Mean birth weight.

Comparison 1 Mefloquine versus sulfadoxine‐pyrimethamine, Outcome 10 Low birth weight.

Comparison 1 Mefloquine versus sulfadoxine‐pyrimethamine, Outcome 11 Low birth weight by gravidity.

Comparison 1 Mefloquine versus sulfadoxine‐pyrimethamine, Outcome 12 Prematurity.

Comparison 1 Mefloquine versus sulfadoxine‐pyrimethamine, Outcome 13 Malaria in first year of life.

Comparison 1 Mefloquine versus sulfadoxine‐pyrimethamine, Outcome 14 Hospital admissions in first year of life.
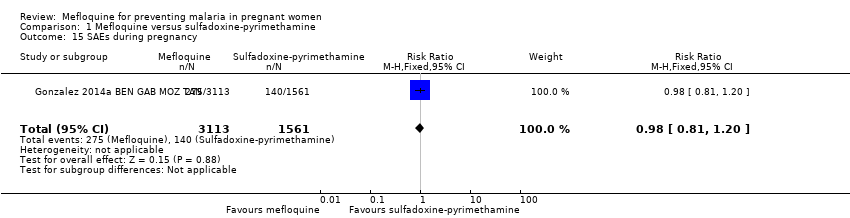
Comparison 1 Mefloquine versus sulfadoxine‐pyrimethamine, Outcome 15 SAEs during pregnancy.

Comparison 1 Mefloquine versus sulfadoxine‐pyrimethamine, Outcome 16 Stillbirths and abortions.

Comparison 1 Mefloquine versus sulfadoxine‐pyrimethamine, Outcome 17 Congenital malformations.

Comparison 1 Mefloquine versus sulfadoxine‐pyrimethamine, Outcome 18 Maternal mortality.

Comparison 1 Mefloquine versus sulfadoxine‐pyrimethamine, Outcome 19 Neonatal mortality.

Comparison 1 Mefloquine versus sulfadoxine‐pyrimethamine, Outcome 20 Infant mortality.
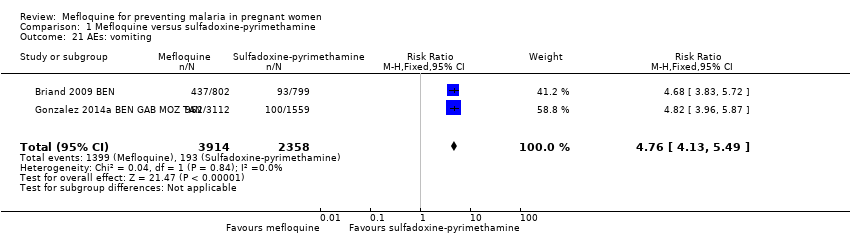
Comparison 1 Mefloquine versus sulfadoxine‐pyrimethamine, Outcome 21 AEs: vomiting.
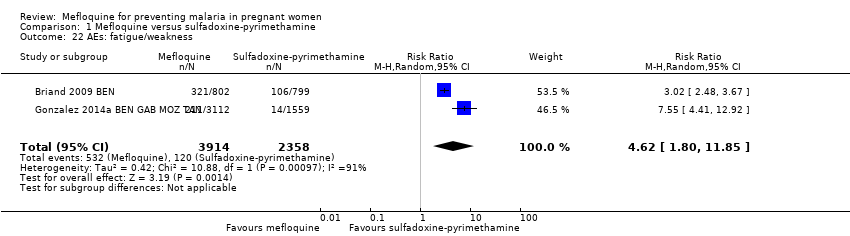
Comparison 1 Mefloquine versus sulfadoxine‐pyrimethamine, Outcome 22 AEs: fatigue/weakness.
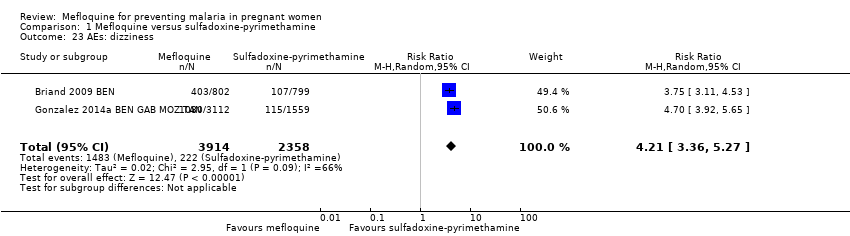
Comparison 1 Mefloquine versus sulfadoxine‐pyrimethamine, Outcome 23 AEs: dizziness.

Comparison 1 Mefloquine versus sulfadoxine‐pyrimethamine, Outcome 24 AEs: headache.

Comparison 2 Mefloquine plus cotrimoxazole versus cotrimoxazole, Outcome 1 Clinical malaria episodes during pregnancy.

Comparison 2 Mefloquine plus cotrimoxazole versus cotrimoxazole, Outcome 2 Maternal peripheral parasitaemia at delivery (PCR).

Comparison 2 Mefloquine plus cotrimoxazole versus cotrimoxazole, Outcome 3 Placental malaria (blood smear).

Comparison 2 Mefloquine plus cotrimoxazole versus cotrimoxazole, Outcome 4 Placental malaria (PCR).

Comparison 2 Mefloquine plus cotrimoxazole versus cotrimoxazole, Outcome 5 Mean haemoglobin at delivery.

Comparison 2 Mefloquine plus cotrimoxazole versus cotrimoxazole, Outcome 6 Maternal anaemia at delivery (< 9.5 g/dL).

Comparison 2 Mefloquine plus cotrimoxazole versus cotrimoxazole, Outcome 7 Maternal severe anaemia at delivery.

Comparison 2 Mefloquine plus cotrimoxazole versus cotrimoxazole, Outcome 8 Cord blood parasitaemia.

Comparison 2 Mefloquine plus cotrimoxazole versus cotrimoxazole, Outcome 9 Mean birth weight.

Comparison 2 Mefloquine plus cotrimoxazole versus cotrimoxazole, Outcome 10 Low birth weight.

Comparison 2 Mefloquine plus cotrimoxazole versus cotrimoxazole, Outcome 11 Prematurity.
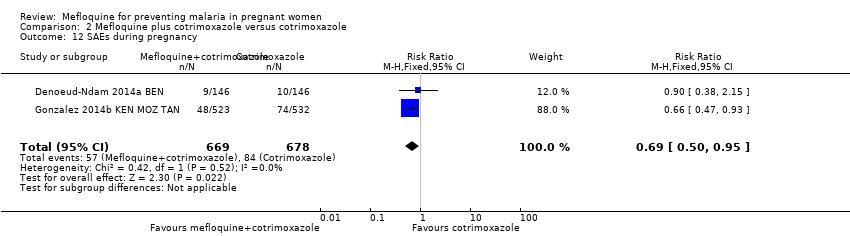
Comparison 2 Mefloquine plus cotrimoxazole versus cotrimoxazole, Outcome 12 SAEs during pregnancy.
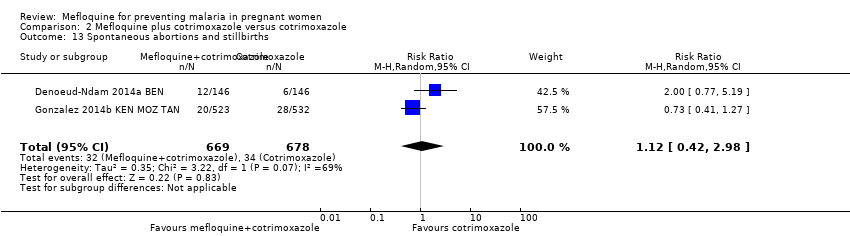
Comparison 2 Mefloquine plus cotrimoxazole versus cotrimoxazole, Outcome 13 Spontaneous abortions and stillbirths.
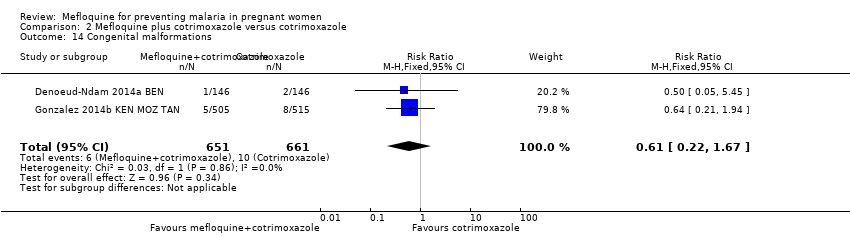
Comparison 2 Mefloquine plus cotrimoxazole versus cotrimoxazole, Outcome 14 Congenital malformations.

Comparison 2 Mefloquine plus cotrimoxazole versus cotrimoxazole, Outcome 15 Maternal mortality.
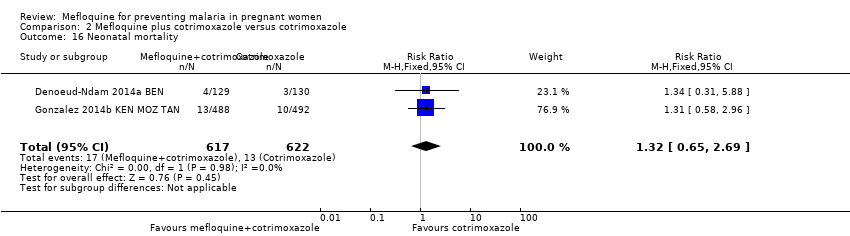
Comparison 2 Mefloquine plus cotrimoxazole versus cotrimoxazole, Outcome 16 Neonatal mortality.
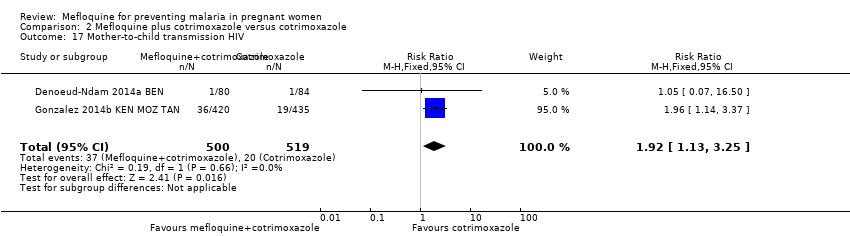
Comparison 2 Mefloquine plus cotrimoxazole versus cotrimoxazole, Outcome 17 Mother‐to‐child transmission HIV.
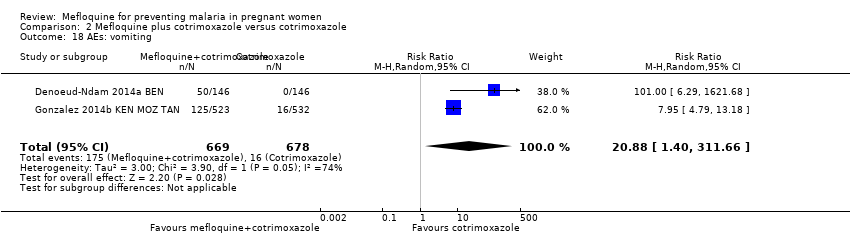
Comparison 2 Mefloquine plus cotrimoxazole versus cotrimoxazole, Outcome 18 AEs: vomiting.

Comparison 2 Mefloquine plus cotrimoxazole versus cotrimoxazole, Outcome 19 AEs: fatigue/weakness.

Comparison 2 Mefloquine plus cotrimoxazole versus cotrimoxazole, Outcome 20 AEs: dizziness.

Comparison 2 Mefloquine plus cotrimoxazole versus cotrimoxazole, Outcome 21 AEs: headache.

Comparison 3 Mefloquine versus cotrimoxazole, Outcome 1 Maternal peripheral parasitaemia at delivery (PCR).

Comparison 3 Mefloquine versus cotrimoxazole, Outcome 2 Placental malaria (PCR).

Comparison 3 Mefloquine versus cotrimoxazole, Outcome 3 Placental malaria (blood smear).
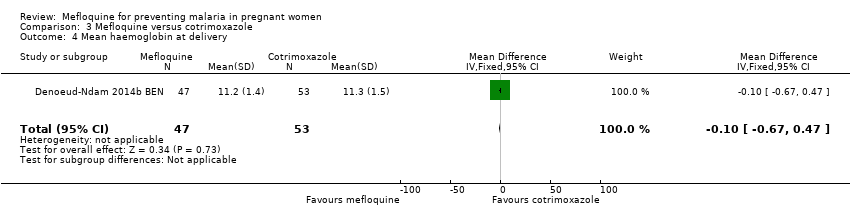
Comparison 3 Mefloquine versus cotrimoxazole, Outcome 4 Mean haemoglobin at delivery.
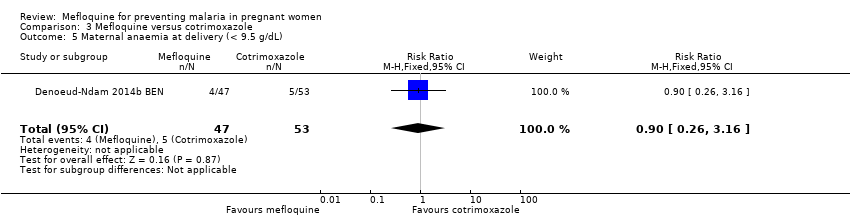
Comparison 3 Mefloquine versus cotrimoxazole, Outcome 5 Maternal anaemia at delivery (< 9.5 g/dL).
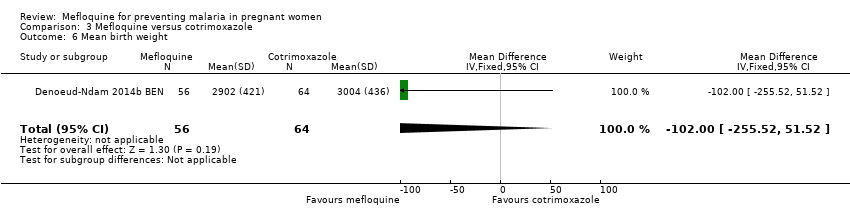
Comparison 3 Mefloquine versus cotrimoxazole, Outcome 6 Mean birth weight.
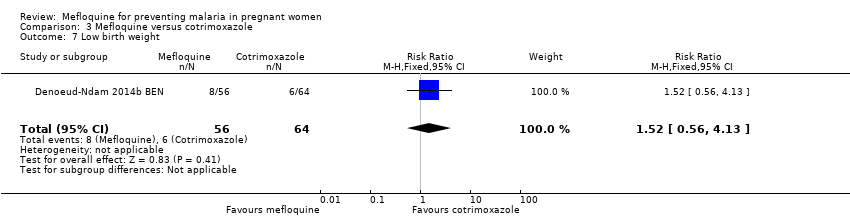
Comparison 3 Mefloquine versus cotrimoxazole, Outcome 7 Low birth weight.
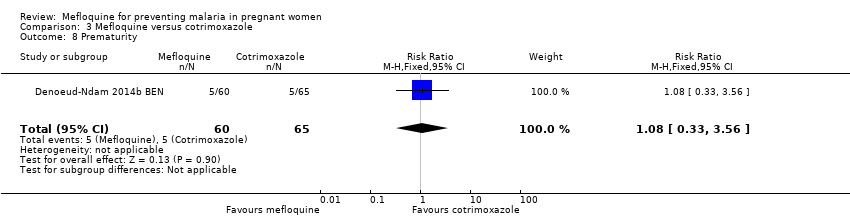
Comparison 3 Mefloquine versus cotrimoxazole, Outcome 8 Prematurity.

Comparison 3 Mefloquine versus cotrimoxazole, Outcome 9 SAEs during pregnancy.
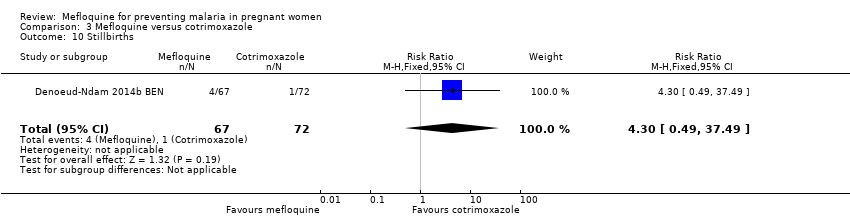
Comparison 3 Mefloquine versus cotrimoxazole, Outcome 10 Stillbirths.

Comparison 3 Mefloquine versus cotrimoxazole, Outcome 11 Spontaneous abortions.

Comparison 3 Mefloquine versus cotrimoxazole, Outcome 12 Congenital malformations.

Comparison 3 Mefloquine versus cotrimoxazole, Outcome 13 Maternal mortality.

Comparison 3 Mefloquine versus cotrimoxazole, Outcome 14 Neonatal mortality.

Comparison 3 Mefloquine versus cotrimoxazole, Outcome 15 Infant deaths after 7 days.

Comparison 3 Mefloquine versus cotrimoxazole, Outcome 16 AEs: vomiting.

Comparison 3 Mefloquine versus cotrimoxazole, Outcome 17 AEs: fatigue/weakness.

Comparison 3 Mefloquine versus cotrimoxazole, Outcome 18 AEs: dizziness.

Comparison 3 Mefloquine versus cotrimoxazole, Outcome 19 AEs: headache.

Comparison 4 Mefloquine versus placebo, Outcome 1 Maternal peripheral parasitaemia during pregnancy.
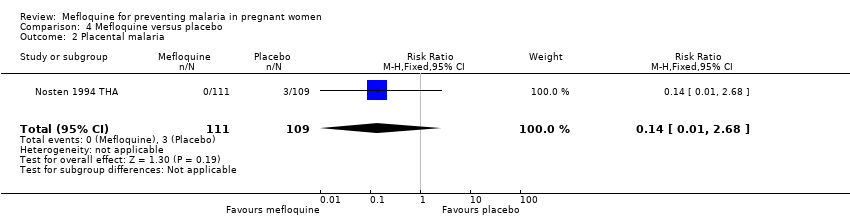
Comparison 4 Mefloquine versus placebo, Outcome 2 Placental malaria.

Comparison 4 Mefloquine versus placebo, Outcome 3 Mean birth weight.
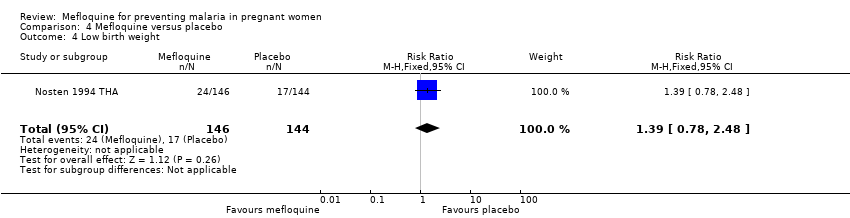
Comparison 4 Mefloquine versus placebo, Outcome 4 Low birth weight.

Comparison 4 Mefloquine versus placebo, Outcome 5 Prematurity.

Comparison 4 Mefloquine versus placebo, Outcome 6 Stillbirths.

Comparison 4 Mefloquine versus placebo, Outcome 7 Spontaneous abortions.
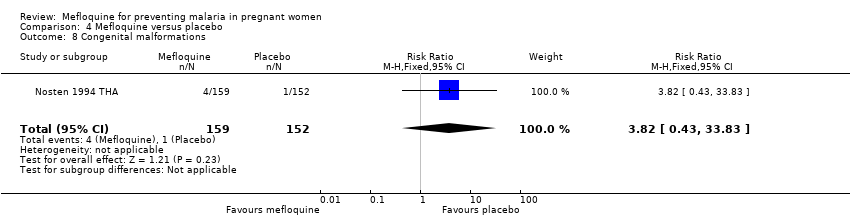
Comparison 4 Mefloquine versus placebo, Outcome 8 Congenital malformations.
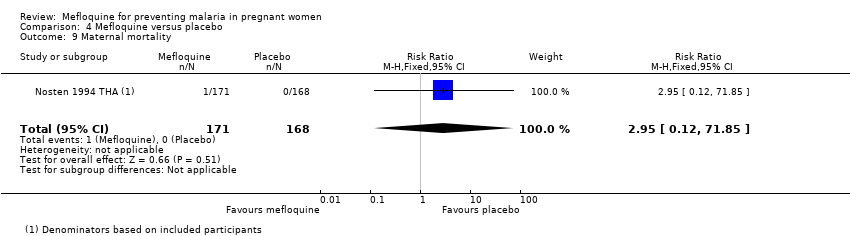
Comparison 4 Mefloquine versus placebo, Outcome 9 Maternal mortality.
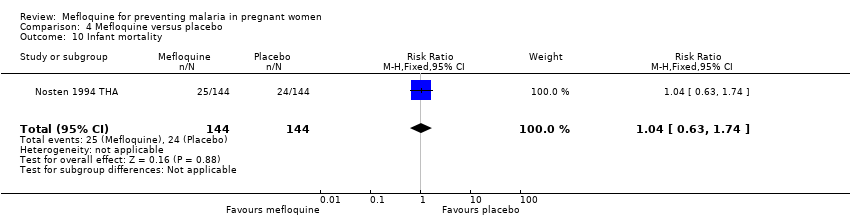
Comparison 4 Mefloquine versus placebo, Outcome 10 Infant mortality.
| Mefloquine compared with sulfadoxine‐pyrimethamine for preventing malaria in pregnant women | ||||||
| Patient or population: HIV‐uninfected pregnant women | ||||||
| Outcomes | Anticipated absolute effects* (95% CI) | Relative effect | Number of participants | Certainty of the evidence | Comments (compared with sulfadoxine‐pyrimethamine) | |
| Risk with sulfadoxine‐pyrimethamine | Risk with mefloquine | |||||
| Clinical malaria episodes during pregnancy | ‐ | ‐ | IRR 0.83 | ‐ | ⊕⊕⊕⊝ | Mefloquine results in little or no difference in the incidence of clinical malaria episodes during pregnancy |
| Maternal peripheral parasitaemia at delivery | 43 per 1000 | 28 per 1000 (20 to 37) | RR 0.65 (0.48 to | 5455 (2 RCTs) | ⊕⊕⊕⊝ | Mefloquine results in lower maternal peripheral parasitaemia at delivery |
| Placental malaria | 52 per 1000 | 54 per 1000 | RR 1.04 | 4668 | ⊕⊕⊝⊝ Due to imprecision and heterogeneity | Mefloquine may result in little or no difference in placental parasitaemia |
| Maternal anaemia at delivery | 219 per 1000 | 184 per 1000 | RR 0.84 | 5469 | ⊕⊕⊕⊝ Due to imprecision | Mefloquine probably results in fewer women anaemic at delivery |
| Low birth weight | 117 per 1000 | 111 per 1000 | RR 0.95 | 5641 | ⊕⊕⊕⊝ | Mefloquine results in little or no difference in low birth weight |
| Stillbirths and abortions | 31 per 1000 | 37 per 1000 | RR 1.20 | 6219 | ⊕⊕⊕⊝ | Mefloquine results in little or no difference in stillbirths or abortions |
| AEs: vomiting | 82 per 1000 | 390 per 1000 | RR 4.76 | 6272 | ⊕⊕⊕⊕ | Mefloquine results in a four‐fold increase in vomiting |
| AEs: dizziness | 94 per 1000 | 396 per 1000 | RR 4.21 | 6272 | ⊕⊕⊕⊝ | Mefloquine results in a four‐fold increase in dizziness |
| *The risk in the intervention group (and its 95% CI) is based on the assumed risk in the comparison group and the relative effect of the intervention (and its 95% CI). | ||||||
| GRADE Working Group grades of evidence. | ||||||
| aAlthough one trial has serious risk of bias, the other is of high certainty and exclusion of the smaller trial has little effect on the estimate of effect. | ||||||
| Mefloquine plus cotrimoxazole compared with cotrimoxazole for preventing malaria in pregnant women | ||||||
| Patient or population: HIV‐infected pregnant women | ||||||
| Outcomes | Anticipated absolute effects* (95% CI) | Relative effect | Number of participants | Certainty of the evidence | Comments (compared with cotrimoxazole) | |
| Risk with cotrimoxazole | Risk with mefloquine plus cotrimoxazole | |||||
| Clinical malaria episodes during pregnancy | ‐ | ‐ | IRR 0.76 (0.33 to 1.76) | ‐ (1 RCT) | ⊕⊕⊕⊕ | Mefloquine results in little or no difference in the incidence of clinical malaria episodes during pregnancy |
| Maternal peripheral parasitaemia at delivery (PCR) | 66 per 1000 | 34 per 1000 (20 to 62) | RR 0.52 (0.30 to 0.93) | 989 (2 RCTs) | ⊕⊕⊕⊝ | Mefloquine probably results in lower maternal peripheral parasitaemia at delivery |
| Placental malaria (PCR) | 68 per 1000 | 19 per 1000 | RR 0.28 | 977 | ⊕⊕⊕⊕ | Mefloquine plus cotrimoxazole results in fewer women with placental malaria at delivery |
| Maternal anaemia at delivery | 178 per 1000 | 168 per 1000 | RR 0.94 | 1197 | ⊕⊕⊕⊝ | Mefloquine plus cotrimoxazole probably results in little or no difference in maternal anaemia cases at delivery |
| Low birth weight | 118 per 1000 | 141 per 1000 | RR 1.20 | 1220 | ⊕⊕⊕⊝ | Mefloquine plus cotrimoxazole probably results in little or no difference in low birth weight |
| Spontaneous abortions and stillbirths | 50 per 1000 | 56 per 1000 | RR 1.12 | 1347 | ⊕⊝⊝⊝ | Mefloquine plus cotrimoxazole may result in little or no difference in spontaneous abortions and stillbirths |
| AEs: vomiting | 30 per 1000 | 239 per 1000 (144 to 396) | RR 7.95 (4.79 to 13.18) | 1055 (1 RCT)d | ⊕⊕⊕⊕ | Mefloquine plus cotrimoxazole results in an eight‐fold increase in vomiting |
| AEs: dizziness | 75 per 1000 | 296 per 1000 (214 to 411) | RR 3.94 (2.85 to 5.46) | 1055 (1 RCT)e | ⊕⊕⊕⊕ | Mefloquine plus cotrimoxazole results in a four‐fold increase in dizziness |
| *The risk in the intervention group (and its 95% CI) is based on the assumed risk in the comparison group and the relative effect of the intervention (and its 95% CI). | ||||||
| GRADE Working Group grades of evidence. | ||||||
| aAlthough one trial has serious risk of bias, the other is of high certainty and exclusion of the smaller trial has little effect on the estimate of effect. | ||||||
| Outcome or subgroup title | No. of studies | No. of participants | Statistical method | Effect size |
| 1 Clinical malaria episodes during pregnancy Show forest plot | 2 | Rate Ratio (Fixed, 95% CI) | 0.83 [0.65, 1.05] | |
| 2 Maternal peripheral parasitaemia at delivery Show forest plot | 2 | 5455 | Risk Ratio (M‐H, Fixed, 95% CI) | 0.65 [0.48, 0.86] |
| 3 Placental malaria Show forest plot | 2 | 4668 | Risk Ratio (M‐H, Random, 95% CI) | 1.04 [0.58, 1.86] |
| 4 Mean haemoglobin at delivery Show forest plot | 2 | 5588 | Mean Difference (IV, Fixed, 95% CI) | 0.10 [0.01, 0.19] |
| 5 Maternal anaemia at delivery Show forest plot | 2 | 5469 | Risk Ratio (M‐H, Fixed, 95% CI) | 0.84 [0.76, 0.94] |
| 6 Severe maternal anaemia at delivery Show forest plot | 2 | 5469 | Risk Ratio (M‐H, Random, 95% CI) | 0.93 [0.58, 1.48] |
| 7 Cord blood parasitaemia Show forest plot | 2 | 5309 | Risk Ratio (M‐H, Random, 95% CI) | 0.44 [0.13, 1.46] |
| 8 Cord blood anaemia Show forest plot | 1 | 4006 | Risk Ratio (M‐H, Fixed, 95% CI) | 1.04 [0.87, 1.23] |
| 9 Mean birth weight Show forest plot | 2 | 5241 | Mean Difference (IV, Fixed, 95% CI) | 2.52 [‐25.66, 30.69] |
| 10 Low birth weight Show forest plot | 2 | 5641 | Risk Ratio (M‐H, Random, 95% CI) | 0.95 [0.78, 1.17] |
| 11 Low birth weight by gravidity Show forest plot | 2 | 5641 | Risk Ratio (M‐H, Fixed, 95% CI) | 0.97 [0.84, 1.13] |
| 11.1 Primigravidae | 2 | 1576 | Risk Ratio (M‐H, Fixed, 95% CI) | 1.02 [0.80, 1.30] |
| 11.2 Multigravidae | 2 | 4065 | Risk Ratio (M‐H, Fixed, 95% CI) | 0.94 [0.78, 1.14] |
| 12 Prematurity Show forest plot | 2 | 4640 | Risk Ratio (M‐H, Fixed, 95% CI) | 1.03 [0.76, 1.40] |
| 13 Malaria in first year of life Show forest plot | 1 | Rate Ratio (Fixed, 95% CI) | 0.97 [0.82, 1.15] | |
| 14 Hospital admissions in first year of life Show forest plot | 1 | Rate Ratio (Fixed, 95% CI) | 0.93 [0.75, 1.17] | |
| 15 SAEs during pregnancy Show forest plot | 1 | 4674 | Risk Ratio (M‐H, Fixed, 95% CI) | 0.98 [0.81, 1.20] |
| 16 Stillbirths and abortions Show forest plot | 2 | 6219 | Risk Ratio (M‐H, Fixed, 95% CI) | 1.20 [0.91, 1.58] |
| 17 Congenital malformations Show forest plot | 2 | 5931 | Risk Ratio (M‐H, Random, 95% CI) | 1.10 [0.51, 2.37] |
| 18 Maternal mortality Show forest plot | 2 | 6219 | Risk Ratio (M‐H, Random, 95% CI) | 2.41 [0.27, 21.23] |
| 19 Neonatal mortality Show forest plot | 2 | 6134 | Risk Ratio (M‐H, Fixed, 95% CI) | 0.98 [0.67, 1.43] |
| 20 Infant mortality Show forest plot | 1 | Rate Ratio (Fixed, 95% CI) | 1.00 [0.66, 1.52] | |
| 21 AEs: vomiting Show forest plot | 2 | 6272 | Risk Ratio (M‐H, Fixed, 95% CI) | 4.76 [4.13, 5.49] |
| 22 AEs: fatigue/weakness Show forest plot | 2 | 6272 | Risk Ratio (M‐H, Random, 95% CI) | 4.62 [1.80, 11.85] |
| 23 AEs: dizziness Show forest plot | 2 | 6272 | Risk Ratio (M‐H, Random, 95% CI) | 4.21 [3.36, 5.27] |
| 24 AEs: headache Show forest plot | 2 | 6272 | Risk Ratio (M‐H, Random, 95% CI) | 0.70 [0.25, 1.94] |
| Outcome or subgroup title | No. of studies | No. of participants | Statistical method | Effect size |
| 1 Clinical malaria episodes during pregnancy Show forest plot | 1 | Rate Ratio (Fixed, 95% CI) | 0.76 [0.33, 1.76] | |
| 2 Maternal peripheral parasitaemia at delivery (PCR) Show forest plot | 2 | 989 | Risk Ratio (M‐H, Fixed, 95% CI) | 0.52 [0.30, 0.93] |
| 3 Placental malaria (blood smear) Show forest plot | 2 | 1144 | Risk Ratio (M‐H, Fixed, 95% CI) | 0.51 [0.29, 0.89] |
| 4 Placental malaria (PCR) Show forest plot | 2 | 977 | Risk Ratio (M‐H, Fixed, 95% CI) | 0.28 [0.14, 0.57] |
| 5 Mean haemoglobin at delivery Show forest plot | 2 | 1167 | Mean Difference (IV, Random, 95% CI) | 0.07 [‐0.32, 0.46] |
| 6 Maternal anaemia at delivery (< 9.5 g/dL) Show forest plot | 2 | 1197 | Risk Ratio (M‐H, Fixed, 95% CI) | 0.94 [0.73, 1.20] |
| 7 Maternal severe anaemia at delivery Show forest plot | 2 | 1167 | Risk Ratio (M‐H, Fixed, 95% CI) | 0.93 [0.41, 2.08] |
| 8 Cord blood parasitaemia Show forest plot | 2 | 1166 | Risk Ratio (M‐H, Fixed, 95% CI) | 0.33 [0.03, 3.13] |
| 9 Mean birth weight Show forest plot | 2 | 1220 | Mean Difference (IV, Random, 95% CI) | ‐25.75 [‐86.99, 35.49] |
| 10 Low birth weight Show forest plot | 2 | 1220 | Risk Ratio (M‐H, Fixed, 95% CI) | 1.20 [0.89, 1.60] |
| 11 Prematurity Show forest plot | 2 | 824 | Risk Ratio (M‐H, Random, 95% CI) | 1.07 [0.58, 1.96] |
| 12 SAEs during pregnancy Show forest plot | 2 | 1347 | Risk Ratio (M‐H, Fixed, 95% CI) | 0.69 [0.50, 0.95] |
| 13 Spontaneous abortions and stillbirths Show forest plot | 2 | 1347 | Risk Ratio (M‐H, Random, 95% CI) | 1.12 [0.42, 2.98] |
| 14 Congenital malformations Show forest plot | 2 | 1312 | Risk Ratio (M‐H, Fixed, 95% CI) | 0.61 [0.22, 1.67] |
| 15 Maternal mortality Show forest plot | 2 | 1347 | Risk Ratio (M‐H, Fixed, 95% CI) | 0.51 [0.13, 2.01] |
| 16 Neonatal mortality Show forest plot | 2 | 1239 | Risk Ratio (M‐H, Fixed, 95% CI) | 1.32 [0.65, 2.69] |
| 17 Mother‐to‐child transmission HIV Show forest plot | 2 | 1019 | Risk Ratio (M‐H, Fixed, 95% CI) | 1.92 [1.13, 3.25] |
| 18 AEs: vomiting Show forest plot | 2 | 1347 | Risk Ratio (M‐H, Random, 95% CI) | 20.88 [1.40, 311.66] |
| 19 AEs: fatigue/weakness Show forest plot | 2 | 1347 | Risk Ratio (M‐H, Random, 95% CI) | 2.95 [0.26, 32.93] |
| 20 AEs: dizziness Show forest plot | 2 | 1347 | Risk Ratio (M‐H, Random, 95% CI) | 16.34 [0.39, 684.99] |
| 21 AEs: headache Show forest plot | 2 | 1347 | Risk Ratio (M‐H, Random, 95% CI) | 0.76 [0.28, 2.10] |
| Outcome or subgroup title | No. of studies | No. of participants | Statistical method | Effect size |
| 1 Maternal peripheral parasitaemia at delivery (PCR) Show forest plot | 1 | 98 | Risk Ratio (M‐H, Fixed, 95% CI) | 0.21 [0.03, 1.72] |
| 2 Placental malaria (PCR) Show forest plot | 1 | 94 | Risk Ratio (M‐H, Fixed, 95% CI) | 0.73 [0.13, 4.15] |
| 3 Placental malaria (blood smear) Show forest plot | 1 | 108 | Risk Ratio (M‐H, Fixed, 95% CI) | 0.35 [0.01, 8.30] |
| 4 Mean haemoglobin at delivery Show forest plot | 1 | 100 | Mean Difference (IV, Fixed, 95% CI) | ‐0.10 [‐0.67, 0.47] |
| 5 Maternal anaemia at delivery (< 9.5 g/dL) Show forest plot | 1 | 100 | Risk Ratio (M‐H, Fixed, 95% CI) | 0.90 [0.26, 3.16] |
| 6 Mean birth weight Show forest plot | 1 | 120 | Mean Difference (IV, Fixed, 95% CI) | ‐102.0 [‐255.52, 51.52] |
| 7 Low birth weight Show forest plot | 1 | 120 | Risk Ratio (M‐H, Fixed, 95% CI) | 1.52 [0.56, 4.13] |
| 8 Prematurity Show forest plot | 1 | 125 | Risk Ratio (M‐H, Fixed, 95% CI) | 1.08 [0.33, 3.56] |
| 9 SAEs during pregnancy Show forest plot | 1 | 140 | Risk Ratio (M‐H, Fixed, 95% CI) | 1.06 [0.28, 4.07] |
| 10 Stillbirths Show forest plot | 1 | 139 | Risk Ratio (M‐H, Fixed, 95% CI) | 4.30 [0.49, 37.49] |
| 11 Spontaneous abortions Show forest plot | 1 | 139 | Risk Ratio (M‐H, Fixed, 95% CI) | 1.07 [0.07, 16.84] |
| 12 Congenital malformations Show forest plot | 1 | 139 | Risk Ratio (M‐H, Fixed, 95% CI) | 1.07 [0.16, 7.41] |
| 13 Maternal mortality Show forest plot | 1 | 139 | Risk Ratio (M‐H, Fixed, 95% CI) | 0.0 [0.0, 0.0] |
| 14 Neonatal mortality Show forest plot | 1 | 129 | Risk Ratio (M‐H, Fixed, 95% CI) | 1.05 [0.07, 16.39] |
| 15 Infant deaths after 7 days Show forest plot | 1 | 129 | Risk Ratio (M‐H, Fixed, 95% CI) | 2.10 [0.19, 22.54] |
| 16 AEs: vomiting Show forest plot | 1 | 139 | Risk Ratio (M‐H, Fixed, 95% CI) | 13.43 [3.31, 54.54] |
| 17 AEs: fatigue/weakness Show forest plot | 1 | 139 | Risk Ratio (M‐H, Fixed, 95% CI) | 6.99 [1.64, 29.81] |
| 18 AEs: dizziness Show forest plot | 1 | 139 | Risk Ratio (M‐H, Fixed, 95% CI) | 52.60 [3.26, 848.24] |
| 19 AEs: headache Show forest plot | 1 | 139 | Risk Ratio (M‐H, Fixed, 95% CI) | 0.21 [0.01, 4.39] |
| Outcome or subgroup title | No. of studies | No. of participants | Statistical method | Effect size |
| 1 Maternal peripheral parasitaemia during pregnancy Show forest plot | 1 | 339 | Risk Ratio (M‐H, Fixed, 95% CI) | 0.13 [0.05, 0.33] |
| 2 Placental malaria Show forest plot | 1 | 220 | Risk Ratio (M‐H, Fixed, 95% CI) | 0.14 [0.01, 2.68] |
| 3 Mean birth weight Show forest plot | 1 | 290 | Mean Difference (IV, Fixed, 95% CI) | ‐80.0 [‐184.65, 24.65] |
| 4 Low birth weight Show forest plot | 1 | 290 | Risk Ratio (M‐H, Fixed, 95% CI) | 1.39 [0.78, 2.48] |
| 5 Prematurity Show forest plot | 1 | 199 | Risk Ratio (M‐H, Fixed, 95% CI) | 0.48 [0.15, 1.53] |
| 6 Stillbirths Show forest plot | 1 | 311 | Risk Ratio (M‐H, Fixed, 95% CI) | 2.63 [0.86, 8.08] |
| 7 Spontaneous abortions Show forest plot | 1 | 311 | Risk Ratio (M‐H, Fixed, 95% CI) | 0.48 [0.04, 5.22] |
| 8 Congenital malformations Show forest plot | 1 | 311 | Risk Ratio (M‐H, Fixed, 95% CI) | 3.82 [0.43, 33.83] |
| 9 Maternal mortality Show forest plot | 1 | 339 | Risk Ratio (M‐H, Fixed, 95% CI) | 2.95 [0.12, 71.85] |
| 10 Infant mortality Show forest plot | 1 | 288 | Risk Ratio (M‐H, Fixed, 95% CI) | 1.04 [0.63, 1.74] |