| 1 Clinical malaria episodes during pregnancy Show forest plot | 2 | | Rate Ratio (Fixed, 95% CI) | 0.83 [0.65, 1.05] |
|
| 2 Maternal peripheral parasitaemia at delivery Show forest plot | 2 | 5455 | Risk Ratio (M‐H, Fixed, 95% CI) | 0.65 [0.48, 0.86] |
|
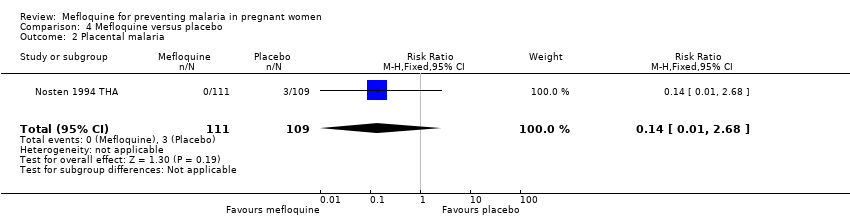
| 3 Placental malaria Show forest plot | 2 | 4668 | Risk Ratio (M‐H, Random, 95% CI) | 1.04 [0.58, 1.86] |
|
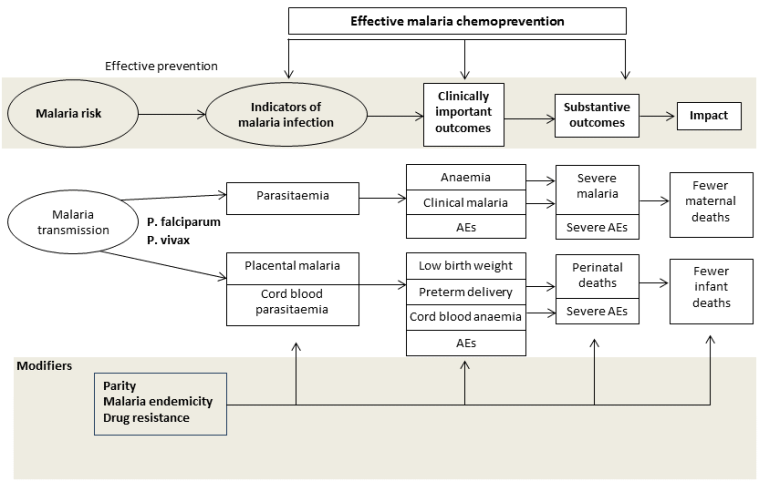
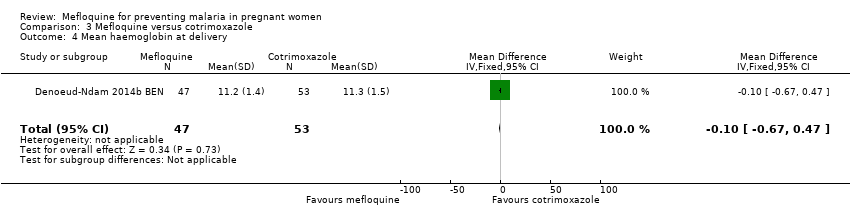
| 4 Mean haemoglobin at delivery Show forest plot | 2 | 5588 | Mean Difference (IV, Fixed, 95% CI) | 0.10 [0.01, 0.19] |
|
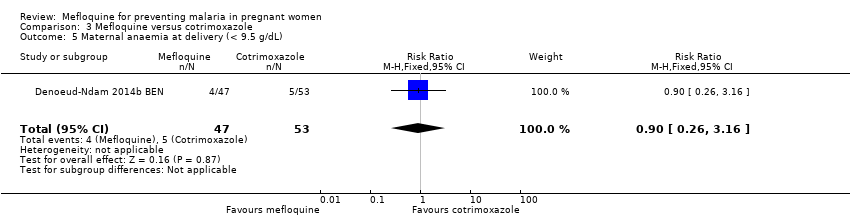
| 5 Maternal anaemia at delivery Show forest plot | 2 | 5469 | Risk Ratio (M‐H, Fixed, 95% CI) | 0.84 [0.76, 0.94] |
|
| 6 Severe maternal anaemia at delivery Show forest plot | 2 | 5469 | Risk Ratio (M‐H, Random, 95% CI) | 0.93 [0.58, 1.48] |
|
| 7 Cord blood parasitaemia Show forest plot | 2 | 5309 | Risk Ratio (M‐H, Random, 95% CI) | 0.44 [0.13, 1.46] |
|
| 8 Cord blood anaemia Show forest plot | 1 | 4006 | Risk Ratio (M‐H, Fixed, 95% CI) | 1.04 [0.87, 1.23] |
|
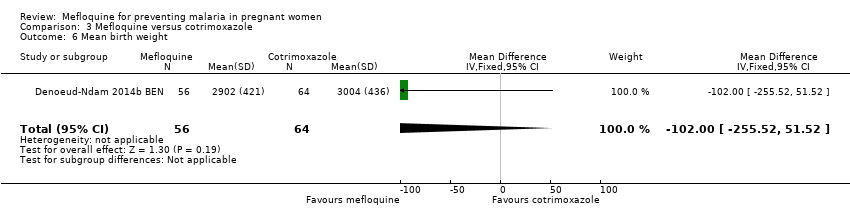
| 9 Mean birth weight Show forest plot | 2 | 5241 | Mean Difference (IV, Fixed, 95% CI) | 2.52 [‐25.66, 30.69] |
|
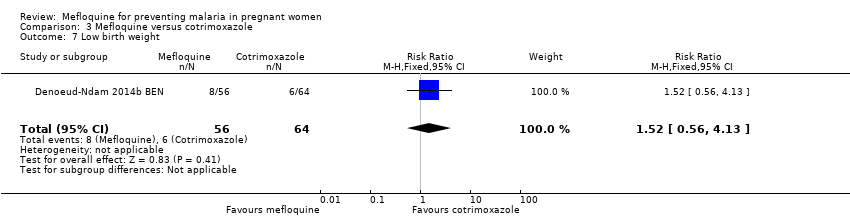
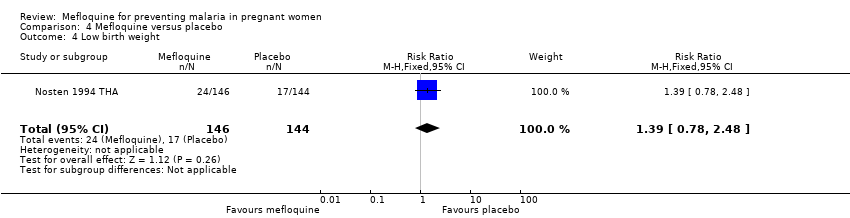
| 10 Low birth weight Show forest plot | 2 | 5641 | Risk Ratio (M‐H, Random, 95% CI) | 0.95 [0.78, 1.17] |
|
| 11 Low birth weight by gravidity Show forest plot | 2 | 5641 | Risk Ratio (M‐H, Fixed, 95% CI) | 0.97 [0.84, 1.13] |
|
| 11.1 Primigravidae | 2 | 1576 | Risk Ratio (M‐H, Fixed, 95% CI) | 1.02 [0.80, 1.30] |
| 11.2 Multigravidae | 2 | 4065 | Risk Ratio (M‐H, Fixed, 95% CI) | 0.94 [0.78, 1.14] |
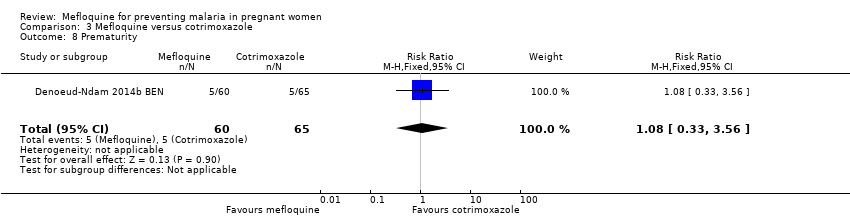
| 12 Prematurity Show forest plot | 2 | 4640 | Risk Ratio (M‐H, Fixed, 95% CI) | 1.03 [0.76, 1.40] |
|
| 13 Malaria in first year of life Show forest plot | 1 | | Rate Ratio (Fixed, 95% CI) | 0.97 [0.82, 1.15] |
|
| 14 Hospital admissions in first year of life Show forest plot | 1 | | Rate Ratio (Fixed, 95% CI) | 0.93 [0.75, 1.17] |
|
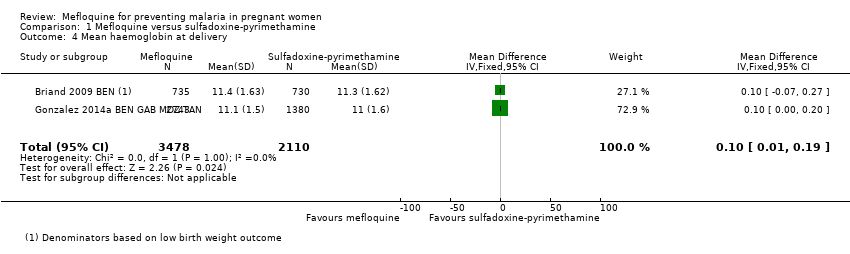
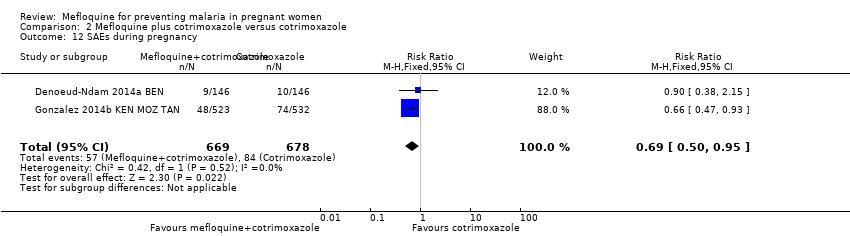
| 15 SAEs during pregnancy Show forest plot | 1 | 4674 | Risk Ratio (M‐H, Fixed, 95% CI) | 0.98 [0.81, 1.20] |
|
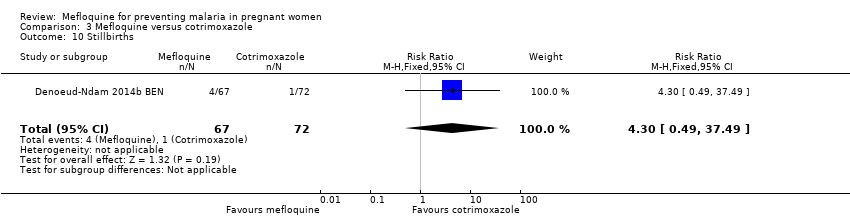
| 16 Stillbirths and abortions Show forest plot | 2 | 6219 | Risk Ratio (M‐H, Fixed, 95% CI) | 1.20 [0.91, 1.58] |
|
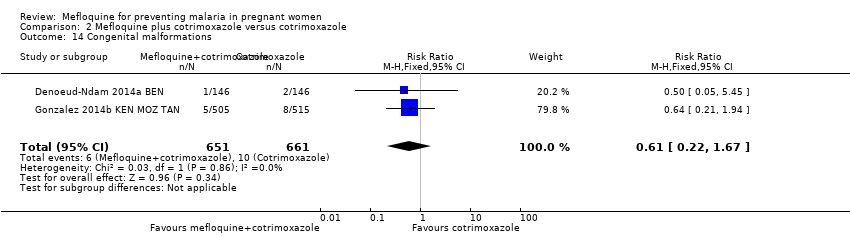
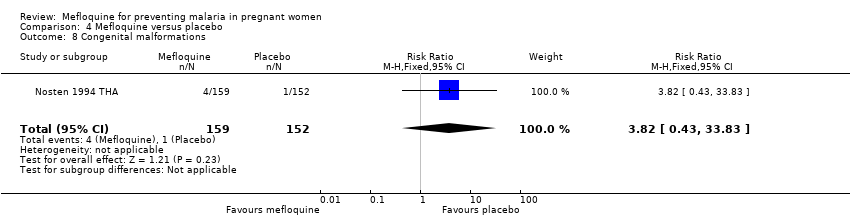
| 17 Congenital malformations Show forest plot | 2 | 5931 | Risk Ratio (M‐H, Random, 95% CI) | 1.10 [0.51, 2.37] |
|
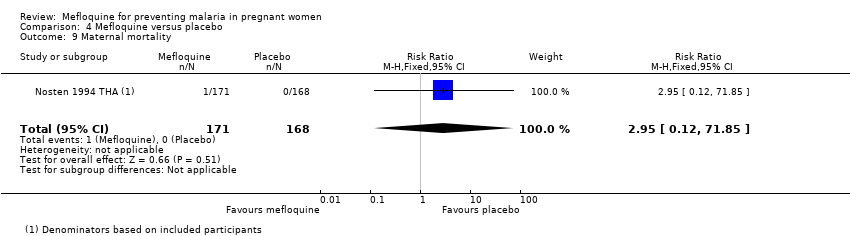
| 18 Maternal mortality Show forest plot | 2 | 6219 | Risk Ratio (M‐H, Random, 95% CI) | 2.41 [0.27, 21.23] |
|
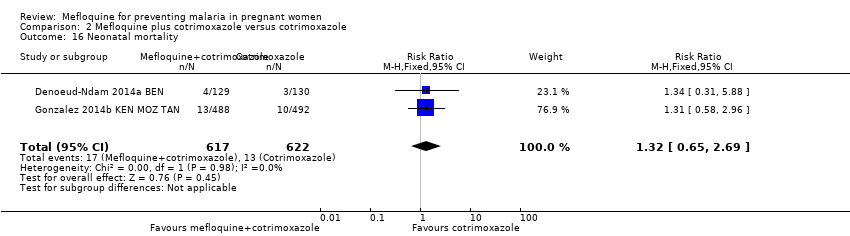
| 19 Neonatal mortality Show forest plot | 2 | 6134 | Risk Ratio (M‐H, Fixed, 95% CI) | 0.98 [0.67, 1.43] |
|
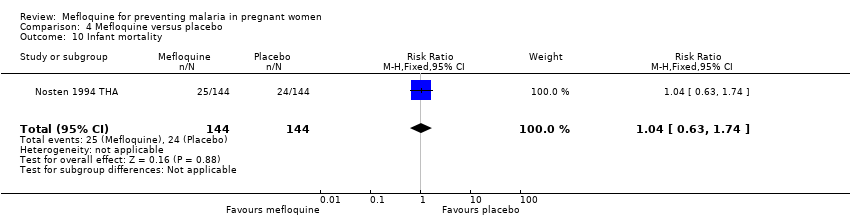
| 20 Infant mortality Show forest plot | 1 | | Rate Ratio (Fixed, 95% CI) | 1.00 [0.66, 1.52] |
|
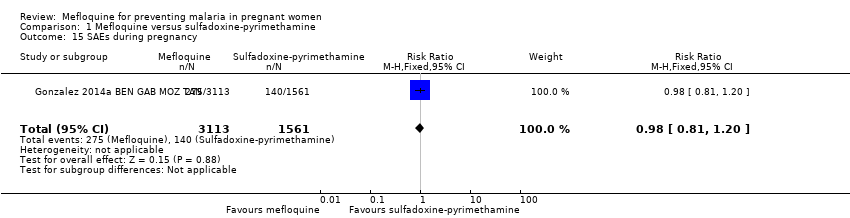
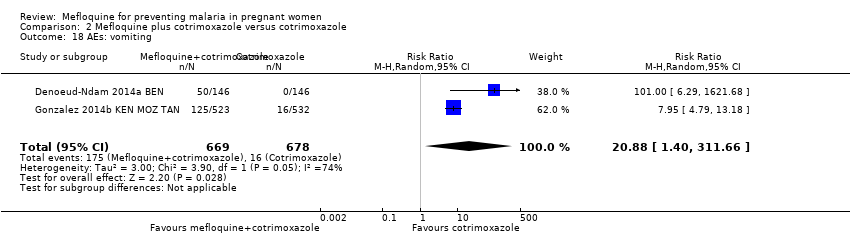
| 21 AEs: vomiting Show forest plot | 2 | 6272 | Risk Ratio (M‐H, Fixed, 95% CI) | 4.76 [4.13, 5.49] |
|
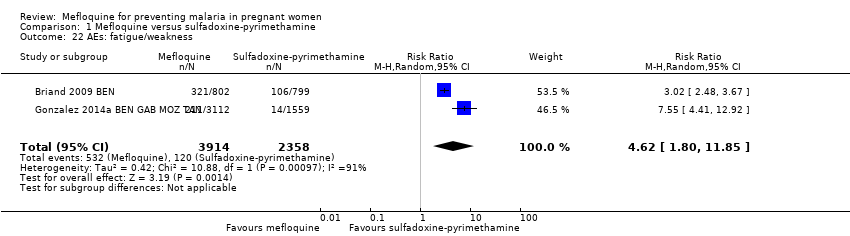
| 22 AEs: fatigue/weakness Show forest plot | 2 | 6272 | Risk Ratio (M‐H, Random, 95% CI) | 4.62 [1.80, 11.85] |
|
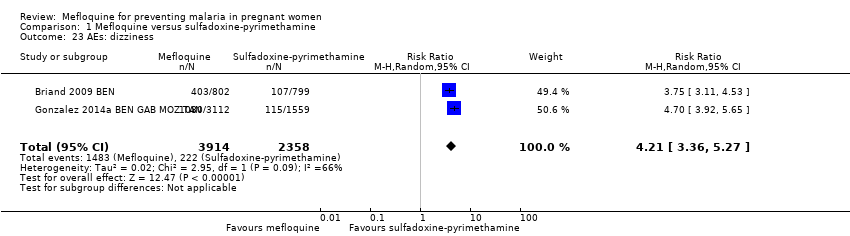
| 23 AEs: dizziness Show forest plot | 2 | 6272 | Risk Ratio (M‐H, Random, 95% CI) | 4.21 [3.36, 5.27] |
|
| 24 AEs: headache Show forest plot | 2 | 6272 | Risk Ratio (M‐H, Random, 95% CI) | 0.70 [0.25, 1.94] |
|