Entrenamiento con ejercicios de miembros superiores para la EPOC
Resumen
Antecedentes
Los pacientes con enfermedad pulmonar obstructiva crónica (EPOC) a menudo presentan dificultades cuando realizan ejercicios de los miembros superiores debido a la disnea y la fatiga del brazo. En consecuencia, el entrenamiento con ejercicios de los miembros superiores se incorpora habitualmente en los programas de rehabilitación pulmonar para mejorar la capacidad de ejercicio de los miembros superiores; sin embargo, siguen sin poder precisarse los efectos de este entrenamiento sobre la disnea y la calidad de vida relacionada con la salud (CVRS).
Objetivos
Determinar los efectos del entrenamiento de los miembros superiores (entrenamiento aeróbico o en resistencia, o ambos) sobre los síntomas de la disnea y la CVRS en los pacientes con EPOC.
Métodos de búsqueda
Se realizaron búsquedas en el registro especializado del Grupo Cochrane de Vías Respiratorias (Cochrane Airways Group Specialised Register), ClinicalTrials.gov y en el portal de la World Health Organization desde el inicio hasta el 28 de septiembre de 2016, y también se revisaron todas las listas de referencias de estudios primarios y artículos de revisión.
Criterios de selección
Se incluyeron ensayos controlados aleatorios (ECA) en los cuales se realizó entrenamiento de ejercicios de los miembros superiores de al menos cuatro semanas de duración. Las tres comparaciones se estructuraron como: a) entrenamiento de los miembros superiores solo versus ningún entrenamiento o intervención simulada; b) entrenamiento de miembros superiores y entrenamiento de miembros inferiores combinados versus entrenamiento de miembros inferiores solo; y c) entrenamiento de los miembros superiores versus otro tipo de entrenamiento de los miembros superiores.
Obtención y análisis de los datos
Dos autores de la revisión, de forma independiente, seleccionaron los ensayos para su exclusión, extrajeron los datos de resultados y evaluaron el riesgo de sesgo. Se estableció contacto con los autores de los estudios para obtener datos que faltaban. Se determinó el efecto del tratamiento a partir de cada estudio como puntuaciones postratamiento. Se pudieron analizar los datos de las tres comparaciones planificadas. Para el entrenamiento de los miembros superiores solo versus ningún entrenamiento o la estructura de intervención simulada, el entrenamiento de los miembros superiores se subclasificó como "entrenamiento aeróbico" o "entrenamiento en resistencia" para determinar la repercusión de la modalidad de entrenamiento.
Resultados principales
Se incluyeron 15 estudios sobre 425 participantes en la revisión, uno de los cuales fue sólo en forma de resumen. Se incluyeron 12 estudios en el metanálisis en una o más de las tres comparaciones. El tamaño de la muestra de los estudios incluidos fue pequeño (12 a 43 participantes), y la calidad general del estudio fue moderada a baja dadas la imprecisión y el riesgo de los problemas de sesgo (es decir, falta de información sobre generación de secuencias y ocultación de la asignación así como ningún cegamiento de la evaluación de resultados y datos incompletos).
Cuando el entrenamiento de los miembros superiores se comparó con ningún entrenamiento o entrenamiento simulado, hubo una mejoría significativa pequeña en los síntomas de disnea, con una diferencia de medias (DM) de 0,37 puntos (intervalo de confianza [IC] del 95%: 0,02 a 0,72 puntos; datos de cuatro estudios sobre 129 pacientes). Sin embargo, no hubo una mejoría significativa en la disnea cuando se analizaron los estudios de entrenamiento aeróbico solo (DM 0,41 puntos, IC del 95%: ‐0,13 a 0,95 puntos; datos de dos estudios sobre 55 pacientes) o el entrenamiento en resistencia solo (DM 0,34 puntos, IC del 95%: ‐0,11 a 0,80 puntos; datos de dos estudios sobre 74 pacientes). Cuando el entrenamiento de los miembros superiores combinado con el entrenamiento de miembros inferiores se comparó con el entrenamiento de miembros inferiores solo, no se observó ninguna diferencia significativa en la disnea (DM 0,36 puntos, IC del 95%: ‐0,04 a 0,76 puntos; datos de tres estudios sobre 86 pacientes). No hubo ningún estudio que examinara los efectos sobre la disnea del entrenamiento de los miembros superiores comparado con otra intervención de entrenamiento de miembros superiores.
No hubo ningún mejoría significativa en la CVRS cuando el entrenamiento de los miembros superiores se comparó con ningún entrenamiento o entrenamiento simulado, con una diferencia de medias estandarizada (DME) de 0,05 (IC del 95%: ‐0,31 a 0,40; cuatro estudios sobre 126 pacientes) o cuando el entrenamiento de los miembros superiores combinado con el entrenamiento de miembros inferiores se comparó con el de miembros inferiores solo (DME 0,01; IC del 95%: ‐0,40 a 0,43; tres estudios con 95 pacientes). Sólo uno estudio, en que el entrenamiento aeróbico de miembros superiores se comparó con el entrenamiento en resistencia de los miembros, informó la CVRS y no mostró ninguna diferencia entre los grupos (St George's Respiratory Questionnaire DM 2 puntos; IC del 95%: ‐9 a 12; un estudio con 20 participantes).
Se observaron resultados positivos para los efectos del entrenamiento de los miembros superiores sobre el resultado secundario de capacidad de ejercicio aeróbico de miembros superiores sin apoyo. Cuando el entrenamiento de los miembros superiores se comparó con ningún entrenamiento o entrenamiento simulado, hubo una mejoría significativa en la capacidad aeróbica de miembros superiores sin apoyo (DME 0,66; IC del 95%: 0,19 a 1,13; seis estudios sobre 142 pacientes) que se mantuvo significativa cuando se examinaron los estudios de este análisis de entrenamiento aeróbico solo (DME 0,99; IC del 95%: 0,32 a 1,66; cuatro estudios sobre 85 pacientes) pero no cuando se examinaron los estudios de entrenamiento en resistencia solo (DME 0,23; IC del 95%: ‐0,31 a 0,76; tres estudios sobre 57 pacientes; P = 0,08 para la prueba de las diferencias de los subgrupos). Cuando el entrenamiento de los miembros superiores combinado con el de miembros inferiores se comparó con el entrenamiento de miembros inferiores solo, hubo una mejoría significativa en la capacidad aeróbica de los miembros superiores sin apoyo (DME 0,90; IC del 95%: 0,12 a 1,68; tres estudios con 87 pacientes). Un único estudio comparó el entrenamiento aeróbico de los miembros superiores con el entrenamiento en resistencia de los miembros superiores y se observó una mejoría significativa en el número de elevaciones en un minuto, lo que favorece el entrenamiento aeróbico de los miembros superiores (DM 6,0 elevaciones; IC del 95%: 0,29 a 11,71 elevaciones; un estudio con 17 pacientes).
Los datos disponibles fueron insuficientes para examinar la repercusión de la gravedad de la enfermedad en cualquier resultado.
Conclusiones de los autores
Las pruebas de esta revisión indican que alguna forma de entrenamiento en ejercicios de los miembros superiores comparado con ningún entrenamiento de los miembros superiores o una intervención simulada mejora la disnea pero no la CVRS en los pacientes con EPOC. El reducido número de estudios que comparan diferentes intervenciones de entrenamiento de miembros superiores impide establecer conclusiones acerca del programa de entrenamiento de los miembros superiores óptimo para los pacientes con EPOC. Sin embargo, el entrenamiento aeróbico de los miembros superiores mediante ejercicios sin apoyo tiene un efecto significativo sobre la capacidad aeróbica de los miembros superiores sin apoyo. En ECA futuros, se necesita un número mayor de participantes para comparar las diferencias entre el entrenamiento aeróbico de los miembros superiores, el entrenamiento en resistencia de los miembros superiores y el entrenamiento aeróbico y en resistencia combinados sobre los resultados relevantes para el paciente, como la disnea, la CVRS y los niveles de actividad de los brazos.
PICO
Resumen en términos sencillos
Entrenamiento en ejercicios de brazos para la EPOC
Pregunta de la revisión: se examinaron los efectos del entrenamiento de los brazos sobre los síntomas de disnea y la calidad de vida en los pacientes con enfermedad pulmonar obstructiva crónica (EPOC).
Antecedentes: los pacientes con EPOC a menudo tienen dificultades para realizar ejercicios con los brazos debido a la disnea. En consecuencia, el entrenamiento en ejercicios de los brazos se usa con frecuencia para mejorar la capacidad de ejercicio; sin embargo, los efectos de este entrenamiento sobre la disnea y la calidad de vida siguen siendo poco claros. Se programó examinar el entrenamiento en ejercicios de brazos de al menos cuatro semanas de duración, y se lo analizó de tres maneras: a) entrenamiento en ejercicios de brazos comparado con ningún entrenamiento de brazos o intervención simulada; b) una combinación de entrenamiento de brazos y piernas comparado con entrenamiento de piernas solo; y c) entrenamiento de brazos en comparación con otro tipo de entrenamiento de brazos (p.ej. entrenamiento aeróbico de brazos con entrenamiento en fuerza de brazos).
Características de los estudios: se incluyeron 15 estudios en 425 pacientes con EPOC. Sin embargo, solo 12 estudios aportaron información suficiente para el análisis a través de una o más de las tres comparaciones descritas anteriormente.
Resultados clave: cuando el entrenamiento de brazos se comparó con ningún entrenamiento de brazos o una intervención simulada en los pacientes con EPOC, hubo una mejoría pequeña en la disnea. Sin embargo, esta mejoría no fue evidente cuando los estudios de entrenamiento combinado de brazos y piernas se compararon con el entrenamiento de piernas solo. Ningún estudio ha examinado si la mejoría de la disnea es mayor con diferentes tipos de entrenamiento de brazos. El entrenamiento de brazos no tuvo ningún efecto sobre la calidad de vida en ninguna de las tres comparaciones. Cuando se examinó específicamente el entrenamiento aeróbico de brazos, se observó una mejoría en la capacidad de los brazos para moverse y levantar pesos livianos comparados con ningún entrenamiento. Estos efectos no se observaron con el entrenamiento en fuerza de los brazos.
Calidad de la evidencia: la calidad de los estudios incluidos fue baja a moderada, debido al reducido número de participantes (con una variación de 12 a 43 participantes por estudio), falta de información sobre los métodos de estudio y datos incompletos sobre los resultados.
Conclusiones: alguna forma de entrenamiento de brazos puede brindar una mejoría pequeña de la disnea pero no mejora la calidad de vida de los pacientes con EPOC. Más específicamente, el entrenamiento aeróbico de brazos puede aumentar la capacidad de los brazos para levantar pesos livianos en los pacientes con EPOC.
Authors' conclusions
Summary of findings
| Comparison 1: Upper limb training vs No upper limb training for people with COPD | ||||||
| Patient or population: Stable COPD | ||||||
| Outcomes | Anticipated absolute effects* (95% CI) | Relative effect | Number of participants | Quality of the evidence | Comments | |
| Risk with No upper limb training | Risk with Upper limb training | |||||
| Symptoms of dyspnoea | The mean symptoms of dyspnoea was 4.2 points. | The mean symptoms of dyspnoea in the intervention group was 0.37 points higher (0.02 to 0.72 points). | 129 | ⊕⊕⊕o | Higher value post‐intervention is favourable indicating improvement in dyspnoea. The MID for dyspnoea component of the chronic respiratory disease questionnaire is 0.5. | |
| Health‐Related Quality of Life assessed with: Chronic Respiratory Disease Questionnaire Total Score. Follow up: end of rehabilitation (range 6 weeks to 8 weeks) | The mean health‐related quality of life was 5.3 points. | The mean health‐related quality of life in the intervention group was 0.05 points higher (0.3 points lower to 0.36 points higher). | 126 | ⊕⊕⊕o | Higher value post‐intervention is favourable indicating improvement in quality of life. Control group risk determined from studies using the chronic respiratory disease questionnaire. Intervention group risk determined by back transforming the SMD to the CRQ scale. MID of the chronic respiratory disease questionnaire is 0.5. | |
| Peak Upper Limb Exercise Capacity (Supported) assessed with an incremental arm crank test. Follow up: end of rehabilitation (8 weeks) | The mean peak upper limb exercise capacity was 26 watts | The mean peak upper limb exercise capacity in the intervention group was 2.1 watts higher (8 watts lower to 12 watts higher) | 70 | ⊕⊕oo lowa,b | Control group risk determined from studies using peak power output in watts. Intervention group risk determined by back transforming the SMD to watts. | |
| Peak Upper Limb Exercise Capacity (Unsupported) assessed with the incremental unsupported arm test. Follow up: end of rehabilitation (range 4 weeks to 8 weeks) | The mean peak upper limb exercise capacity was 483 seconds. | The mean peak upper limb exercise capacity in the intervention group was 21 seconds higher (20.5 seconds lower to 63 seconds higher). | 112 | ⊕⊕⊕o | ||
| Endurance Upper Limb Exercise Capacity (Supported) assessed with an arm crank test. Follow up: end of rehabilitation (8 weeks) | The mean endurance upper limb exercise capacity was 426 seconds. | The mean endurance upper limb exercise capacity in the intervention group was 56 seconds higher (102 seconds lower to 213 seconds higher). | 57 | ⊕⊕oo lowa,c | Control group risk determined from an arm crank test at 80% peak work and represents time of the test in seconds. Intervention group risk determined by back transforming the SMD to time in seconds. | |
| Endurance Upper Limb Exercise Capacity (Unsupported) assessed by total number of rings moved in 6 minutes. Follow up: end of rehabilitation (range 6 weeks to 8 weeks) | The mean upper limb exercise capacity was 225 rings moved in 6 minutes. | The mean upper limb exercise capacity in the intervention group was 42 more rings moved (12 rings more to 71 rings more moved). | 142 | ⊕⊕oo lowa,d | Control group risk determined from a test that counts the number of rings moved in 6 minutes. Intervention group risk determined by back transforming the SMD to the number of rings moved. | |
| Upper Limb Strength assessed with dynamometry during shoulder flexion in kg. Follow up: end of rehabilitation (range 4 weeks to 16 weeks) | The mean upper limb strength was 21.4 kg | The mean upper limb strength in the intervention group was 1.4 kg higher (2 kg lighter to 5 kg higher) | 43 | ⊕⊕oo lowa,e | Control group risk determined from an arm dynamometry test of shoulder flexion in kg. Intervention group risk determined by back transforming the SMD to kg. | |
| *The risk in the intervention group (and its 95% confidence interval) is based on the assumed risk in the comparison group and the relative effect of the intervention (and its 95% CI). | ||||||
| GRADE Working Group grades of evidence | ||||||
| a Meta‐anlysis was limited to few studies with small sample sizes and wide confidence intervals (imprecision −1) b Meta‐analysis limited by missing information on sequence generation and allocation concealment (2 studies), no blinding of outcome assessment (2 studies), incomplete data (2 studies) (risk of bias −1) c Meta‐analysis limited by missing information on sequence generation and allocation concealment (1 study), no blinding of outcome assessment (1 study), incomplete data (2 studies) (risk of bias −1) d Meta‐analysis limited by missing information on sequence generation and allocation concealment (4 studies), no blinding of outcome assessment (4 studies), incomplete data (2 studies) (risk of bias −1) e Meta‐analysis limited by missing information on sequence generation and allocation concealment (1 study), and no blinding of outcome assessment (1 study) (risk of bias −1) | ||||||
Background
Description of the condition
Chronic obstructive pulmonary disease (COPD) is a progressive disease state characterised by persistent airflow limitation and an enhanced chronic inflammatory response in the airways and lungs to noxious particles or gases (Vestbo 2013). The prevalence of moderate to very severe COPD varies by country, but it has been reported at between 4% and 17% (Buist 2007; Toelle 2013). COPD is a major cause of morbidity, mortality, and increased healthcare costs globally (Chapman 2006). People with COPD often have reduced functional capacity and are physically inactive, which has been associated with increased healthcare utilisation (Garcia‐Aymerich 2006). People with COPD also often experience difficulty with upper limb exercise (Celli 1986; Criner 1988; McKeough 2003); and perform upper limb activities at a lower intensity than their healthy counterparts (Meijer 2014). Difficulty with upper limb exercise in people with COPD is partially due to alterations in the mechanics of breathing associated with the disease, such that the muscles required for the upper limb exercise are also required for breathing (Criner 1988). Consequently, when performing activities using their upper limbs, people with COPD can experience breathlessness and early cessation of the task. Given that most daily living activities require the use of the arms, breathlessness and the early cessation of upper limb activities pose a challenge to people with COPD.
Description of the intervention
Pulmonary rehabilitation, a programme of exercise training, education, and behaviour support, is one management strategy that has strong evidence for improving functional exercise capacity and health‐related quality of life in people with COPD (McCarthy 2015). The exercise training component typically incorporates both lower and upper limb training. The types of upper limb training performed in a conventional pulmonary rehabilitation programme consist of both endurance training (being exercise training to improve the aerobic system) and resistance training (being exercise training where the upper limb muscles contract against an external resistance to improve muscle strength using, for example, resistance machines, free weights, or resistance bands). Endurance training can be further categorised as supported training, where the weight of the upper limb is supported (for example arm cycle ergometer training) or unsupported training, where the weight of the upper limb is not supported (for example lifting a weighted dowel).
How the intervention might work
The upper limb training component of pulmonary rehabilitation for people with COPD has been shown to have effects specific to the type of training performed. Upper limb resistance training has been shown to increase upper limb strength (O'Shea 2004; Janaudis‐Ferreira 2011b), while upper limb endurance training, whether performed supported, unsupported, or as a combined supported/unsupported protocol, has been shown to increase upper limb endurance capacity (Martinez 1993; Holland 2004; McKeough 2012). The possible mechanisms for arm training improving arm exercise capacity have been discussed previously (Janaudis‐Ferreira 2009). They include physiological improvements at the muscle level, such as an increased oxidative capacity as is typical of exercise training effects for the lower limb muscles in COPD (Maltais 1996); improved tolerance to symptoms during arm activity (Gigliotti 2005); and improved force‐generating capacity of the muscles in line with any increases in muscle strength from the upper limb training.
Why it is important to do this review
The latest American Thoracic Society/European Respiratory Society statement on pulmonary rehabilitation recommends that upper limb training be performed in programmes, given the evidence for improvements to upper limb function (Spruit 2013), but the statement also indicates that the optimal form of upper limb training remains to be determined. It is also unclear whether the gains to upper limb function translate to improvements in other important health outcomes, such as symptoms of dyspnoea and health‐related quality of life. Previous reviews of upper limb training have been published including studies up to 2008 (Costi 2009; Ennis 2009; Janaudis‐Ferreira 2009), but only one review included some meta‐analyses of outcomes (Ennis 2009). The current review was conducted to analyse the randomised controlled trials (RCTs) of upper limb training to determine the effects on symptoms of dyspnoea, health‐related quality of life, and measures of upper limb function in people with COPD.
Objectives
To determine the effects of upper limb training (endurance or resistance training, or both) on symptoms of dyspnoea and health‐related quality of life in people with COPD.
Methods
Criteria for considering studies for this review
Types of studies
We included RCTs in which upper limb exercise training of at least four weeks' duration was compared to no training, lower limb training, or another form of arm training. We structured the comparisons as follows:
-
Upper limb training only versus no upper limb training (i.e. usual care only) or sham intervention. In this comparison any study which had an upper limb training component compared to no upper limb training was included even if both groups performed lower limb training.
-
Combined upper limb training and lower limb training versus lower limb training alone. This comparison was structured so that the additional effects of upper limb training to lower limb training could be determined even though the studies included in this section were also part of the first comparison.
-
Upper limb training versus another type of upper limb training intervention (with or without lower limb training in both groups) which, for example, allowed for a comparison of supported versus unsupported upper limb training or endurance versus resistance training.
Types of participants
We included adults with a clinical diagnosis of COPD, diagnosed according to the investigators' definition. Participants were of any age or disease severity. Participants' COPD was stable (that is optimal and stable respiratory medications with no exacerbation or hospital admission within the previous month), although oxygen supplementation during training could have been used.
Types of interventions
We included studies examining upper limb exercise training of at least four weeks' duration as we judged anything less than four weeks of training would not represent a typical pulmonary rehabilitation programme. The upper limb exercise training included endurance training (supported or unsupported training), resistance training, or a combination of resistance and endurance training. The upper limb training was in addition to a prescribed lower limb training programme in some instances. We included inpatient, outpatient, and home‐based training programmes. We recorded the precise nature of the training (intensity, frequency, duration, type) wherever possible.
Types of outcome measures
Primary outcomes
-
Symptoms of dyspnoea measured using dyspnoea scores from a respiratory‐specific quality‐of‐life questionnaire (e.g. dyspnoea from the chronic respiratory disease questionnaire).
-
Health‐related quality of life measured using total scores from generic or respiratory‐specific quality‐of‐life questionnaires (e.g. total score on the chronic respiratory disease questionnaire, total score on the St George's Respiratory Questionnaire).
Secondary outcomes
-
Peak upper limb exercise capacity measured from a peak upper limb exercise test. This was further subdivided into:
-
peak upper limb exercise capacity (supported) when a peak exercise test on an arm crank was used or
-
peak upper limb exercise capacity (unsupported) when the incremental unsupported arm exercise test was used (Takahashi 1999).
-
-
Endurance upper limb exercise capacity measured from an endurance upper limb test. This was further subdivided into:
-
endurance upper limb exercise capacity (supported) when an endurance test on an arm crank was used or
-
endurance upper limb exercise capacity (unsupported) when a functional test with the arms unsupported was used.
-
-
Upper limb strength measured using either hand‐held dynamometry, upper limb resistance machines (e.g. 1 RM) or scored from functional lifting tasks.
-
Respiratory muscle strength measured from a pressure gauge (e.g. maximal inspiratory mouth pressures or maximal sniff nasal inspiratory pressure).
-
Physical activity level from subjective measures (e.g. activity diaries, questionnaires) or objective measures (e.g. activity monitoring devices such as pedometers, accelerometers, multi‐sensor devices).
-
Activities of Daily Living (ADL) function measured as the time or movement intensity during the performance of activities of daily living.
-
Psychological status measured from generic psychological questionnaires or scales (e.g. Hospital Anxiety and Depression Scale).
-
Healthcare utilisation recorded as hospitalisation or length of stay.
Search methods for identification of studies
Electronic searches
We identified trials from the Cochrane Airways Group Specialised Register (CAGR), which is maintained by the Trials Search Co‐ordinator for the Group. The CAGR contains trial reports identified through systematic searches of multiple bibliographic databases, and handsearching of respiratory journals and meeting abstracts (please see Appendix 1 for further details). We searched all records in the CAGR using the search strategy in Appendix 2. We performed an additional search of CENTRAL via the Cochrane Register of Studies Online (CRSO) with the same terms.
We also conducted a search of ClinicalTrials.gov (www.ClinicalTrials.gov) and the World Health Organization trials portal (www.who.int/ictrp/en/). We searched all databases from their inception to 28 September 2016. There was no restriction on language of publication.
Searching other resources
We checked reference lists of all primary studies and review articles for additional references. There were no relevant manufacturers' websites for trial information.
We searched for errata or retractions from included studies published in full text on PubMed (www.ncbi.nlm.nih.gov/pubmed) on 28 September 2016.
Data collection and analysis
Selection of studies
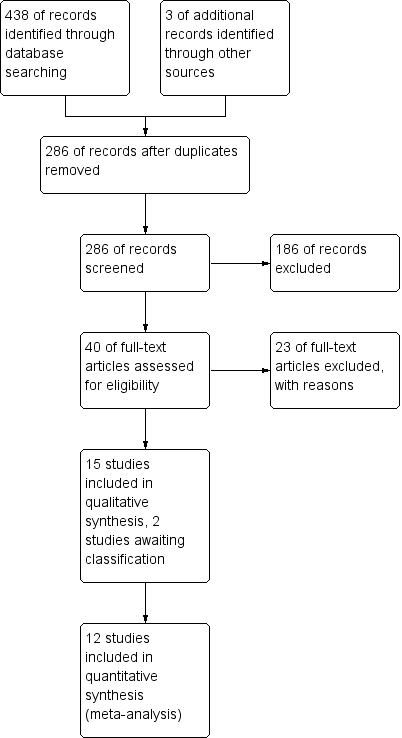
Two review authors (ZM, MV) independently screened titles and abstracts for inclusion of all the potential studies as a result of the search and coded them as 'retrieve' (eligible or potentially eligible/unclear) or 'do not retrieve'. We retrieved the full‐text study reports/publication, and two review authors (ZM, MV) independently screened the full text and identified studies for inclusion, and identified and recorded reasons for exclusion of the ineligible studies. We resolved any disagreement through discussion and consulted a third person (JA) as required. We identified and excluded duplicates and collated multiple reports of the same study so that each study, rather than each report, is the unit of interest in the review. We recorded the selection process in sufficient detail to complete a PRISMA flow diagram (Figure 1) and Characteristics of excluded studies table.
Data extraction and management
We used the Covidence software to record study characteristics and outcome data. Two review authors (ZM, VL) extracted study characteristics from included studies to Covidence. We extracted the following study characteristics.
-
Methods: study design, total duration of study, details of any 'run‐in' period, number of study centres and location, study setting, withdrawals, and date of study.
-
Participants: N, mean age, age range, gender, severity of condition, diagnostic criteria, baseline lung function, smoking history, inclusion criteria, and exclusion criteria.
-
Interventions: intervention and comparison groups.
-
Outcomes: primary and secondary outcomes specified and collected, and time points reported.
-
Notes: funding for trial and notable conflicts of interest of trial authors.
Two review authors (ZM, VL) independently extracted outcome data from included studies to Covidence. We have noted in the Characteristics of included studies table if outcome data were not reported in a usable way. We resolved disagreements by consensus or by involving a third person (JA). One review author (ZM) transferred data from Covidence into Review Manager. A second review author (VL) did spot checks of study characteristics for accuracy against the reports in Covidence.
Assessment of risk of bias in included studies
Two review authors (ZM, MV) independently assessed risk of bias for each study using the criteria outlined in the Cochrane Handbook for Systematic Reviews of Interventions (Higgins 2011). We resolved any disagreements by discussion or by involving another review author (JA). We assessed the risk of bias according to the following domains.
-
Random sequence generation.
-
Allocation concealment.
-
Blinding of participants and personnel.
-
Blinding of outcome assessment.
-
Incomplete outcome data.
-
Selective outcome reporting.
-
Other bias.
We graded each potential source of bias as high, low, or unclear and provided a quote from the study report together with a justification for our judgement in the 'Risk of bias' table. We summarised the risk‐of‐bias judgements across different studies for each of the domains listed using the Covidence software and one review author (ZM) transferred data from Covidence into Review Manager. We considered blinding separately for different key outcomes where necessary (for example for unblinded outcome assessment). Where information on risk of bias relates to unpublished data or correspondence with a trialist, we have noted this in the 'Risk of bias' table.
When considering treatment effects, we have taken into account the risk of bias for the studies that contribute to that outcome.
Assessment of bias in conducting the systematic review
We conducted the review according to the published protocol and report any deviations from it in the 'Differences between protocol and review' section of the systematic review.
Measures of treatment effect
For continuous variables, we recorded mean post‐intervention values and standard deviations for each group. We entered data presented as a scale with a consistent direction of effect. Continuous data was analysed as mean differences (MDs) for outcomes with the same metrics, or standardised mean differences (SMDs) for outcomes with different metrics. There were no dichotomous data in this review.
We undertook meta‐analyses only where this was meaningful: that is, where the treatments, participants, and the underlying clinical question were similar enough for pooling to make sense.
Where multiple trial arms were reported in a single trial, we only included the relevant arms for each of the comparisons. If two comparisons (for example endurance upper limb training versus no upper limb training, resistance upper limb training versus no upper limb training) were combined in the same meta‐analysis, we halved the control group to avoid double‐counting.
Unit of analysis issues
We did not include crossover trials and did not encounter cluster randomised trials.
Dealing with missing data
We contacted investigators or study sponsors in order to verify key study characteristics and to obtain missing numerical outcome data where possible (for example when a study was identified as abstract only). Where we could not make contact, the lack of data was substantial such that pooling for the meta‐analyses was not possible.
Assessment of heterogeneity
We used the I² statistic to measure heterogeneity among the trials in each analysis. Where substantial heterogeneity was evident, we have reported it and explored possible causes by subgroup analysis.
Assessment of reporting biases
A funnel plot to explore possible small study and publication bias was not conducted as we were unable to pool more than 10 trials.
Data synthesis
We used a random‐effects model and planned to perform any sensitivity analyses with a random‐effects model.
Summary of findings table
We have created a 'Summary of findings' table for comparison 1 only using the following outcomes: symptoms of dyspnoea, quality of life, peak upper limb exercise capacity (supported), peak upper limb exercise capacity (unsupported), endurance upper limb exercise capacity (supported), endurance upper limb exercise capacity (unsupported), upper limb strength. We used the five GRADE considerations (study limitations, consistency of effect, imprecision, indirectness, and publication bias) to assess the quality of a body of evidence as it related to the studies that contributed data to the meta‐analyses for the prespecified outcomes. We used methods and recommendations described in Section 8.5 and Chapter 12 of the Cochrane Handbook for Systematic Reviews of Interventions (Higgins 2011), using GRADEpro software. We justified all decisions to down‐ or upgrade the quality of studies using footnotes, and have made comments to aid readers' understanding of the review where necessary.
Subgroup analysis and investigation of heterogeneity
There were not sufficient data for the planned subgroup analysis of severity of lung disease (i.e. severe (FEV1% predicted < 40%) versus not severe (FEV1% predicted ≥ 40%)) on symptoms of dyspnoea and health‐related quality of life. If enough studies are included in future updates to make this subgroup analysis possible, the formal test for subgroup interactions in Review Manager will be used.
Sensitivity analysis
There were not sufficient data to perform sensitivity analysis to analyse the effect of risk of bias. If enough studies are included in future updates, we will perform a separate analysis with only those included studies that have a low risk of bias for at least three of the following domains: random sequence generation, allocation concealment, blinding of outcome assessment, and incomplete outcome data.
Results
Description of studies
Refer to the Characteristics of included studies, Characteristics of excluded studies and Characteristics of studies awaiting classification for the details of the studies included, excluded and awaiting classification.
Results of the search
The initial search of the databases in 2014 yielded 179 records (after discarding 118 duplicates) with three additional studies identified by handsearching. Repeat searches in 2015 and 2016 yielded an additional 104 records (after discarding 37 duplicates) bringing the total records screened to 286. From this list, based on titles and abstracts, we excluded 186 records and assessed 40 records for eligibility via full text. We excluded 23 of these studies as they did not meet the review criteria as indicated in the Characteristics of excluded studies table. We made attempts to contact the author of one study as it was unclear from the abstract whether the upper limb training was performed for at least four weeks (Mador 2012). No reply was received so this record remains as a study awaiting classification. One other study which was identified in the latest search (28 September 2016) also remains as a study awaiting classification and will undergo full review with the next review update (Calik‐Kutukcu 2015). Fifteen studies were appropriate for inclusion in the review with agreement reached between the review author team for all studies (kappa = 1, indicating excellent agreement). See Figure 1 for the PRISMA study flow diagram.
Included studies
Fifteen studies on 425 participants met the inclusion criteria for this review. One study was in abstract form only (Matsunaga 2011). Two studies were by the same author group and related to the same study design but with different outcomes reported (Covey 2012; Larson 2014). Two studies required translation, one from Portuguese to English (Ike 2010); and one from Spanish to English (Sivori 1998). Further details of included studies can be found in the Characteristics of included studies.
Participants
All studies defined participants as having stable COPD. The sample size of studies ranged from 12 to 43 participants with a mean age ranging from 57 to 72 years and a mean FEV₁of 27% to 60% predicted, indicating moderate to very severe disease (Global 2016).
Intervention
A number of different upper limb training interventions were prescribed across the fifteen studies, including resistance training and endurance training. The latter was further defined as supported endurance training (e.g. arm crank training), unsupported endurance training (e.g. using light weights) and a combination of both supported and unsupported endurance training (e.g. both arm crank training and upper limb exercises with light weights were performed). There were eight studies that examined resistance training (Ries 1988; Marrara 2008; Ike 2010; Janaudis‐Ferreira 2011; Matsunaga 2011; Covey 2012; McKeough 2012; Larson 2014). In these studies, the training frequency ranged from training 2 to 4 times weekly over a 6‐ to 16‐week period with total sessions ranging from 8 to 32. Initial intensity was prescribed between 60% to 80% of the one repetition maximum or based on a load that could be lifted between six to 10 times. The studies described the upper limb exercises as being performed as two to three sets of four to 10 repetitions per set.
There were nine studies that examined endurance upper limb training (Ries 1988; Lake 1990a; Martinez 1993; Bauldoff 1996; Epstein 1997; Sivori 1998; Holland 2004; Subin 2010; McKeough 2012), with one study examining supported endurance training alone (Martinez 1993), six studies examining unsupported endurance training alone (Martinez 1993; Bauldoff 1996; Epstein 1997; Sivori 1998; Holland 2004; Subin 2010), and three studies examining a combination of supported and unsupported endurance training (Ries 1988; Lake 1990a; McKeough 2012). The Martinez 1993 study was unique in directly comparing a supported to an unsupported endurance upper limb training protocol. In the studies that examined endurance training, the training frequency varied from once weekly to five days per week with the training duration ranging from four to 10 weeks and the total sessions ranging from eight to 40.
There were 14 out of 15 studies that examined some form of upper limb training to a comparator group that did not perform any upper limb training (comparison 1), with the Martinez 1993 study being the one exception. Of these 14 studies, eight studies used lower limb exercise training in both intervention and control groups, thus exploring whether the addition of upper limb training to lower limb training had benefits over lower limb training alone (comparison 2) (Ries 1988; Lake 1990a; Sivori 1998; Holland 2004; Subin 2010; Janaudis‐Ferreira 2011; Matsunaga 2011; McKeough 2012). There were also two studies that had multiple trial arms which allowed a direct comparison of resistance upper limb training to endurance upper limb training (comparison 3) (Ries 1988; McKeough 2012). The McKeough 2012 study was the only study that also had a further trial arm that examined endurance and resistance training combined.
In terms of the primary comparison (comparison 1), the control group interventions also varied with three of the studies having a control group that did not do upper limb or lower limb training (Lake 1990a; Bauldoff 1996; Epstein 1997), eight studies doing lower limb training only as described previously (Ries 1988; Lake 1990a; Sivori 1998; Holland 2004; Subin 2010; Janaudis‐Ferreira 2011; Matsunaga 2011; McKeough 2012), and six of the studies doing some form of a sham intervention only (e.g. respiratory muscle training (Epstein 1997), gentle chair exercises with upper limb stretching (Covey 2012; Larson 2014), a finger dexterity task (Holland 2004), and upper limb flexibility exercises (Marrara 2008; Janaudis‐Ferreira 2011)). The Lake 1990a study was included twice in this description as this study had multiple arms: a control group in comparison 1 that did no exercise training was compared to an intervention group that did unsupported and supported endurance training; and a control group in comparison 1 and 2 that just did lower limb training was compared to an intervention group that did unsupported and supported endurance training with lower limb training.
Outcomes
The primary outcome of dyspnoea was measured in four studies using the dyspnoea score of the Chronic Respiratory Disease Questionnaire (Holland 2004; Subin 2010; Janaudis‐Ferreira 2011; Covey 2012). Health‐related quality of life was measured by the total score of the Chronic Respiratory Disease Questionnaire (Sivori 1998; Holland 2004; Janaudis‐Ferreira 2011); and the total score of the St George's Respiratory Questionnaire (SGRQ) (McKeough 2012). For the SGRQ, an improvement in quality of life is represented by a lower score, so the data that was pooled was reversed to provide a consistent direction of effect.
Most studies conducted some form of upper limb exercise test, with four studies performing an incremental supported arm exercise test to peak work capacity using an arm crank machine (Ries 1988; Lake 1990a; Martinez 1993; McKeough 2012), four studies — Holland 2004, Subin 2010, Janaudis‐Ferreira 2011 and McKeough 2012 — performing the incremental unsupported arm exercise test involving a weighted dowel and arm chart (Takahashi 1999), two studies performing an endurance upper limb test with an arm crank machine (Ries 1988; McKeough 2012), and five studies — Ries 1988, Martinez 1993, Bauldoff 1996, Epstein 1997 and Sivori 1998 — performing an unsupported endurance upper limb test such as the 6‐minute pegboard test or weighted dowel test. While the unsupported endurance upper limb tests have been referred to as endurance tests, it is acknowledged that these tests are regarded as more functional tests (e.g. 6‐minute pegboard test) and are not a style of test that would traditionally be referred to as endurance tests in the exercise science literature. However, this terminology has been used for ease of comparison to the other supported endurance upper limb tests.
Upper limb strength was measured in a variety of ways including repetition maximum tests on resistance machines (Ike 2010), arm dynamometry (Janaudis‐Ferreira 2011), and functional tests which summed the scores of a number of lifts (Covey 2012). Respiratory muscle strength was measured in seven studies using the maximum inspiratory pressure (Lake 1990a; Martinez 1993; Epstein 1997; Sivori 1998; Matsunaga 2011; Covey 2012; McKeough 2012). Physical activity level was measured both subjectively using the functional performance inventory (Covey 2012), and objectively using an actigraph accelerometer (Larson 2014). An upper limb activity of daily living measure was utilised in two studies with a blackboard task (Marrara 2008), and time to complete three tasks of dishwashing, a blackboard task and a grocery shelving task (Ries 1988). One study examined hospitalisation via the hospitalisation index, being the number of days in hospital multiplied by number of patients (Sivori 1998). No studies examined psychological status following upper limb training.
It was not always possible to pool data from all the relevant studies in each comparison due to there not being sufficient data (Martinez 1993; Marrara 2008; Matsunaga 2011), or due to reporting different outcomes.
Excluded studies
There were 23 studies excluded from this review. The common reasons for exclusion were an intervention which did not fit the study criteria (n = 14) or a study design which did not fit the study criteria (n = 3). Refer to the Characteristics of excluded studies for the reasons for exclusion for each study.
Risk of bias in included studies
There was variation in the risk of bias across the included studies. Refer to the Characteristics of included studies for all details on risk of bias in each study as well as Figure 2 and Figure 3 for a summary of the authors' judgements on risk of bias across the included studies.


Risk of bias graph: review authors' judgements about each risk of bias item presented as percentages across all included studies.
Allocation
All studies were RCTs with random allocation. However, only seven studies indicated how the random sequence was generated (Bauldoff 1996; Sivori 1998; Subin 2010; Janaudis‐Ferreira 2011; Covey 2012; McKeough 2012; Larson 2014); and five studies indicated that the allocation was concealed (Bauldoff 1996; Janaudis‐Ferreira 2011; Covey 2012; McKeough 2012; Larson 2014). The remaining studies did not provide sufficient information to determine random sequence generation (Ries 1988; Lake 1990a; Martinez 1993; Epstein 1997; Holland 2004; Marrara 2008; Ike 2010; Matsunaga 2011); or allocation concealment (Ries 1988; Lake 1990a; Martinez 1993; Epstein 1997; Sivori 1998; Holland 2004; Marrara 2008; Ike 2010; Subin 2010; Matsunaga 2011).
Blinding
Blinding of the trainers and complete blinding of the participants was not possible in any of the studies given the nature of the upper limb exercise training interventions. However, five studies attempted to partially blind participants by using a sham intervention involving the upper limbs (Holland 2004; Marrara 2008; Janaudis‐Ferreira 2011; Covey 2012; Larson 2014). None of these studies verified the extent of the blinding with participants although one study stated that the patients remained unaware of group allocation (Janaudis‐Ferreira 2011). Six of the studies had blinding of the outcome assessment as an assessor was used who had not been involved in the delivery of interventions (Epstein 1997; Holland 2004; Janaudis‐Ferreira 2011; Covey 2012; McKeough 2012; Larson 2014).
Incomplete outcome data
Seven studies indicated adequate completion of outcome data with no to minimal drop‐outs reported (Lake 1990a; Martinez 1993; Epstein 1997; Holland 2004; Ike 2010; Subin 2010; Janaudis‐Ferreira 2011). Six studies had significant incomplete data due to participant drop‐out ranging from 24% to 42% (Ries 1988; Sivori 1998; Marrara 2008; Covey 2012; McKeough 2012; Larson 2014). Two studies were rated as having unclear bias due to a lack of information on whether participants completed the outcomes (Bauldoff 1996; Matsunaga 2011).
Selective reporting
Most studies were conducted prior to registration requirements. However, four studies were listed on a clinical trials registry (Janaudis‐Ferreira 2011; Covey 2012; McKeough 2012; Larson 2014). Results were reported for all outcomes as stated in the registry for one study (Janaudis‐Ferreira 2011). However, three of these studies had selection bias, with one study not reporting one of the outcomes stated in the clinical trials registry (McKeough 2012); and two papers representing the same study with different data reported in each paper (Covey 2012; Larson 2014). In terms of the remaining eleven studies, one study was rated high for bias as no mean group data was provided so data was not used in the meta‐analysis (Martinez 1993). In addition, six studies were rated as unclear as there was information missing for specified outcomes (Ries 1988; Lake 1990a; Sivori 1998; Holland 2004; Marrara 2008; Matsunaga 2011) or not enough information existed from an abstract (Matsunaga 2011). The other four studies reported data on all specified outcomes (Bauldoff 1996; Epstein 1997; Ike 2010; Subin 2010).
Other potential sources of bias
Most studies were free of other sources of bias. One study was rated as high as it used a block randomisation procedure in an unblinded trial (Subin 2010).
Effects of interventions
See summary of findings Table for the main comparison, being the main comparison of upper limb training versus no upper limb training in people with COPD (comparison 1).
There was sufficient data from 12 studies to be considered for the meta‐analyses across the three comparisons with a total of 12 studies used for the main comparison (comparison 1), seven studies used for comparison 2 and two studies used for comparison 3. See also Data and analyses sections for the summary of the meta‐analyses conducted for each outcome within each of the three comparisons. For all outcomes, a positive value indicates an improvement.
The remaining three studies will have their narrative data discussed together with the pooled data (Martinez 1993; Marrara 2008; Matsunaga 2011). The data from the McKeough 2012 study for the trial arm of combined endurance and resistance training has also not been pooled as the data from the endurance training only and resistance training only groups was used.
Primary outcome: symptoms of dyspnoea
When upper limb training was compared to no upper limb training or a sham intervention (comparison 1), there were four studies which provided data on dyspnoea from the Chronic Respiratory Disease Questionnaire, all of which could be pooled for meta‐analysis giving a total of 66 participants in the intervention group and 63 participants in the control group (Holland 2004; Subin 2010; Janaudis‐Ferreira 2011; Covey 2012). Results of the meta‐analysis are shown in Figure 4. There was a small significant improvement in symptoms of dyspnoea favouring the intervention group with a mean difference (MD) of 0.37 points (95% confidence interval (CI) 0.02 to 0.72 points) (Analysis 1.1). No statistically significant improvement in dyspnoea was shown when studies of endurance training only (MD 0.41 points, 95% CI −0.13 to 0.95 points) (Holland 2004; Subin 2010), or resistance training only (MD 0.34 points, 95% CI −0.11 to 0.8 points) (Janaudis‐Ferreira 2011; Covey 2012) were analysed.

Forest plot of comparison: 1 Upper limb training only versus control, outcome: 1.1 Symptoms of Dyspnoea.
When upper limb training combined with lower limb training was compared to lower limb training alone (comparison 2), there were three studies which provided data on dyspnoea from the Chronic Respiratory Disease Questionnaire, all of which could be pooled for meta‐analysis giving a total of 44 participants in the intervention group and 42 participants in the control group (Holland 2004; Subin 2010; Janaudis‐Ferreira 2011). No significant difference in dyspnoea between groups was shown (MD 0.36, 95% CI −0.04 to 0.76) (Analysis 2.1). There were no studies which examined upper limb training compared to another upper limb training intervention on dyspnoea. The tests of heterogeneity for all analyses of symptoms of dyspnoea were not significant.
Primary outcome: health‐related quality of life
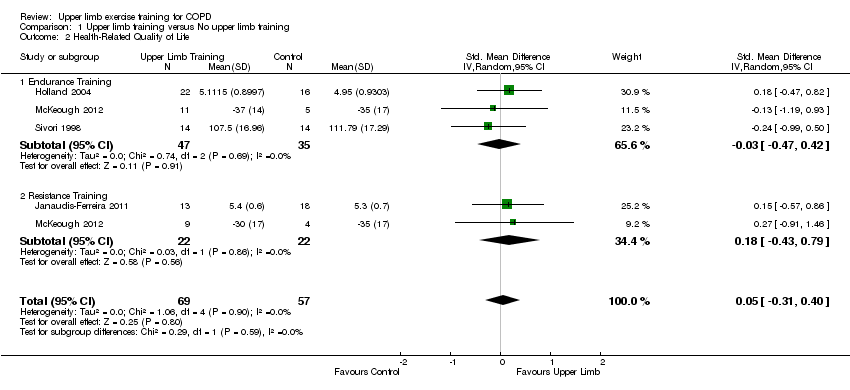
When upper limb training was compared to no upper limb training (comparison 1), there were five studies which examined health‐related quality of life, of which four studies could be pooled for meta‐analysis giving a total of 69 participants in the intervention group and 57 participants in the control group (Sivori 1998; Holland 2004; Janaudis‐Ferreira 2011; McKeough 2012). There was no significant differences shown between groups in health‐related quality of life with a standardised mean difference (SMD) of 0.05 (95% CI −0.31 to 0.40) (Figure 5). There was also no significant difference between groups with the studies examining endurance training alone (SMD −0.03, 95% CI −0.47 to 0.42) in 82 participants; or resistance training alone (SMD 0.18, 95% CI −0.43 to 0.79) in 44 participants (Analysis 1.2). In the McKeough 2012 study that had the additional trial arm of combined endurance and resistance upper limb training compared to no upper limb training, the paper also reported no significant between‐group differences in health‐related quality of life (MD −6 points, 95% −18 to 5).

Forest plot of comparison: 1 Upper limb training only versus control, outcome: 1.2 Health‐Related Quality of Life.
When upper limb training combined with lower limb training was compared to lower limb training alone (comparison 2), there were four studies which examined health‐related quality of life, of which three studies could be pooled for meta‐analysis giving a total of 56 participants in the intervention group and 39 participants in the control group (Sivori 1998; Holland 2004; McKeough 2012). There were no significant differences shown between groups in health‐related quality of life (SMD 0.01, 95% CI −0.40 to 0.43) (Analysis 2.2). The Matsunaga 2011 study which was in abstract form only and did not provide sufficient data for pooling in the meta‐analysis, examined health‐related quality of life using the St George's Respiratory Questionnaire. A significant improvement in quality of life was shown in the group who performed upper limb training combined with lower limb training (P < 0.001) but no results were provided for the lower limb training group so no between‐group differences could be determined.
There was only a single study which compared upper limb endurance training to upper limb resistance training (comparison 3) on health‐related quality of life in people with COPD (McKeough 2012). This study reported no significant difference in the total score of the SGRQ between groups (MD 2 points, 95% CI −9 to 12) (McKeough 2012).
The tests of heterogeneity for all analyses of health‐related quality of life were not significant.
Secondary outcome: peak upper limb exercise capacity
When upper limb training was compared to no upper limb training (comparison 1), there were three studies which examined supported peak upper limb exercise capacity (Ries 1988; Lake 1990a; McKeough 2012); and four studies which examined unsupported peak upper limb exercise capacity (Holland 2004; Subin 2010; Janaudis‐Ferreira 2011; McKeough 2012). No significant between‐group differences were shown for either supported peak upper limb exercise capacity (SMD 0.17, 95% CI −0.43 to 0.77, 83 participants) (Analysis 1.3) or unsupported peak upper limb exercise capacity (MD 21.23 secs, 95% CI −20.45 to 62.92 secs, 112 participants) (Analysis 1.4), with no differences in these outcomes when endurance training and resistance training were analysed separately.
When upper limb training combined with lower limb training was compared to lower limb training alone (comparison 2), there were three studies which examined supported peak upper limb exercise capacity (Ries 1988; Lake 1990a; McKeough 2012), and three studies which examined unsupported peak upper limb exercise capacity (Holland 2004; Subin 2010; McKeough 2012). No significant between‐group differences were shown for either supported peak upper limb exercise capacity (SMD −0.06, 95% CI −0.55 to 0.44, 70 participants) (Analysis 2.3) or unsupported peak upper limb exercise capacity (MD 13.26 secs, 95% CI −39.88 to 66.40 secs, 81 participants) (Analysis 2.4).
There were three studies that examined an upper limb training intervention compared to another type of upper limb training on supported peak upper limb exercise capacity (Ries 1988; Martinez 1993; McKeough 2012). Two studies compared upper limb endurance training to upper limb resistance training and were able to be pooled in a meta‐analysis (Ries 1988; McKeough 2012), with results showing no between group differences in supported peak upper limb exercise capacity (SMD 0.36, 95% CI −0.29 to 1.02, 37 participants) (Analysis 3.2).The Martinez 1993 study compared supported upper limb endurance training to unsupported upper limb endurance training on a background of lower limb training in both groups. This study reported that both groups improved supported peak upper limb exercise capacity. Only a single study compared upper limb interventions on unsupported peak upper limb exercise capacity (McKeough 2012). This study reported no significant differences between the upper limb endurance training group and the upper limb resistance training group for unsupported peak upper limb exercise capacity (MD 24 secs, 95% CI −48 to 90 secs, 20 participants) (McKeough 2012).
The tests of heterogeneity for all analyses of peak upper limb exercise capacity were not significant. However, when the studies of supported peak upper limb exercise capacity were reviewed, one paper had a large baseline imbalance with higher peak workloads in the upper limb training group compared to the control group which contributed to a heterogeneity of I² = 40% (P = 0.14) (Lake 1990a).
Secondary outcome: endurance upper limb exercise capacity
When upper limb training was compared to no upper limb training (comparison 1), there were two studies which examined supported endurance upper limb exercise capacity (Ries 1988; McKeough 2012); and six studies which examined unsupported endurance upper limb exercise capacity (Ries 1988; Bauldoff 1996; Epstein 1997; Sivori 1998; Ike 2010; Janaudis‐Ferreira 2011). No significant between‐group differences were shown for supported endurance upper limb exercise capacity (SMD 0.25, 95% CI −0.46 to 0.96, 57 participants) (Analysis 1.5) with no differences in this outcome when endurance training and resistance training were analysed separately. However, a large mean between‐group difference favouring the intervention group was shown when examining unsupported endurance upper limb exercise capacity (SMD 0.66, 95% CI 0.19 to 1.13, 142 participants, I² = 43%, Heterogeneity P = 0.1) (Figure 6). Interestingly, this improvement remained when the studies of upper limb endurance training alone were examined (SMD 0.99, 95% CI 0.32 to 1.66, 85 participants, I² = 51%, Heterogeneity P = 0.11) but no longer existed for the studies of upper limb resistance training (SMD 0.23, 95% CI −0.31 to 0.76, 57 participants, I² = 0%, Heterogeneity P = 0.91) with subgroup differences trending towards significance (P = 0.08) (Analysis 1.6).

Forest plot of comparison: 1 Upper limb training versus No upper limb training, outcome: 1.6 Endurance Upper Limb Exercise Capacity: Unsupported.
When upper limb training combined with lower limb training was compared to lower limb training alone (comparison 2), the same two studies were part of the analysis for supported endurance upper limb exercise capacity (Ries 1988; McKeough 2012), showing no between‐group difference (SMD 0.25, 95% CI −0.46 to 0.96, 57 participants) (Analysis 2.5). There were three studies which examined comparison 2 on unsupported endurance upper limb exercise capacity (Ries 1988; Sivori 1998; Janaudis‐Ferreira 2011), with a large mean between‐group difference favouring the combined upper limb and lower limb training intervention (SMD 0.90, 95% CI 0.12 to 1.68, 87 participants) (Figure 7). There was a slight heterogeneity between studies for this analysis (P = 0.05, I² = 62%), related to the different training programmes used across studies. When a sensitivity analysis was run using the studies with an endurance training programme, the large mean between‐group difference favouring the combined upper limb and lower limb training intervention on unsupported endurance upper limb exercise capacity remained (SMD 1.61, 95% CI 0.89 to 2.33, 42 participants, I² = 0%). When the sensitivity analysis examined the studies of resistance training only, there was no between‐group difference on unsupported endurance upper limb exercise capacity (SMD 0.29, 95% CI −0.31 to 0.89, 45 participants, I² = 0%).

Forest plot of comparison: 2 Combined upper limb training and lower limb training versus lower limb training alone, outcome: 2.6 Endurance Upper Limb Exercise Capacity: Unsupported.
Two studies compared upper limb endurance training to upper limb resistance training and were able to be pooled in a meta‐analysis (Ries 1988; McKeough 2012), with results showing no between group differences in supported endurance upper limb exercise capacity (SMD 0.64, 95% CI −0.03 to 1.31, 37 participants) (Analysis 3.4). The Ries 1988 study also examined the effect on unsupported endurance upper limb exercise capacity, with this paper reporting that both training groups improved the number of lifts in one minute summated from two upper limb exercises performed on each arm. No between‐group differences were discussed in this paper but Analysis 3.5 suggests that the post‐intervention scores were significantly greater in the endurance training group compared to the resistance training group (MD 6 lifts, 95% CI 0.29 to 11.71, 17 participants).
The Martinez 1993 study, comparing supported and unsupported upper limb endurance training, examined unsupported endurance upper limb exercise capacity and stated that both groups improved on this measure but a significantly greater improvement was shown in the unsupported upper limb training group (P = 0.002). No measure of supported endurance upper limb exercise capacity was used in this study.
Secondary outcome: upper limb strength
When upper limb training was compared to no upper limb training (comparison 1), there were three studies which examined upper limb strength, all of which had used an upper limb resistance training programme (Ike 2010; Janaudis‐Ferreira 2011; Covey 2012). However, only data from Ike 2010 and Janaudis‐Ferreira 2011 could be pooled for meta‐analysis as the data from Covey 2012 was not available for the resistance training group alone (see explanation in Characteristics of included studies). Both the included studies contributed data from different strength tests to the analysis (with the control group numbers halved across this data input) (Ike 2010; Janaudis‐Ferreira 2011). No between‐group differences were shown for upper limb strength (SMD 0.25, 95% CI −0.39 to 0.89, 43 participants) (Analysis 1.7). One of these studies also contributed to comparison 2 (Janaudis‐Ferreira 2011), showing no between‐group differences when the addition of upper limb resistance training to lower limb training versus lower limb training alone was specifically examined (SMD 0.01, 95% CI −0.70 to 0.73, 21 participants) (Analysis 2.7). No studies compared different upper limb training interventions (comparison 3) on upper limb strength.
Secondary outcome: respiratory muscle strength
When upper limb training was compared to no upper limb training (comparison 1), there were six studies which examined respiratory muscle strength (Lake 1990a; Epstein 1997; Sivori 1998; Matsunaga 2011; Covey 2012; McKeough 2012), of which five studies could be pooled for meta‐analysis (Lake 1990a; Epstein 1997; Sivori 1998; Covey 2012; McKeough 2012). No between‐group differences were shown for Pimax (MD −1.70 cmH₂O, 95% CI −8.35 to 4.94, 148 participants) (Analysis 1.8). Four of these studies also contributed to comparison 2 (Ries 1988; Lake 1990a; Matsunaga 2011; McKeough 2012), three of which could be pooled for meta‐analysis (Ries 1988; Lake 1990a; McKeough 2012). No between‐group differences were shown for Pimax (MD −0.46 cmH₂O, 95% CI −8.99 to 8.07, 70 participants) (Analysis 2.8). The Matsunaga 2011 study, where data could not be pooled, showed a significant improvement in respiratory muscle strength in the group who performed upper limb training combined with lower limb training (P = 0.028) but no results were provided for the lower limb training group so no between‐group differences could be determined.
There were two studies that compared different upper limb training interventions. The McKeough 2012 study showed no differences in the change scores from baseline to post‐intervention between the resistance upper limb training group and the endurance upper limb training group (unpublished data) on Pimax despite the post‐intervention scores being significantly higher in the resistance upper limb training group (Analysis 3.6). The Martinez 1993 study also examined respiratory muscle strength and reported that both the supported and unsupported upper limb training groups improved to a similar degree following training but no further data was provided.
Secondary outcome: physical activity level
Physical activity level was examined in two studies for comparison 1 only (Covey 2012; Larson 2014). The Covey 2012 study showed no between group differences in the Functional Performance Inventory total score while the Larson 2014 study (which used the same group of participants as the Covey 2012 study who had completed accelerometry testing) also showed no significant between group differences in time spent in moderate intensity activities.
Secondary outcome: activities of daily living
There were two studies which examined a task/s that reflected a daily living activity with the upper limbs (Ries 1988; Marrara 2008). However, the Marrara 2008 study only provided metabolic data (i.e. no time data) following the performance of the task with results indicating significantly reduced metabolic and ventilatory demand during a blackboard task in the upper limb training group compared to a control group of no training. However, no between‐group data were presented. The Ries 1988 study showed no between‐group differences on the duration of a blackboard/grocery shelving/dishwashing task (SMD 0.67, 95% CI −0.12 to 1.47, 28 participants) (Analysis 1.11, Analysis 2.9 ) where the data from the upper limb resistance training group and endurance training group were pooled and compared to a control of lower limb training. This study reported no within‐group improvements to the duration of these tasks for the combined upper limb and lower limb training group (Ries 1988). The Ries 1988 study also showed no between group differences when the upper limb endurance training group was compared to the upper limb resistance training group.
Secondary outcome: healthcare utilisation
One study evaluated healthcare utilisation in a group performing upper limb training with lower limb training compared to lower limb training alone. Both groups improved the hospitalisation index (number of hospital days × number of patients) following the intervention with no between‐group differences (P > 0.05).
Discussion
Summary of main results
This review identified 14 studies in people with COPD comparing upper limb training to no training or a sham intervention (with or without lower limb training) with eight of these studies comparing a combination of upper limb training and lower limb training to lower limb training only. Three studies were identified comparing an upper limb training intervention to another upper limb training intervention in people with COPD. Upper limb training resulted in a small improvement in symptoms of dyspnoea but no significant improvement to health‐related quality of life when compared to no training. The addition of upper limb training to a lower limb training programme made no difference to dyspnoea or health‐related quality of life when compared to lower limb training alone. When endurance upper limb training was compared to resistance upper limb training, there was no data available on symptoms of dyspnoea and no between‐group differences were shown in health‐related quality of life.
The mean improvement in the dyspnoea score following upper limb training compared to no upper limb training or a sham intervention was 0.37 points (0.02 to 0.72). Given the minimal important difference (MID) for the Chronic Respiratory Disease Questionnaire (Dyspnoea domain) is 0.5 points, this mean improvement was small and did not reach the MID although at the highest end of the 95% confidence interval it did meet the MID, suggesting that some people with COPD did experience a clinically relevant improvement in dyspnoea following upper limb training.
In terms of the secondary outcomes, positive results were shown for unsupported endurance upper limb exercise capacity where a significant improvement occurred for upper limb training compared to no training. Furthermore, the studies that used an endurance upper limb training protocol only showed an effect on unsupported endurance upper limb exercise capacity while the studies using a resistance training protocol failed to show an effect on this outcome compared to no training. This result is no surprise as it supports the specificity of training principle, whereby people improve in the skill or exercise in which they train. Only one study directly compared upper limb endurance training to upper limb resistance training on unsupported endurance upper limb capacity, with both groups showing improvements although post‐intervention scores were significantly higher in the endurance training group (Ries 1988). More studies are required to directly compare these training protocols. The results for the other secondary outcomes of peak exercise capacity, upper limb strength, respiratory muscle strength, physical activity level, activities of daily living and healthcare utilisation across all comparisons were unremarkable, with no significant between‐group differences shown.
Overall completeness and applicability of evidence
This review was conducted in people with stable COPD in a typical age range of 57 to 72 years with studies focused mainly on people with moderate to very severe disease. This review would be applicable to this group of people but cannot be extrapolated to people involved in exercise training during or immediately following an acute exacerbation or people with milder disease. No long‐term studies of upper limb training were identified so these results only indicate the short‐term effects of upper limb training.
The studies in this review examined a broad spectrum of upper limb exercise training modes covering endurance training and resistance training. Only one study examined a combination of endurance and resistance upper limb training (McKeough 2012). The majority of studies involving endurance upper limb training included unsupported (functional) upper limb training with four out of nine studies including supported upper limb training (i.e. arm cranking) (Ries 1988; Lake 1990a; Martinez 1993; McKeough 2012). These upper limb training protocols align with the types of lower limb training promoted in pulmonary rehabilitation programmes, being both endurance activities such as cycling and walking as well as resistance training for the lower limbs (McCarthy 2015). Previous pulmonary rehabilitation guidelines have indicated the importance of unsupported endurance upper limb training (Ries 2007); and this review confirms that this type of training was more effective at improving unsupported endurance upper limb exercise capacity compared to a control of no training or a sham intervention. Hence, performance of unsupported endurance upper limb training in people with stable COPD is to be encouraged if a primary goal is to improve functional upper limb capacity. However, the limited studies in this review specific to endurance training suggest that this training is unlikely to change quality of life compared to no training. The optimal dose for unsupported upper limb training to improve functional upper limb capacity cannot be determined from this review as no RCTs have directly compared different dosages of the same type of upper limb training. The common features to the training prescription in the studies examining endurance training in this review were that programmes were supervised, of more than 4 weeks' duration and had a frequency of at least once weekly. The actual intensity of training was often poorly described, further hindering conclusive remarks on optimal exercise dose.
The use of upper limb resistance training remains unclear for people with stable COPD. While there were eight studies which utilised this mode of training (Ries 1988; Marrara 2008; Ike 2010; Janaudis‐Ferreira 2011; Matsunaga 2011; Covey 2012; McKeough 2012; Larson 2014), the wide range of strength outcomes assessed and missing data in studies makes conclusions difficult to reach. The training prescription also varied from eight to 32 sessions with the common features being supervision, more than 4 weeks' duration, a load of 60% to 80% of the one repetition maximum (or a load which could be lifted between six to 10 times) with a frequency of at least two sets of four to 10 repetitions for at least two days per week. Of the data that could be pooled on studies using resistance training only, no differences were found compared to no training or a sham intervention for any outcomes. The SMDs for these outcomes were all small, ranging from −0.36 to 0.36.
This review sought to obtain information on a large number of outcomes relevant to upper limb training. The primary outcomes of symptoms of dyspnoea and health‐related quality of life are particularly relevant outcomes for people with COPD. Historically, the studies of upper limb training have focused more on the exercise capacity outcomes so it is of interest to note the growing number of recent studies contributing to the data set of dyspnoea and health‐related quality of life. Another outcome of growing interest in COPD relates to activities of daily living and physical activity levels. There were limited upper limb training studies examining these outcomes (Ries 1988; Marrara 2008; Covey 2012; Larson 2014). Interestingly, this has been a topic of debate in recent times where research has indicated that people with COPD do not reduce their time spent performing arm activities compared to healthy controls but do reduce the intensity at which the arm activities are performed (Meijer 2014), raising the question of whether upper limb training should be included in rehabilitation programmes (Clini 2014); and whether training has the capacity to change arm activity. While this review is unable to provide data to directly determine whether upper limb training improves arm activities, it is possible that the improvements shown in dyspnoea and unsupported endurance upper limb capacity may lead to improvements in arm activities. In addition, it has been reported previously that it is the reduction in ventilation relative to a decrease in central motor output following unsupported upper limb training that relieves symptoms such as dyspnoea (Romagnoli 2013), suggesting that unsupported upper limb training provides the best mode of training to alleviate dyspnoea and enable improvements in arm activities. However, this current review indicated similar mean differences in dyspnoea whether endurance upper limb training was performed (MD 0.41 points) or resistance upper limb training (MD 0.35 points) was performed.
Quality of the evidence
The overall quality of the studies included in this review was low. For each component of risk of bias (except 'other bias'), over 50% of studies either had missing information, so the level of bias was unclear; or there was a high risk of bias identified. Furthermore, due to the physical nature of the interventions, studies were unable to blind participants or personnel to the delivery of the interventions. One study that used a sham intervention did state that participants were unaware of group allocation, although how this was determined was unclear (Janaudis‐Ferreira 2011). The GRADE system was used to rate the quality of the evidence for the majority of outcomes. The primary outcomes of dyspnoea and health‐related quality of life as well as peak exercise capacity (unsupported) were downgraded to a moderate level of evidence as the studies were affected by imprecision, with studies containing low participant numbers (ranging from 112 to 150 participants). The remaining outcomes were all downgraded twice to low level of evidence as the studies contained both imprecision with low participant numbers (57 to 107 participants pooled) and risk of bias issues mainly related to missing information on sequence generation and allocation concealment, no blinding of outcome assessment and incomplete data.
Potential biases in the review process
Two review authors independently completed data extraction and risk of bias assessment, and resolved discrepancies by discussion. Hand searching, reviews of trial registries and inclusion of studies in abstract form were conducted to minimise reporting bias. We contacted study authors for missing information but in many cases additional information was not available, potentially influencing the calculated treatment effects and trial quality.
Agreements and disagreements with other studies or reviews
The review authors are aware of three reviews specifically focused on upper limb training in people with COPD (Costi 2009; Ennis 2009; Janaudis‐Ferreira 2009), only one of which conducted meta‐analyses (Ennis 2009). These reviews contained a smaller number of RCTs: four studies (Costi 2009); five studies (Janaudis‐Ferreira 2009); and six studies (Ennis 2009). The recommendations from these studies varied from no recommendation (Costi 2009), recommending the use of upper limb training to improve supported and unsupported upper limb exercise capacity (Janaudis‐Ferreira 2009), to recommending unsupported endurance upper limb training to improve upper limb endurance exercise capacity (Ennis 2009). The conclusions on upper limb training in COPD in the most recent American Thoracic Society/European Respiratory Society statement on pulmonary rehabilitation are that upper limb training improves upper limb function but that it is unclear whether this translates to improvements in health‐related quality of life (Spruit 2013). This current review now indicates from four studies on 126 participants with COPD that when upper limb training is compared to no upper limb training (with or without lower limb training), there is no effect on health‐related quality of life.


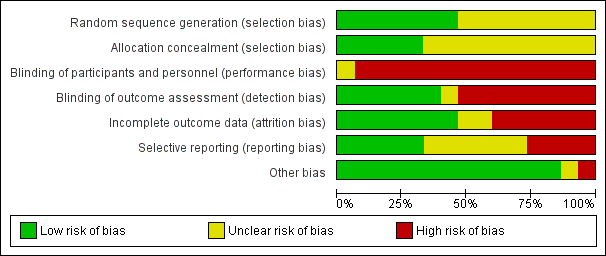
Risk of bias graph: review authors' judgements about each risk of bias item presented as percentages across all included studies.

Forest plot of comparison: 1 Upper limb training only versus control, outcome: 1.1 Symptoms of Dyspnoea.

Forest plot of comparison: 1 Upper limb training only versus control, outcome: 1.2 Health‐Related Quality of Life.

Forest plot of comparison: 1 Upper limb training versus No upper limb training, outcome: 1.6 Endurance Upper Limb Exercise Capacity: Unsupported.
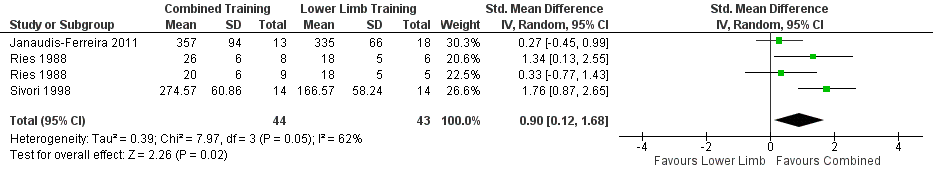
Forest plot of comparison: 2 Combined upper limb training and lower limb training versus lower limb training alone, outcome: 2.6 Endurance Upper Limb Exercise Capacity: Unsupported.

Comparison 1 Upper limb training versus No upper limb training, Outcome 1 Symptoms of Dyspnoea.
Comparison 1 Upper limb training versus No upper limb training, Outcome 2 Health‐Related Quality of Life.
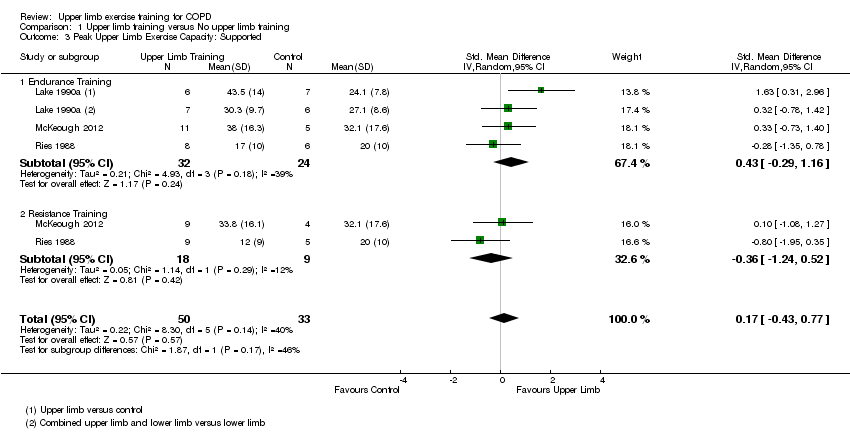
Comparison 1 Upper limb training versus No upper limb training, Outcome 3 Peak Upper Limb Exercise Capacity: Supported.

Comparison 1 Upper limb training versus No upper limb training, Outcome 4 Peak Upper Limb Exercise Capacity: Unsupported.

Comparison 1 Upper limb training versus No upper limb training, Outcome 5 Endurance Upper Limb Exercise Capacity: Supported.

Comparison 1 Upper limb training versus No upper limb training, Outcome 6 Endurance Upper Limb Exercise Capacity: Unsupported.

Comparison 1 Upper limb training versus No upper limb training, Outcome 7 Upper Limb Strength.

Comparison 1 Upper limb training versus No upper limb training, Outcome 8 Respiratory Muscle Strength.

Comparison 1 Upper limb training versus No upper limb training, Outcome 9 Physical Activity Level: Subjective.

Comparison 1 Upper limb training versus No upper limb training, Outcome 10 Physical Activity Level: Objective.

Comparison 1 Upper limb training versus No upper limb training, Outcome 11 Activities of Daily Living.

Comparison 1 Upper limb training versus No upper limb training, Outcome 12 Healthcare Utilisation.
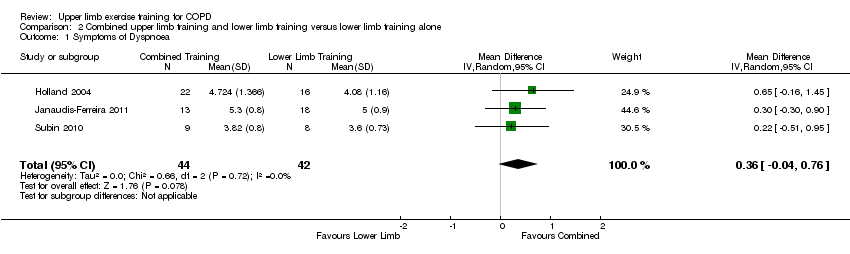
Comparison 2 Combined upper limb training and lower limb training versus lower limb training alone, Outcome 1 Symptoms of Dyspnoea.

Comparison 2 Combined upper limb training and lower limb training versus lower limb training alone, Outcome 2 Health‐Related Quality of Life.

Comparison 2 Combined upper limb training and lower limb training versus lower limb training alone, Outcome 3 Peak Upper Limb Exercise Capacity: Supported.
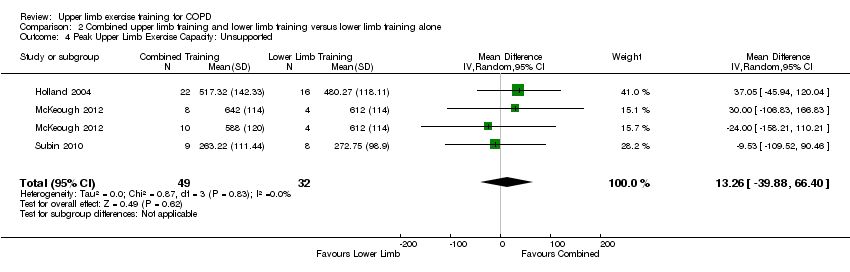
Comparison 2 Combined upper limb training and lower limb training versus lower limb training alone, Outcome 4 Peak Upper Limb Exercise Capacity: Unsupported.
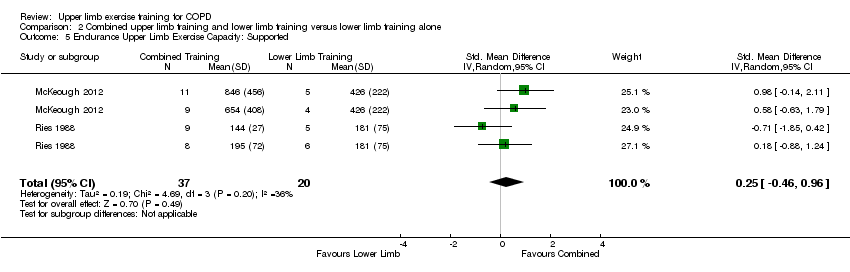
Comparison 2 Combined upper limb training and lower limb training versus lower limb training alone, Outcome 5 Endurance Upper Limb Exercise Capacity: Supported.
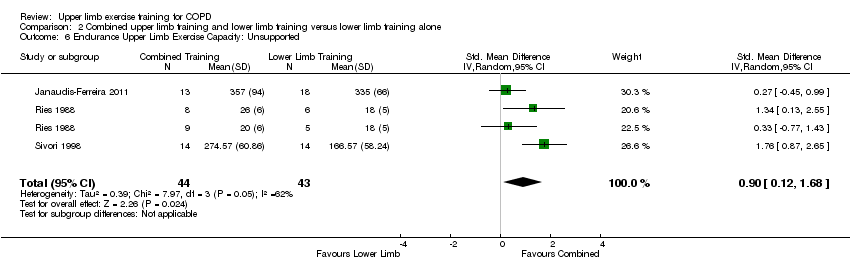
Comparison 2 Combined upper limb training and lower limb training versus lower limb training alone, Outcome 6 Endurance Upper Limb Exercise Capacity: Unsupported.

Comparison 2 Combined upper limb training and lower limb training versus lower limb training alone, Outcome 7 Upper Limb Strength.

Comparison 2 Combined upper limb training and lower limb training versus lower limb training alone, Outcome 8 Respiratory Muscle Strength.
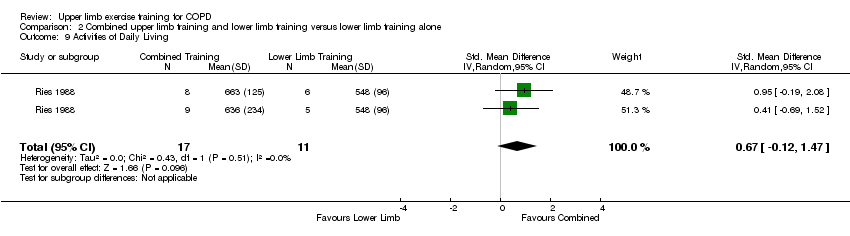
Comparison 2 Combined upper limb training and lower limb training versus lower limb training alone, Outcome 9 Activities of Daily Living.

Comparison 3 Upper limb training versus another type of upper limb training intervention, Outcome 1 Health‐Related Quality of Life.
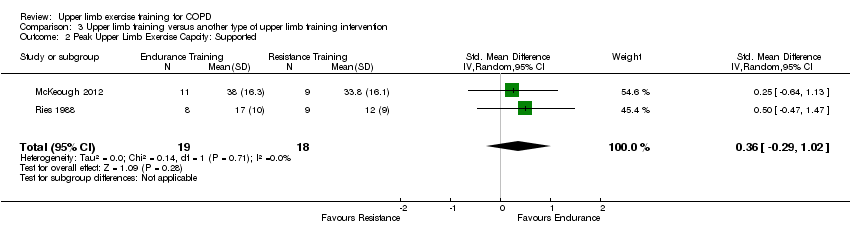
Comparison 3 Upper limb training versus another type of upper limb training intervention, Outcome 2 Peak Upper Limb Exercise Capcity: Supported.

Comparison 3 Upper limb training versus another type of upper limb training intervention, Outcome 3 Peak Upper Limb Exercise Capacity: Unsupported.
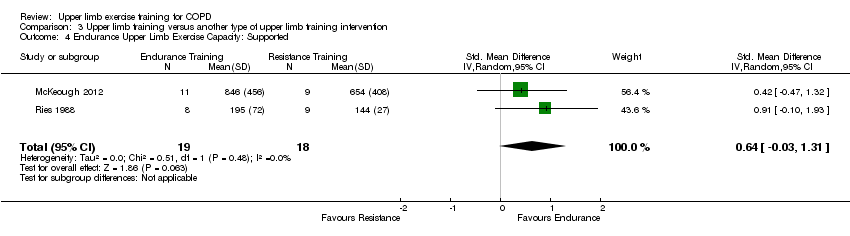
Comparison 3 Upper limb training versus another type of upper limb training intervention, Outcome 4 Endurance Upper Limb Exercise Capacity: Supported.
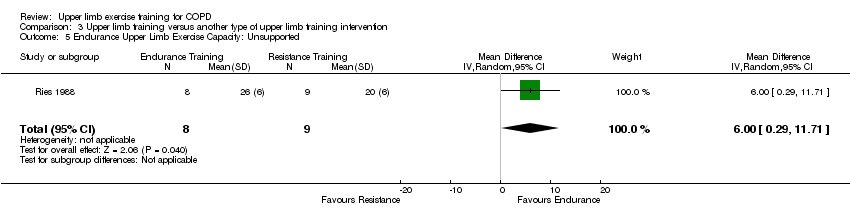
Comparison 3 Upper limb training versus another type of upper limb training intervention, Outcome 5 Endurance Upper Limb Exercise Capacity: Unsupported.
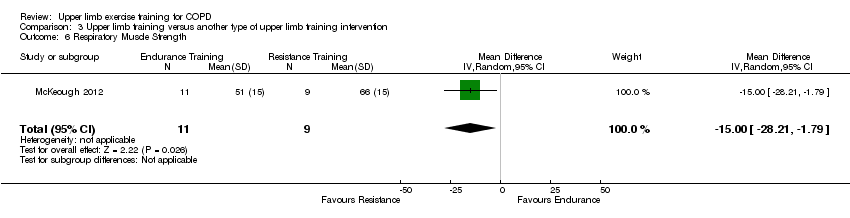
Comparison 3 Upper limb training versus another type of upper limb training intervention, Outcome 6 Respiratory Muscle Strength.

Comparison 3 Upper limb training versus another type of upper limb training intervention, Outcome 7 Activities of Daily Living.
| Comparison 1: Upper limb training vs No upper limb training for people with COPD | ||||||
| Patient or population: Stable COPD | ||||||
| Outcomes | Anticipated absolute effects* (95% CI) | Relative effect | Number of participants | Quality of the evidence | Comments | |
| Risk with No upper limb training | Risk with Upper limb training | |||||
| Symptoms of dyspnoea | The mean symptoms of dyspnoea was 4.2 points. | The mean symptoms of dyspnoea in the intervention group was 0.37 points higher (0.02 to 0.72 points). | 129 | ⊕⊕⊕o | Higher value post‐intervention is favourable indicating improvement in dyspnoea. The MID for dyspnoea component of the chronic respiratory disease questionnaire is 0.5. | |
| Health‐Related Quality of Life assessed with: Chronic Respiratory Disease Questionnaire Total Score. Follow up: end of rehabilitation (range 6 weeks to 8 weeks) | The mean health‐related quality of life was 5.3 points. | The mean health‐related quality of life in the intervention group was 0.05 points higher (0.3 points lower to 0.36 points higher). | 126 | ⊕⊕⊕o | Higher value post‐intervention is favourable indicating improvement in quality of life. Control group risk determined from studies using the chronic respiratory disease questionnaire. Intervention group risk determined by back transforming the SMD to the CRQ scale. MID of the chronic respiratory disease questionnaire is 0.5. | |
| Peak Upper Limb Exercise Capacity (Supported) assessed with an incremental arm crank test. Follow up: end of rehabilitation (8 weeks) | The mean peak upper limb exercise capacity was 26 watts | The mean peak upper limb exercise capacity in the intervention group was 2.1 watts higher (8 watts lower to 12 watts higher) | 70 | ⊕⊕oo lowa,b | Control group risk determined from studies using peak power output in watts. Intervention group risk determined by back transforming the SMD to watts. | |
| Peak Upper Limb Exercise Capacity (Unsupported) assessed with the incremental unsupported arm test. Follow up: end of rehabilitation (range 4 weeks to 8 weeks) | The mean peak upper limb exercise capacity was 483 seconds. | The mean peak upper limb exercise capacity in the intervention group was 21 seconds higher (20.5 seconds lower to 63 seconds higher). | 112 | ⊕⊕⊕o | ||
| Endurance Upper Limb Exercise Capacity (Supported) assessed with an arm crank test. Follow up: end of rehabilitation (8 weeks) | The mean endurance upper limb exercise capacity was 426 seconds. | The mean endurance upper limb exercise capacity in the intervention group was 56 seconds higher (102 seconds lower to 213 seconds higher). | 57 | ⊕⊕oo lowa,c | Control group risk determined from an arm crank test at 80% peak work and represents time of the test in seconds. Intervention group risk determined by back transforming the SMD to time in seconds. | |
| Endurance Upper Limb Exercise Capacity (Unsupported) assessed by total number of rings moved in 6 minutes. Follow up: end of rehabilitation (range 6 weeks to 8 weeks) | The mean upper limb exercise capacity was 225 rings moved in 6 minutes. | The mean upper limb exercise capacity in the intervention group was 42 more rings moved (12 rings more to 71 rings more moved). | 142 | ⊕⊕oo lowa,d | Control group risk determined from a test that counts the number of rings moved in 6 minutes. Intervention group risk determined by back transforming the SMD to the number of rings moved. | |
| Upper Limb Strength assessed with dynamometry during shoulder flexion in kg. Follow up: end of rehabilitation (range 4 weeks to 16 weeks) | The mean upper limb strength was 21.4 kg | The mean upper limb strength in the intervention group was 1.4 kg higher (2 kg lighter to 5 kg higher) | 43 | ⊕⊕oo lowa,e | Control group risk determined from an arm dynamometry test of shoulder flexion in kg. Intervention group risk determined by back transforming the SMD to kg. | |
| *The risk in the intervention group (and its 95% confidence interval) is based on the assumed risk in the comparison group and the relative effect of the intervention (and its 95% CI). | ||||||
| GRADE Working Group grades of evidence | ||||||
| a Meta‐anlysis was limited to few studies with small sample sizes and wide confidence intervals (imprecision −1) b Meta‐analysis limited by missing information on sequence generation and allocation concealment (2 studies), no blinding of outcome assessment (2 studies), incomplete data (2 studies) (risk of bias −1) c Meta‐analysis limited by missing information on sequence generation and allocation concealment (1 study), no blinding of outcome assessment (1 study), incomplete data (2 studies) (risk of bias −1) d Meta‐analysis limited by missing information on sequence generation and allocation concealment (4 studies), no blinding of outcome assessment (4 studies), incomplete data (2 studies) (risk of bias −1) e Meta‐analysis limited by missing information on sequence generation and allocation concealment (1 study), and no blinding of outcome assessment (1 study) (risk of bias −1) | ||||||
| Outcome or subgroup title | No. of studies | No. of participants | Statistical method | Effect size |
| 1 Symptoms of Dyspnoea Show forest plot | 4 | 129 | Mean Difference (IV, Random, 95% CI) | 0.37 [0.02, 0.72] |
| 1.1 Endurance Training | 2 | 55 | Mean Difference (IV, Random, 95% CI) | 0.41 [‐0.13, 0.95] |
| 1.2 Resistance Training | 2 | 74 | Mean Difference (IV, Random, 95% CI) | 0.34 [‐0.11, 0.80] |
| 2 Health‐Related Quality of Life Show forest plot | 4 | 126 | Std. Mean Difference (IV, Random, 95% CI) | 0.05 [‐0.31, 0.40] |
| 2.1 Endurance Training | 3 | 82 | Std. Mean Difference (IV, Random, 95% CI) | ‐0.03 [‐0.47, 0.42] |
| 2.2 Resistance Training | 2 | 44 | Std. Mean Difference (IV, Random, 95% CI) | 0.18 [‐0.43, 0.79] |
| 3 Peak Upper Limb Exercise Capacity: Supported Show forest plot | 3 | 83 | Std. Mean Difference (IV, Random, 95% CI) | 0.17 [‐0.43, 0.77] |
| 3.1 Endurance Training | 3 | 56 | Std. Mean Difference (IV, Random, 95% CI) | 0.43 [‐0.29, 1.16] |
| 3.2 Resistance Training | 2 | 27 | Std. Mean Difference (IV, Random, 95% CI) | ‐0.36 [‐1.24, 0.52] |
| 4 Peak Upper Limb Exercise Capacity: Unsupported Show forest plot | 4 | 112 | Mean Difference (IV, Random, 95% CI) | 21.23 [‐20.45, 62.92] |
| 4.1 Endurance Training | 3 | 69 | Mean Difference (IV, Random, 95% CI) | 10.29 [‐47.37, 67.95] |
| 4.2 Resistance Training | 2 | 43 | Mean Difference (IV, Random, 95% CI) | 33.22 [‐27.12, 93.57] |
| 5 Endurance Upper Limb Exercise Capacity: Supported Show forest plot | 2 | 57 | Std. Mean Difference (IV, Random, 95% CI) | 0.25 [‐0.46, 0.96] |
| 5.1 Endurance Training | 2 | 30 | Std. Mean Difference (IV, Random, 95% CI) | 0.56 [‐0.23, 1.35] |
| 5.2 Resistance Training | 2 | 27 | Std. Mean Difference (IV, Random, 95% CI) | ‐0.08 [‐1.35, 1.18] |
| 6 Endurance Upper Limb Exercise Capacity: Unsupported Show forest plot | 6 | 142 | Std. Mean Difference (IV, Random, 95% CI) | 0.66 [0.19, 1.13] |
| 6.1 Endurance Training | 4 | 85 | Std. Mean Difference (IV, Random, 95% CI) | 0.99 [0.32, 1.66] |
| 6.2 Resistance Training | 3 | 57 | Std. Mean Difference (IV, Random, 95% CI) | 0.23 [‐0.31, 0.76] |
| 7 Upper Limb Strength Show forest plot | 2 | 43 | Std. Mean Difference (IV, Random, 95% CI) | 0.25 [‐0.39, 0.89] |
| 7.1 Resistance Training | 2 | 43 | Std. Mean Difference (IV, Random, 95% CI) | 0.25 [‐0.39, 0.89] |
| 8 Respiratory Muscle Strength Show forest plot | 5 | 148 | Mean Difference (IV, Random, 95% CI) | ‐1.70 [‐8.35, 4.94] |
| 8.1 Endurance Training | 4 | 92 | Mean Difference (IV, Random, 95% CI) | ‐3.41 [‐11.02, 4.20] |
| 8.2 Resistance Training | 2 | 56 | Mean Difference (IV, Random, 95% CI) | 3.80 [‐9.87, 17.46] |
| 9 Physical Activity Level: Subjective Show forest plot | 1 | 43 | Mean Difference (IV, Random, 95% CI) | 0.0 [‐0.30, 0.30] |
| 10 Physical Activity Level: Objective Show forest plot | 1 | 34 | Mean Difference (IV, Random, 95% CI) | 1.0 [‐0.68, 2.68] |
| 11 Activities of Daily Living Show forest plot | 1 | 28 | Std. Mean Difference (IV, Random, 95% CI) | 0.67 [‐0.12, 1.47] |
| 11.1 Endurance Training | 1 | 14 | Std. Mean Difference (IV, Random, 95% CI) | 0.95 [‐0.19, 2.08] |
| 11.2 Resistance Training | 1 | 14 | Std. Mean Difference (IV, Random, 95% CI) | 0.41 [‐0.69, 1.52] |
| 12 Healthcare Utilisation Show forest plot | 1 | 28 | Mean Difference (IV, Random, 95% CI) | ‐0.86 [‐3.07, 1.35] |
| Outcome or subgroup title | No. of studies | No. of participants | Statistical method | Effect size |
| 1 Symptoms of Dyspnoea Show forest plot | 3 | 86 | Mean Difference (IV, Random, 95% CI) | 0.36 [‐0.04, 0.76] |
| 2 Health‐Related Quality of Life Show forest plot | 3 | 95 | Std. Mean Difference (IV, Random, 95% CI) | 0.01 [‐0.40, 0.43] |
| 3 Peak Upper Limb Exercise Capacity: Supported Show forest plot | 3 | 70 | Std. Mean Difference (IV, Random, 95% CI) | ‐0.06 [‐0.55, 0.44] |
| 4 Peak Upper Limb Exercise Capacity: Unsupported Show forest plot | 3 | 81 | Mean Difference (IV, Random, 95% CI) | 13.26 [‐39.88, 66.40] |
| 5 Endurance Upper Limb Exercise Capacity: Supported Show forest plot | 2 | 57 | Std. Mean Difference (IV, Random, 95% CI) | 0.25 [‐0.46, 0.96] |
| 6 Endurance Upper Limb Exercise Capacity: Unsupported Show forest plot | 3 | 87 | Std. Mean Difference (IV, Random, 95% CI) | 0.90 [0.12, 1.68] |
| 7 Upper Limb Strength Show forest plot | 1 | 31 | Std. Mean Difference (IV, Random, 95% CI) | 0.01 [‐0.70, 0.73] |
| 8 Respiratory Muscle Strength Show forest plot | 3 | 70 | Mean Difference (IV, Random, 95% CI) | ‐0.46 [‐8.99, 8.07] |
| 9 Activities of Daily Living Show forest plot | 1 | 28 | Std. Mean Difference (IV, Random, 95% CI) | 0.67 [‐0.12, 1.47] |
| Outcome or subgroup title | No. of studies | No. of participants | Statistical method | Effect size |
| 1 Health‐Related Quality of Life Show forest plot | 1 | 20 | Mean Difference (IV, Random, 95% CI) | ‐5.00 [‐20.85, 6.85] |
| 2 Peak Upper Limb Exercise Capcity: Supported Show forest plot | 2 | 37 | Std. Mean Difference (IV, Random, 95% CI) | 0.36 [‐0.29, 1.02] |
| 3 Peak Upper Limb Exercise Capacity: Unsupported Show forest plot | 1 | 18 | Mean Difference (IV, Random, 95% CI) | ‐54.0 [‐162.50, 54.50] |
| 4 Endurance Upper Limb Exercise Capacity: Supported Show forest plot | 2 | 37 | Std. Mean Difference (IV, Random, 95% CI) | 0.64 [‐0.03, 1.31] |
| 5 Endurance Upper Limb Exercise Capacity: Unsupported Show forest plot | 1 | 17 | Mean Difference (IV, Random, 95% CI) | 6.00 [0.29, 11.71] |
| 6 Respiratory Muscle Strength Show forest plot | 1 | 20 | Mean Difference (IV, Random, 95% CI) | ‐15.0 [‐28.21, ‐1.79] |
| 7 Activities of Daily Living Show forest plot | 1 | 17 | Mean Difference (IV, Random, 95% CI) | 27.0 [‐148.71, 202.71] |