Entrenamiento con ejercicios de miembros superiores para la EPOC
Appendices
Appendix 1. Sources and search methods for the Cochrane Airways Group Specialised Register (CAGR)
Electronic searches: core databases
| Database | Frequency of search |
| CENTRAL (The Cochrane Library) | Monthly |
| MEDLINE (Ovid) | Weekly |
| Embase (Ovid) | Weekly |
| PsycINFO (Ovid) | Monthly |
| CINAHL (EBSCO) | Monthly |
| AMED (EBSCO) | Monthly |
Handsearches: core respiratory conference abstracts
| Conference | Years searched |
| American Academy of Allergy, Asthma and Immunology (AAAAI) | 2001 onwards |
| American Thoracic Society (ATS) | 2001 onwards |
| Asia Pacific Society of Respirology (APSR) | 2004 onwards |
| British Thoracic Society Winter Meeting (BTS) | 2000 onwards |
| Chest Meeting | 2003 onwards |
| European Respiratory Society (ERS) | 1992, 1994, 2000 onwards |
| International Primary Care Respiratory Group Congress (IPCRG) | 2002 onwards |
| Thoracic Society of Australia and New Zealand (TSANZ) | 1999 onwards |
MEDLINE search strategy used to identify trials for the CAGR
COPD search
1. Lung Diseases, Obstructive/
2. exp Pulmonary Disease, Chronic Obstructive/
3. emphysema$.mp.
4. (chronic$ adj3 bronchiti$).mp.
5. (obstruct$ adj3 (pulmonary or lung$ or airway$ or airflow$ or bronch$ or respirat$)).mp.
6. COPD.mp.
7. COAD.mp.
8. COBD.mp.
9. AECB.mp.
10. or/1‐9
Filter to identify RCTs
1. exp "clinical trial [publication type]"/
2. (randomised or randomised).ab,ti.
3. placebo.ab,ti.
4. dt.fs.
5. randomly.ab,ti.
6. trial.ab,ti.
7. groups.ab,ti.
8. or/1‐7
9. Animals/
10. Humans/
11. 9 not (9 and 10)
12. 8 not 11
The MEDLINE strategy and RCT filter are adapted to identify trials in other electronic databases.
Appendix 2. Search strategy to identify relevant trials from the CAGR
#1 MeSH DESCRIPTOR Pulmonary Disease, Chronic Obstructive Explode All
#2 MeSH DESCRIPTOR Bronchitis, Chronic
#3 (obstruct*) near3 (pulmonary or lung* or airway* or airflow* or bronch* or respirat*)
#4 COPD:MISC1
#5 (COPD OR COAD OR COBD):TI,AB,KW
#6 #1 OR #2 OR #3 OR #4 OR #5
#7 MeSH DESCRIPTOR Upper Extremity Explode All
#8 arm*:ti,ab,kw
#9 upper NEXT (limb* or upper‐limb*)
#10 upper NEXT (extremit* or upper‐extremit*)
#11 #7 or #8 or #9 or #10
#12 #6 and #11
#13 MeSH DESCRIPTOR Physical Therapy Modalities Explode All
#14 MeSH DESCRIPTOR Rehabilitation Explode All
#15 rehabilitat* or fitness* or exercis* or physical* or train* or physiotherap*
#16 #13 or #14 or #15
#17 #12 and #16
[NOTE: in search line #4, MISC1 denotes the field in which the reference is coded for condition, in this case, COPD]


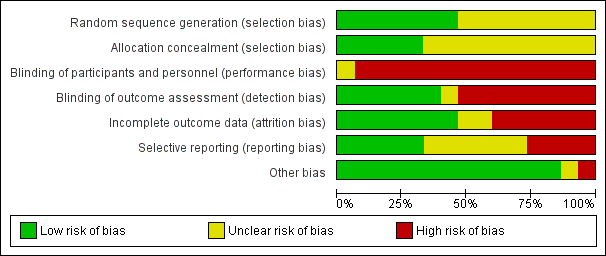
Risk of bias graph: review authors' judgements about each risk of bias item presented as percentages across all included studies.

Forest plot of comparison: 1 Upper limb training only versus control, outcome: 1.1 Symptoms of Dyspnoea.

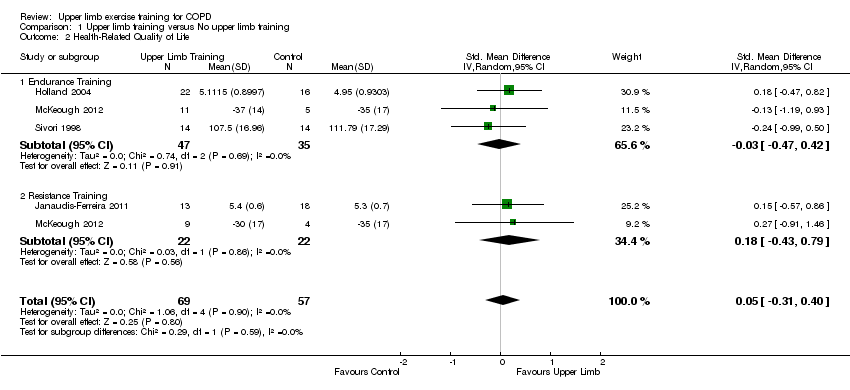
Forest plot of comparison: 1 Upper limb training only versus control, outcome: 1.2 Health‐Related Quality of Life.

Forest plot of comparison: 1 Upper limb training versus No upper limb training, outcome: 1.6 Endurance Upper Limb Exercise Capacity: Unsupported.
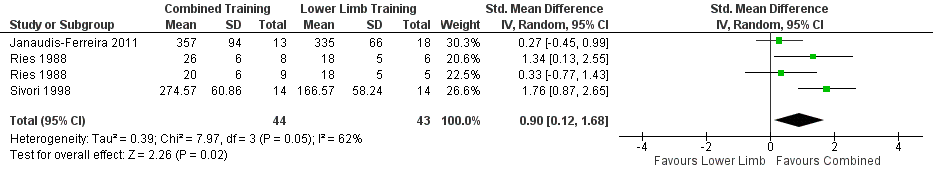
Forest plot of comparison: 2 Combined upper limb training and lower limb training versus lower limb training alone, outcome: 2.6 Endurance Upper Limb Exercise Capacity: Unsupported.

Comparison 1 Upper limb training versus No upper limb training, Outcome 1 Symptoms of Dyspnoea.
Comparison 1 Upper limb training versus No upper limb training, Outcome 2 Health‐Related Quality of Life.
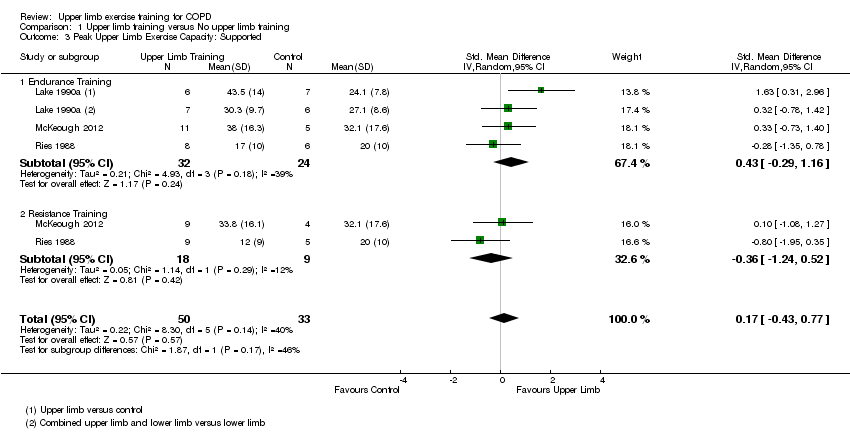
Comparison 1 Upper limb training versus No upper limb training, Outcome 3 Peak Upper Limb Exercise Capacity: Supported.

Comparison 1 Upper limb training versus No upper limb training, Outcome 4 Peak Upper Limb Exercise Capacity: Unsupported.

Comparison 1 Upper limb training versus No upper limb training, Outcome 5 Endurance Upper Limb Exercise Capacity: Supported.

Comparison 1 Upper limb training versus No upper limb training, Outcome 6 Endurance Upper Limb Exercise Capacity: Unsupported.

Comparison 1 Upper limb training versus No upper limb training, Outcome 7 Upper Limb Strength.

Comparison 1 Upper limb training versus No upper limb training, Outcome 8 Respiratory Muscle Strength.

Comparison 1 Upper limb training versus No upper limb training, Outcome 9 Physical Activity Level: Subjective.

Comparison 1 Upper limb training versus No upper limb training, Outcome 10 Physical Activity Level: Objective.

Comparison 1 Upper limb training versus No upper limb training, Outcome 11 Activities of Daily Living.

Comparison 1 Upper limb training versus No upper limb training, Outcome 12 Healthcare Utilisation.
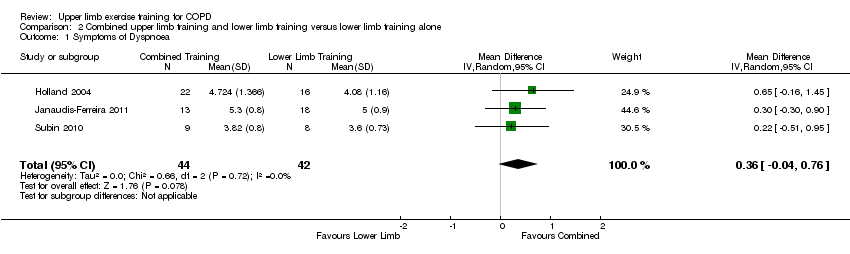
Comparison 2 Combined upper limb training and lower limb training versus lower limb training alone, Outcome 1 Symptoms of Dyspnoea.

Comparison 2 Combined upper limb training and lower limb training versus lower limb training alone, Outcome 2 Health‐Related Quality of Life.

Comparison 2 Combined upper limb training and lower limb training versus lower limb training alone, Outcome 3 Peak Upper Limb Exercise Capacity: Supported.
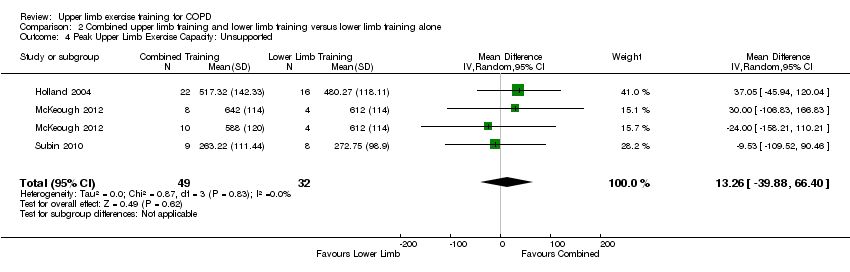
Comparison 2 Combined upper limb training and lower limb training versus lower limb training alone, Outcome 4 Peak Upper Limb Exercise Capacity: Unsupported.
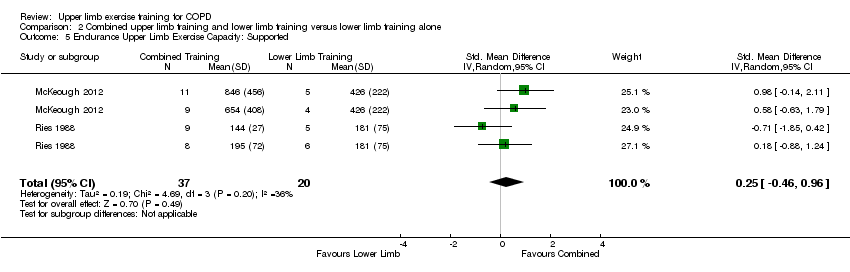
Comparison 2 Combined upper limb training and lower limb training versus lower limb training alone, Outcome 5 Endurance Upper Limb Exercise Capacity: Supported.
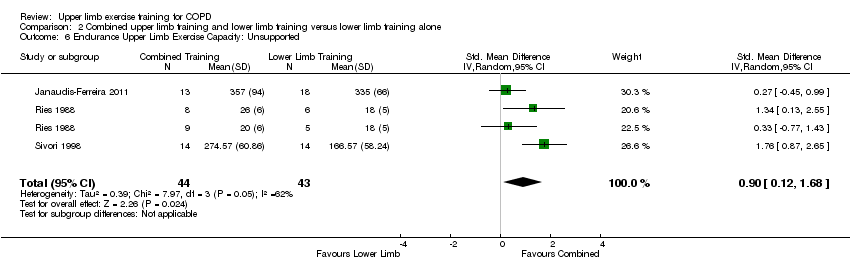
Comparison 2 Combined upper limb training and lower limb training versus lower limb training alone, Outcome 6 Endurance Upper Limb Exercise Capacity: Unsupported.

Comparison 2 Combined upper limb training and lower limb training versus lower limb training alone, Outcome 7 Upper Limb Strength.

Comparison 2 Combined upper limb training and lower limb training versus lower limb training alone, Outcome 8 Respiratory Muscle Strength.
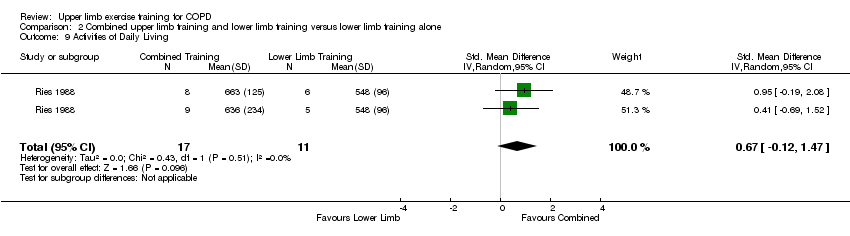
Comparison 2 Combined upper limb training and lower limb training versus lower limb training alone, Outcome 9 Activities of Daily Living.

Comparison 3 Upper limb training versus another type of upper limb training intervention, Outcome 1 Health‐Related Quality of Life.
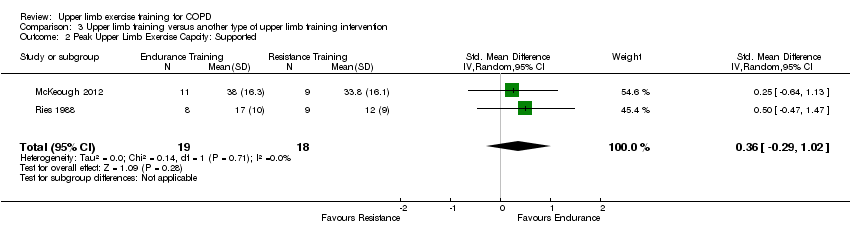
Comparison 3 Upper limb training versus another type of upper limb training intervention, Outcome 2 Peak Upper Limb Exercise Capcity: Supported.

Comparison 3 Upper limb training versus another type of upper limb training intervention, Outcome 3 Peak Upper Limb Exercise Capacity: Unsupported.
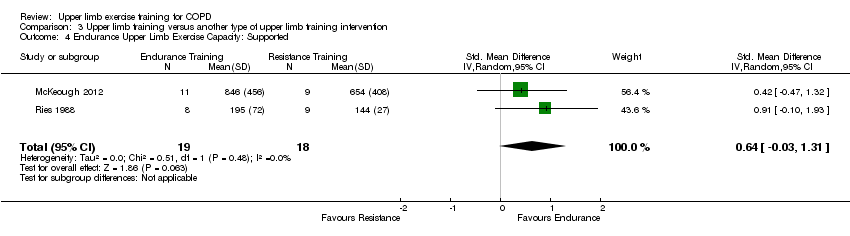
Comparison 3 Upper limb training versus another type of upper limb training intervention, Outcome 4 Endurance Upper Limb Exercise Capacity: Supported.
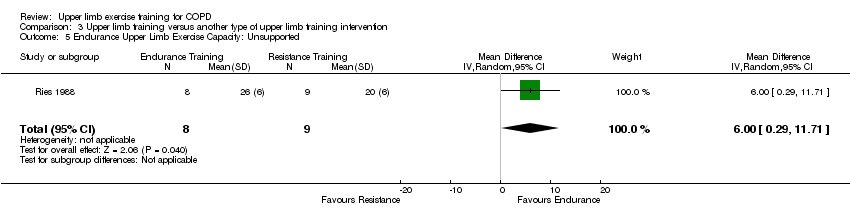
Comparison 3 Upper limb training versus another type of upper limb training intervention, Outcome 5 Endurance Upper Limb Exercise Capacity: Unsupported.
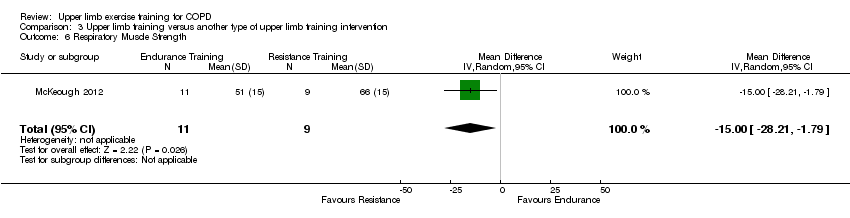
Comparison 3 Upper limb training versus another type of upper limb training intervention, Outcome 6 Respiratory Muscle Strength.

Comparison 3 Upper limb training versus another type of upper limb training intervention, Outcome 7 Activities of Daily Living.
| Comparison 1: Upper limb training vs No upper limb training for people with COPD | ||||||
| Patient or population: Stable COPD | ||||||
| Outcomes | Anticipated absolute effects* (95% CI) | Relative effect | Number of participants | Quality of the evidence | Comments | |
| Risk with No upper limb training | Risk with Upper limb training | |||||
| Symptoms of dyspnoea | The mean symptoms of dyspnoea was 4.2 points. | The mean symptoms of dyspnoea in the intervention group was 0.37 points higher (0.02 to 0.72 points). | 129 | ⊕⊕⊕o | Higher value post‐intervention is favourable indicating improvement in dyspnoea. The MID for dyspnoea component of the chronic respiratory disease questionnaire is 0.5. | |
| Health‐Related Quality of Life assessed with: Chronic Respiratory Disease Questionnaire Total Score. Follow up: end of rehabilitation (range 6 weeks to 8 weeks) | The mean health‐related quality of life was 5.3 points. | The mean health‐related quality of life in the intervention group was 0.05 points higher (0.3 points lower to 0.36 points higher). | 126 | ⊕⊕⊕o | Higher value post‐intervention is favourable indicating improvement in quality of life. Control group risk determined from studies using the chronic respiratory disease questionnaire. Intervention group risk determined by back transforming the SMD to the CRQ scale. MID of the chronic respiratory disease questionnaire is 0.5. | |
| Peak Upper Limb Exercise Capacity (Supported) assessed with an incremental arm crank test. Follow up: end of rehabilitation (8 weeks) | The mean peak upper limb exercise capacity was 26 watts | The mean peak upper limb exercise capacity in the intervention group was 2.1 watts higher (8 watts lower to 12 watts higher) | 70 | ⊕⊕oo lowa,b | Control group risk determined from studies using peak power output in watts. Intervention group risk determined by back transforming the SMD to watts. | |
| Peak Upper Limb Exercise Capacity (Unsupported) assessed with the incremental unsupported arm test. Follow up: end of rehabilitation (range 4 weeks to 8 weeks) | The mean peak upper limb exercise capacity was 483 seconds. | The mean peak upper limb exercise capacity in the intervention group was 21 seconds higher (20.5 seconds lower to 63 seconds higher). | 112 | ⊕⊕⊕o | ||
| Endurance Upper Limb Exercise Capacity (Supported) assessed with an arm crank test. Follow up: end of rehabilitation (8 weeks) | The mean endurance upper limb exercise capacity was 426 seconds. | The mean endurance upper limb exercise capacity in the intervention group was 56 seconds higher (102 seconds lower to 213 seconds higher). | 57 | ⊕⊕oo lowa,c | Control group risk determined from an arm crank test at 80% peak work and represents time of the test in seconds. Intervention group risk determined by back transforming the SMD to time in seconds. | |
| Endurance Upper Limb Exercise Capacity (Unsupported) assessed by total number of rings moved in 6 minutes. Follow up: end of rehabilitation (range 6 weeks to 8 weeks) | The mean upper limb exercise capacity was 225 rings moved in 6 minutes. | The mean upper limb exercise capacity in the intervention group was 42 more rings moved (12 rings more to 71 rings more moved). | 142 | ⊕⊕oo lowa,d | Control group risk determined from a test that counts the number of rings moved in 6 minutes. Intervention group risk determined by back transforming the SMD to the number of rings moved. | |
| Upper Limb Strength assessed with dynamometry during shoulder flexion in kg. Follow up: end of rehabilitation (range 4 weeks to 16 weeks) | The mean upper limb strength was 21.4 kg | The mean upper limb strength in the intervention group was 1.4 kg higher (2 kg lighter to 5 kg higher) | 43 | ⊕⊕oo lowa,e | Control group risk determined from an arm dynamometry test of shoulder flexion in kg. Intervention group risk determined by back transforming the SMD to kg. | |
| *The risk in the intervention group (and its 95% confidence interval) is based on the assumed risk in the comparison group and the relative effect of the intervention (and its 95% CI). | ||||||
| GRADE Working Group grades of evidence | ||||||
| a Meta‐anlysis was limited to few studies with small sample sizes and wide confidence intervals (imprecision −1) b Meta‐analysis limited by missing information on sequence generation and allocation concealment (2 studies), no blinding of outcome assessment (2 studies), incomplete data (2 studies) (risk of bias −1) c Meta‐analysis limited by missing information on sequence generation and allocation concealment (1 study), no blinding of outcome assessment (1 study), incomplete data (2 studies) (risk of bias −1) d Meta‐analysis limited by missing information on sequence generation and allocation concealment (4 studies), no blinding of outcome assessment (4 studies), incomplete data (2 studies) (risk of bias −1) e Meta‐analysis limited by missing information on sequence generation and allocation concealment (1 study), and no blinding of outcome assessment (1 study) (risk of bias −1) | ||||||
| Outcome or subgroup title | No. of studies | No. of participants | Statistical method | Effect size |
| 1 Symptoms of Dyspnoea Show forest plot | 4 | 129 | Mean Difference (IV, Random, 95% CI) | 0.37 [0.02, 0.72] |
| 1.1 Endurance Training | 2 | 55 | Mean Difference (IV, Random, 95% CI) | 0.41 [‐0.13, 0.95] |
| 1.2 Resistance Training | 2 | 74 | Mean Difference (IV, Random, 95% CI) | 0.34 [‐0.11, 0.80] |
| 2 Health‐Related Quality of Life Show forest plot | 4 | 126 | Std. Mean Difference (IV, Random, 95% CI) | 0.05 [‐0.31, 0.40] |
| 2.1 Endurance Training | 3 | 82 | Std. Mean Difference (IV, Random, 95% CI) | ‐0.03 [‐0.47, 0.42] |
| 2.2 Resistance Training | 2 | 44 | Std. Mean Difference (IV, Random, 95% CI) | 0.18 [‐0.43, 0.79] |
| 3 Peak Upper Limb Exercise Capacity: Supported Show forest plot | 3 | 83 | Std. Mean Difference (IV, Random, 95% CI) | 0.17 [‐0.43, 0.77] |
| 3.1 Endurance Training | 3 | 56 | Std. Mean Difference (IV, Random, 95% CI) | 0.43 [‐0.29, 1.16] |
| 3.2 Resistance Training | 2 | 27 | Std. Mean Difference (IV, Random, 95% CI) | ‐0.36 [‐1.24, 0.52] |
| 4 Peak Upper Limb Exercise Capacity: Unsupported Show forest plot | 4 | 112 | Mean Difference (IV, Random, 95% CI) | 21.23 [‐20.45, 62.92] |
| 4.1 Endurance Training | 3 | 69 | Mean Difference (IV, Random, 95% CI) | 10.29 [‐47.37, 67.95] |
| 4.2 Resistance Training | 2 | 43 | Mean Difference (IV, Random, 95% CI) | 33.22 [‐27.12, 93.57] |
| 5 Endurance Upper Limb Exercise Capacity: Supported Show forest plot | 2 | 57 | Std. Mean Difference (IV, Random, 95% CI) | 0.25 [‐0.46, 0.96] |
| 5.1 Endurance Training | 2 | 30 | Std. Mean Difference (IV, Random, 95% CI) | 0.56 [‐0.23, 1.35] |
| 5.2 Resistance Training | 2 | 27 | Std. Mean Difference (IV, Random, 95% CI) | ‐0.08 [‐1.35, 1.18] |
| 6 Endurance Upper Limb Exercise Capacity: Unsupported Show forest plot | 6 | 142 | Std. Mean Difference (IV, Random, 95% CI) | 0.66 [0.19, 1.13] |
| 6.1 Endurance Training | 4 | 85 | Std. Mean Difference (IV, Random, 95% CI) | 0.99 [0.32, 1.66] |
| 6.2 Resistance Training | 3 | 57 | Std. Mean Difference (IV, Random, 95% CI) | 0.23 [‐0.31, 0.76] |
| 7 Upper Limb Strength Show forest plot | 2 | 43 | Std. Mean Difference (IV, Random, 95% CI) | 0.25 [‐0.39, 0.89] |
| 7.1 Resistance Training | 2 | 43 | Std. Mean Difference (IV, Random, 95% CI) | 0.25 [‐0.39, 0.89] |
| 8 Respiratory Muscle Strength Show forest plot | 5 | 148 | Mean Difference (IV, Random, 95% CI) | ‐1.70 [‐8.35, 4.94] |
| 8.1 Endurance Training | 4 | 92 | Mean Difference (IV, Random, 95% CI) | ‐3.41 [‐11.02, 4.20] |
| 8.2 Resistance Training | 2 | 56 | Mean Difference (IV, Random, 95% CI) | 3.80 [‐9.87, 17.46] |
| 9 Physical Activity Level: Subjective Show forest plot | 1 | 43 | Mean Difference (IV, Random, 95% CI) | 0.0 [‐0.30, 0.30] |
| 10 Physical Activity Level: Objective Show forest plot | 1 | 34 | Mean Difference (IV, Random, 95% CI) | 1.0 [‐0.68, 2.68] |
| 11 Activities of Daily Living Show forest plot | 1 | 28 | Std. Mean Difference (IV, Random, 95% CI) | 0.67 [‐0.12, 1.47] |
| 11.1 Endurance Training | 1 | 14 | Std. Mean Difference (IV, Random, 95% CI) | 0.95 [‐0.19, 2.08] |
| 11.2 Resistance Training | 1 | 14 | Std. Mean Difference (IV, Random, 95% CI) | 0.41 [‐0.69, 1.52] |
| 12 Healthcare Utilisation Show forest plot | 1 | 28 | Mean Difference (IV, Random, 95% CI) | ‐0.86 [‐3.07, 1.35] |
| Outcome or subgroup title | No. of studies | No. of participants | Statistical method | Effect size |
| 1 Symptoms of Dyspnoea Show forest plot | 3 | 86 | Mean Difference (IV, Random, 95% CI) | 0.36 [‐0.04, 0.76] |
| 2 Health‐Related Quality of Life Show forest plot | 3 | 95 | Std. Mean Difference (IV, Random, 95% CI) | 0.01 [‐0.40, 0.43] |
| 3 Peak Upper Limb Exercise Capacity: Supported Show forest plot | 3 | 70 | Std. Mean Difference (IV, Random, 95% CI) | ‐0.06 [‐0.55, 0.44] |
| 4 Peak Upper Limb Exercise Capacity: Unsupported Show forest plot | 3 | 81 | Mean Difference (IV, Random, 95% CI) | 13.26 [‐39.88, 66.40] |
| 5 Endurance Upper Limb Exercise Capacity: Supported Show forest plot | 2 | 57 | Std. Mean Difference (IV, Random, 95% CI) | 0.25 [‐0.46, 0.96] |
| 6 Endurance Upper Limb Exercise Capacity: Unsupported Show forest plot | 3 | 87 | Std. Mean Difference (IV, Random, 95% CI) | 0.90 [0.12, 1.68] |
| 7 Upper Limb Strength Show forest plot | 1 | 31 | Std. Mean Difference (IV, Random, 95% CI) | 0.01 [‐0.70, 0.73] |
| 8 Respiratory Muscle Strength Show forest plot | 3 | 70 | Mean Difference (IV, Random, 95% CI) | ‐0.46 [‐8.99, 8.07] |
| 9 Activities of Daily Living Show forest plot | 1 | 28 | Std. Mean Difference (IV, Random, 95% CI) | 0.67 [‐0.12, 1.47] |
| Outcome or subgroup title | No. of studies | No. of participants | Statistical method | Effect size |
| 1 Health‐Related Quality of Life Show forest plot | 1 | 20 | Mean Difference (IV, Random, 95% CI) | ‐5.00 [‐20.85, 6.85] |
| 2 Peak Upper Limb Exercise Capcity: Supported Show forest plot | 2 | 37 | Std. Mean Difference (IV, Random, 95% CI) | 0.36 [‐0.29, 1.02] |
| 3 Peak Upper Limb Exercise Capacity: Unsupported Show forest plot | 1 | 18 | Mean Difference (IV, Random, 95% CI) | ‐54.0 [‐162.50, 54.50] |
| 4 Endurance Upper Limb Exercise Capacity: Supported Show forest plot | 2 | 37 | Std. Mean Difference (IV, Random, 95% CI) | 0.64 [‐0.03, 1.31] |
| 5 Endurance Upper Limb Exercise Capacity: Unsupported Show forest plot | 1 | 17 | Mean Difference (IV, Random, 95% CI) | 6.00 [0.29, 11.71] |
| 6 Respiratory Muscle Strength Show forest plot | 1 | 20 | Mean Difference (IV, Random, 95% CI) | ‐15.0 [‐28.21, ‐1.79] |
| 7 Activities of Daily Living Show forest plot | 1 | 17 | Mean Difference (IV, Random, 95% CI) | 27.0 [‐148.71, 202.71] |