Scolaris Content Display Scolaris Content Display

PRISMA flow diagram.
Figuras y tablas -
Figure 1

PRISMA flow diagram.

Risk of bias summary: review authors' judgements about each risk of bias item for each included study.
Figuras y tablas -
Figure 2

Risk of bias summary: review authors' judgements about each risk of bias item for each included study.

Forest plot of comparison: 1 Smart technology versus face‐to‐face/digital and/or written support, outcome: 1.1 Health related quality of life (CCQ and SGRQ) up to six months.
Figuras y tablas -
Figure 3

Forest plot of comparison: 1 Smart technology versus face‐to‐face/digital and/or written support, outcome: 1.1 Health related quality of life (CCQ and SGRQ) up to six months.

Forest plot of comparison: 1 Smart technology versus face‐to‐face/digital and/or written support, outcome: 1.2 Health related quality of life (CCQ only) up to six months
Figuras y tablas -
Figure 4

Forest plot of comparison: 1 Smart technology versus face‐to‐face/digital and/or written support, outcome: 1.2 Health related quality of life (CCQ only) up to six months

Forest plot of comparison: 1 Smart technology versus face‐to‐face/digital and/or written support, outcome: 1.3 Daily step count up to four months.
Figuras y tablas -
Figure 5

Forest plot of comparison: 1 Smart technology versus face‐to‐face/digital and/or written support, outcome: 1.3 Daily step count up to four months.

Forest plot of comparison: 1 Smart technology versus face‐to‐face/digital and/or written support, outcome: 1.5 Daily step count sub group 2 (at 4 weeks).
Figuras y tablas -
Figure 6

Forest plot of comparison: 1 Smart technology versus face‐to‐face/digital and/or written support, outcome: 1.5 Daily step count sub group 2 (at 4 weeks).

Comparison 1 Smart technology versus face‐to‐face/digital and/or written support, Outcome 1 Health‐related quality of life (CCQ and SGRQ) up to 6 months.
Figuras y tablas -
Analysis 1.1

Comparison 1 Smart technology versus face‐to‐face/digital and/or written support, Outcome 1 Health‐related quality of life (CCQ and SGRQ) up to 6 months.

Comparison 1 Smart technology versus face‐to‐face/digital and/or written support, Outcome 2 Health‐related quality of life (CCQ only) up to 6 months.
Figuras y tablas -
Analysis 1.2

Comparison 1 Smart technology versus face‐to‐face/digital and/or written support, Outcome 2 Health‐related quality of life (CCQ only) up to 6 months.

Comparison 1 Smart technology versus face‐to‐face/digital and/or written support, Outcome 3 Daily step count up to 4 months.
Figuras y tablas -
Analysis 1.3

Comparison 1 Smart technology versus face‐to‐face/digital and/or written support, Outcome 3 Daily step count up to 4 months.

Comparison 1 Smart technology versus face‐to‐face/digital and/or written support, Outcome 4 Daily step count (all time points).
Figuras y tablas -
Analysis 1.4

Comparison 1 Smart technology versus face‐to‐face/digital and/or written support, Outcome 4 Daily step count (all time points).

Summary of findings for the main comparison. Smart technology compared with face‐to‐face/digital and/or written support for self‐managment in COPD

Smart technology compared with face‐to‐face/digital and/or written support for self‐management in chronic obstructive pulmonary disease

Participant or population: adults with a clinical diagnosis of COPD
Setting: home or non‐healthcare residential setting (sheltered housing)
Intervention: smart technology
Comparison: face‐to‐face/digital and/or written support

Outcomes

Anticipated absolute effects* (95% CI)

Relative effect
(95% CI)

Number of participants
(studies)

Quality of the evidence
(GRADE)

Comments

Risk with face‐to‐face/digital and/or written support

Risk with smart technology

Hospital admission

239 (1 RCT; Moy 2015 at 12 months)

⊕⊕ Lowa

Hospital admission not reported at 4 months. At 12 months. smart technology did not significantly impact the number of hospital admissions

Acute exacerbations requiring general practitioner (GP) visit and/or additional treatment

239 (1 RCT; Moy 2015 at 12 months)

⊕⊕ Lowa

Acute exacerbations were not reported at 4 months. At 12 months, smart technology did not significantly impact the number of acute exacerbations

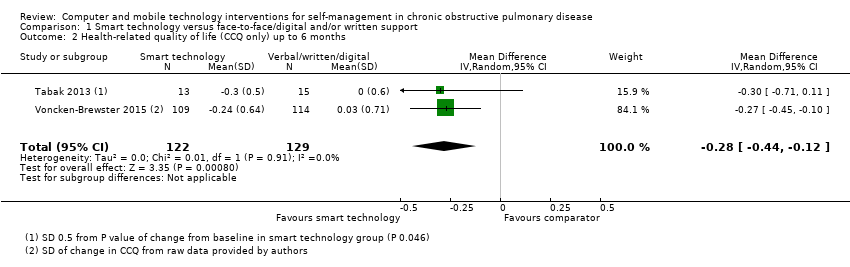
Health‐related quality of life (HRQoL)
assessed with SGRQ and CCQ
Follow‐up: range 4 weeks to 6 months

Mean HRQoL ranged across control groups from 0.08 to 1.686

SMD in HRQoL in the intervention group was 0.22 lower (0.44 to 0.03 lower)

472 (3 RCTs)

⊕⊕ Lowa

Lower scores on both SGRQ and CCQ indicate better HRQoL. The SGRQ scale ranges from 0 to 100, and a change in score of 4 units is regarded as the minimum clinically important difference (MCID). The SMD in the lower score indicates better HRQoL with smart technology
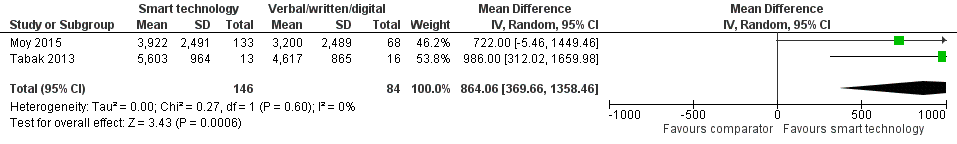
Daily step count
assessed with pedometer
Follow‐up: range 4 weeks to 4 months

Mean daily step count was 3200 to 4617 steps

Mean daily step count in the intervention group improved by 864 steps (369.66 to 1358.46 higher)

230 (2 RCTs; Moy 2015 at 4 months and Tabak 2013 at 4 weeks)

⊕⊕ Lowa

The follow‐up period differed between studies, from 4 weeks to 4 months. Smart technology significantly improved physical activity as seen in daily step counts

Self‐efficacy

0

This outcome was not measured in any of the included studies

Behaviour change: smoking cessation

284 (1 RCT)

⊕⊕⊕
Moderateb

Results showed no significant effect on smoking cessation

Functional capacity (6‐minute walking test or similar)

0

None of the included studies measured this outcome

Anxiety and depression

0

None of the included studies measured this outcome

*The risk in the intervention group (and its 95% confidence interval) is based on assumed risk in the comparison group and the relative effect of the intervention (and its 95% CI)

CI: confidence interval; SMD: standardised mean difference

GRADE Working Group grades of evidence
High quality: We are very confident that the true effect lies close to the estimate of effect
Moderate quality: We are moderately confident in the effect estimate: The true effect is likely to be close to the estimate of effect but may be substantially different
Low quality: Our confidence in the effect estimate is limited: The true effect may be substantially different from the estimate of effect
Very low quality: We have very little confidence in the effect estimate: The true effect is likely to be substantially different from the estimate of effect

aCI is wide owing to the small number of studies and the small sample sizes, which may impact precision of estimates

bCI is wide owing to the single study and the small sample size, which may impact precision of estimates

Figuras y tablas -
Summary of findings for the main comparison. Smart technology compared with face‐to‐face/digital and/or written support for self‐managment in COPD
Comparison 1. Smart technology versus face‐to‐face/digital and/or written support

Outcome or subgroup title

No. of studies

No. of participants

Statistical method

Effect size

1 Health‐related quality of life (CCQ and SGRQ) up to 6 months Show forest plot

3

472

Std. Mean Difference (IV, Random, 95% CI)

‐0.22 [‐0.40, ‐0.03]

2 Health‐related quality of life (CCQ only) up to 6 months Show forest plot

2

251

Mean Difference (IV, Random, 95% CI)

‐0.28 [‐0.44, ‐0.12]

3 Daily step count up to 4 months Show forest plot

2

230

Mean Difference (IV, Random, 95% CI)

864.06 [369.66, 1358.46]

4 Daily step count (all time points) Show forest plot

2

Mean Difference (IV, Random, 95% CI)

Totals not selected

4.1 Daily step count at 4 weeks

1

Mean Difference (IV, Random, 95% CI)

0.0 [0.0, 0.0]

4.2 Daily step count at 4 months

1

Mean Difference (IV, Random, 95% CI)

0.0 [0.0, 0.0]

4.3 Daily step count at 12 months (after 8‐month 'maintenance' phase)

1

Mean Difference (IV, Random, 95% CI)

0.0 [0.0, 0.0]

Figuras y tablas -
Comparison 1. Smart technology versus face‐to‐face/digital and/or written support