Computer‐ und Mobiltechnologie‐Interventionen für das Selbstmanagement bei chronisch obstruktiver Lungenerkrankung
Referencias
References to studies included in this review
References to studies excluded from this review
References to ongoing studies
Additional references
Characteristics of studies
Characteristics of included studies [ordered by study ID]
| Methods | Location: United States and Puerto Rico Design: randomised controlled trial Unit of allocation: individual Start date: December 2011 End date: January 2013 Duration of intervention: 12 months Time points measured: baseline, 4 months, and 12 months (only baseline and 4 months reported in this article. Moy 2016 reports 12‐month data) | |
| Participants | Population description: Participants were identified from the Veterans Association (VA) national database of patients with COPD who received care within the year before enrolment from a primary care provider, cardiologist, or pulmonologist within the VA healthcare system. All participants were over 40 years of age and had access to a computer with Internet access, used email regularly, were able to walk 1 block, and had received medical clearance from a doctor Setting: own home Method of recruitment: a random subset of 29,000 veterans (half urban and half rural) sent an email invitation Total number randomised: 238 participants were randomised in a 2:1 ratio to intervention (n = 154) or control (n = 84) groups Participants: 238, 223 were male with only 15 female participants. This is unusual but was not unexpected given that the target population consisted of veterans Age: average age, 67 years | |
| Interventions | The intervention comprised online and wearable technology. Participants were instructed to wear a pedometer daily and to upload step‐count data regularly. Each participant had a weekly goal that was based on: • average of most recent 7‐day step counts + additional 600 steps; • previous goal + 600 steps; or • 10,000 steps/d Participants had Web access to step‐count feedback, allowing self‐monitoring; weekly goal setting, educational/motivational content and an online community forum. Valid wear days were those on which at least 100 steps and 8 hours of step counts were recorded | |
| Outcomes | Self‐reported health‐related quality of life (SGRQ) and daily step counts (pedometer) were reported at 4 months and at 12 months. Hospitalisations and acute exacerbations were reported at 12 months only | |
| Notes | ||
| Risk of bias | ||
| Bias | Authors' judgement | Support for judgement |
| Random sequence generation (selection bias) | Low risk | Interested participants completed an online questionnaire that assessed inclusion criteria, after which a computer algorithm determined eligibility and participants were randomized in a 2:1 ratio to intervention or control groups (p 129) |
| Allocation concealment (selection bias) | Low risk | Allocation was done by computer, and both groups received a pedometer; therefore, group allocation was unclear to all participants (p 135) |
| Blinding of participants and personnel (performance bias) | High risk | Blinding was not possible; therefore, although limited as all study activity was online, participants may have been influenced by prior beliefs about whether or note the intervention is likely to work. Group allocation was revealed online (p 130). Also, participants were required to upload step‐count data weekly, which may have introduced bias |
| Blinding of outcome assessment (detection bias) | High risk | No blinding of outcome assessment; therefore, participants may have given what was perceived as the 'right' response. However, this may have been limited by lack of direct contact with researchers and other participants, as questionnaires were completed by participants online (p 129) |
| Incomplete outcome data (attrition bias) | Unclear risk | Reasons for missing outcome data not reported (p 130) |
| Selective reporting (reporting bias) | Low risk | Both groups reported but third time point measured at 12 months not reported; email correspondence with study authors indicates that paper reporting results at 12 months has been prepared for publication |
| Other bias | Low risk | Study appears to be free from other sources of bias |
| Methods | Location: Twente, Netherlands Design: randomised controlled trial Unit of allocation: individual Start date: October 2010 End date: April 2011 Duration of intervention: 4 weeks Time points measured: baseline, end of week 1, follow‐up measurement end of weeks 2, 3, 4 | |
| Participants | Population description: participants with a clinical diagnosis of COPD and no infection/exacerbation for 4 weeks before measurement. All were current/former smokers, had Internet access, and could read/speak Dutch. Participants were excluded if they had impaired hand function causing inability to use the application or any illness that influenced daily activities, other respiratory diseases, needed regular oxygen therapy, and received training with a physiotherapist during the 6 weeks before starting the study Setting: own home Method of recruitment: recruited by chest physician or nurse practitioner Participants: 30 (14 to intervention group and 16 to control group) Age: average 66 years | |
| Interventions | Intervention is an app comprising 2 modules • Activity coach • Web portal for recording symptoms and activity levels Daily completion of the diary on the Web portal triggered a decision support system in cases of exacerbation. The activity coach consisted of a 3‐D accelerometer and smart phone with bluetooth. Both were worn by the participant | |
| Outcomes | Self‐reported health status using the CCQ and mean activity level (pedometer) | |
| Notes | ||
| Risk of bias | ||
| Bias | Authors' judgement | Support for judgement |
| Random sequence generation (selection bias) | Unclear risk | Eligible participants were randomly assigned to intervention or control group according to a computer‐generated randomisation list (programme: Block Stratified Randomization V5: Steven Piantadosi) whereby blocked randomisation was applied in blocks of 4, stratified for gender (p 3) |
| Allocation concealment (selection bias) | Low risk | Participants and investigators enrolling participants could not foresee assignment because allocation to groups was conducted by a different person from the one who conducted the randomisation, recruited participants, and collected data (p 3) |
| Blinding of participants and personnel (performance bias) | High risk | Blinding was not possible; therefore, although potentially limited as all study activity was online, participants may have been influenced by prior beliefs about whether or not the intervention is likely to work. Allocation procedure not described (p 3) |
| Blinding of outcome assessment (detection bias) | High risk | No blinding of outcome assessment occurred; therefore, participants may have given what was perceived as the 'right' response (p 3) |
| Incomplete outcome data (attrition bias) | Low risk | All data accounted for in Figure 1 (p 5). One participant in the intervention group was lost to follow‐up owing to technical problems. No participants were lost from the control group |
| Selective reporting (reporting bias) | Low risk | Data on all outcomes, at all collection points, between groups, and within groups were reported (Tables 2, 3, 4) (p 6) |
| Other bias | Low risk | Study appears to be free from other sources of bias |
| Methods | Location: Maastricht, Netherlands Design: randomised controlled trial Unit of allocation: individual Start date: May 2012 End date: July 2013 Duration of intervention: 6 months Time points measured: baseline and 6 months | |
| Participants | Population description: Participants from 5 general practices and from a Dutch online panel were recruited. Participants who had a diagnosis of COPD or were at moderate/high risk of COPD were eligible to participate. They were also required to have access to the Internet at home, to be between 40 and 70 years of age, and to speak Dutch proficiently Setting: own home Method of recruitment: some recruited by email (Dutch online panel) and some by postal mail (6 general practices) Participants: 1325 (662 participants in the intervention group and 663 in the control group). 627 were men and 698 were women. Those with a diagnosis of COPD totalled 284, with 146 in the experimental group and 138 in the control group Age: average age 58 years | |
| Interventions | The intervention is an app called 'MasterYourBreath', which was designed to change health behaviour through a Web‐based app providing computer‐generated individualised feedback. It included 2 behaviour change modules ‐ smoking cessation and physical activity ‐ with 6 intervention components: health risk appraisal, motivational beliefs, social influence, goal setting and action plans, self‐efficacy, and maintenance. Participants could switch modules and choose to enter 1 or more of the 6 intervention components per module intervention components if they wished. Participants accessed the app through a personalised account and used it ad libitum for 6 months | |
| Outcomes | Primary: smoking cessation and physical activity Secondary: health status measured using the CCQ, intention to change behaviour, and secondary smoking cessation measures | |
| Notes | ||
| Risk of bias | ||
| Bias | Authors' judgement | Support for judgement |
| Random sequence generation (selection bias) | Low risk | A permuted block design with a random block size varying from 4 to 20 was used to randomise participants, who were stratified by channel of recruitment (p 1063) |
| Allocation concealment (selection bias) | Unclear risk | A researcher who was not involved in data collection or analysis performed randomisation and allocation revealed online for the main group; it is not clear how allocation was revealed for the practice group. It was not feasible to blind participants to group assignments owing to the study design (p 1063) |
| Blinding of participants and personnel (performance bias) | High risk | Blinding was not feasible; participants may have been influenced by prior beliefs about whether or not the intervention is likely to work (p 1064) |
| Blinding of outcome assessment (detection bias) | High risk | Outcome assessment was conducted by a self‐administered Web‐based questionnaire at baseline and at 6 months for all participants. No blinding of outcome assessment occurred; therefore, participants may have given what was perceived as the 'right' response |
| Incomplete outcome data (attrition bias) | High risk | All incomplete and complete data are reported (p 1067 and Table 2) |
| Selective reporting (reporting bias) | Low risk | Data on all outcomes, all collection points, between and within groups are reported in Table 4. Findings of subgroup analysis on participants with a diagnosis of COPD were also reported but were not presented. Researchers provided raw data for this subgroup for inclusion in the meta‐analysis for this review |
| Other bias | Low risk | Other sources of bias are not evident |
CCQ = Clinical COPD Questionnaire
SGRQ = St George’s Respiratory Questionnaire
COPD = chronic obstructive pulmonary disease
Characteristics of excluded studies [ordered by study ID]
| Study | Reason for exclusion |
| Intervention is not smart technology | |
| Not self‐management | |
| Not self‐managment | |
| Not self‐management | |
| Not self‐management | |
| Not self‐management | |
| Not self‐management | |
| Not self‐management | |
| Smart technology with monitoring | |
| Not self‐management | |
| Not a randomised controlled trial (RCT) |
Characteristics of ongoing studies [ordered by study ID]
| Trial name or title | e‐Vita: design of an innovative approach to COPD disease management in primary care through eHealth application |
| Methods | Prospective parallel cohort design using an interrupted time series (ITS) approach |
| Participants | Patients with chronic obstructive pulmonary disease (COPD) from general practices are eligible. Also, patients are eligible when they receive a diagnosis of COPD according to GOLD (Global Initiative for Chronic Obstructive Lung Disease) criteria (post‐bronchodilator forced expiratory volume in 1 second (FEV1)/forced vital capacity (FVC). Patients are excluded if they are unable to fill in questionnaires, have no access to the Internet, have a terminal illness, are immobile, or have severe substance abuse problems |
| Interventions | Web portal (e‐Vita) that provides continuous education and contact with healthcare professionals for people with COPD |
| Outcomes | Primary outcome is clinical and is expressed as health status, measured by the Clinical COPD Questionnaire (CCQ) Secondary outcomes include disability associated with breathlessness. This is measured using the Medical Research Council (MRC) breathlessness scale; quality of life (QoL) will be assessed using EuroQol‐5D (EQ‐5D) Adoption of the portal: Usage of the portal is monitored continuously by log files. User satisfaction is measured by purpose‐designed questionnaires Direct costs of the intervention and COPD care: Self‐efficacy is measured using the Generalized Self‐Efficacy Scale (GSES) |
| Starting date | Not reported |
| Contact information | [email protected]; 1 Public Health and Primary Care Department, LUMC, P.O. Box 9600, 2300 RC Leiden, The Netherlands, 2 SALTRO Diagnostic Centre, Mississippidreef 83, 3565 CE Utrecht, The Netherlands |
| Notes | Eligibility for our review is unclear from the protocol; will review findings paper |
Data and analyses
| Outcome or subgroup title | No. of studies | No. of participants | Statistical method | Effect size |
| 1 Health‐related quality of life (CCQ and SGRQ) up to 6 months Show forest plot | 3 | 472 | Std. Mean Difference (IV, Random, 95% CI) | ‐0.22 [‐0.40, ‐0.03] |
| Analysis 1.1  Comparison 1 Smart technology versus face‐to‐face/digital and/or written support, Outcome 1 Health‐related quality of life (CCQ and SGRQ) up to 6 months. | ||||
| 2 Health‐related quality of life (CCQ only) up to 6 months Show forest plot | 2 | 251 | Mean Difference (IV, Random, 95% CI) | ‐0.28 [‐0.44, ‐0.12] |
| Analysis 1.2  Comparison 1 Smart technology versus face‐to‐face/digital and/or written support, Outcome 2 Health‐related quality of life (CCQ only) up to 6 months. | ||||
| 3 Daily step count up to 4 months Show forest plot | 2 | 230 | Mean Difference (IV, Random, 95% CI) | 864.06 [369.66, 1358.46] |
| Analysis 1.3 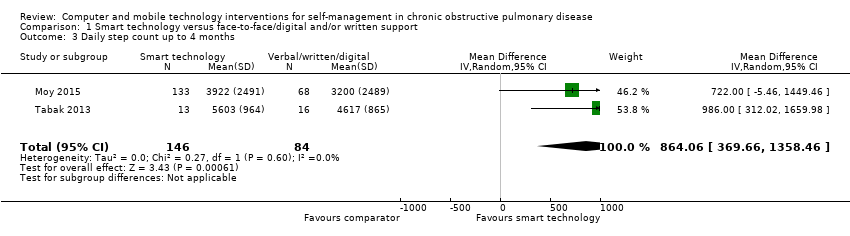 Comparison 1 Smart technology versus face‐to‐face/digital and/or written support, Outcome 3 Daily step count up to 4 months. | ||||
| 4 Daily step count (all time points) Show forest plot | 2 | Mean Difference (IV, Random, 95% CI) | Totals not selected | |
| Analysis 1.4  Comparison 1 Smart technology versus face‐to‐face/digital and/or written support, Outcome 4 Daily step count (all time points). | ||||
| 4.1 Daily step count at 4 weeks | 1 | Mean Difference (IV, Random, 95% CI) | 0.0 [0.0, 0.0] | |
| 4.2 Daily step count at 4 months | 1 | Mean Difference (IV, Random, 95% CI) | 0.0 [0.0, 0.0] | |
| 4.3 Daily step count at 12 months (after 8‐month 'maintenance' phase) | 1 | Mean Difference (IV, Random, 95% CI) | 0.0 [0.0, 0.0] | |
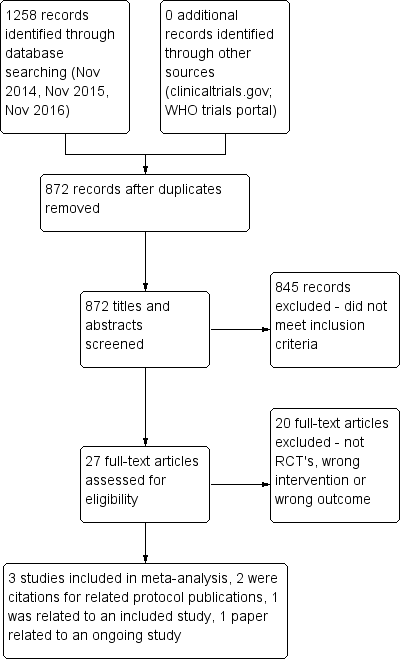
PRISMA flow diagram.
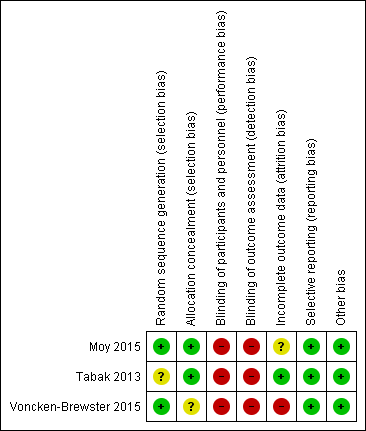
Risk of bias summary: review authors' judgements about each risk of bias item for each included study.

Forest plot of comparison: 1 Smart technology versus face‐to‐face/digital and/or written support, outcome: 1.1 Health related quality of life (CCQ and SGRQ) up to six months.

Forest plot of comparison: 1 Smart technology versus face‐to‐face/digital and/or written support, outcome: 1.2 Health related quality of life (CCQ only) up to six months
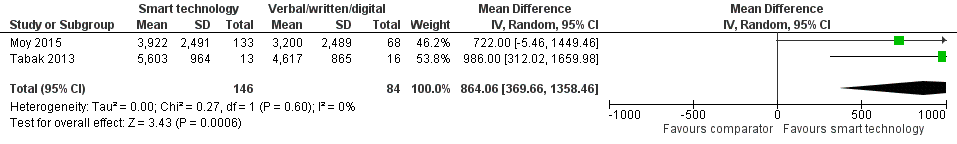
Forest plot of comparison: 1 Smart technology versus face‐to‐face/digital and/or written support, outcome: 1.3 Daily step count up to four months.

Forest plot of comparison: 1 Smart technology versus face‐to‐face/digital and/or written support, outcome: 1.5 Daily step count sub group 2 (at 4 weeks).

Comparison 1 Smart technology versus face‐to‐face/digital and/or written support, Outcome 1 Health‐related quality of life (CCQ and SGRQ) up to 6 months.
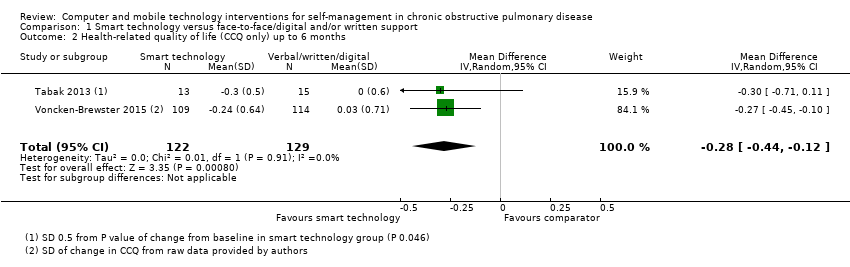
Comparison 1 Smart technology versus face‐to‐face/digital and/or written support, Outcome 2 Health‐related quality of life (CCQ only) up to 6 months.

Comparison 1 Smart technology versus face‐to‐face/digital and/or written support, Outcome 3 Daily step count up to 4 months.

Comparison 1 Smart technology versus face‐to‐face/digital and/or written support, Outcome 4 Daily step count (all time points).
| Smart technology compared with face‐to‐face/digital and/or written support for self‐management in chronic obstructive pulmonary disease | ||||||
| Participant or population: adults with a clinical diagnosis of COPD | ||||||
| Outcomes | Anticipated absolute effects* (95% CI) | Relative effect | Number of participants | Quality of the evidence | Comments | |
| Risk with face‐to‐face/digital and/or written support | Risk with smart technology | |||||
| Hospital admission | ‐ | ‐ | ‐ | 239 (1 RCT; Moy 2015 at 12 months) | ⊕⊕ Lowa | Hospital admission not reported at 4 months. At 12 months. smart technology did not significantly impact the number of hospital admissions |
| Acute exacerbations requiring general practitioner (GP) visit and/or additional treatment | ‐ | ‐ | ‐ | 239 (1 RCT; Moy 2015 at 12 months) | ⊕⊕ Lowa | Acute exacerbations were not reported at 4 months. At 12 months, smart technology did not significantly impact the number of acute exacerbations |
| Health‐related quality of life (HRQoL) | Mean HRQoL ranged across control groups from 0.08 to 1.686 | SMD in HRQoL in the intervention group was 0.22 lower (0.44 to 0.03 lower) | ‐ | 472 (3 RCTs) | ⊕⊕ Lowa | Lower scores on both SGRQ and CCQ indicate better HRQoL. The SGRQ scale ranges from 0 to 100, and a change in score of 4 units is regarded as the minimum clinically important difference (MCID). The SMD in the lower score indicates better HRQoL with smart technology |
| Daily step count | Mean daily step count was 3200 to 4617 steps | Mean daily step count in the intervention group improved by 864 steps (369.66 to 1358.46 higher) | ‐ | 230 (2 RCTs; Moy 2015 at 4 months and Tabak 2013 at 4 weeks) | ⊕⊕ Lowa | The follow‐up period differed between studies, from 4 weeks to 4 months. Smart technology significantly improved physical activity as seen in daily step counts |
| Self‐efficacy | ‐ | ‐ | 0 | ‐ | This outcome was not measured in any of the included studies | |
| Behaviour change: smoking cessation | ‐ | ‐ | 284 (1 RCT) | ⊕⊕⊕ | Results showed no significant effect on smoking cessation | |
| Functional capacity (6‐minute walking test or similar) | ‐ | ‐ | 0 | ‐ | None of the included studies measured this outcome | |
| Anxiety and depression | ‐ | ‐ | 0 | ‐ | None of the included studies measured this outcome | |
| *The risk in the intervention group (and its 95% confidence interval) is based on assumed risk in the comparison group and the relative effect of the intervention (and its 95% CI) | ||||||
| GRADE Working Group grades of evidence | ||||||
| aCI is wide owing to the small number of studies and the small sample sizes, which may impact precision of estimates bCI is wide owing to the single study and the small sample size, which may impact precision of estimates | ||||||
| Outcome or subgroup title | No. of studies | No. of participants | Statistical method | Effect size |
| 1 Health‐related quality of life (CCQ and SGRQ) up to 6 months Show forest plot | 3 | 472 | Std. Mean Difference (IV, Random, 95% CI) | ‐0.22 [‐0.40, ‐0.03] |
| 2 Health‐related quality of life (CCQ only) up to 6 months Show forest plot | 2 | 251 | Mean Difference (IV, Random, 95% CI) | ‐0.28 [‐0.44, ‐0.12] |
| 3 Daily step count up to 4 months Show forest plot | 2 | 230 | Mean Difference (IV, Random, 95% CI) | 864.06 [369.66, 1358.46] |
| 4 Daily step count (all time points) Show forest plot | 2 | Mean Difference (IV, Random, 95% CI) | Totals not selected | |
| 4.1 Daily step count at 4 weeks | 1 | Mean Difference (IV, Random, 95% CI) | 0.0 [0.0, 0.0] | |
| 4.2 Daily step count at 4 months | 1 | Mean Difference (IV, Random, 95% CI) | 0.0 [0.0, 0.0] | |
| 4.3 Daily step count at 12 months (after 8‐month 'maintenance' phase) | 1 | Mean Difference (IV, Random, 95% CI) | 0.0 [0.0, 0.0] | |