Computer‐ und Mobiltechnologie‐Interventionen für das Selbstmanagement bei chronisch obstruktiver Lungenerkrankung
Appendices
Appendix 1. Search strategy to identify relevant trials from the Cochrane Airways Group Specialised Register
#1 MeSH DESCRIPTOR Pulmonary Disease, Chronic Obstructive Explode All
#2 MeSH DESCRIPTOR Bronchitis, Chronic
#3 (obstruct*) near3 (pulmonary or lung* or airway* or airflow* or bronch* or respirat*)
#4 COPD:MISC1
#5 (COPD OR COAD OR COBD):TI,AB,KW
#6 #1 OR #2 OR #3 OR #4 OR #5
#7 MeSH DESCRIPTOR Cellular Phone
#8 MeSH DESCRIPTOR MP3‐Player
#9 MeSH DESCRIPTOR Computers, Handheld
#10 (cell* or mobile*) near3 phone*
#11 handheld* or hand‐held*
#12 smartphone* or smart‐phone*
#13 PDA
#14 personal* near3 digital*
#15 "Palm OS" or "Palm Pre classic"
#16 blackberry
#17 nokia
#18 symbian
#19 windows near3 (mobile* or phone*)
#20 INQ
#21 HTC
#22 sidekick
#23 android
#24 iphone*
#25 ipad*
#26 ipod*
#27 tablet near3 (device* or comput*)
#28 mhealth or m‐health or "m health"
#29 "mobile health"
#30 e‐health or ehealth or "e health"
#31 app* near3 (smartphone* or smart‐phone or mobile* or phone*)
#32 MeSH DESCRIPTOR Computers Explode All
#33 MeSH DESCRIPTOR Computer‐Assisted Instruction
#34 (computer* or PC or desk‐top*):ti,ab
#35 Skype*
#36 MeSH DESCRIPTOR Telemedicine Explode All
#37 MeSH DESCRIPTOR Videoconferencing Explode All
#38 (internet* or interactive):ti,ab,kw
#39 #7 or #8 or #9 or #10 or #11 or #12 or #13 or #14 or #15 or #16 or #17 or #18 or #19 or #20 or #21 or #22 or #23 or #24 or #25 or #26 or #27 or #28 or #29 or #30 or #31 or #32 or #33 or #34 or #35 or #36 or #37 or #38
#40 MeSH DESCRIPTOR Self Care Explode All
#41 self‐manag*:ti,ab,kw
#42 (self NEXT manag*):ti,ab,kw
#43 (behavior* or behaviour*) near3 change*
#44 #40 or #41 or #42 or #43
#45 #6 and (#39 or #44)
[Note: in search line #4 MISC1 denotes the field in which the reference has been coded for condition, in this case, COPD]
Appendix 2. Sources and search methods for the Cochrane Airways Group Specialised Register (CAGR)
Electronic searches: core databases
| Database | Frequency of search |
| CENTRAL (the Cochrane Library) | Monthly |
| MEDLINE (Ovid) | Weekly |
| Embase (Ovid) | Weekly |
| PsycINFO (Ovid) | Monthly |
| CINAHL (EBSCO) | Monthly |
| AMED (EBSCO) | Monthly |
Handsearches: core respiratory conference abstracts
| Conference | Years searched |
| American Academy of Allergy, Asthma and Immunology (AAAAI) | 2001 onwards |
| American Thoracic Society (ATS) | 2001 onwards |
| Asia Pacific Society of Respirology (APSR) | 2004 onwards |
| British Thoracic Society Winter Meeting (BTS) | 2000 onwards |
| Chest Meeting | 2003 onwards |
| European Respiratory Society (ERS) | 1992, 1994, 2000 onwards |
| International Primary Care Respiratory Group Congress (IPCRG) | 2002 onwards |
| Thoracic Society of Australia and New Zealand (TSANZ) | 1999 onwards |
MEDLINE search strategy used to identify trials for the CAGR
COPD search
1. Lung Diseases, Obstructive/
2. exp Pulmonary Disease, Chronic Obstructive/
3. emphysema$.mp.
4. (chronic$ adj3 bronchiti$).mp.
5. (obstruct$ adj3 (pulmonary or lung$ or airway$ or airflow$ or bronch$ or respirat$)).mp.
6. COPD.mp.
7. COAD.mp.
8. COBD.mp.
9. AECB.mp.
10. or/1‐9
Filter to identify RCTs
1. exp "clinical trial [publication type]"/
2. (randomised or randomised).ab,ti.
3. placebo.ab,ti.
4. dt.fs.
5. randomly.ab,ti.
6. trial.ab,ti.
7. groups.ab,ti.
8. or/1‐7
9. Animals/
10. Humans/
11. 9 not (9 and 10)
12. 8 not 11
The MEDLINE strategy and the RCT filter are adapted to identify trials in other electronic databases.
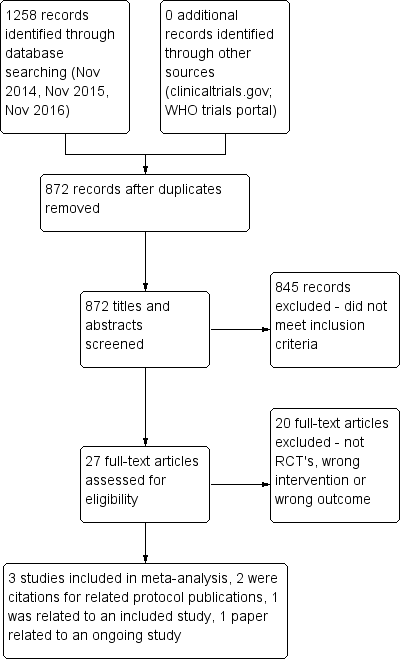
PRISMA flow diagram.
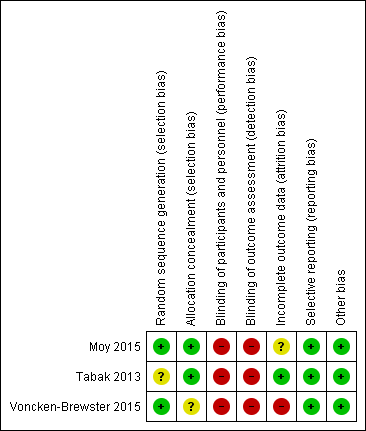
Risk of bias summary: review authors' judgements about each risk of bias item for each included study.

Forest plot of comparison: 1 Smart technology versus face‐to‐face/digital and/or written support, outcome: 1.1 Health related quality of life (CCQ and SGRQ) up to six months.

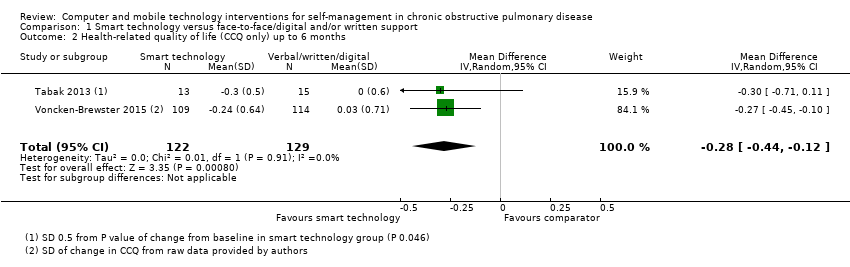
Forest plot of comparison: 1 Smart technology versus face‐to‐face/digital and/or written support, outcome: 1.2 Health related quality of life (CCQ only) up to six months
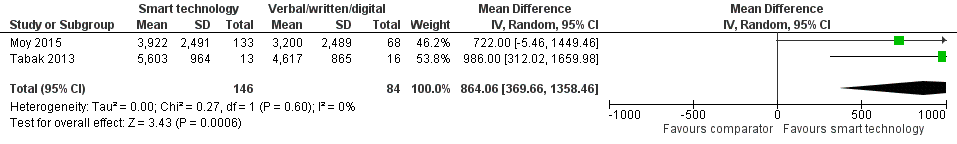
Forest plot of comparison: 1 Smart technology versus face‐to‐face/digital and/or written support, outcome: 1.3 Daily step count up to four months.

Forest plot of comparison: 1 Smart technology versus face‐to‐face/digital and/or written support, outcome: 1.5 Daily step count sub group 2 (at 4 weeks).

Comparison 1 Smart technology versus face‐to‐face/digital and/or written support, Outcome 1 Health‐related quality of life (CCQ and SGRQ) up to 6 months.
Comparison 1 Smart technology versus face‐to‐face/digital and/or written support, Outcome 2 Health‐related quality of life (CCQ only) up to 6 months.

Comparison 1 Smart technology versus face‐to‐face/digital and/or written support, Outcome 3 Daily step count up to 4 months.

Comparison 1 Smart technology versus face‐to‐face/digital and/or written support, Outcome 4 Daily step count (all time points).
| Smart technology compared with face‐to‐face/digital and/or written support for self‐management in chronic obstructive pulmonary disease | ||||||
| Participant or population: adults with a clinical diagnosis of COPD | ||||||
| Outcomes | Anticipated absolute effects* (95% CI) | Relative effect | Number of participants | Quality of the evidence | Comments | |
| Risk with face‐to‐face/digital and/or written support | Risk with smart technology | |||||
| Hospital admission | ‐ | ‐ | ‐ | 239 (1 RCT; Moy 2015 at 12 months) | ⊕⊕ Lowa | Hospital admission not reported at 4 months. At 12 months. smart technology did not significantly impact the number of hospital admissions |
| Acute exacerbations requiring general practitioner (GP) visit and/or additional treatment | ‐ | ‐ | ‐ | 239 (1 RCT; Moy 2015 at 12 months) | ⊕⊕ Lowa | Acute exacerbations were not reported at 4 months. At 12 months, smart technology did not significantly impact the number of acute exacerbations |
| Health‐related quality of life (HRQoL) | Mean HRQoL ranged across control groups from 0.08 to 1.686 | SMD in HRQoL in the intervention group was 0.22 lower (0.44 to 0.03 lower) | ‐ | 472 (3 RCTs) | ⊕⊕ Lowa | Lower scores on both SGRQ and CCQ indicate better HRQoL. The SGRQ scale ranges from 0 to 100, and a change in score of 4 units is regarded as the minimum clinically important difference (MCID). The SMD in the lower score indicates better HRQoL with smart technology |
| Daily step count | Mean daily step count was 3200 to 4617 steps | Mean daily step count in the intervention group improved by 864 steps (369.66 to 1358.46 higher) | ‐ | 230 (2 RCTs; Moy 2015 at 4 months and Tabak 2013 at 4 weeks) | ⊕⊕ Lowa | The follow‐up period differed between studies, from 4 weeks to 4 months. Smart technology significantly improved physical activity as seen in daily step counts |
| Self‐efficacy | ‐ | ‐ | 0 | ‐ | This outcome was not measured in any of the included studies | |
| Behaviour change: smoking cessation | ‐ | ‐ | 284 (1 RCT) | ⊕⊕⊕ | Results showed no significant effect on smoking cessation | |
| Functional capacity (6‐minute walking test or similar) | ‐ | ‐ | 0 | ‐ | None of the included studies measured this outcome | |
| Anxiety and depression | ‐ | ‐ | 0 | ‐ | None of the included studies measured this outcome | |
| *The risk in the intervention group (and its 95% confidence interval) is based on assumed risk in the comparison group and the relative effect of the intervention (and its 95% CI) | ||||||
| GRADE Working Group grades of evidence | ||||||
| aCI is wide owing to the small number of studies and the small sample sizes, which may impact precision of estimates bCI is wide owing to the single study and the small sample size, which may impact precision of estimates | ||||||
| Outcome or subgroup title | No. of studies | No. of participants | Statistical method | Effect size |
| 1 Health‐related quality of life (CCQ and SGRQ) up to 6 months Show forest plot | 3 | 472 | Std. Mean Difference (IV, Random, 95% CI) | ‐0.22 [‐0.40, ‐0.03] |
| 2 Health‐related quality of life (CCQ only) up to 6 months Show forest plot | 2 | 251 | Mean Difference (IV, Random, 95% CI) | ‐0.28 [‐0.44, ‐0.12] |
| 3 Daily step count up to 4 months Show forest plot | 2 | 230 | Mean Difference (IV, Random, 95% CI) | 864.06 [369.66, 1358.46] |
| 4 Daily step count (all time points) Show forest plot | 2 | Mean Difference (IV, Random, 95% CI) | Totals not selected | |
| 4.1 Daily step count at 4 weeks | 1 | Mean Difference (IV, Random, 95% CI) | 0.0 [0.0, 0.0] | |
| 4.2 Daily step count at 4 months | 1 | Mean Difference (IV, Random, 95% CI) | 0.0 [0.0, 0.0] | |
| 4.3 Daily step count at 12 months (after 8‐month 'maintenance' phase) | 1 | Mean Difference (IV, Random, 95% CI) | 0.0 [0.0, 0.0] | |