Monoterapia con fármacos antiepilépticos para la epilepsia: un metanálisis en red de los datos de los participantes individuales
Información
- DOI:
- https://doi.org/10.1002/14651858.CD011412.pub3Copiar DOI

- Base de datos:
-
- Cochrane Database of Systematic Reviews
- Versión publicada:
-
- 15 diciembre 2017see what's new
- Tipo:
-
- Intervention
- Etapa:
-
- Review
- Grupo Editorial Cochrane:
-
Grupo Cochrane de Epilepsia
- Copyright:
-
- Copyright © 2017 The Cochrane Collaboration. Published by John Wiley & Sons, Ltd.
Cifras del artículo
Altmetric:
Citado por:
Autores
Contributions of authors
SJN wrote the protocol under the supervision of AGM and CT. MS and JW commented on drafts of the protocol.
SJN and AGM screened all studies for inclusion in the review. SJN and JW performed independent risk of bias assessments on all included trials.
SJN, CTS and AGM requested all individual participant data
SJN and MS prepared individual participant data for analysis, SJN conducted analyses of the review and interpreted results under the supervision of CTS (statistical interpretation) and AGM (clinical interpretation).
SJN wrote the text of the review with the input of MS, JW, CTS and AGM.
Sources of support
Internal sources
-
National Institute of Health Research, UK.
This review was supported by the National Institute for Health Research, via Cochrane Infrastructure funding to the Cochrane Epilepsy. The views and opinions expressed therein are those of the authors and do not necessarily reflect those of the Systematic Reviews Programme, NIHR, NHS or the Department of Health.
External sources
-
No sources of support supplied
Declarations of interest
SJN was funded between 2011 and 2014 as part of a three‐year research programme, ‘Clinical and cost effectiveness of interventions for epilepsy in the National Health Service (NHS)’, which receives financial support from the National Institute of Health Research (NIHR).
JW was funded between 2011 and 2014 as part of a three‐year research programme, ‘Clinical and cost effectiveness of interventions for epilepsy in the National Health Service (NHS)’, which receives financial support from the National Institute of Health Research (NIHR).
AGM: a consortium of pharmaceutical companies (GSK, EISAI, UCB Pharma) funded the National Audit of Seizure Management in Hospitals (NASH) through grants paid to the University of Liverpool. Professor Tony Marson is part funded by National Institute for Health Research Collaboration for Leadership in Applied Health Research and Care North West Coast (NIHR CLAHRC NWC).
Acknowledgements
We are very grateful to Graham Chan, Cochrane Epilepsy Information Specialist for developing electronic search strategies for this review.
We are grateful to the translators of the Spanish, Italian, Persian and Chinese trials.
We are greatly indebted to the original trial investigators and sponsors for their time and efforts in making individual participant data available for this review.
Version history
| Published | Title | Stage | Authors | Version |
| 2022 Apr 01 | Antiepileptic drug monotherapy for epilepsy: a network meta‐analysis of individual participant data | Review | Sarah J Nevitt, Maria Sudell, Sofia Cividini, Anthony G Marson, Catrin Tudur Smith | |
| 2017 Dec 15 | Antiepileptic drug monotherapy for epilepsy: a network meta‐analysis of individual participant data | Review | Sarah J Nevitt, Maria Sudell, Jennifer Weston, Catrin Tudur Smith, Anthony G Marson | |
| 2017 Jun 29 | Antiepileptic drug monotherapy for epilepsy: a network meta‐analysis of individual participant data | Review | Sarah J Nevitt, Maria Sudell, Jennifer Weston, Catrin Tudur Smith, Anthony G Marson | |
| 2014 Dec 02 | Antiepileptic drug monotherapy for epilepsy: a network meta‐analysis | Protocol | Sarah J Nolan, Maria Sudell, Jennifer Weston, Catrin Tudur Smith, Anthony G Marson | |
Differences between protocol and review
Review structure
The title was changed in December 2014 to specify that the review uses individual participant data.
Additional headings were added to the Data extraction and management and Data synthesis and text was re‐ordered for easier reading.
Synthesis
We intended to test the proportional hazards assumption of the Cox regression model for each outcome of each trial by testing the statistical significance of a time‐varying covariate in the model for each trial and perform sensitivity analyses via interval censored (piecewise) Cox models. However, on reflection, we are unsure of the relevance and importance of the violation of this assumption for a single trial within the whole network. Therefore, instead, we tested the statistical significance of time‐varying covariates for all covariates in the primary model (stratified by trial) and if the proportional hazards assumption appeared to be violated, we performed an alternative, more flexible sensitivity analysis fitting parametric accelerated failure time model to the IPD dataset in preparation for network meta‐analysis and compared these results to the results of the primary analysis.
We stated in the protocol that we would "investigate inconsistency via the Bucher Method (Bucher 1997), which applies a z‐test to the difference between the direct treatment effect estimate and the indirect estimate for each loop of evidence. Given the simplicity of this test, the influence of the precision of the treatment effect estimate on the result of this test and the complexity introduced by multi‐arm trials and therefore association between treatment effects estimated from arms of the same trial, we used a conservative significance threshold of 10% (P value < 0.1) to judge the presence of heterogeneity. " Given the complexity of the network model fitted (with treatment by epilepsy type interaction) and the number of multi‐arm trials included in analysis, we felt that a more formal and less conservative method was needed, therefore we performed node splitting (Dias 2010) to formally estimate differences between direct and indirect evidence for each comparison and we fitted a ‘design‐by‐treatment’ inconsistency model, a method which evaluates both loop and design inconsistencies, particularly within multi‐arm trials (Higgins 2012).
Details of how adverse events will be presented in the review has been added (a narrative report rather than formal analysis).
Sensitivity analysis
Protocol‐defined sensitivity analyses were vague in detail as it was unknown exactly what kind of sensitivity analyses may be required. Specific details of required sensitivity analyses are now given.
We stated in the protocol that we intended to perform sensitivity analyses by "excluding any trial judged to be at high risk of bias for any methodological aspect." We performed several sensitivity analyses relating to inconsistencies between data provided to us and published results (mainly described in Other potential sources of bias) and the only other sources of bias (according to the Cochrane 'Risk of bias' tool) in the trials providing IPD was the open‐label design. Given the long‐term and pragmatic nature of these trials, we do not necessarily consider an open‐label design to induce bias (as further discussed in Overall completeness and applicability of evidence), therefore we did not feel such a sensitivity analysis was appropriate.
Notes
Sarah J Nolan (author of the protocol) is now Sarah J Nevitt
Keywords
MeSH
Medical Subject Headings (MeSH) Keywords
- Amines [therapeutic use];
- Anticonvulsants [*therapeutic use];
- Carbamazepine [analogs & derivatives, therapeutic use];
- Cyclohexanecarboxylic Acids [therapeutic use];
- Epilepsies, Partial [drug therapy];
- Epilepsy [*drug therapy];
- Epilepsy, Generalized [drug therapy];
- Fructose [analogs & derivatives, therapeutic use];
- Gabapentin;
- Isoxazoles [therapeutic use];
- Lamotrigine;
- Levetiracetam;
- Network Meta‐Analysis;
- Oxcarbazepine;
- Phenobarbital [therapeutic use];
- Phenytoin [therapeutic use];
- Piracetam [analogs & derivatives, therapeutic use];
- Remission Induction;
- Topiramate;
- Triazines [therapeutic use];
- Valproic Acid [therapeutic use];
- Zonisamide;
- gamma‐Aminobutyric Acid [therapeutic use];
Medical Subject Headings Check Words
Adult; Child; Humans;
PICO

Network plot of pairwise comparisons in all included studies, studies providing individual participant data (IPD) and studies without IPD
Note that the size of the node indicates the number of studies the drug is included in and the thickness of the edges corresponds to the number of participants contributing to the comparison (i.e. larger node = more studies, thicker edge = more participants).
CBZ: carbamazepine; GBP: gabapentin; LEV: levetiracetam; LTG: lamotrigine; OXC: oxcarbazepine; PHB: phenobarbitone; PHT: phenytoin; TPM: topiramate; VPS: sodium valproate; ZNS: zonisamide
To see a magnified version of this figure, please see https://epilepsy.cochrane.org/network‐meta‐analysis‐figures.

Network plot of pairwise comparisons for all included participants (total 17,961 participants), participants with partial seizures and participants with generalised tonic‐clonic seizures with or without other seizure types (shortened to 'generalised seizures' for brevity).
11978 participants were classified as experiencing partial seizures (66.7% of total), 4407 participants were classified as experiencing generalised seizures (24.5% of total) and 1576 had an unclassified or missing seizure type (8.8% of total).
Note that the size of the node indicates the number of studies the drug is included in and the thickness of the edges corresponds to the number of participants contributing to the comparison (i.e. larger node = more studies, thicker edge = more participants).
CBZ: carbamazepine; GBP: gabapentin; LEV: levetiracetam; LTG: lamotrigine; OXC: oxcarbazepine; PHB: phenobarbitone; PHT: phenytoin; TPM: topiramate; VPS: sodium valproate; ZNS: zonisamide
To see a magnified version of this figure, please see https://epilepsy.cochrane.org/network‐meta‐analysis‐figures.

Study flow diagram

Risk of bias summary: review authors' judgements about each risk of bias item for each included trial
AED: antiepileptic drug; CBZ: carbamazepine; CI: confidence interval; GBP: gabapentin; LEV: levetiracetam; LTG: lamotrigine; OXC: oxcarbazepine; PHB: phenobarbitone; PHT: phenytoin; TPM: topiramate; VPS: sodium valproate; ZNS: zonisamide
Network meta‐analysis results (direct and indirect evidence combined) for individuals with partial seizures, all drugs compared to carbamazepine (CBZ)
Note: direct evidence (%) is the proportion of the estimate contributed by direct evidence and the box size is proportional to the number of participants contributing direct evidence.
To see a magnified version of this figure, please see https://epilepsy.cochrane.org/network‐meta‐analysis‐figures.

AED: antiepileptic drug; CBZ: carbamazepine; CI: confidence interval; GBP: gabapentin; LEV: levetiracetam; LTG: lamotrigine; OXC: oxcarbazepine; PHB: phenobarbitone; PHT: phenytoin; TPM: topiramate; VPS: sodium valproate; ZNS: zonisamide
Network meta‐analysis results (direct and indirect evidence combined) for individuals with partial seizures, all drugs compared to lamotrigine (LTG)
Note: direct evidence (%) is the proportion of the estimate contributed by direct evidence and the box size is proportional to the number of participants contributing direct evidence.
To see a magnified version of this figure, please see https://epilepsy.cochrane.org/network‐meta‐analysis‐figures.

AED: antiepileptic drug; CBZ: carbamazepine; CI: confidence interval; GBP: gabapentin; LEV: levetiracetam; LTG: lamotrigine; OXC: oxcarbazepine; PHB: phenobarbitone; PHT: phenytoin; TPM: topiramate; VPS: sodium valproate; ZNS: zonisamide
Network meta‐analysis results (direct and indirect evidence combined) for individuals with generalised seizures, all drugs compared to sodium valproate (VPS)
Note: direct evidence (%) is the proportion of the estimate contributed by direct evidence and the box size is proportional to the number of participants contributing direct evidence.
Generalised tonic‐clonic seizures with or without other seizure types is shortened to 'Generalised seizures' for brevity.
To see a magnified version of this figure, please see https://epilepsy.cochrane.org/network‐meta‐analysis‐figures.

AED: antiepileptic drug; CBZ: carbamazepine; CI: confidence interval; GBP: gabapentin; LEV: levetiracetam; LTG: lamotrigine; OXC: oxcarbazepine; PHB: phenobarbitone; PHT: phenytoin; TPM: topiramate; VPS: sodium valproate; ZNS: zonisamide
Network meta‐analysis results (direct and indirect evidence combined) for individuals with partial seizures, all pairwise comparisons for time to withdrawal of allocated treatment and time to 12‐month remission.
Note: direct evidence (%) is the proportion of the estimate contributed by direct evidence and the box size is proportional to the number of participants contributing direct evidence.
To see a magnified version of this figure, please see https://epilepsy.cochrane.org/network‐meta‐analysis‐figures.
AED: antiepileptic drug; CBZ: carbamazepine; CI: confidence interval; GBP: gabapentin; LEV: levetiracetam; LTG: lamotrigine; OXC: oxcarbazepine; PHB: phenobarbitone; PHT: phenytoin; TPM: topiramate; VPS: sodium valproate; ZNS: zonisamide
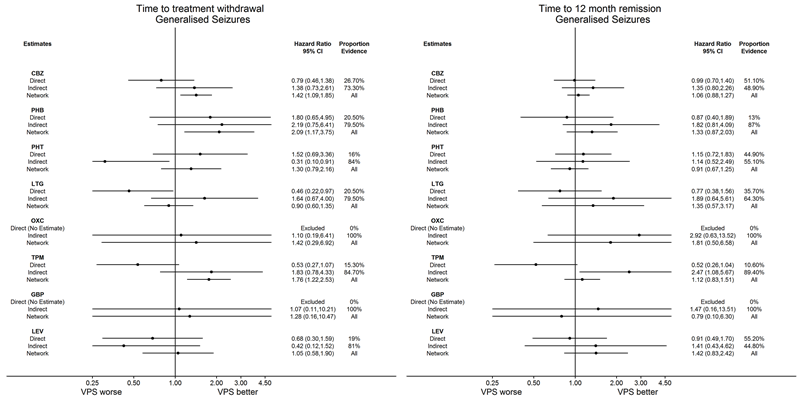
Network meta‐analysis results (direct and indirect evidence combined) for individuals with generalised seizures, all pairwise comparisons for time to withdrawal of allocated treatment and time to 12‐month remission.
Note: direct evidence (%) is the proportion of the estimate contributed by direct evidence and the box size is proportional to the number of participants contributing direct evidence.
Generalised tonic‐clonic seizures with or without other seizure types is shortened to 'Generalised seizures' for brevity.
To see a magnified version of this figure, please see https://epilepsy.cochrane.org/network‐meta‐analysis‐figures.

AED: antiepileptic drug; CBZ: carbamazepine; CI: confidence interval; GBP: gabapentin; LEV: levetiracetam; LTG: lamotrigine; OXC: oxcarbazepine; PHB: phenobarbitone; PHT: phenytoin; TPM: topiramate; VPS: sodium valproate; ZNS: zonisamide
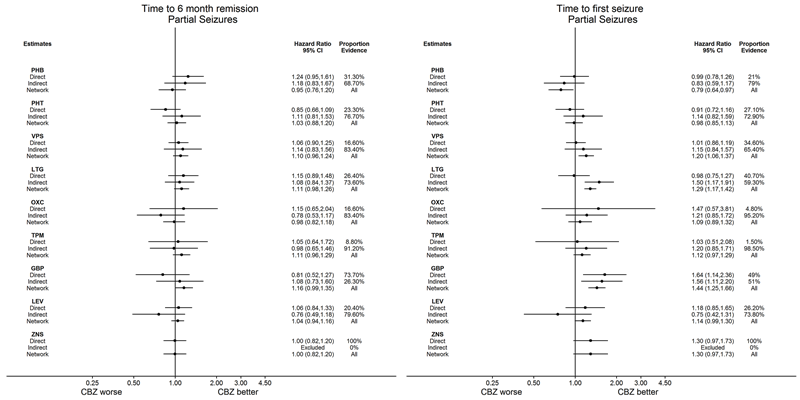
Network meta‐analysis results (direct and indirect evidence combined) for individuals with partial seizures, all pairwise comparisons for time to six‐month remission and time to first seizure.
Note: direct evidence (%) is the proportion of the estimate contributed by direct evidence and the box size is proportional to the number of participants contributing direct evidence.
To see a magnified version of this figure, please see https://epilepsy.cochrane.org/network‐meta‐analysis‐figures.
AED: antiepileptic drug; CBZ: carbamazepine; CI: confidence interval; GBP: gabapentin; LEV: levetiracetam; LTG: lamotrigine; OXC: oxcarbazepine; PHB: phenobarbitone; PHT: phenytoin; TPM: topiramate; VPS: sodium valproate; ZNS: zonisamide
Network meta‐analysis results (direct and indirect evidence combined) for individuals with generalised seizures, all pairwise comparisons for time to six‐month remission and time to first seizure.
Note: direct evidence (%) is the proportion of the estimate contributed by direct evidence and the box size is proportional to the number of participants contributing direct evidence.
Generalised tonic‐clonic seizures with or without other seizure types is shortened to 'Generalised seizures' for brevity.
To see a magnified version of this figure, please see https://epilepsy.cochrane.org/network‐meta‐analysis‐figures.

CBZ: carbamazepine; CI: confidence interval; GBP: gabapentin; LEV: levetiracetam; LTG: lamotrigine; OXC: oxcarbazepine; PHB: phenobarbitone; PHT: phenytoin; TPM: topiramate; VPS: sodium valproate; ZNS: zonisamide
Consistency: direct, indirect and network estimates for individuals with partial seizures compared to carbamazepine (CBZ) for time to withdrawal of allocated treatment and time to 12‐month remission.
Note: direct evidence comes from studies that compared the drugs (head‐to‐head comparisons), indirect evidence comes from studies that did not compare the drugs (indirect comparisons) and network evidence comes from the whole network (head‐to‐head and indirect comparisons for all drugs).
To see a magnified version of this figure, please see https://epilepsy.cochrane.org/network‐meta‐analysis‐figures.
CBZ: carbamazepine; CI: confidence interval; GBP: gabapentin; LEV: levetiracetam; LTG: lamotrigine; OXC: oxcarbazepine; PHB: phenobarbitone; PHT: phenytoin; TPM: topiramate; VPS: sodium valproate; ZNS: zonisamide
Consistency: direct, indirect and network estimates for individuals with partial seizures compared to lamotrigine (LTG) for time to withdrawal of allocated treatment and time to 12‐month remission.
Note: direct evidence comes from studies that compared the drugs (head‐to‐head comparisons), indirect evidence comes from studies that did not compare the drugs (indirect comparisons) and network evidence comes from the whole network (head‐to‐head and indirect comparisons for all drugs).
To see a magnified version of this figure, please see https://epilepsy.cochrane.org/network‐meta‐analysis‐figures.
CBZ: carbamazepine; CI: confidence interval; GBP: gabapentin; LEV: levetiracetam; LTG: lamotrigine; OXC: oxcarbazepine; PHB: phenobarbitone; PHT: phenytoin; TPM: topiramate; VPS: sodium valproate; ZNS: zonisamide
Consistency: Direct, Indirect and Network estimates for individuals with generalised seizures compared to sodium valproate (VPS) for time to withdrawal of allocated treatment and time to 12‐month remission.
Note: direct evidence comes from studies that compared the drugs (head‐to‐head comparisons), indirect evidence comes from studies that did not compare the drugs (indirect comparisons) and network evidence comes from the whole network (head‐to‐head and indirect comparisons for all drugs).
Generalised tonic‐clonic seizures with or without other seizure types is shortened to 'Generalised seizures' for brevity.
To see a magnified version of this figure, please see https://epilepsy.cochrane.org/network‐meta‐analysis‐figures.
CBZ: carbamazepine; CI: confidence interval; GBP: gabapentin; LEV: levetiracetam; LTG: lamotrigine; OXC: oxcarbazepine; PHB: phenobarbitone; PHT: phenytoin; TPM: topiramate; VPS: sodium valproate; ZNS: zonisamide
Consistency: direct, indirect and network estimates for individuals with partial seizures compared to carbamazepine (CBZ) for time to six‐month remission and time to first seizure.
Note: direct evidence comes from studies that compared the drugs (head‐to‐head comparisons), indirect evidence comes from studies that did not compare the drugs (indirect comparisons) and network evidence comes from the whole network (head‐to‐head and indirect comparisons for all drugs).
To see a magnified version of this figure, please see https://epilepsy.cochrane.org/network‐meta‐analysis‐figures.

CBZ: carbamazepine; CI: confidence interval; GBP: gabapentin; LEV: levetiracetam; LTG: lamotrigine; OXC: oxcarbazepine; PHB: phenobarbitone; PHT: phenytoin; TPM: topiramate; VPS: sodium valproate; ZNS: zonisamide
Consistency: direct, indirect and network estimates for individuals with partial seizures compared to lamotrigine (LTG) for time to six‐month remission and time to first seizure.
Note: direct evidence comes from studies that compared the drugs (head‐to‐head comparisons), indirect evidence comes from studies that did not compare the drugs (indirect comparisons) and network evidence comes from the whole network (head‐to‐head and indirect comparisons for all drugs).
To see a magnified version of this figure, please see https://epilepsy.cochrane.org/network‐meta‐analysis‐figures.

CBZ: carbamazepine; CI: confidence interval; GBP: gabapentin; LEV: levetiracetam; LTG: lamotrigine; OXC: oxcarbazepine; PHB: phenobarbitone; PHT: phenytoin; TPM: topiramate; VPS: sodium valproate; ZNS: zonisamide
Consistency: direct, indirect and network estimates for individuals with generalised seizures compared to sodium valproate (VPS) for time to six‐month remission and time to first seizure.
Note: direct evidence comes from studies that compared the drugs (head‐to‐head comparisons), indirect evidence comes from studies that did not compare the drugs (indirect comparisons) and network evidence comes from the whole network (head‐to‐head and indirect comparisons for all drugs).
Generalised tonic‐clonic seizures with or without other seizure types is shortened to 'Generalised seizures' for brevity.
To see a magnified version of this figure, please see https://epilepsy.cochrane.org/network‐meta‐analysis‐figures.
| Antiepileptic drug monotherapy for epilepsy: time to withdrawal of allocated treatment for individuals with partial seizures | ||||||
| Patient or population: adults and children with partial seizures Settings: outpatients Intervention: phenobarbitone, phenytoin, sodium valproate, lamotrigine, oxcarbazepine, topiramate, gabapentin, levetiracetam and zonisamide Comparison: carbamazepine | ||||||
| Intervention (experimental treatment)a,b | Comparison (reference treatment) | No of participants | Relative effect Direct evidence Heterogeneity: I2 | Relative effect Direct plus indirect evidence | Proportion of | Quality of the evidence |
| Phenobarbitone | Carbamazepine | 520 (4 studies) | 1.57 (1.16 to 2.13) I2 = 0% | 1.55 (1.18 to 2.04) | 52.5% | ⊕⊕⊕⊕ |
| Phenytoin | Carbamazepine | 428 (3 studies) | 1.03 (0.74 to 1.42) I2 = 63.6% | 1.13 (0.92 to 1.38) | 12.8% | ⊕⊕⊕⊕ |
| Sodium Valproate | Carbamazepine | 814 (5 studies) | 0.94 (0.73 to 1.19) I2 = 0% | 1.04 (0.86 to 1.25) | 40.1% | ⊕⊕⊕⊕ |
| Lamotrigine | Carbamazepine | 2268 (9 studies) | 0.76 (0.61 to 0.95) I2 = 39.3% | 0.75 (0.65 to 0.86) | 28.9% | ⊕⊕⊕⊕ |
| Oxcarbazepine | Carbamazepine | 562 (2 studies) | 4.62 (0.95 to 22.4) I2 = 0% | 1.09 (0.84 to 1.42) | 5.7% | ⊕⊕⊕⊕ |
| Topiramate | Carbamazepine | 937 (2 studies) | 1.04 (0.52 to 2.07) I2 = 0% | 1.18 (0.98 to 1.43) | 7.4% | ⊕⊕⊕⊕ |
| Gabapentin | Carbamazepine | 954 (2 studies) | 1.14 (0.84 to 1.55) I2 = 0% | 1.20 (1.00 to 1.43) | 87.1% | ⊕⊕⊕⊕ |
| Levetiracetam | Carbamazepine | 1567 (3 studies) | 0.70 (0.52 to 0.94) I2 = 0% | 0.82 (0.69 to 0.97) | 37.9% | ⊕⊕⊕⊕ |
| Zonisamide | Carbamazepine | 583 (1 study) | 1.08 (0.81 to 1.44) I2 = NA) | 1.08 (0.79 to 1.48) | 100% | ⊕⊕⊕⊕ |
| Abbreviations: CI: confidence interval; HR: hazard ratio; NA: not applicable | ||||||
| GRADE Working Group grades of evidence | ||||||
| aOrder of drugs in the table: drugs are ordered approximately by the date they were licenced as a monotherapy treatment (oldest first). | ||||||
| Antiepileptic drug monotherapy for epilepsy: time to withdrawal of allocated treatment for individuals with partial seizures | ||||||
| Patient or population: adults and children with partial seizures Settings: outpatients Intervention: carbamazepine, phenobarbitone, phenytoin, sodium valproate, oxcarbazepine, topiramate, gabapentin, levetiracetam and zonisamide Comparison: lamotrigine | ||||||
| Intervention (experimental treatment)a,b | Comparison (reference | No of participants | Relative effect Direct evidence Heterogeneity: I2 | Relative effect Direct plus | Proportion of | Quality of the evidence |
| Carbamazepine | Lamotrigine | 2268 (9 studies) | 1.31 (1.05 to 1.64) I2 = 39.3% | 1.34 (1.17 to 1.53) | 28.9% | ⊕⊕⊕⊕ |
| Phenobarbitone | Lamotrigine | No direct evidence | No direct evidence I2: NA | 2.08 (1.52 to 2.86) | 0% | ⊕⊕⊕⊕ |
| Phenytoin | Lamotrigine | 90 (1 study) | 0.91 (0.47 to 1.76) I2: NA | 1.52 (1.18 to 1.92) | 11.6% | ⊕⊕⊕⊕ |
| Sodium Valproate | Lamotrigine | 221 (3 studies) | 0.71 (0.51 to 1.00) I2 = 45.1% | 1.39 (1.11 to 1.72) | 5.1% | ⊕⊕⊕⊝ |
| Oxcarbazepine | Lamotrigine | 506 (1 study) | 0.69 (0.12 to 4.14) I2: NA | 1.46 (1.11 to 1.92) | 4.4% | ⊕⊕⊕⊕ |
| Topiramate | Lamotrigine | 648 (1 study) | 1.18 (0.86 to 1.62) I2: NA | 1.59 (1.29 to 1.95) | 20.9% | ⊕⊕⊕⊕ |
| Gabapentin | Lamotrigine | 659 (1 study) | 0.62 (0.06 to 6.01) I2: NA | 1.60 (1.31 to 1.96) | 1% | ⊕⊕⊕⊕ |
| Levetiracetam | Lamotrigine | 240 (1 study) | 0.86 (0.58 to 1.28) I2: NA | 1.10 (0.89 to 1.35) | 23.7% | ⊕⊕⊕⊕ |
| Zonisamide | Lamotrigine | No direct evidence | No direct evidence I2: NA | 1.45 (1.03 to 2.04) | 0% | ⊕⊕⊕⊕ |
| Abbreviations: CI: confidence interval; HR: hazard Ratio; NA: not applicable | ||||||
| GRADE Working Group grades of evidence | ||||||
| aOrder of drugs in the table: drugs are ordered approximately by the date they were licenced as a monotherapy treatment (oldest first). | ||||||
| Antiepileptic drug monotherapy for epilepsy: time to withdrawal of allocated treatment for individuals with generalised seizures | ||||||
| Patient or population: adults and children with generalised seizures* Settings: outpatients Intervention: carbamazepine, phenobarbitone, phenytoin, lamotrigine, oxcarbazepine, topiramate, gabapentin, levetiracetam and zonisamide. Comparison: sodium valproate | ||||||
| Intervention (experimental treatment)a,b | Comparison (reference | No of | Relative effect Direct evidence Heterogeneity: I2 | Relative effect Direct plus | Proportion of | Quality of the evidence |
| Carbamazepine | Sodium Valproate | 405 (4 studies) | 0.79 (0.45 to 1.37) I2 = 6.6% | 1.42 (1.09 to 1.85) | 27.3% | ⊕⊕⊕⊕ |
| Phenobarbitone | Sodium Valproate | 94 (2 studies) | 1.79 (0.65 to 5.00) I2 = 0% | 2.09 (1.17 to 3.75) | 19.4% | ⊕⊕⊕⊝ |
| Phenytoin | Sodium Valproate | 326 (3 studies) | 1.52 (0.68 to 3.33) I2 = 22.6% | 1.30 (0.79 to 2.15) | 19.3% | ⊕⊕⊕⊕ |
| Lamotrigine | Sodium Valproate | 387 (3 studies) | 0.46 (0.22 to 0.97) I2 = 0% | 0.90 (0.60 to 1.35) | 14.8% | ⊕⊕⊕⊕ |
| Oxcarbazepine | Sodium Valproate | No direct evidence | No direct evidence I2: NA | 1.42 (0.29 to 6.92) | 0% | ⊕⊕⊕⊝ |
| Topiramate | Sodium Valproate | 443 (2 studies) | 1.04 (0.52 to 2.07) I2 = 48.5% | 1.76 (1.22 to 2.53) | 22.4% | ⊕⊕⊕⊝ |
| Gabapentin | Sodium Valproate | No direct evidence | No direct evidence I2: NA | 1.28 (0.16 to 10.5) | 0% | ⊕⊕⊕⊝ |
| Levetiracetam | Sodium Valproate | 512 (1 study) | 0.68 (0.30 to 1.59) I2: NA) | 1.05 (0.58 to 1.90) | 18.6% | ⊕⊕⊕⊕ |
| Abbreviations: CI: confidence interval; HR: hazard Ratio; NA: not applicable | ||||||
| GRADE Working Group grades of evidence | ||||||
| *Generalised tonic‐clonic seizures with or without other seizure types is shortened to 'Generalised seizures' for brevity aOrder of drugs in the table: most commonly used drug first (carbamazepine), then drugs are ordered approximately by the date they were licenced as a monotherapy treatment (oldest first). | ||||||
| Antiepileptic drug monotherapy for epilepsy: time to 12‐month remission for individuals with partial seizures | ||||||
| Patient or population: adults and children with partial seizures Settings: outpatients Intervention: phenobarbitone, phenytoin, sodium valproate, lamotrigine, oxcarbazepine, topiramate, gabapentin, levetiracetam and zonisamide Comparison: carbamazepine | ||||||
| Intervention (experimental treatment)a,b | Comparison (reference treatment) | No of participants | Relative effect Direct evidence Heterogeneity: I2 | Relative effect Direct plus | Proportion of | Quality of the evidence |
| Phenobarbitone | Carbamazepine | 525 (4 studies) | 1.41 (1.04 to 1.91) I2 = 0% | 1.02 (0.76 to 1.35) | 56.1% | ⊕⊕⊕⊕ |
| Phenytoin | Carbamazepine | 430 (3 studies) | 1.00 (0.76 to 1.32) I2 = 54.8% | 1.03 (0.85 to 1.25) | 18.6% | ⊕⊕⊕⊕ |
| Sodium Valproate | Carbamazepine | 816 (5 studies) | 1.03 (0.85 to 1.25) I2 = 46.4% | 1.05 (0.89 to 1.25) | 27.6% | ⊕⊕⊕⊕ |
| Lamotrigine | Carbamazepine | 891 (2 studies) | 1.02 (0.69 to 1.50) I2 = 0% | 1.16 (0.98 to 1.37) | 17.5% | ⊕⊕⊕⊕ |
| Oxcarbazepine | Carbamazepine | 555 (2 studies) | 1.13 (0.62 to 2.05) I2 = 0% | 0.98 (0.78 to 1.25) | 21% | ⊕⊕⊕⊕ |
| Topiramate | Carbamazepine | 925 (2 studies) | 0.94 (0.48 to 1.83) I2 = 0% | 1.08 (0.92 to 1.27) | 7.2% | ⊕⊕⊕⊕ |
| Gabapentin | Carbamazepine | 651 (1 study) | 0.61 (0.06 to 5.82) I2: NA | 1.20 (0.99 to 1.47) | 10.5% | ⊕⊕⊕⊕ |
| Levetiracetam | Carbamazepine | 1567 (3 studies) | 1.08 (0.81 to 1.42) I2 = 60.8% | 1.35 (1.09 to 1.69) | 14.2% | ⊕⊕⊕⊕ |
| Zonisamide | Carbamazepine | 582 (1 study) | 1.05 (0.85 to 1.30) I2: NA | 1.05 (0.81 to 1.35) | 100% | ⊕⊕⊕⊕ |
| Abbreviations: CI: confidence interval; HR: hazard Ratio; NA: not applicable | ||||||
| GRADE Working Group grades of evidence | ||||||
| aOrder of drugs in the table: drugs are ordered approximately by the date they were licenced as a monotherapy treatment (oldest first). | ||||||
| Antiepileptic drug monotherapy for epilepsy: time to 12‐month remission for individuals with partial seizures | ||||||
| Patient or population: adults and children with partial seizures Settings: outpatients Intervention: carbamazepine, phenobarbitone, phenytoin, sodium valproate, oxcarbazepine, topiramate, gabapentin, levetiracetam and zonisamide Comparison: lamotrigine | ||||||
| Intervention (experimental treatment)a,b | Comparison (reference treatment) | No of participants | Relative effect Direct evidence Heterogeneity: I2 | Relative effect Direct plus | Proportion of | Quality of the evidence |
| Carbamazepine | Lamotrigine | 891 (2 studies) | 0.98 (0.67 to 1.45) I2 = 0% | 0.86 (0.72 to 1.02) | 17.5% | ⊕⊕⊕⊕ |
| Phenobarbitone | Lamotrigine | No direct evidence | No direct evidence I2: NA | 0.88 (0.62 to 1.22) | 0% | ⊕⊕⊕⊕ |
| Phenytoin | Lamotrigine | No direct evidence | No direct evidence I2: NA | 0.89 (0.68 to 1.13) | 0% | ⊕⊕⊕⊕ |
| Sodium Valproate | Lamotrigine | 221 (3 studies) | 0.72 (0.56 to 0.93) I2 = 0% | 0.91 (0.73 to 1.33) | 39.9% | ⊕⊕⊕⊕ |
| Oxcarbazepine | Lamotrigine | 499 (1 study) | 1.49 (0.33 to 6.67) I2: NA | 0.85 (0.66 to 1.09) | 2.8% | ⊕⊕⊕⊕ |
| Topiramate | Lamotrigine | 636 (1 study) | 0.98 (0.29 to 3.25) I2: NA | 0.93 (0.75 to 1.15) | 2.5% | ⊕⊕⊕⊕ |
| Gabapentin | Lamotrigine | 647 (1 study) | 0.74 (0.08 to 6.58) I2: NA | 1.04 (0.84 to 1.30) | 10.1% | ⊕⊕⊕⊕ |
| Levetiracetam | Lamotrigine | 240 (1 study) | 1.02 (0.70 to 1.49) I2: NA | 1.16 (0.93 to 1.47) | 26.6% | ⊕⊕⊕⊕ |
| Zonisamide | Lamotrigine | No direct evidence | No direct evidence I2: NA | 0.91 (0.67 to 1.22) | 0% | ⊕⊕⊕⊕ |
| Abbreviations: CI: confidence interval; HR: hazard Ratio; NA: not applicable | ||||||
| GRADE Working Group grades of evidence | ||||||
| aOrder of drugs in the table: drugs are ordered approximately by the date they were licenced as a monotherapy treatment (oldest first). | ||||||
| Antiepileptic drug monotherapy for epilepsy: time to withdrawal of allocated treatment for individuals with generalised seizures | ||||||
| Patient or population: adults and children with generalised seizures* Settings: outpatients Intervention: carbamazepine, phenobarbitone, phenytoin, lamotrigine, oxcarbazepine, topiramate, gabapentin, levetiracetam and zonisamide Comparison: sodium valproate | ||||||
| Intervention (experimental treatment)a,b | Comparison (reference treatment) | No of participants | Relative effect Direct evidence | Relative effect Direct plus | Proportion of | Quality of the evidence |
| Carbamazepine | Sodium Valproate | 412 (4 studies) | 0.99 (0.69 to 1.39) I2 = 0% | 1.06 (0.88 to 1.27) | 51.1% | ⊕⊕⊕⊕ |
| Phenobarbitone | Sodium Valproate | 98 (2 studies) | 0.86 (0.40 to 1.89) I2 = 42.3% | 1.33 (0.87 to 2.04) | 13% | ⊕⊕⊕⊕ |
| Phenytoin | Sodium Valproate | 269 (4 studies) | 1.15 (0.71 to 1.82) I2 = 0% | 0.91 (0.67 to 1.25) | 44.9% | ⊕⊕⊕⊕ |
| Lamotrigine | Sodium Valproate | 387 (3 studies) | 0.77 (0.38 to 1.56) I2 = 0% | 1.35 (0.57 to 3.13) | 35.7% | ⊕⊕⊕⊕ |
| Oxcarbazepine | Sodium Valproate | No direct evidence | No direct evidence I2: NA | 1.82 (0.50 to 6.67) | 0% | ⊕⊕⊕⊝ |
| Topiramate | Sodium Valproate | 441 (2 studies) | 0.52 (0.26 to 1.04) I2 = 58.5% | 1.12 (0.83 to 1.52) | 10.6% | ⊕⊕⊕⊕ |
| Gabapentin | Sodium Valproate | No direct evidence | No direct evidence I2: NA | 0.79 (0.10 to 6.25) | 0% | ⊕⊕⊕⊝ |
| Levetiracetam | Sodium Valproate | 512 (1 study) | 0.91 (0.49 to 1.70) I2: NA | 1.41 (0.83 to 2.44) | 55.2% | ⊕⊕⊕⊕ |
| Abbreviations: CI: confidence interval; HR: hazard Ratio; NA: not applicable | ||||||
| GRADE Working Group grades of evidence | ||||||
| *Generalised tonic‐clonic seizures with or without other seizure types is shortened to 'Generalised seizures' for brevity. aOrder of drugs in the table: drugs are ordered approximately by the date they were licenced as a monotherapy treatment (oldest first). | ||||||
| Trial\Drug | CBZ | PHB | PHT | VPS | LTG | OXC | LEV | TPM | GBP | ZNS | Total | Total randomiseda |
| Trials providing individual participant data | ||||||||||||
| 54 | 54 | 0 | 0 | 0 | 0 | 0 | 0 | 0 | 0 | 108 | 108 | |
| 301 | 0 | 0 | 0 | 0 | 0 | 0 | 0 | 0 | 282 | 583 | 583 | |
| 0 | 0 | 144 | 0 | 0 | 143 | 0 | 0 | 0 | 0 | 287 | 287 | |
| 0 | 0 | 0 | 69 | 66 | 0 | 0 | 0 | 0 | 0 | 135 | 136 | |
| 66 | 0 | 0 | 0 | 70 | 0 | 0 | 0 | 0 | 0 | 136 | 136 | |
| 63 | 0 | 0 | 0 | 61 | 0 | 0 | 0 | 0 | 0 | 124 | 124 | |
| 48 | 0 | 0 | 0 | 102 | 0 | 0 | 0 | 0 | 0 | 150 | 150 | |
| 291 | 0 | 0 | 0 | 0 | 0 | 288 | 0 | 0 | 0 | 579 | 579 | |
| 74 | 0 | 0 | 0 | 0 | 0 | 0 | 0 | 218 | 0 | 292 | 292 | |
| 0 | 0 | 81 | 85 | 0 | 0 | 0 | 0 | 0 | 0 | 166 | 166 | |
| 54 | 10 | 54 | 49 | 0 | 0 | 0 | 0 | 0 | 0 | 167 | 173 | |
| 26 | 0 | 0 | 0 | 0 | 26 | 0 | 0 | 0 | 0 | 52 | 52 | |
| 41 | 0 | 0 | 0 | 43 | 0 | 0 | 0 | 0 | 0 | 84 | 84 | |
| 0 | 0 | 94 | 0 | 0 | 99 | 0 | 0 | 0 | 0 | 193 | 193 | |
| 61 | 58 | 63 | 61 | 0 | 0 | 0 | 0 | 0 | 0 | 243 | 243 | |
| 0 | 0 | 0 | 44 | 37 | 0 | 0 | 0 | 0 | 0 | 81 | 81 | |
| 53 | 0 | 0 | 0 | 57 | 0 | 0 | 0 | 0 | 0 | 110 | 110 | |
| 155 | 155 | 165 | 0 | 0 | 0 | 0 | 0 | 0 | 0 | 475 | 475 | |
| 236 | 0 | 0 | 244 | 0 | 0 | 0 | 0 | 0 | 0 | 480 | 480 | |
| 202 | 0 | 0 | 0 | 420 | 0 | 0 | 0 | 0 | 0 | 622 | 622 | |
| 19 | 18 | 18 | 0 | 0 | 0 | 0 | 0 | 0 | 0 | 55 | 55 | |
| 0 | 47 | 47 | 0 | 0 | 0 | 0 | 0 | 0 | 0 | 94 | 94 | |
| 95 | 97 | 0 | 0 | 0 | 0 | 0 | 0 | 0 | 0 | 192 | 192 | |
| Privitera 2003 (CBZ branch)b | 129 | 0 | 0 | 0 | 0 | 0 | 0 | 266 | 0 | 0 | 395 | 395 |
| Privitera 2003 (VPS branch)b | 0 | 0 | 0 | 78 | 0 | 0 | 0 | 147 | 0 | 0 | 225 | 225 |
| 0 | 0 | 50 | 86 | 0 | 0 | 0 | 0 | 0 | 0 | 136 | 136 | |
| 0 | 0 | 128 | 0 | 0 | 0 | 0 | 133 | 0 | 0 | 261 | 261 | |
| 121 | 0 | 0 | 0 | 230 | 0 | 0 | 0 | 0 | 0 | 351 | 351 | |
| 151 | 0 | 0 | 149 | 0 | 0 | 0 | 0 | 0 | 0 | 300 | 300 | |
| 378 | 0 | 0 | 0 | 378 | 210 | 0 | 378 | 377 | 0 | 1721 | 1721 | |
| 0 | 0 | 0 | 238 | 239 | 0 | 0 | 239 | 0 | 0 | 716 | 716 | |
| 0 | 0 | 95 | 0 | 86 | 0 | 0 | 0 | 0 | 0 | 181 | 181 | |
| 0 | 0 | 0 | 109 | 117 | 0 | 0 | 0 | 0 | 0 | 226 | 227 | |
| Trinka 2013 (CBZ branch)b | 503 | 0 | 0 | 0 | 0 | 0 | 493 | 0 | 0 | 0 | 996 | 999 |
| Trinka 2013 (VPS branch)b | 0 | 0 | 0 | 353 | 0 | 0 | 350 | 0 | 0 | 0 | 703 | 703 |
| 0 | 0 | 70 | 70 | 0 | 0 | 0 | 0 | 0 | 0 | 140 | 140 | |
| 130 | 0 | 0 | 130 | 0 | 0 | 0 | 0 | 0 | 0 | 260 | 260 | |
| 121 | 0 | 0 | 0 | 118 | 0 | 122 | 0 | 0 | 0 | 361 | 361 | |
| Total | 3372 | 439 | 1009 | 1765 | 2024 | 478 | 1253 | 1163 | 595 | 282 | 12,380 | 12,391 |
| Trials not providing individual participant data | ||||||||||||
| Trial\Drug | CBZ | PHB | PHT | VPS | LTG | OXC | LEV | TPM | GBP | ZNS | Total | Total randomiseda |
| 0 | 0 | 18 | 0 | 0 | 19 | 0 | 0 | 0 | 0 | 37 | 37 | |
| 36 | 35 | 0 | 0 | 0 | 0 | 0 | 0 | 0 | 0 | 71 | 71 | |
| 0 | 0 | 0 | 0 | 151 | 0 | 0 | 0 | 158 | 0 | 309 | 309 | |
| 59 | 0 | 58 | 64 | 0 | 0 | 0 | 0 | 0 | 0 | 181 | 181 | |
| 17 | 0 | 0 | 0 | 0 | 0 | 18 | 0 | 0 | 0 | 35 | 35 | |
| 14 | 0 | 0 | 0 | 0 | 0 | 13 | 0 | 0 | 0 | 27 | 27 | |
| 26 | 25 | 0 | 25 | 0 | 0 | 0 | 0 | 0 | 0 | 76 | 76 | |
| 15 | 0 | 0 | 0 | 0 | 0 | 16 | 0 | 0 | 0 | 31 | 31 | |
| 0 | 0 | 0 | 121 | 0 | 128 | 0 | 0 | 0 | 0 | 249 | 249 | |
| 66 | 0 | 0 | 0 | 0 | 0 | 62 | 0 | 0 | 0 | 128 | 128 | |
| 6 | 6 | 0 | 0 | 0 | 0 | 0 | 0 | 0 | 0 | 12 | 12 | |
| 30 | 30 | 30 | 30 | 0 | 0 | 0 | 0 | 0 | 0 | 120 | 120 | |
| 100 | 0 | 0 | 0 | 0 | 94 | 0 | 0 | 0 | 0 | 194 | 194 | |
| 28 | 0 | 0 | 29 | 0 | 55 | 0 | 0 | 0 | 0 | 112 | 112 | |
| 152 | 150 | 0 | 0 | 0 | 0 | 0 | 0 | 0 | 0 | 302 | 302 | |
| 23 | 0 | 20 | 21 | 0 | 0 | 0 | 0 | 0 | 0 | 64 | 64 | |
| 0 | 0 | 0 | 0 | 21 | 27 | 0 | 0 | 0 | 0 | 48 | 48 | |
| 32 | 0 | 0 | 0 | 32 | 0 | 0 | 0 | 0 | 0 | 64 | 64 | |
| 64 | 0 | 0 | 0 | 0 | 0 | 57 | 0 | 0 | 0 | 121 | 121 | |
| 70 | 0 | 0 | 0 | 73 | 0 | 0 | 0 | 0 | 0 | 143 | 143 | |
| 6 | 0 | 0 | 3 | 0 | 0 | 6 | 0 | 0 | 0 | 15 | 15 | |
| 129 | 0 | 0 | 0 | 264 | 0 | 0 | 0 | 0 | 0 | 393 | 393 | |
| 0 | 0 | 0 | 38 | 35 | 0 | 0 | 0 | 0 | 0 | 73 | 73 | |
| 15 | 18 | 0 | 0 | 0 | 0 | 0 | 0 | 0 | 0 | 33 | 33 | |
| 66 | 0 | 51 | 46 | 0 | 0 | 0 | 0 | 0 | 0 | 163 | 163 | |
| 0 | 0 | 0 | 0 | 50 | 0 | 50 | 0 | 0 | 0 | 100 | 100 | |
| 0 | 0 | 0 | 0 | 0 | 178 | 175 | 0 | 0 | 0 | 353 | 353 | |
| 215 | 0 | 0 | 0 | 0 | 0 | 218 | 0 | 0 | 0 | 433 | 433 | |
| 23 | 0 | 20 | 0 | 0 | 0 | 0 | 0 | 0 | 0 | 43 | 43 | |
| 42 | 0 | 45 | 0 | 0 | 0 | 0 | 0 | 0 | 0 | 87 | 87 | |
| ? | 0 | 0 | 0 | 0 | 0 | ? | 0 | 0 | 0 | 37 | 37 | |
| 0 | 0 | 45 | 49 | 0 | 0 | 0 | 0 | 0 | 0 | 94 | 94 | |
| 20 | 0 | 20 | 0 | 0 | 0 | 0 | 0 | 0 | 0 | 40 | 40 | |
| 42 | 0 | 0 | 0 | 0 | 0 | 0 | 46 | 0 | 0 | 88 | 88 | |
| 198 | 0 | 0 | 0 | 200 | 0 | 0 | 0 | 195 | 0 | 593 | 593 | |
| 92 | 0 | 0 | 0 | 93 | 0 | 0 | 0 | 0 | 0 | 185 | 185 | |
| 0 | 0 | 15 | 18 | 0 | 0 | 0 | 0 | 0 | 0 | 33 | 33 | |
| 17 | 0 | 0 | 16 | 0 | 0 | 0 | 0 | 0 | 0 | 33 | 33 | |
| 30 | 0 | 0 | 0 | 0 | 0 | 30 | 0 | 0 | 0 | 60 | 60 | |
| 88 | 0 | 0 | 30 | 121 | 0 | 0 | 0 | 0 | 0 | 239 | 239 | |
| 0 | 51 | 52 | 48 | 0 | 0 | 0 | 0 | 0 | 0 | 151 | 151 | |
| Totalc | 1721 | 315 | 374 | 538 | 1040 | 501 | 645 | 46 | 353 | 0 | 5570 | 5570 |
| Grand totalc | 5093 | 754 | 1383 | 2303 | 3064 | 979 | 1898 | 1209 | 948 | 282 | 17,950 | 17,961 |
| CBZ: carbamazepine; GBP: gabapentin; IPD: individual participant data; ITT: intention to treat; LEV: levetiracetam; LTG: lamotrigine; OXC: oxcarbazepine; PHB: phenobarbitone; PHT: phenytoin; TPM: topiramate; VPS: sodium valproate; ZNS: zonisamide aDrug allocated missing for 11 participants in the IPD provided. | ||||||||||||
| Trial | Gender | Epilepsy type | Epilepsy type reclassifiedc | ||||||
| Male | Female | Missing | Genb | Partial | Missing | Genb | Partial | Unclassifiedd | |
| 61 (56%) | 47 (44%) | 0 (0%) | 49 (45%) | 59 (55%) | 0 (0%) | 49 (45%) | 59 (55%) | 0 (0%) | |
| 347 (60%) | 236 (40%) | 0 (0%) | 0 (0%) | 583 (100%) | 0 (0%) | 0 (0%) | 583 (100%) | 0 (0%) | |
| 174 (61%) | 113 (39%) | 0 (0%) | 105 (37%) | 182 (63%) | 0 (0%) | 75 (26%) | 182 (63%) | 30 (10%) | |
| 60 (44%) | 75 (55%) | 1 (1%) | 46 (34%) | 82 (60%) | 8 (6%) | 33 (24%) | 82 (60%) | 21 (15%) | |
| 56 (41%) | 80 (59%) | 0 (0%) | 54 (40%) | 82 (60%) | 0 (0%) | 34 (25%) | 82 (60%) | 20 (15%) | |
| 56 (45%) | 68 (55%) | 0 (0%) | 62 (50%) | 62 (50%) | 0 (0%) | 39 (31%) | 62 (50%) | 23 (19%) | |
| 83 (55%) | 67 (45%) | 0 (0%) | 45 (30%) | 105 (70%) | 0 (0%) | 0 (0%) | 105 (70%) | 45 (30%) | |
| 319 (55%) | 260 (45%) | 0 (0%) | 113 (20%) | 466 (80%) | 0 (0%) | 50 (9%) | 466 (80%) | 63 (11%) | |
| 157 (54%) | 135 (46%) | 0 (0%) | 0 (0%) | 292 (100%) | 0 (0%) | 0 (0%) | 292 (100%) | 0 (0%) | |
| 71 (43%) | 92 (55%) | 3 (2%) | 86 (52%) | 80 (48%) | 0 (0%) | 2 (1%) | 80 (48%) | 84 (51%) | |
| 86 (50%) | 81 (47%) | 6 (3%) | 84 (49%) | 89 (51%) | 0 (0%) | 84 (49%) | 89 (51%) | 0 (0%) | |
| 21 (40%) | 31 (60%) | 0 (0%) | 0 (0%) | 52 (100%) | 0 (0%) | 0 (0%) | 52 (100%) | 0 (0%) | |
| 48 (57%) | 36 (43%) | 0 (0%) | 0 (0%) | 84 (100%) | 0 (0%) | 0 (0%) | 84 (100%) | 0 (0%) | |
| 100 (52%) | 93 (48%) | 0 (0%) | 50 (26%) | 143 (74%) | 0 (0%) | 45 (23%) | 143 (74%) | 5 (3%) | |
| 117 (48%) | 126 (52%) | 0 (0%) | 141 (58%) | 102 (42%) | 0 (0%) | 82 (34%) | 102 (42%) | 59 (24%) | |
| 40 (49%) | 41 (51%) | 0 (0%) | 48 (59%) | 29 (36%) | 4 (5%) | 25 (31%) | 29 (36%) | 27 (33%) | |
| 57 (52%) | 53 (48%) | 0 (0%) | 15 (14%) | 95 (86%) | 0 (0%) | 6 (5%) | 95 (86%) | 9 (8%) | |
| 413 (87%) | 58 (12%) | 4 (1%) | 1 (0%) | 474 (100%) | 0 (0%) | 1 (0%) | 474 (100%) | 0 (0%) | |
| 445 (93%) | 35 (7%) | 0 (0%) | 0 (0%) | 480 (100%) | 0 (0%) | 0 (0%) | 480 (100%) | 0 (0%) | |
| 329 (53%) | 293 (47%) | 0 (0%) | 3 (1%) | 619 (99%) | 0 (0%) | 1 (0%) | 619 (100%) | 2 (0%) | |
| 34 (62%) | 21 (38%) | 0 (0%) | 45 (82%) | 10 (18%) | 0 (0%) | 26 (47%) | 10 (18%) | 19 (35%) | |
| 47 (50%) | 45 (48%) | 2 (2%) | 34 (36%) | 60 (64%) | 0 (0%) | 34 (36%) | 60 (64%) | 0 (0%) | |
| 67 (35%) | 125 (65%) | 0 (0%) | 59 (31%) | 133 (69%) | 0 (0%) | 35 (18%) | 133 (69%) | 24 (13%) | |
| (CBZ branch)a | 215 (54%) | 180 (46%) | 0 (0%) | 88 (22%) | 285 (72%) | 22 (6%) | 51 (13%) | 285 (72%) | 59 (15%) |
| (VPS branch)a | 112 (50%) | 113 (50%) | 0 (0%) | 131 (58%) | 78 (35%) | 16 (7%) | 86 (38%) | 78 (35%) | 61 (27%) |
| 73 (54%) | 63 (46%) | 0 (0%) | 136 (100%) | 0 (0%) | 0 (0%) | 110 (81%) | 0 (0%) | 26 (19%) | |
| 126 (48%) | 135 (52%) | 0 (0%) | 150 (57%) | 53 (20%) | 58 (22%) | 80 (31%) | 53 (20%) | 128 (49%) | |
| 188 (54%) | 163 (46%) | 0 (0%) | 114 (32%) | 237 (68%) | 0 (0%) | 71 (20%) | 237 (68%) | 43 (12%) | |
| 153 (51%) | 147 (49%) | 0 (0%) | 154 (51%) | 146 (49%) | 0 (0%) | 87 (29%) | 146 (49%) | 67 (22%) | |
| 922 (54%) | 755 (44%) | 44 (3%) | 25 (1%) | 1491 (87%) | 205 (12%) | 16 (1%) | 1491 (87%) | 214 (12%) | |
| 420 (59%) | 282 (39%) | 14 (2%) | 463 (65%) | 52 (7%) | 201 (28%) | 397 (55%) | 52 (7%) | 267 (37%) | |
| 101 (56%) | 80 (44%) | 0 (0%) | 91 (50%) | 90 (50%) | 0 (0%) | 55 (30%) | 90 (50%) | 36 (20%) | |
| 114 (50%) | 112 (49%) | 1 (0%) | 32 (14%) | 154 (68%) | 41 (18%) | 29 (13%) | 154 (68%) | 44 (19%) | |
| (CBZ branch)a | 551 (55%) | 448 (45%) | 0 (0%) | 141 (14%) | 858 (86%) | 0 (0%) | 48 (5%) | 858 (86%) | 93 (9%) |
| (VPS branch)a | 398 (57%) | 305 (43%) | 0 (0%) | 513 (73%) | 190 (27%) | 0 (0%) | 285 (41%) | 190 (27%) | 228 (32%) |
| 73 (52%) | 67 (48%) | 0 (0%) | 77 (55%) | 63 (45%) | 0 (0%) | 42 (30%) | 63 (45%) | 35 (25%) | |
| 122 (47%) | 138 (53%) | 0 (0%) | 152 (58%) | 108 (42%) | 0 (0%) | 152 (58%) | 108 (42%) | 0 (0%) | |
| 215 (60%) | 146 (40%) | 0 (0%) | 0 (0%) | 361 (100%) | 0 (0%) | 0 (0%) | 361 (100%) | 0 (0%) | |
| Total | 6971(56%) | 5345 (43%) | 75 (1%) | 3307 (27%) | 8529 (69%) | 555 (4%) | 2130 (17%) | 8529 (69%) | 1732 (14%) |
| aTrials designed in two strata based on whether recommended treatment would be CBZ or VPS. Within the two strata, participants were randomised to TPM in Privitera 2003/LEV in Trinka 2013 or CBZ/VPS depending on the strata. Data analysed according to the separate strata (CBZ branch or VPS branch) in this review. | |||||||||
| Trial | Age (years) | Epilepsy duration (years) | Number of seizures in the last 6 months | |||||||
| Mean | SD | Range | Missing | Median | Range | Missing | Median | Range | Missing | |
| 5.7 | 3.5 | 1 to 15 | 0 | 1.2 | 0 to 11.5 | 0 | 24 | 1 to 7200 | 5 | |
| 36.4 | 15.9 | 18 to 75 | 0 | 0.2 | 0 to 17.7 | 30 | 2 | 1 to 30 | 1 | |
| 26.8 | 10.7 | 15 to 91 | 1 | 0.4 | 0 to 25 | 0 | 3 | 0 to 252 | 0 | |
| 32 | 14.5 | 12 to 76 | 0 | 1 | 0 to 53 | 27 | 2 | 0 to 100 | 2 | |
| 34 | 15.8 | 14 to 71 | 0 | 1 | 0 to 18 | 0 | 4 | 1 to 960 | 0 | |
| 30 | 14.1 | 14 to 81 | 0 | 0.5 | 0 to 19.4 | 0 | 3 | 1 to 1020 | 0 | |
| 76.9 | 6 | 65 to 94 | 0 | NA | NA | 150 | 3 | 0 to 163 | 0 | |
| 39 | 16.2 | 15 to 82 | 0 | NA | NA | 579 | 3 | 1 to 1410 | 4 | |
| 35 | 16.6 | 12 to 86 | 0 | 0.5 | 0 to 7.7 | 5 | 4 | 1 to 146 | 6 | |
| 78.2 | 7.1 | 61 to 95 | 3 | NA | NA | 166 | 3 | 0 to 99 | 3 | |
| 9.9 | 3.6 | 3 to 16 | 6 | 0.5 | 0 to 13.7 | 6 | 3 | 1 to 900 | 6 | |
| 10.8 | 2.3 | 4 to 15 | 0 | NA | NA | 52 | 3 | 1 to 60 | 0 | |
| 8.8 | 2.1 | 5 to 13 | 0 | 0.4 | 0 to 4.5 | 0 | 3 | 2 to 11 | 0 | |
| 18.6 | 9.7 | 5 to 53 | 1 | 0.4 | 0 to 20 | 0 | 2 | 0 to 157 | 0 | |
| 32.3 | 14.8 | 13 to 77 | 3 | 1 | 0 to 40 | 4 | 2 | 1 to 579 | 3 | |
| 33.9 | 10.9 | 16 to 56 | 0 | NA | NA | 81 | 1 | 0 to 540 | 0 | |
| 35.8 | 12.2 | 16 to 60 | 0 | NA | NA | 110 | 2 | 0 to 200 | 0 | |
| 41 | 15.5 | 18 to 82 | 4 | 2 | 0.5 to 59 | 5 | 1 | 1 to 100 | 7 | |
| 47.1 | 16.1 | 18 to 83 | 0 | 3 | 1 to 68 | 19 | 12 | 1 to 2248 | 38 | |
| 27.2 | 21.4 | 2 to 84 | 1 | NA | NA | 622 | 3 | 1 to 9000 | 0 | |
| 27.5 | 8.5 | 14 to 55 | 0 | 7 | 3 to 11.5 | 18 | 12 | 6 to 42 | 0 | |
| 11.4 | 5 | 2 to 18 | 0 | 2.5 | 0.5 to 17 | 2 | NA | NA | 94 | |
| 29 | 17.6 | 2 to 68 | 0 | 5 | 0.5 to 44 | 0 | 2 | 0 to 100 | 0 | |
| (CBZ branch)a | 34.4 | 18.4 | 6 to 80 | 0 | NA | NA | 395 | 4 | 0 to 2400 | 0 |
| (VPS branch)a | 32.8 | 19.4 | 6 to 84 | 0 | NA | NA | 225 | 4 | 0 to 20000 | 0 |
| 20.9 | 14.2 | 3 to 64 | 0 | 0 | 0 to 3 | 0 | NA | NA | 136 | |
| 34.1 | 14.8 | 12 to 78 | 0 | NA | NA | 261 | 4 | 0 to 570 | 0 | |
| 32.1 | 14.2 | 12 to 72 | 2 | 0.7 | 0 to 27 | 3 | 3 | 1 to 145 | 1 | |
| 33 | 14.9 | 16 to 79 | 2 | NA | NA | 300 | 4 | 2 to 101 | 5 | |
| 38.4 | 18.3 | 5 to 86 | 44 | NA | NA | 1721 | 4 | 0 to 1185 | 49 | |
| 22.5 | 14.1 | 5 to 77 | 14 | NA | NA | 716 | 3 | 0 to 2813 | 17 | |
| 34.1 | 16.7 | 13 to 75 | 1 | 1.3 | 0 to 28.5 | 1 | 3 | 1 to 600 | 0 | |
| 36 | 16.9 | 13 to 80 | 2 | NA | NA | 227 | 18 | 6 to 1080 | 37 | |
| (CBZ branch)1 | 42.8 | 17.2 | 16 to 89 | 0 | NA | NA | 999 | NA | NA | 999 |
| (VPS branch)1 | 36.5 | 17.8 | 16 to 85 | 1 | NA | NA | 703 | NA | NA | 703 |
| 35.2 | 16.1 | 14 to 70 | 0 | 0.75 | 0.1 to 30 | 0 | 2 | 0 to 60 | 0 | |
| 10.1 | 2.9 | 5 to 16 | 13 | 0.3 | 0 to 5.9 | 32 | 3 | 1 to 104 | 12 | |
| 71.5 | 7.2 | 60 to 95 | 0 | NA | NA | 361 | 2 | 1 to 96 | 7 | |
| Total (missing) | 98 | 7820 | 2135 | |||||||
| Abbreviations: SD: Standard deviation aTrials designed in two strata based on whether recommended treatment would be CBZ or VPS. Within the two strata, participants were randomised to TPM in Privitera 2003/LEV in Trinka 2013 or CBZ/VPS depending on the strata. Data analysed according to the separate strata (CBZ branch or VPS branch) in this review. | ||||||||||
| Trial | Electroencephalographic (EEG) | Computerised Tomography (CT) /Magnetic Resonance Imaging (MRI) | Neurological exams | ||||||
| Normal | Abnormal | Missing | Normal | Abnormal | Missing | Normal | Abnormal | Missing | |
| 49 (45%) | 54 (50%) | 5 (5%) | 21 (19%) | 5 (5%) | 82 (76%) | 0 (0%) | 0 (0%) | 108 (100%) | |
| 0 (0%) | 0 (0%) | 583 (100%) | 0 (0%) | 0 (0%) | 583 (100%) | 478 (82%) | 103 (18%) | 2 (0%) | |
| 126 (44%) | 152 (53%) | 9 (3%) | 173 (60%) | 69 (24%) | 45 (16%) | 0 (0%) | 0 (0%) | 287 (100%) | |
| 0 (0%) | 0 (0%) | 136 (100%) | 0 (0%) | 0 (0%) | 136 (100%) | 89 (65%) | 46 (34%) | 1 (1%) | |
| 62 (46%) | 72 (53%) | 2 (1%) | 82 (60%) | 12 (9%) | 42 (31%) | 123 (90%) | 13 (10%) | 0 (0%) | |
| 76 (61%) | 42 (34%) | 6 (5%) | 72 (58%) | 20 (16%) | 32 (26%) | 108 (87%) | 16 (13%) | 0 (0%) | |
| 0 (0%) | 0 (0%) | 150 (100%) | 62 (41%) | 87 (58%) | 1 (1%) | 90 (60%) | 60 (40%) | 0 (0%) | |
| 0 (0%) | 0 (0%) | 579 (100%) | 0 (0%) | 0 (0%) | 579 (100%) | 493 (85%) | 86 (15%) | 0 (0%) | |
| 107 (37%) | 179 (61%) | 6 (2%) | 0 (0%) | 0 (0%) | 292 (100%) | 0 (0%) | 0 (0%) | 292 (100%) | |
| 28 (17%) | 74 (45%) | 64 (39%) | 0 (0%) | 0 (0%) | 166 (100%) | 0 (0%) | 0 (0%) | 166 (100%) | |
| 0 (0%) | 0 (0%) | 173 (100%) | 0 (0%) | 0 (0%) | 173 (100%) | 152 (88%) | 15 (9%) | 6 (3%) | |
| 18 (35%) | 34 (65%) | 0 (0%) | 50 (96%) | 2 (4%) | 0 (0%) | 0 (0%) | 0 (0%) | 52 (100%) | |
| 6 (7%) | 78 (93%) | 0 (0%) | 75 (89%) | 9 (11%) | 0 (0%) | 83 (99%) | 1 (1%) | 0 (0%) | |
| 92 (48%) | 99 (51%) | 2 (1%) | 126 (65%) | 12 (6%) | 55 (28%) | 0 (0%) | 0 (0%) | 193 (100%) | |
| 0 (0%) | 0 (0%) | 243 (100%) | 0 (0%) | 0 (0%) | 243 (100%) | 222 (91%) | 19 (8%) | 2 (1%) | |
| 0 (0%) | 0 (0%) | 81 (100%) | 0 (0%) | 0 (0%) | 81 (100%) | 0 (0%) | 0 (0%) | 81 (100%) | |
| 58 (53%) | 52 (47%) | 0 (0%) | 74 (67%) | 36 (33%) | 0 (0%) | 110 (100%) | 0 (0%) | 0 (0%) | |
| 126 (27%) | 343 (72%) | 6 (1%) | 308 (65%) | 119 (25%) | 48 (10%) | 0 (0%) | 0 (0%) | 475 (100%) | |
| 0 (0%) | 0 (0%) | 480 (100%) | 0 (0%) | 0 (0%) | 480 (100%) | 0 (0%) | 0 (0%) | 480 (100%) | |
| 0 (0%) | 0 (0%) | 622 (100%) | 0 (0%) | 0 (0%) | 622 (100%) | 0 (0%) | 0 (0%) | 622 (100%) | |
| 0 (0%) | 0 (0%) | 55 (100%) | 37 (67%) | 0 (0%) | 18 (33%) | 55 (100%) | 0 (0%) | 0 (0%) | |
| 0 (0%) | 0 (0%) | 94 (100%) | 0 (0%) | 0 (0%) | 94 (100%) | 24 (26%) | 70 (74%) | 0 (0%) | |
| 180 (94%) | 12 (6%) | 0 (0%) | 0 (0%) | 0 (0%) | 192 (100%) | 0 (0%) | 0 (0%) | 192 (100%) | |
| (CBZ branch)a | 0 (0%) | 0 (0%) | 395 (100%) | 0 (0%) | 0 (0%) | 395 (100%) | 0 (0%) | 0 (0%) | 395 (100%) |
| (VPS branch)a | 0 (0%) | 0 (0%) | 225 (100%) | 0 (0%) | 0 (0%) | 225 (100%) | 0 (0%) | 0 (0%) | 225 (100%) |
| 0 (0%) | 0 (0%) | 136 (100%) | 0 (0%) | 0 (0%) | 136 (100%) | 0 (0%) | 0 (0%) | 136 (100%) | |
| 0 (0%) | 0 (0%) | 261 (100%) | 0 (0%) | 0 (0%) | 261 (100%) | 0 (0%) | 0 (0%) | 261 (100%) | |
| 13 (4%) | 13 (4%) | 325 (93%) | 16 (5%) | 5 (1%) | 330 (94%) | 305 (87%) | 46 (13%) | 0 (0%) | |
| 0 (0%) | 0 (0%) | 300 (100%) | 0 (0%) | 0 (0%) | 300 (100%) | 0 (0%) | 0 (0%) | 300 (100%) | |
| 0 (0%) | 0 (0%) | 1721 (100%) | 0 (0%) | 0 (0%) | 1721 (100%) | 1267 (74%) | 410 (24%) | 44 (3%) | |
| 0 (0%) | 0 (0%) | 716 (100%) | 0 (0%) | 0 (0%) | 716 (100%) | 595 (83%) | 107 (15%) | 14 (2%) | |
| 103 (57%) | 71 (39%) | 7 (4%) | 111 (61%) | 33 (18%) | 37 (20%) | 165 (91%) | 16 (9%) | 0 (0%) | |
| 51 (22%) | 121 (53%) | 55 (24%) | 0 (0%) | 0 (0%) | 227 (100%) | 0 (0%) | 0 (0%) | 227 (100%) | |
| (CBZ branch)1 | 0 (0%) | 0 (0%) | 999 (100%) | 0 (0%) | 0 (0%) | 999 (100%) | 0 (0%) | 0 (0%) | 999 (100%) |
| (VPS branch)1 | 0 (0%) | 0 (0%) | 703 (100%) | 0 (0%) | 0 (0%) | 703 (100%) | 0 (0%) | 0 (0%) | 703 (100%) |
| 70 (50%) | 70 (50%) | 0 (0%) | 17 (12%) | 10 (7%) | 113 (81%) | 0 (0%) | 0 (0%) | 140 (100%) | |
| 0 (0%) | 0 (0%) | 260 (100%) | 0 (0%) | 0 (0%) | 260 (100%) | 0 (0%) | 0 (0%) | 260 (100%) | |
| 117 (32%) | 242 (67%) | 2 (1%) | 78 (22%) | 282 (78%) | 1 (0%) | 0 (0%) | 0 (0%) | 361 (100%) | |
| Total | 1282 (10%) | 1708 (14%) | 9401 (75%) | 1302 (11%) | 701 (6%) | 10,388 (83%) | 4359 (36%) | 1008 (8%) | 7024 (56%) |
| aTrials designed in two strata based on whether recommended treatment would be CBZ or VPS. Within the two strata, participants were randomised to TPM in Privitera 2003/LEV in Trinka 2013 or CBZ/VPS depending on the strata. Data analysed according to the separate strata (CBZ branch or VPS branch) in this review. | |||||||||
| Trial | Summary of resultsb |
| 1. MANOVA revealed no significant interaction effect of group and time 2. MANOVA revealed no significant interaction effect of group and time 3. MANOVA revealed no significant interaction effect of group and time 4. MANOVA revealed no significant interaction effect of group and time | |
| 1. CBZ: 64%, PHB: 63% 2. No statistically significant difference between groups 3. No statistically significant difference between groups 4. Mean seizure frequency: CBZ: 0.66, PHB: 0.8 5. Mean duration (seconds): CBZ: 12.63; PHB: 15 | |
| 1. Median time to exit: GBP: 69 days, LTG: 48 days HR: 1.043 (95% confidence interval 0.602 to 1.809) 2. Proportion of evaluable population completing the study – GBP: 71.6%, LTG: 67.1% No difference between groups for time to withdrawal for any reason 3. No difference between groups for time to first seizure 4. GBP: 76.1%, LTG: 76.8% (ITT population) 5. Withdrawals during titration: GBP: 7, LTG: 10 Withdrawals after titration: GBP: 10, LTG: 13 | |
| 1a. PHT: 67%; CBZ: 37%; VPS: 53% 2. PHT: 10%; CBZ: 8%; VPS:11% | |
| 1. CBZ: 76%, LEV: 76% 2. Proportion with AEs: CBZ: 65%, LEV: 50% 3. CBZ: 2 discontinuations due to failure to control seizures and interactions with other medications LEV: 3 discontinuations – 1 death from stroke and 2 due to AEs | |
| 1. No significant difference between groups 2. No significant difference between groups | |
| 1. No significant difference between groups 3. 2 children from PHB group, 1 child from CBZ group and no children from VPS group withdrew from the study because of allergic reactions 4. No significant difference between groups | |
| 1. Overall effect on sleep parameters was comparable between groups. LEV group PSG significant increase post treatment compared to baseline in sleep efficiency (P = 0.039) and in decrease of wake time after sleep onset (P = 0.047), no significant change in other sleep parameters. CBZ group post treatment compared to baseline significant increases in the percentage of slow wave sleep (P = 0.038), no significant change in other sleep parameters 2. No significant difference between baseline and post‐treatment between the 2 groups | |
| 1. OXC 56.6% ; VPS 53.8% 2. No significant difference between groups 3. OXC 40.6% ; VPS 33.9% 4. Efficacy no significant difference between groups Tolerability no significant difference between groups Therapeutic effect no significant difference between groups 5. Proportion of participants experiencing at least 1 AE regardless of relationship to trial drug OXC 89.8%; VPS 87.6% 6. Seizure frequency per week OXC (n = 106) mean 0.17 median 0, VPS (n = 106) mean 0.40, median 0 | |
| 1. No significant difference between groups 2. Completed study LEV 52/62, CBZ 54/66, withdrawals: 8 poor compliance (LEV 4, CBZ 4); 7 severe adverse effect (LEV 3, CBZ 4); 7 unknown cause (LEV 3, CBZ 4) 3. Attention deficit on digital span end of follow up greater in CBZ group than LEV (P = 0.03) Stroop test worse in CBZ than LEV (P = 0.02) No significant difference between groups for other scales. Impairment of activities of daily living greater CBZ than LEV (P = 0.05) 4. 4 participants (LEV 2, CBZ 2) had abnormal EEG at baseline, normal at end of treatment. Drug dose reduction (LEV 4, CBZ 2). Remaining participants unmodified versus baseline 5. No significant difference between groups | |
| 1. Significant decrease in visual‐verbal memory for CBZ and acoustic memory for PHB. No significant differences for other tests | |
| 1. PHB: 60%, PHT: 59%; CBZ: 62%; VPS: 64% | |
| 1. Baseline OXC mean 2.9 (SD 7.0), median 1, range 0‐60 CBZ mean 5.8 (SD 14.7) median 1, range 0‐99 Maintenance phases OXC mean 0.4 (SD 3.0) median 0, range 0‐27 CBZ mean 0.3 (SD 1.4) median 0, range 0‐12 2. Severe side effects CBZ 25, OXC 13, statistically significant difference favouring OXC (P = 0.04) Participants without any side effects CBZ 25, OXC 29 no significant difference between groups (P = 0.22) 3. Global efficacy no significant difference between groups (P = 0.77); global tolerability (P = 0.11) Participants very good/good CBZ 69 (73%), OXC 76 (84%) Participants poor/very poor CBZ 26 (27%), OXC 15 (16%) 4. Nature of side effects same between groups, included tiredness, headache, dizziness, ataxia. Participants withdrawn due to severe side effects CBZ 16, OXC 9 5. Clinically relevant changes observed in 2 participants only, both CBZ group, both stopped treatment | |
| 1. Comparison of cognitive results no significant difference between treatment groups (P = 0.195) No significant difference between treatment groups for secondary variables (psychomotor speed, alertness, memory and learning, attention, intelligence scores) 2. OXC 58%; CBZ 46%; VPS 54% 3. Most common (> 10% reported) side effects OXC fatigue and headache; CBZ fatigue and rash VPS headache, increased appetite, alopecia 4. Good/very good: OXC investigators 84%, participants 82%, parents/carers 86%; Combined CBZ/VPS investigators 77%, participants 73%, parents/carers 80% | |
| 1. Minor adverse effects reported in PHB: 58 participants (39%) reported 86 AEs, CBZ: 46 participants (30%) reported 68 AEs 2. All withdrawals: PHB: 18%, CBZ: 17% Withdrawals due to side‐effects: PHB: 5%, CBZ: 3% 3. Seizure‐free: PHB: 54%, CBZ: 52% > 50% reduction of seizures: PHB: 23%, CBZ: 29% 50% reduction‐50% increase in seizures: PHB: 15%, CBZ: 13% > 50% increase in seizures: PHB: 8%, CBZ: 6% | |
| 1. Significant difference favouring VPS test of speed of information processing No significant differences between treatment groups for any other cognitive tests 2. PHT: 30%; CBZ: 39%; VPS:33% | |
| 1. Seizure freedom: LTG: 38%, OXC: 44% < 50% seizure reduction: LTG: 48%, OXC: 55% 2. Both groups showed improvement in verbal learning and in 1/4 measures of attention. In addition, participants under OXC improved in word fluency. Improved mood was reported with OXC only. | |
| 1. Number of participants experiencing early seizures as first event: LTG 2/32, CBZ 3/32 Number of participants remaining seizure‐free in the follow‐up period: LTG 23/32 (72%), CBZ 14/32 (44%) P = 0.05 2. Incidence of side effects: LTG 2/32 (6.25%), CBZ 12/32 (37.5%) P = 0.05 3. Withdrawals from study due to side effects LTG 1/32 (3%), CBZ 10/32 (31%), P = 0.02 | |
| 1. No difference between groups in terms of social competence; school competence; internalising behaviour problems; externalising behaviour problems; total behaviour problems and anxiety. Significant decrease in depression in LEV group compared to CBZ group (P = 0.027) 2. LEV 95.7% , CBZ 97.1% , P = 0.686 3. LEV 66.7%, CBZ 57.8% , P = 0.317 4. LEV 33.3%, CBZ 46.9%. Number of AEs not significantly different between groups | |
| 1.CBZ: 53% LTG: 56% 2. No significant difference between groups in overall cognitive score. In terms of individual assessments, only Stroop test B showed a statistically significant advantage for LTG. | |
| 1. No significant difference between groups 2. No significant difference between groups | |
| 1. LTG: 65% CBZ: 70% 2. Total seizure‐free rate LTG: 62% CBZ: 63% Time to first seizure: mean (SD): weeks LTG: 10 (5.09), CBZ: 10.82 (6.44) | |
| 1. LTG: 54%, VPS: 55 %, no difference by seizure type 2. LTG: 69%, VPS:68 % | |
| 1. No significant differences between treatment groups 2. Compliance: trend towards better compliance in CBZ group (not significant) Randomised participants only: trend towards higher rate withdrawal from treatment in PHB group (not significant). More mild systemic side‐effects in CBZ group (significant). 3 children switched from CBZ to PHB and 1 from PHB to CB following adverse reactions 3. 6 months: excellent/good: PHB = 15, CBZ = 13 12 months: excellent/good: PHB = 13, CBZ = 9 | |
| 1. Partial seizures ‐ PHT: 32%; CBZ: 40%; VPS : 41% Generalised seizures ‐ PHT :35%; CBZ: 15%; VPS: 7% 1. Partial seizures ‐ PHT: 24%; CBZ: 24%; VPS : 25% Generalised seizures ‐ PHT :13%; CBZ: 0%; VPS: 0% | |
| 1. Seizure recurrence at 2 weeks ‐ LTG: 43% LEV: 35%, p=0.42 Seizure recurrence at 4 weeks ‐ LTG: 39% LEV: 33%, p=0.53 Seizure recurrence at 8 weeks ‐ LTG: 35% LEV: 28%, p=0.50 Seizure recurrence at 12 weeks ‐ LTG: 33% LEV: 24%, p=0.35 Seizure recurrence at 20 weeks ‐ LTG: 31% LEV: 13%, p=0.03 2. No significant difference between groups 3. Proportion with AEs ‐ LTG: 53%, LEV: 67% | |
| 1. LEV: 12.7%, OXC: 23.4% 2. Median months: LEV: 7.6, OXC: NA (fewer than 50% of participants in the OXC group had seizure recurrence) 3. LEV: 53.8%, OXC: 58.5% 4. LEV: 34.7%, OXC: 40.9% | |
| 1. LEV: 47.3%, CBZ: 68.4% 2. LEV: 48.4%, CBZ: 70.2% 3. Number of events: LEV: 88, CBZ: 45 4. Number of events: LEV: 87, CBZ: 39 5. Number of events: LEV: 97, CBZ: 57 | |
| 1. Compared to CBZ, participants on PHT became slower (motor speed of the hand) and their visual memory decreased. There was an equal decrease in negative mood (helplessness, irritability, depression) on PHT and CBZ 2. 3 participants taking PHT complained of tiredness, and 1 participant taking CBZ complained of facial skin problems, another tiredness and memory problems | |
| 1. Incidence of major side effects (proportion of analysed participants): PHT 23%; CBZ: 23% Minor side effects: cognitive impairment and sedation twice as likely on CBZ compared to PHT. Other minor side effects similar between groups. 2. Treatment failures among analysed participants: Seizure control (among analysed participants with no major side effects): PHT: 86%; CBZ: 82% 3. Significantly lower mean LDH level at 24 weeks in CBZ participants than PHT participants. Other laboratory results similar across treatment groups | |
| 1. 8 discontinuations; due to generalised rash (n = 1), excessive tiredness (n = 1), withdrew consent (n = 2), renal transplant (n = 1), lost to follow‐up (n = 2), died (n = 1) 2. 6 participants reported treatment‐emergent side effects. 3. No participants withdrew due to lack of seizure control | |
| 1(a). PHT: 51%, VPS: 49% 1(b). PHT : 24%, VPS: 35% 1(c). PHT: 18%, VPS: 10% 1(d). PHT: 2%, VPS: 6% 2. All reported AEs were minor and similar rates between groups | |
| 1. No significant differences between any tests of cognitive function taken before treatment and after 10‐12 weeks for both treatment groups | |
| 1. Six months of seizure freedom: CBZ: 81%, TPM: 91% 50% reduction of seizures: CBZ: 84% TPM: 97% The average number of seizures was significantly less in the TPM group compared to the CBZ group at 6 and 9 months 2. AEs were mild and similar between groups 3. No significant differences between groups | |
| 1. Significant difference between 3 treatment groups (P = 0.00022) CBZ more early terminators than GBP (P = 0.008) or LTG (P < 0.0001) 2. LTG 51.4%, GBP 47.4%, CBZ 64.3% no significant difference between groups P = 0.09 3. No difference between groups for time to first, second, fifth and tenth seizure (P values = 0.18, 0.13, 0.74, 0.95 respectively) 4. More systemic toxicities on GBP than CBZ or LTG No significant differences in neuro‐toxicities between treatment groups over 12 months 5. Mean serum levels: 6 weeks GBP 8.67 ± 4.83; µg/mL, CBZ 6.79 ± 2.92 µg/mL and LTG 2.87 ± 1.60 µg/mL 52 weeks GBP 8.54 ± 5.57 µg/mL, CBZ 6.48 ± 3.72 µg/mL and LTG 3.46 ± 1.68 µg/mL Overall medical compliance 89% without significant group differences 6. 3 months LTG 49.7%, GBP 43.3%, CBZ 36.0% significant difference between groups P = 0.02 6 months LTG 37.2%, GBP 33.0%, CBZ 28.9% no significant difference between groups P = 0.22 12 months LTG 28.6%, GBP 23.2%, CBZ 22.8% no significant difference between groups P = 0.33 | |
| 1. LTG 68 (73%), CBZ 61 (67%), no significant difference between groups 2. LTG 59 (63%), CBZ 69 (76%), not significant difference P = 0.068 ITT analysis 3. LTG 71 (76%), CBZ 81 (89%), significant difference, P = 0.0234 ITT analysis 4.Hazard ratio (lamotrigine/carbamazepine) 1.50, 95% CI 0.94–2.40, p value 0.092 5. During treatment period LTG 82 (88%) reported 378 AEs, CBZ 79 (86%) reported 310 AEs. No significant differences between groups for any AEs except for immune system Withdrew due to AE LTG 13 (14%), CBZ 23 (25%), P = 0.078 6. No difference between groups even when changes over time corrected for age, gender and baseline score | |
| 1. PHT: 33%; VPS: 39% 2. All reported AEs were minor and similar rates between groups | |
| 1. VPS 7/11 (64%), CBZ 9/14 (64%) 2. At least one AE reported VPS 15/16 (94%), CBZ 16/17 (94%) | |
| 1. FE CBZ group 83/88 (94.3%), LTG group 78/88 (88.6%) no significant difference between groups GE VPS group 25/30 (83.3%) LTG group 20/33 (60.6%) no significant difference between groups 2. FE CBZ group 81%, LTG group 91%, not a significant difference between groups GE VPS group 97%, LTG group 88%, not stated as significant or non‐significant difference 3. At least 1 AE FE CBZ 81 participants (91%), LTG 68 participants (77.3%) GE VPS 25 participants (83.3%), LTG 24 participants (72.7%) Serious AEs FE CBZ 8 participants (9%), LTG 6 participants (7%) GE VPS 1 participant (3%), LTG 5 participants (15%) AEs considered related to study drug FE CBZ 65 participants (74%), LTG 38 participants (43%) GE VPS 16 participants (53%), LTG 15 participants (45.5%) | |
| 1. Mean quality‐of‐life score at baseline CBZ group 31.14 ± 1.83, LEV group 29.76 ± 1.71 (P value = 0.5861) Mean quality of life score after 26 weeks of treatment CBZ group 58.41 ± 1.89, LEV 64.58 ± 2.02 (P value = 0.0302) 2.28 participants in CBZ group, 28 in LEV group Seizure freedom 4 weeks CBZ group 85.72%, LEV group 85.72% (P value = 1); 12 weeks CBZ group 89.29%, LEV group 93.34% (P value = 0.4595); 26 weeks CBZ group 96.43%, LEV group 100% (P value = 0.1212); 6 months CBZ group 71.42% (20 participants), LEV group 78.57% (22 participants) (P value = 0.2529) 3. Participants experiencing at least 1 AE, CBZ group 36.66%, LEV group 40% (P value = 0.77) | |
| 1. PHB: 31%, PHT: 27%, VPS: 21% 2. PHB: 33%, PHT: 63%, VPS: 31% | |
| AE: adverse event; CBZ: carbamazepine; EEG: electroencephalogram; FE: focal epilepsies; GBP: gabapentin; GE: generalised epilepsies; ITT: intention to treat; LDH: lactic acid dehydrogenase; LEV: levetiracetam; LTG: lamotrigine; MANOVA: repeated measures analysis of variance; OXC: oxcarbazepine; PHB: phenobarbitone; PHT: phenytoin; SD: standard deviation; TPM: topiramate; VPS: sodium valproate; ZNS: zonisamide aFor further details of adverse events see Table 16 and Table 17. | |
| Trial | Time to withdrawal from allocated treatmentc | Time to first seizure | Time to 12‐month remissiond | Time to six‐month remissiond | ||||||||||||
| Cens | Event | Total | Missing | Cens | Event | Total | Missing | Cens | Event | Total | Missing | Cens | Event | Total | Missing | |
| 0 | 0 | 0 | 108 | 39 | 69 | 108 | 0 | 0 | 0 | 0 | 108 | 0 | 0 | 0 | 108 | |
| 392 | 191 | 583 | 0 | 388 | 186 | 574 | 9 | 251 | 323 | 574 | 9 | 194 | 380 | 574 | 9 | |
| 232 | 55 | 287 | 0 | 137 | 145 | 282 | 5 | 190 | 92 | 282 | 5 | 136 | 146 | 282 | 5 | |
| 99 | 36 | 135 | 1 | 64 | 71 | 135 | 1 | 0 | 0 | 0 | 136 | 90 | 45 | 135 | 1 | |
| 78 | 58 | 136 | 0 | 69 | 67 | 136 | 0 | 0 | 0 | 0 | 136 | 122 | 14 | 136 | 0 | |
| 79 | 45 | 124 | 0 | 52 | 72 | 124 | 0 | 0 | 0 | 0 | 124 | 96 | 28 | 124 | 0 | |
| 95 | 55 | 150 | 0 | 70 | 80 | 150 | 0 | 0 | 0 | 0 | 150 | 106 | 44 | 150 | 0 | |
| 323 | 256 | 579 | 0 | 350 | 229 | 579 | 0 | 260 | 319 | 579 | 0 | 177 | 402 | 579 | 0 | |
| 69 | 223 | 292 | 0 | 102 | 190 | 292 | 0 | 0 | 0 | 0 | 292 | 193 | 99 | 292 | 0 | |
| 0 | 0 | 0 | 166 | 68 | 81 | 149 | 17 | 117 | 30 | 147 | 19 | 58 | 89 | 147 | 19 | |
| 100 | 67 | 167 | 6 | 18 | 149 | 167 | 6 | 22 | 145 | 167 | 6 | 19 | 148 | 167 | 6 | |
| 44 | 8 | 52 | 0 | 40 | 12 | 52 | 0 | 11 | 41 | 52 | 0 | 8 | 44 | 52 | 0 | |
| 75 | 9 | 84 | 0 | 52 | 32 | 84 | 0 | 0 | 0 | 0 | 84 | 35 | 49 | 84 | 0 | |
| 151 | 42 | 193 | 0 | 106 | 84 | 190 | 3 | 112 | 78 | 190 | 3 | 84 | 106 | 190 | 3 | |
| 166 | 77 | 243 | 0 | 66 | 177 | 243 | 0 | 78 | 165 | 243 | 0 | 49 | 194 | 243 | 0 | |
| 60 | 21 | 81 | 0 | 38 | 29 | 67 | 14 | 68 | 13 | 81 | 0 | 30 | 50 | 80 | 1 | |
| 73 | 37 | 110 | 0 | 79 | 31 | 110 | 0 | 0 | 0 | 0 | 110 | 39 | 71 | 110 | 0 | |
| 267 | 208 | 475 | 0 | 226 | 238 | 464 | 11 | 325 | 149 | 474 | 1 | 281 | 193 | 474 | 1 | |
| 308 | 172 | 480 | 0 | 165 | 303 | 468 | 12 | 334 | 133 | 467 | 13 | 242 | 225 | 467 | 13 | |
| 511 | 111 | 622 | 0 | 310 | 312 | 622 | 0 | 0 | 0 | 0 | 622 | 431 | 191 | 622 | 0 | |
| 0 | 0 | 0 | 55 | 29 | 26 | 55 | 0 | 0 | 0 | 0 | 55 | 0 | 0 | 0 | 55 | |
| 0 | 0 | 0 | 94 | 41 | 49 | 90 | 4 | 82 | 8 | 90 | 4 | 63 | 27 | 90 | 4 | |
| 158 | 32 | 190 | 2 | 121 | 71 | 192 | 0 | 132 | 60 | 192 | 0 | 69 | 123 | 192 | 0 | |
| (CBZ branch)b | 221 | 174 | 395 | 0 | 208 | 187 | 395 | 0 | 316 | 79 | 395 | 0 | 194 | 201 | 395 | 0 |
| (VPS branch)b | 111 | 114 | 225 | 0 | 119 | 106 | 225 | 0 | 180 | 45 | 225 | 0 | 106 | 119 | 225 | 0 |
| 113 | 23 | 136 | 0 | 81 | 44 | 125 | 11 | 0 | 0 | 0 | 136 | 78 | 47 | 125 | 11 | |
| 192 | 69 | 261 | 0 | 197 | 64 | 261 | 0 | 0 | 0 | 0 | 261 | 0 | 0 | 0 | 261 | |
| 288 | 63 | 351 | 0 | 216 | 135 | 351 | 0 | 0 | 0 | 0 | 351 | 328 | 23 | 351 | 0 | |
| 210 | 76 | 286 | 14 | 91 | 199 | 290 | 10 | 92 | 198 | 290 | 10 | 77 | 213 | 290 | 10 | |
| 857 | 815 | 1672 | 49 | 383 | 1261 | 1644 | 77 | 577 | 1067 | 1644 | 77 | 355 | 1326 | 1681 | 40 | |
| 400 | 299 | 699 | 17 | 182 | 511 | 693 | 23 | 167 | 526 | 693 | 23 | 96 | 610 | 706 | 10 | |
| 108 | 73 | 181 | 0 | 100 | 81 | 181 | 0 | 0 | 0 | 0 | 181 | 157 | 24 | 181 | 0 | |
| 160 | 67 | 227 | 0 | 81 | 140 | 221 | 6 | 172 | 55 | 227 | 0 | 137 | 90 | 227 | 0 | |
| (CBZ branch)b | 760 | 239 | 999 | 0 | 572 | 427 | 999 | 0 | 780 | 219 | 999 | 0 | 336 | 663 | 999 | 0 |
| (VPS branch)b | 583 | 120 | 703 | 0 | 456 | 247 | 703 | 0 | 484 | 219 | 703 | 0 | 191 | 512 | 703 | 0 |
| 91 | 49 | 140 | 0 | 75 | 65 | 140 | 0 | 47 | 93 | 140 | 0 | 36 | 104 | 140 | 0 | |
| 187 | 59 | 246 | 14 | 59 | 187 | 246 | 14 | 84 | 162 | 246 | 14 | 19 | 227 | 246 | 14 | |
| 195 | 166 | 361 | 0 | 249 | 96 | 345 | 16 | 211 | 150 | 361 | 0 | 178 | 183 | 361 | 0 | |
| Total | 7756 | 4109 | 11,865 | 526 | 5699 | 6453 | 12,152 | 239 | 5092 | 4369 | 9461 | 2930 | 4810 | 7010 | 11,820 | 571 |
| Abbreviation: cens = censored aFor two studies we could only calculate 'Time to first seizure'; the study duration of Ogunrin 2005 was 12 weeks, and all randomised participants completed the study without withdrawing; and Banu 2007 did not record the dates of all seizures after randomisation and dates of withdrawal for allocated treatment for all participants. | ||||||||||||||||
| Reason for withdrawal | Classification for analysis | Randomised drug4b | ||||||||||
| CBZ | PHB | PHT | VPS | LTG | OXC | TPM | GBP | LEV | ZNS | Total | ||
| Adverse events | Event | 505 (45%) | 24 (20%) | 93 (35%) | 132 (28%) | 235 (41%) | 56 (41%) | 259 (48%) | 73 (20%) | 134 (39%) | 31 (32%) | 1542 (38%) |
| Inadequate response | Event | 232 (20%) | 20 (16%) | 46 (17%) | 140 (29%) | 144 (26%) | 36 (26%) | 148 (27%) | 223 (62%) | 89 (26%) | 23 (24%) | 1101 (27%) |
| Both adverse events and inadequate response | Event | 148 (13%) | 51 (41%) | 54 (20%) | 107 (22%) | 32 (6%) | 11 (8%) | 46 (8%) | 32 (9%) | 0 (0%) | 0 (0%) | 481 (12%) |
| Protocol violation/non compliance | Event | 102 (9%) | 15 (12%) | 41 (15%) | 11 (2%) | 68 (12%) | 27 (20%) | 0 (0%) | 21 (6%) | 21 (6%) | 3 (3%) | 309 (8%) |
| Withdrew consent | Event | 121 (11%) | 13 (11%) | 25 (9%) | 64 (13%) | 65 (11%) | 2 (1%) | 55 (10%) | 4 (1%) | 68 (20%) | 35 (36%) | 452 (11%) |
| Othera | Event | 29 (3%) | 0 (0%) | 7 (3%) | 24 (5%) | 26 (5%) | 5 (4%) | 37 (7%) | 9 (2%) | 32 (9%) | 4 (4%) | 173 (4%) |
| Total eventsb | 1137 (35%) | 123 (38%) | 266 (31%) | 478 (28%) | 570 (29%) | 137 (29%) | 545 (47%) | 362 (61%) | 344 (27%) | 96 (34%) | 4058 (34%) | |
| Illness or death | Censored | 34 (2%) | 10 (5%) | 17 (3%) | 7 (1%) | 20 (1%) | 1 (0%) | 10 (2%) | 9 (4%) | 0 (0%) | 0 (0%) | 108 (1%) |
| Remission of seizures | Censored | 49 (2%) | 4 (2%) | 38 (6%) | 75 (6%) | 40 (3%) | 12 (4%) | 44 (7%) | 21 (9%) | 0 (0%) | 0 (0%) | 283 (4%) |
| Lost to follow‐up | Censored | 81 (4%) | 31 (16%) | 51 (9%) | 63 (5%) | 33 (3%) | 24 (7%) | 18 (3%) | 0 (0%) | 41 (5%) | 0 (0%) | 342 (4%) |
| Otherc | Censored | 104 (5%) | 6 (3%) | 22 (4%) | 82 (7%) | 31 (2%) | 5 (2%) | 26 (4%) | 26 (12%) | 0 (0%) | 25 (13%) | 327 (4%) |
| Completed study | Censored | 1829 (87%) | 139 (73%) | 468 (79%) | 949 (81%) | 1272 (91%) | 291 (87%) | 501 (84%) | 166 (75%) | 868 (95%) | 161 (87%) | 6644 (86%) |
| Total censoredb | 2097 (65%) | 190 (62%) | 596 (69%) | 1176 (72%) | 1396 (71%) | 333 (71%) | 599 (53%) | 222 (39%) | 909 (73%) | 186 (66%) | 7704 (66%) | |
| Missingd | 24 | 7 | 1 | 26 | 12 | 8 | 14 | 11 | 0 | 0 | 103 | |
| Totale | 3258 | 320 | 863 | 1680 | 1978 | 478 | 1158 | 595 | 1253 | 282 | 11,865 | |
| CBZ: carbamazepine; GBP: gabapentin; LEV: levetiracetam; LTG: lamotrigine; OXC: oxcarbazepine; PHB: phenobarbitone; PHT: phenytoin; TPM: topiramate; VPS: sodium valproate; ZNS: zonisamide aOther treatment‐related reasons included: physician's decision, drug‐related death, pregnancy or perceived remission, or non specific (drug‐related) reason. | ||||||||||||
| Comparisiona | Direct evidence (pairwise meta‐analysis) | Direct plus indirect evidence | ||||
| Number of | Number of | HR (95% CI)b,c | I² statisticd | Direct evidence (%)e | HR (95% CI)b,c | |
| CBZ vs PHB | 4 | 520 | 1.57 (1.16 to 2.13) | 0% | 52.5% | 1.55 (1.18 to 2.04) |
| CBZ vs PHT | 3 | 428 | 1.03 (0.74 to 1.42) | 63.6% | 12.8% | 1.13 (0.92 to 1.38) |
| CBZ vs VPS | 5 | 814 | 0.94 (0.73 to 1.19) | 0% | 40.1% | 1.04 (0.86 to 1.25) |
| CBZ vs LTG | 9 | 2268 | 0.76 (0.61 to 0.95) | 39.3% | 28.9% | 0.75 (0.65 to 0.86) |
| CBZ vs OXC | 2 | 562 | 4.62 (0.95 to 22.4) | 0% | 5.7% | 1.09 (0.84 to 1.42) |
| CBZ vs TPM | 2 | 937 | 1.04 (0.52 to 2.07) | 0% | 7.4% | 1.18 (0.98 to 1.43) |
| CBZ vs GBP | 2 | 954 | 1.14 (0.84 to 1.55) | 0% | 87.1% | 1.20 (1.00 to 1.43) |
| CBZ vs LEV | 3 | 1567 | 0.70 (0.52 to 0.94) | 0% | 37.9% | 0.82 (0.69 to 0.97) |
| CBZ vs ZNS | 1 | 583 | 1.08 (0.81 to 1.44) | NA | 100% | 1.08 (0.79 to 1.48) |
| PHB vs PHT | 3 | 404 | 0.67 (0.50 to 0.91) | 65% | 15.2% | 0.73 (0.55 to 0.96) |
| PHB vs VPS | 2 | 75 | 0.68 (0.34 to 1.36) | 23% | 8.8% | 0.67 (0.48 to 0.92) |
| PHB vs LTG | No direct evidence | 0% | 0.48 (0.35 to 0.66) | |||
| PHB vs OXC | No direct evidence | 0% | 0.70 (0.48 to 1.03) | |||
| PHB vs TPM | No direct evidence | 0% | 0.76 (0.55 to 1.06) | |||
| PHB vs GBP | No direct evidence | 0% | 0.77 (0.55 to 1.07) | |||
| PHB vs LEV | No direct evidence | 0% | 0.53 (0.38 to 0.73) | |||
| PHB vs ZNS | No direct evidence | 0% | 0.70 (0.46 to 1.06) | |||
| PHT vs VPS | 4 | 168 | 1.00 (0.60 to 1.64) | 58.5% | 9% | 0.92 (0.70 to 1.21) |
| PHT vs LTG | 1 | 90 | 1.10 (0.57 to 2.14) | NA | 11.6% | 0.66 (0.52 to 0.85) |
| PHT vs OXC | 2 | 325 | 0.65 (0.32 to 1.32) | 0% | 40.4% | 0.97 (0.69 to 1.35) |
| PHT vs TPM | 1 | 53 | 0.77 (0.38 to 1.57) | NA | 10.9% | 1.05 (0.80 to 1.39) |
| PHT vs GBP | No direct evidence | 0% | 1.06 (0.81 to 1.40) | |||
| PHT vs LEV | No direct evidence | 0% | 0.73 (0.56 to 0.95) | |||
| PHT vs ZNS | No direct evidence | 0% | 0.96 (0.66 to 1.39) | |||
| VPS vs LTG* | 3 | 221 | 1.40 (1.00 to 1.96) | 45.1% | 5.1% | 0.72 (0.58 to 0.90) |
| VPS vs OXC | No direct evidence | 0% | 1.05 (0.76 to 1.44) | |||
| VPS vs TPM | 2 | 111 | 1.66 (1.24 to 2.23) | 48.1% | 33.7% | 1.14 (0.88 to 1.48) |
| VPS vs GBP | No direct evidence | 0% | 1.15 (0.89 to 1.49) | |||
| VPS vs LEV | 1 | 190 | 1.14 (0.73 to 1.75) | NA | 17.2% | 0.79 (0.61 to 1.03) |
| VPS vs ZNS | No direct evidence | 0% | 1.04 (0.73 to 1.50) | |||
| LTG vs OXC | 1 | 506 | 0.69 (0.12 to 4.14) | NA | 4.4% | 1.46 (1.11 to 1.92) |
| LTG vs TPM | 1 | 648 | 1.18 (0.86 to 1.62) | NA | 20.9% | 1.59 (1.29 to 1.95) |
| LTG vs GBP | 1 | 659 | 0.62 (0.06 to 6.01) | NA | 1% | 1.60 (1.31 to 1.96) |
| LTG vs LEV | 1 | 240 | 0.86 (0.58 to 1.28) | NA | 23.7% | 1.10 (0.89 to 1.35) |
| LTG vs ZNS | No direct evidence | 0% | 1.45 (1.03 to 2.04) | |||
| OXC vs TPM | 1 | 496 | 0.87 (0.16 to 4.73) | NA | 4.9% | 1.09 (0.82 to 1.44) |
| OXC vs GBP | 1 | 507 | 0.90 (0.08 to 9.96) | NA | 2.3% | 1.10 (0.83 to 1.45) |
| OXC vs LEV | No direct evidence | 0% | 0.75 (0.55 to 1.03) | |||
| OXC vs ZNS | No direct evidence | 0% | 0.99 (0.66 to 1.49) | |||
| TPM vs GBP | 1 | 649 | 1.04 (0.12 to 9.33) | NA | 1.1% | 1.01 (0.82 to 1.25) |
| TPM vs LEV | No direct evidence | 0% | 0.69 (0.54 to 0.89) | |||
| TPM vs ZNS | No direct evidence | 0% | 0.91 (0.64 to 1.31) | |||
| GBP vs LEV | No direct evidence | 0% | 0.69 (0.54 to 0.88) | |||
| GBP vs ZNS | No direct evidence | 0% | 0.90 (0.63 to 1.30) | |||
| LEV vs ZNS | No direct evidence | 0% | 1.32 (0.93 to 1.88) | |||
| CBZ: carbamazepine; CI: confidence interval; GBP: gabapentin; HR: hazard ratio; LEV: levetiracetam; LTG: lamotrigine; OXC: oxcarbazepine; PHB: phenobarbitone; PHT: phenytoin; TPM: topiramate; VPS: sodium valproate; ZNS: zonisamide aOrder of drugs in the table: most commonly used drug first (carbamazepine), then drugs are ordered approximately by the date they were licenced as a monotherapy treatment (oldest first). For comparisons marked with a *, confidence intervals of direct evidence and network meta‐analysis do not overlap indicating that inconsistency may be present in the results. | ||||||
| Comparisiona | Direct evidence (pairwise meta‐analysis) | Direct plus indirect evidence | ||||
| Number of | Number of | HR (95% CI)b,c | I² statisticd | Direct | HR (95% CI)b,c | |
| CBZ vs PHB | 3 | 156 | 1.21 (0.51 to 2.86) | 11.8% | 27.3% | 1.47 (0.83 to 2.61) |
| CBZ vs PHT | 2 | 118 | 2.68 (0.95 to 7.57) | 0% | 11.3% | 0.92 (0.59 to 1.42) |
| CBZ vs VPS | 4 | 405 | 1.26 (0.73 to 2.20) | 6.6% | 27.3% | 0.70 (0.54 to 0.92) |
| CBZ vs LTG | 7 | 302 | 1.23 (0.72 to 2.10) | 0% | 39.2% | 0.63 (0.45 to 0.89) |
| CBZ vs OXC | 1 | 9 | 0.39 (0.03 to 4.35) | NA | 3.9% | 1.00 (0.21 to 4.81) |
| CBZ vs TPM | 2 | 101 | 1.10 (0.51 to 2.36) | 0% | 23.2% | 1.24 (0.90 to 1.71) |
| CBZ vs GBP | 1 | 6 | 0.49 (0.03 to 7.90) | NA | 8.5% | 0.90 (0.11 to 7.29) |
| CBZ vs LEV | 2 | 251 | 1.22 (0.74 to 2.02) | 0% | 57% | 0.74 (0.44 to 1.23) |
| PHB vs PHT | 2 | 95 | 1.56 (0.49 to 4.99) | 0% | 16.1% | 0.62 (0.32 to 1.24) |
| PHB vs VPS | 2 | 94 | 0.56 (0.20 to 1.54) | 0% | 19.4% | 0.48 (0.27 to 0.86) |
| PHB vs LTG | No direct evidence | 0% | 0.43 (0.22 to 0.83) | |||
| PHB vs OXC | No direct evidence | 0% | 0.68 (0.13 to 3.60) | |||
| PHB vs TPM | No direct evidence | 0% | 0.84 (0.44 to 1.60) | |||
| PHB vs GBP | No direct evidence | 0% | 0.61 (0.07 to 5.34) | |||
| PHB vs LEV | No direct evidence | 0% | 0.50 (0.23 to 1.09) | |||
| PHT vs VPS | 3 | 326 | 0.66 (0.30 to 1.45) | 22.6% | 19.3% | 0.77 (0.46 to 1.27) |
| PHT vs LTG | 1 | 91 | 1.11 (0.42 to 2.94) | NA | 14.9% | 0.69 (0.39 to 1.20) |
| PHT vs OXC | 2 | 155 | 1.05 (0.44 to 2.52) | 0% | 37.9% | 1.09 (0.21 to 5.56) |
| PHT vs TPM | 1 | 150 | 1.68 (0.49 to 5.69) | NA | 11.2% | 1.35 (0.79 to 2.30) |
| PHT vs GBP | No direct evidence | 0% | 0.98 (0.12 to 8.30) | |||
| PHT vs LEV | No direct evidence | 0% | 0.80 (0.42 to 1.55) | |||
| VPS vs LTG | 3 | 387 | 0.46 (0.22 to 0.97) | 0% | 14.8% | 0.90 (0.60 to 1.35) |
| VPS vs OXC | No direct evidence | 0% | 1.42 (0.29 to 6.92) | |||
| VPS vs TPM* | 2 | 443 | 0.53 (0.27 to 1.07) | 48.5% | 22.4% | 1.76 (1.22 to 2.53) |
| VPS vs GBP | No direct evidence | 0% | 1.28 (0.16 to 10.5) | |||
| VPS vs LEV | 1 | 512 | 0.68 (0.30 to 1.59) | NA | 18.6% | 1.05 (0.58 to 1.90) |
| LTG vs OXC | 1 | 10 | 2.09 (0.34 to 12.8) | NA | 7.6% | 1.58 (0.33 to 7.67) |
| LTG vs TPM | 1 | 14 | 1.10 (0.42 to 2.89) | NA | 7.3% | 1.96 (1.25 to 3.08) |
| LTG vs GBP | 1 | 7 | 2.63 (0.27 to 25.7) | NA | 13.8% | 1.42 (0.17 to 11.6) |
| LTG vs LEV | No direct evidence | 0% | 1.17 (0.63 to 2.19) | |||
| OXC vs TPM | 1 | 14 | 1.31 (0.24 to 7.32) | NA | 9% | 1.24 (0.26 to 5.94) |
| OXC vs GBP | 1 | 7 | 1.26 (0.11 to 14.1) | NA | 12.7% | 0.90 (0.08 to 9.96) |
| OXC vs LEV | No direct evidence | 0% | 0.74 (0.14 to 3.86) | |||
| TPM vs GBP | 1 | 11 | 0.96 (0.11 to 8.67) | NA | 14.6% | 0.73 (0.09 to 5.89) |
| TPM vs LEV | No direct evidence | 0% | 0.60 (0.33 to 1.09) | |||
| GBP vs LEV | No direct evidence | 0% | 0.82 (0.10 to 7.10) | |||
| CBZ: carbamazepine; CI: confidence interval; GBP: gabapentin; HR: hazard ratio; LEV: levetiracetam; LTG: lamotrigine; OXC: oxcarbazepine; PHB: phenobarbitone; PHT: phenytoin; TPM: topiramate; VPS: sodium valproate; ZNS: zonisamide Generalised tonic‐clonic seizures with or without other seizure types is shortened to 'Generalised seizures' for brevity aOrder of drugs in the table: most commonly used drug first (carbamazepine), then drugs are ordered approximately by the date they were licenced as a monotherapy treatment (oldest first). For comparisons marked with a *, confidence intervals of direct evidence and network meta‐analysis do not overlap indicating that inconsistency may be present in the results | ||||||
| Comparisiona | Direct evidence (pairwise meta‐analysis) | Direct plus indirect evidence | ||||
| Number of | Number of | HR (95% CI)b,c | I² statisticd | Direct | HR (95% CI)b,c | |
| CBZ vs PHB | 4 | 525 | 1.41 (1.04 to 1.91) | 0% | 56.1% | 1.02 (0.76 to 1.35) |
| CBZ vs PHT | 3 | 430 | 1.00 (0.76 to 1.32) | 54.8% | 18.6% | 1.03 (0.85 to 1.25) |
| CBZ vs VPS | 5 | 816 | 1.03 (0.85 to 1.25) | 46.4% | 27.6% | 1.05 (0.89 to 1.25) |
| CBZ vs LTG | 2 | 891 | 1.02 (0.69 to 1.50) | 0% | 17.5% | 1.16 (0.98 to 1.37) |
| CBZ vs OXC | 2 | 555 | 1.13 (0.62 to 2.05) | 0% | 21% | 0.98 (0.78 to 1.25) |
| CBZ vs TPM | 2 | 925 | 0.94 (0.48 to 1.83) | 0% | 7.2% | 1.08 (0.92 to 1.27) |
| CBZ vs GBP | 1 | 651 | 0.61 (0.06 to 5.82) | NA | 10.5% | 1.20 (0.99 to 1.47) |
| CBZ vs LEV | 3 | 1567 | 1.08 (0.81 to 1.42) | 60.8% | 14.2% | 1.35 (1.09 to 1.69) |
| CBZ vs ZNS | 1 | 582 | 1.05 (0.85 to 1.30) | NA | 100% | 1.05 (0.81 to 1.35) |
| PHB vs PHT | 4 | 465 | 0.80 (0.59 to 1.10) | 0% | 0.2% | 1.01 (0.75 to 1.37) |
| PHB vs VPS | 2 | 80 | 0.85 (0.51 to 1.40) | 4.4% | 15.6% | 1.04 (0.75 to 1.43) |
| PHB vs LTG | No direct evidence | 0% | 1.14 (0.82 to 1.59) | |||
| PHB vs OXC | No direct evidence | 0% | 0.96 (0.67 to 1.41) | |||
| PHB vs TPM | No direct evidence | 0% | 1.06 (0.76 to 1.47) | |||
| PHB vs GBP | No direct evidence | 0% | 1.19 (0.83 to 1.69) | |||
| PHB vs LEV | No direct evidence | 0% | 1.33 (0.93 to 1.92) | |||
| PHB vs ZNS | No direct evidence | 0% | 1.03 (0.70 to 1.52) | |||
| PHT vs VPS | 4 | 245 | 1.04 (0.78 to 1.40) | 0% | 41.6% | 1.03 (0.80 to 1.32) |
| PHT vs LTG | No direct evidence | 0% | 1.12 (0.88 to 1.45) | |||
| PHT vs OXC | 2 | 318 | 1.21 (0.73 to 2.03) | 0% | 29.9% | 0.95 (0.70 to 1.30) |
| PHT vs TPM | No direct evidence | 0% | 1.05 (0.81 to 1.35) | |||
| PHT vs GBP | No direct evidence | 0% | 1.18 (0.88 to 1.56) | |||
| PHT vs LEV | No direct evidence | 0% | 1.32 (0.98 to 1.75) | |||
| PHT vs ZNS | No direct evidence | 0% | 1.02 (0.74 to 1.41) | |||
| VPS vs LTG | 3 | 221 | 1.37 (1.07 to 1.77) | 0% | 39.9% | 1.10 (0.88 to 1.37) |
| VPS vs OXC | No direct evidence | 0% | 0.93 (0.70 to 1.23) | |||
| VPS vs TPM | 2 | 111 | 1.11 (0.87 to 1.40) | 0% | 67.8% | 1.02 (0.80 to 1.30) |
| VPS vs GBP | No direct evidence | 0% | 1.14 (0.88 to 1.47) | |||
| VPS vs LEV | 1 | 190 | 1.14 (0.84 to 1.55) | NA | 34.7% | 1.28 (0.97 to 1.67) |
| VPS vs ZNS | No direct evidence | 0% | 0.99 (0.74 to 1.35) | |||
| LTG vs OXC | 1 | 499 | 1.49 (0.33 to 6.67) | NA | 2.8% | 0.85 (0.66 to 1.09) |
| LTG vs TPM | 1 | 636 | 0.98 (0.29 to 3.25) | NA | 2.5% | 0.93 (0.75 to 1.15) |
| LTG vs GBP | 1 | 647 | 0.74 (0.08 to 6.58) | NA | 10.1% | 1.04 (0.84 to 1.30) |
| LTG vs LEV | 1 | 240 | 1.02 (0.70 to 1.49) | NA | 26.6% | 1.16 (0.93 to 1.47) |
| LTG vs ZNS | No direct evidence | 0% | 0.91 (0.67 to 1.22) | |||
| OXC vs TPM | 1 | 487 | 0.66 (0.17 to 2.47) | NA | 3.7% | 1.10 (0.83 to 1.45) |
| OXC vs GBP | 1 | 498 | 0.49 (0.05 to 4.74) | NA | 9.8% | 1.23 (0.95 to 1.59) |
| OXC vs LEV | No direct evidence | 0% | 1.37 (1.05 to 1.79) | |||
| OXC vs ZNS | No direct evidence | 0% | 1.06 (0.76 to 1.52) | |||
| TPM vs GBP | 1 | 635 | 0.75 (0.09 to 6.00) | NA | 11.2% | 1.12 (0.87 to 1.45) |
| TPM vs LEV | No direct evidence | 0% | 1.25 (0.96 to 1.64) | |||
| TPM vs ZNS | No direct evidence | 0% | 0.97 (0.72 to 1.32) | |||
| GBP vs LEV | No direct evidence | 0% | 1.12 (0.88 to 1.43) | |||
| GBP vs ZNS | No direct evidence | 0% | 0.87 (0.63 to 1.20) | |||
| LEV vs ZNS | No direct evidence | 0% | 0.78 (0.56 to 1.09) | |||
| CBZ: carbamazepine; CI: confidence interval; GBP: gabapentin; HR: hazard ratio; LEV: levetiracetam; LTG: lamotrigine; OXC: oxcarbazepine; PHB: phenobarbitone; PHT: phenytoin; TPM: topiramate; VPS: sodium valproate; ZNS: zonisamide aOrder of drugs in the table: most commonly used drug first (carbamazepine), then drugs are ordered approximately by the date they were licenced as a monotherapy treatment (oldest first). | ||||||
| Comparisiona | Direct evidence (pairwise meta‐analysis) | Direct plus indirect evidence | ||||
| Number of | Number of | HR (95% CI)b,c | I² statisticd | Direct | HR (95% CI)b,c | |
| CBZ vs PHB | 3 | 158 | 0.53 (0.28 to 1.00) | 0% | 42.6% | 1.25 (0.83 to 1.89) |
| CBZ vs PHT | 2 | 121 | 1.11 (0.61 to 2.02) | 64.5% | 9.3% | 0.86 (0.65 to 1.16) |
| CBZ vs VPS | 4 | 412 | 1.01 (0.72 to 1.43) | 0% | 51.1% | 0.94 (0.79 to 1.14) |
| CBZ vs LTG | 1 | 9 | 1.33 (0.29 to 6.03) | NA | 7% | 1.28 (0.54 to 3.03) |
| CBZ vs OXC | 1 | 9 | 0.77 (0.15 to 3.89) | NA | 5.6% | 1.72 (0.47 to 6.25) |
| CBZ vs TPM | 2 | 101 | 1.15 (0.52 to 2.53) | 0% | 27.2% | 1.06 (0.78 to 1.45) |
| CBZ vs GBP | 1 | 6 | 2.19 (0.23 to 21.2) | NA | 10.9% | 0.75 (0.10 to 5.88) |
| CBZ vs LEV | 2 | 251 | 1.02 (0.65 to 1.59) | 77.4% | 16.6% | 1.33 (0.81 to 2.22) |
| PHB vs PHT | 3 | 130 | 1.30 (0.61 to 2.78) | 53% | 10.9% | 0.68 (0.44 to 1.08) |
| PHB vs VPS | 2 | 98 | 1.15 (0.53 to 2.49) | 42.3% | 13% | 0.75 (0.49 to 1.15) |
| PHB vs LTG | No direct evidence | 0% | 1.01 (0.40 to 2.63) | |||
| PHB vs OXC | No direct evidence | 0% | 1.37 (0.35 to 5.26) | |||
| PHB vs TPM | No direct evidence | 0% | 0.85 (0.51 to 1.41) | |||
| PHB vs GBP | No direct evidence | 0% | 0.60 (0.07 to 5.00) | |||
| PHB vs LEV | No direct evidence | 0% | 1.06 (0.56 to 2.04) | |||
| PHT vs VPS | 4 | 269 | 0.87 (0.55 to 1.40) | 0% | 44.9% | 1.10 (0.80 to 1.49) |
| PHT vs LTG | No direct evidence | 0% | 1.47 (0.60 to 3.57) | |||
| PHT vs OXC | 2 | 154 | 0.77 (0.41 to 1.47) | 0% | 41.2% | 2.00 (0.53 to 7.69) |
| PHT vs TPM | No direct evidence | 0% | 1.23 (0.81 to 1.85) | |||
| PHT vs GBP | No direct evidence | 0% | 0.87 (0.11 to 7.14) | |||
| PHT vs LEV | No direct evidence | 0% | 1.56 (0.87 to 2.78) | |||
| VPS vs LTG | 3 | 387 | 0.77 (0.38 to 1.56) | 0% | 35.7% | 1.35 (0.57 to 3.13) |
| VPS vs OXC | No direct evidence | 0% | 1.82 (0.50 to 6.67) | |||
| VPS vs TPM | 2 | 441 | 0.52 (0.26 to 1.04) | 58.5% | 10.6% | 1.12 (0.83 to 1.52) |
| VPS vs GBP | No direct evidence | 0% | 0.79 (0.10 to 6.25) | |||
| VPS vs LEV | 1 | 512 | 0.91 (0.49 to 1.70) | NA | 55.2% | 1.41 (0.83 to 2.44) |
| LTG vs OXC | 1 | 10 | 0.58 (0.13 to 2.64) | NA | 9.2% | 1.35 (0.33 to 5.56) |
| LTG vs TPM | 1 | 14 | 1.13 (0.33 to 3.82) | NA | 15.1% | 0.83 (0.35 to 2.00) |
| LTG vs GBP | 1 | 7 | 1.64 (0.18 to 14.8) | NA | 12.5% | 0.59 (0.07 to 5.00) |
| LTG vs LEV | No direct evidence | 0% | 1.05 (0.40 to 2.78) | |||
| OXC vs TPM | 1 | 14 | 1.95 (0.51 to 7.50) | NA | 11.4% | 0.62 (0.17 to 2.27) |
| OXC vs GBP | 1 | 7 | 2.83 (0.29 to 27.6) | NA | 10.9% | 0.44 (0.04 to 4.35) |
| OXC vs LEV | No direct evidence | 0% | 0.78 (0.20 to 3.13) | |||
| TPM vs GBP | 1 | 11 | 1.45 (0.18 to 11.7) | NA | 15.9% | 0.71 (0.09 to 5.56) |
| TPM vs LEV | No direct evidence | 0% | 1.27 (0.68 to 2.33) | |||
| GBP vs LEV | No direct evidence | 0% | 1.79 (0.21 to 14.3) | |||
| CBZ: carbamazepine; CI: confidence interval; GBP: gabapentin; HR: hazard ratio; LEV: levetiracetam; LTG: lamotrigine; OXC: oxcarbazepine; PHB: phenobarbitone; PHT: phenytoin; TPM: topiramate; VPS: sodium valproate; ZNS: zonisamide Generalised tonic‐clonic seizures with or without other seizure types is shortened to 'Generalised seizures' for brevity aOrder of drugs in the table: most commonly used drug first (carbamazepine), then drugs are ordered approximately by the date they were licenced as a monotherapy treatment (oldest first). | ||||||
| Comparisiona | Direct evidence (pairwise meta‐analysis) | Direct plus indirect evidence | ||||
| Number of | Number of | HR (95% CI)b,c | I² statisticd | Direct | HR (95% CI)b,c | |
| CBZ vs PHB | 4 | 525 | 1.24 (0.95 to 1.61) | 0% | 31.3% | 0.95 (0.76 to 1.19) |
| CBZ vs PHT | 3 | 430 | 0.85 (0.66 to 1.09) | 4.2% | 23.3% | 1.03 (0.88 to 1.20) |
| CBZ vs VPS | 5 | 816 | 1.06 (0.90 to 1.25) | 56.5% | 16.6% | 1.10 (0.96 to 1.25) |
| CBZ vs LTG | 7 | 1535 | 1.15 (0.89 to 1.48) | 0% | 26.4% | 1.11 (0.98 to 1.27) |
| CBZ vs OXC | 2 | 555 | 1.15 (0.65 to 2.04) | 0% | 16.6% | 0.98 (0.82 to 1.18) |
| CBZ vs TPM | 2 | 925 | 1.05 (0.64 to 1.72) | 0% | 8.8% | 1.11 (0.96 to 1.28) |
| CBZ vs GBP | 2 | 943 | 0.81 (0.52 to 1.27) | 0% | 73.7% | 1.16 (0.99 to 1.35) |
| CBZ vs LEV | 3 | 1567 | 1.06 (0.84 to 1.33) | 37.9% | 20.4% | 1.04 (0.93 to 1.16) |
| CBZ vs ZNS | 1 | 582 | 1.00 (0.82 to 1.20) | NA | 100% | 1.00 (0.83 to 1.20) |
| PHB vs PHT | 4 | 465 | 0.79 (0.60 to 1.05) | 0% | 31.1% | 1.08 (0.85 to 1.37) |
| PHB vs VPS | 2 | 80 | 0.67 (0.42 to 1.08) | 0% | 9.1% | 1.15 (0.89 to 1.49) |
| PHB vs LTG | No direct evidence | 0% | 1.16 (0.90 to 1.52) | |||
| PHB vs OXC | No direct evidence | 0% | 1.03 (0.77 to 1.39) | |||
| PHB vs TPM | No direct evidence | 0% | 1.16 (0.89 to 1.54) | |||
| PHB vs GBP | No direct evidence | 0% | 1.22 (0.93 to 1.59) | |||
| PHB vs LEV | No direct evidence | 0% | 1.10 (0.85 to 1.41) | |||
| PHB vs ZNS | No direct evidence | 0% | 1.04 (0.78 to 1.41) | |||
| PHT vs VPS | 5 | 245 | 0.90 (0.70 to 1.15) | 0% | 26.5% | 1.06 (0.88 to 1.30) |
| PHT vs LTG | 1 | 90 | 0.88 (0.25 to 3.03) | NA | 1.20% | 1.09 (0.88 to 1.32) |
| PHT vs OXC | 2 | 318 | 1.21 (0.79 to 1.87) | 0% | 33.2% | 0.95 (0.75 to 1.22) |
| PHT vs TPM | No direct evidence | 0% | 1.09 (0.88 to 1.33) | |||
| PHT vs GBP | No direct evidence | 0% | 1.12 (0.91 to 1.39) | |||
| PHT vs LEV | No direct evidence | 0% | 1.02 (0.84 to 1.22) | |||
| PHT vs ZNS | No direct evidence | 0% | 0.97 (0.76 to 1.23) | |||
| VPS vs LTG | 3 | 221 | 1.22 (0.97 to 1.52) | 0% | 32.1% | 1.02 (0.85 to 1.22) |
| VPS vs OXC | No direct evidence | 0% | 0.90 (0.72 to 1.12) | |||
| VPS vs TPM | 2 | 111 | 1.08 (0.87 to 1.34) | 0% | 61.7% | 1.02 (0.83 to 1.23) |
| VPS vs GBP | No direct evidence | 0% | 1.05 (0.87 to 1.28) | |||
| VPS vs LEV | 1 | 190 | 1.09 (0.88 to 1.33) | NA | 40.5% | 0.95 (0.79 to 1.14) |
| VPS vs ZNS | No direct evidence | 0% | 0.91 (0.72 to 1.14) | |||
| LTG vs OXC | 1 | 499 | 1.08 (0.27 to 4.32) | NA | 2.4% | 0.88 (0.73 to 1.08) |
| LTG vs TPM | 1 | 636 | 0.89 (0.70 to 1.13) | NA | 1.7% | 1.00 (0.85 to 1.18) |
| LTG vs GBP | 1 | 647 | 1.46 (0.16 to 13.0) | NA | 1.6% | 1.04 (0.88 to 1.22) |
| LTG vs LEV | 1 | 240 | 0.83 (0.59 to 1.17) | NA | 17.8% | 0.93 (0.80 to 1.10) |
| LTG vs ZNS | No direct evidence | 0% | 0.89 (0.71 to 1.12) | |||
| OXC vs TPM | 1 | 487 | 0.86 (0.26 to 2.86) | NA | 3.3% | 1.14 (0.93 to 1.37) |
| OXC vs GBP | 1 | 498 | 1.35 (0.15 to 12.1) | NA | 2.1% | 1.18 (0.96 to 1.43) |
| OXC vs LEV | No direct evidence | 0% | 1.06 (0.86 to 1.32) | |||
| OXC vs ZNS | No direct evidence | 0% | 1.01 (0.78 to 1.32) | |||
| TPM vs GBP | 1 | 635 | 1.56 (0.2 to 12.5) | NA | 1.6% | 1.04 (0.88 to 1.23) |
| TPM vs LEV | No direct evidence | 0% | 0.93 (0.79 to 1.12) | |||
| TPM vs ZNS | No direct evidence | 0% | 0.89 (0.70 to 1.14) | |||
| GBP vs LEV | No direct evidence | 0% | 0.90 (0.75 to 1.09) | |||
| GBP vs ZNS | No direct evidence | 0% | 0.86 (0.68 to 1.10) | |||
| LEV vs ZNS | No direct evidence | 0% | 0.95 (0.77 to 1.19) | |||
| CBZ: carbamazepine; CI: confidence interval; GBP: gabapentin; HR: hazard ratio; LEV: levetiracetam; LTG: lamotrigine; OXC: oxcarbazepine; PHB: phenobarbitone; PHT: phenytoin; TPM: topiramate; VPS: sodium valproate; ZNS: zonisamide aOrder of drugs in the table: most commonly used drug first (carbamazepine), then drugs are ordered approximately by the date they were licenced as a monotherapy treatment (oldest first). | ||||||
| Comparisiona | Direct evidence (pairwise meta‐analysis) | Direct plus indirect evidence | ||||
| Number | Number | HR (95% CI)b,c | I² statisticd | Direct | HR (95% CI)b,c | |
| CBZ vs PHB | 3 | 158 | 0.56 (0.33 to 0.96) | 13.2% | 28.2% | 1.28 (0.92 to 1.79) |
| CBZ vs PHT | 2 | 121 | 1.44 (0.82 to 2.55) | 31.4% | 13% | 0.87 (0.68 to 1.10) |
| CBZ vs VPS | 4 | 412 | 1.11 (0.81 to 1.53) | 29.9% | 30.7% | 0.95 (0.84 to 1.09) |
| CBZ vs LTG | 5 | 254 | 0.58 (0.25 to 1.32) | 0% | 0.1% | 1.20 (0.99 to 1.49) |
| CBZ vs OXC | 1 | 9 | 0.79 (0.17 to 3.56) | NA | 4.6% | 1.30 (0.42 to 4.00) |
| CBZ vs TPM | 2 | 101 | 1.00 (0.55 to 1.79) | 0% | 32.8% | 1.11 (0.78 to 1.59) |
| CBZ vs GBP | 1 | 6 | 0.71 (0.07 to 6.90) | NA | 10% | 1.75 (0.23 to 12.5) |
| CBZ vs LEV | 2 | 251 | 1.00 (0.72 to 1.37) | 57.9% | 26.7% | 1.14 (0.85 to 1.52) |
| PHB vs PHT | 3 | 130 | 1.31 (0.67 to 2.53) | 0% | 22.7% | 0.68 (0.47 to 0.98) |
| PHB vs VPS | 2 | 98 | 1.50 (0.72 to 3.11) | 7.5% | 15.3% | 0.75 (0.53 to 1.05) |
| PHB vs LTG | No direct evidence | 0% | 0.94 (0.64 to 1.39) | |||
| PHB vs OXC | No direct evidence | 0% | 1.01 (0.31 to 3.23) | |||
| PHB vs TPM | No direct evidence | 0% | 0.87 (0.53 to 1.41) | |||
| PHB vs GBP | No direct evidence | 0% | 1.37 (0.17 to 11.1) | |||
| PHB vs LEV | No direct evidence | 0% | 0.88 (0.57 to 1.37) | |||
| PHT vs VPS | 4 | 394 | 1.03 (0.68 to 1.54) | 0% | 36.8% | 1.10 (0.85 to 1.43) |
| PHT vs LTG | 1 | 91 | 1.96 (0.37 to 10.2) | NA | 4.4% | 1.39 (1.03 to 1.89) |
| PHT vs OXC | 2 | 154 | 0.71 (0.42 to 1.21) | 0% | 45.1% | 1.49 (0.48 to 4.76) |
| PHT vs TPM | No direct evidence | 0% | 1.28 (0.84 to 1.96) | |||
| PHT vs GBP | No direct evidence | 0% | 2.00 (0.26 to 16.7) | |||
| PHT vs LEV | No direct evidence | 0% | 1.32 (0.89 to 1.92) | |||
| VPS vs LTG | 3 | 387 | 0.84 (0.48 to 1.47) | 0% | 43.5% | 1.27 (1.03 to 1.56) |
| VPS vs OXC | No direct evidence | 0% | 1.35 (0.44 to 4.17) | |||
| VPS vs TPM | 2 | 441 | 0.67 (0.38 to 1.19) | 58.7% | 12.9% | 1.16 (0.81 to 1.67) |
| VPS vs GBP | No direct evidence | 0% | 1.82 (0.24 to 14.3) | |||
| VPS vs LEV | 1 | 512 | 0.88 (0.60 to 1.30) | NA | 48.6% | 1.19 (0.86 to 1.64) |
| LTG vs OXC | 1 | 10 | 0.80 (0.20 to 3.26) | NA | 7.6% | 1.08 (0.35 to 3.33) |
| LTG vs TPM | 1 | 14 | 0.59 (0.30 to 1.16) | NA | 10% | 0.92 (0.62 to 1.37) |
| LTG vs GBP | 1 | 7 | 0.73 (0.08 to 6.57) | NA | 11% | 1.45 (0.19 to 11.1) |
| LTG vs LEV | No direct evidence | 0% | 0.93 (0.65 to 1.33) | |||
| OXC vs TPM | 1 | 14 | 1.34 (0.40 to 4.54) | NA | 9.4% | 0.86 (0.28 to 2.63) |
| OXC vs GBP | 1 | 7 | 0.91 (0.10 to 8.20) | NA | 10.7% | 1.35 (0.15 to 12.5) |
| OXC vs LEV | No direct evidence | 0% | 0.88 (0.27 to 2.78) | |||
| TPM vs GBP | 1 | 11 | 0.68 (0.08 to 5.45) | NA | 13.9% | 1.56 (0.21 to 12.5) |
| TPM vs LEV | No direct evidence | 0% | 1.02 (0.65 to 1.61) | |||
| GBP vs LEV | No direct evidence | 0% | 0.65 (0.08 to 5.00) | |||
| CBZ: carbamazepine; CI: confidence interval; GBP: gabapentin; HR: hazard ratio; LEV: levetiracetam; LTG: lamotrigine; OXC: oxcarbazepine; PHB: phenobarbitone; PHT: phenytoin; TPM: topiramate; VPS: sodium valproate; ZNS: zonisamide Generalised tonic‐clonic seizures with or without other seizure types is shortened to 'Generalised seizures' for brevity aOrder of drugs in the table: most commonly used drug first (carbamazepine), then drugs are ordered approximately by the date they were licenced as a monotherapy treatment (oldest first). | ||||||
| Comparisiona | Direct evidence (pairwise meta‐analysis) | Direct plus indirect evidence | ||||
| Number | Number | HR (95% CI)b,c | I² statisticd | Direct | HR (95% CI)b,c | |
| CBZ vs PHB | 6 | 581 | 0.99 (0.78 to 1.26) | 54.3% | 21% | 0.79 (0.64 to 0.97) |
| CBZ vs PHT | 4 | 432 | 0.91 (0.72 to 1.16) | 16.1% | 27.1% | 0.98 (0.85 to 1.13) |
| CBZ vs VPS | 5 | 813 | 1.01 (0.86 to 1.19) | 32% | 34.6% | 1.20 (1.06 to 1.37) |
| CBZ vs LTG | 9 | 2252 | 0.98 (0.75 to 1.27) | 0% | 40.7% | 1.29 (1.17 to 1.42) |
| CBZ vs OXC | 2 | 555 | 1.47 (0.57 to 3.81) | 57.3% | 4.8% | 1.09 (0.89 to 1.32) |
| CBZ vs TPM | 2 | 925 | 1.03 (0.51 to 2.08) | 69.3% | 1.5% | 1.12 (0.97 to 1.29) |
| CBZ vs GBP | 2 | 943 | 1.64 (1.14 to 2.36) | 17.7% | 49% | 1.44 (1.25 to 1.66) |
| CBZ vs LEV | 3 | 1552 | 1.18 (0.85 to 1.65) | 0% | 26.2% | 1.14 (0.99 to 1.30) |
| CBZ vs ZNS | 1 | 581 | 1.30 (0.97 to 1.73) | NA | 100% | 1.30 (0.97 to 1.73) |
| PHB vs PHT | 5 | 463 | 1.07 (0.83 to 1.37) | 27.7% | 33.6% | 1.24 (0.99 to 1.56) |
| PHB vs VPS* | 2 | 80 | 0.71 (0.43 to 1.17) | 9.1% | 12.8% | 1.53 (1.20 to 1.94) |
| PHB vs LTG | No direct evidence | 0% | 1.63 (1.30 to 2.06) | |||
| PHB vs OXC | No direct evidence | 0% | 1.38 (1.04 to 1.83) | |||
| PHB vs TPM | No direct evidence | 0% | 1.42 (1.11 to 1.83) | |||
| PHB vs GBP | No direct evidence | 0% | 1.83 (1.42 to 2.35) | |||
| PHB vs LEV | No direct evidence | 0% | 1.44 (1.12 to 1.85) | |||
| PHB vs ZNS | No direct evidence | 0% | 1.64 (1.15 to 2.35) | |||
| PHT vs VPS | 5 | 245 | 0.96 (0.72 to 1.29) | 0% | 25.4% | 1.23 (1.02 to 1.48) |
| PHT vs LTG | 1 | 90 | 0.77 (0.38 to 1.54) | NA | 6% | 1.31 (1.10 to 1.57) |
| PHT vs OXC | 2 | 318 | 1.46 (0.88 to 2.44) | 23.9% | 36.1% | 1.11 (0.87 to 1.41) |
| PHT vs TPM | 1 | 53 | 2.32 (0.95 to 5.70) | NA | 4% | 1.14 (0.93 to 1.40) |
| PHT vs GBP | No direct evidence | 0% | 1.47 (1.20 to 1.80) | |||
| PHT vs LEV | No direct evidence | 0% | 1.16 (0.95 to 1.41) | |||
| PHT vs ZNS | No direct evidence | 0% | 1.32 (0.96 to 1.82) | |||
| VPS vs LTG | 3 | 215 | 1.57 (1.23 to 2.00) | 39.4% | 10% | 1.07 (0.92 to 1.24) |
| VPS vs OXC | No direct evidence | 0% | 0.90 (0.72 to 1.14) | |||
| VPS vs TPM | 2 | 111 | 1.18 (0.93 to 1.50) | 0% | 70.2% | 0.93 (0.77 to 1.13) |
| VPS vs GBP | No direct evidence | 0% | 1.20 (0.99 to 1.44) | |||
| VPS vs LEV | 1 | 190 | 1.27 (0.94 to 1.72) | NA | 31% | 0.94 (0.77 to 1.15) |
| VPS vs ZNS | No direct evidence | 0% | 1.08 (0.78 to 1.48) | |||
| LTG vs OXC | 1 | 499 | 0.87 (0.23 to 3.25) | NA | 5.5% | 0.84 (0.69 to 1.03) |
| LTG vs TPM | 1 | 636 | 0.73 (0.57 to 0.93) | NA | 2.3% | 0.87 (0.75 to 1.01) |
| LTG vs GBP | 1 | 647 | 0.63 (0.07 to 5.42) | NA | 4.4% | 1.12 (0.96 to 1.30) |
| LTG vs LEV | 1 | 229 | 0.84 (0.53 to 1.35) | NA | 15.9% | 0.88 (0.75 to 1.04) |
| LTG vs ZNS | No direct evidence | 0% | 1.01 (0.74 to 1.36) | |||
| OXC vs TPM | 1 | 487 | 0.55 (0.15 to 2.06) | NA | 5.4% | 1.03 (0.84 to 1.27) |
| OXC vs GBP | 1 | 498 | 0.73 (0.08 to 6.49) | NA | 4.6% | 1.32 (1.08 to 1.63) |
| OXC vs LEV | No direct evidence | 0% | 1.05 (0.83 to 1.32) | |||
| OXC vs ZNS | No direct evidence | 0% | 1.19 (0.84 to 1.69) | |||
| TPM vs GBP | 1 | 635 | 1.31 (0.15 to 11.2) | NA | 3.5% | 1.28 (1.09 to 1.51) |
| TPM vs LEV | No direct evidence | 0% | 1.01 (0.83 to 1.23) | |||
| TPM vs ZNS | No direct evidence | 0% | 1.15 (0.84 to 1.59) | |||
| GBP vs LEV | No direct evidence | 0% | 0.79 (0.65 to 0.96) | |||
| GBP vs ZNS | No direct evidence | 0% | 0.90 (0.65 to 1.24) | |||
| LEV vs ZNS | No direct evidence | 0% | 1.14 (0.83 to 1.57) | |||
| CBZ: carbamazepine; CI: confidence interval; GBP: gabapentin; HR: hazard ratio; LEV: levetiracetam; LTG: lamotrigine; OXC: oxcarbazepine; PHB: phenobarbitone; PHT: phenytoin; TPM: topiramate; VPS: sodium valproate; zNS: Zonisamide aOrder of drugs in the table: most commonly used drug first (carbamazepine), then drugs are ordered approximately by the date they were licenced as a monotherapy treatment (oldest first). For comparisons marked with a *, confidence intervals of direct evidence and network meta‐analysis do not overlap indicating that inconsistency may be present in the results. | ||||||
| Comparisiona | Direct evidence (pairwise meta‐analysis) | Direct plus indirect evidence | ||||
| Number | Number | HR (95% CI)2,3 | I² statistic4 | Direct | HR (95% CI)2,3 | |
| CBZ vs PHB | 5 | 237 | 0.55 (0.33 to 0.92) | 50.4% | 35.5% | 1.10 (0.80 to 1.51) |
| CBZ vs PHT | 3 | 150 | 0.88 (0.51 to 1.54) | 0% | 26.6% | 0.76 (0.59 to 0.98) |
| CBZ vs VPS | 4 | 411 | 1.37 (0.98 to 1.92) | 84.1% | 10.4% | 0.88 (0.76 to 1.03) |
| CBZ vs LTG | 7 | 302 | 1.49 (0.94 to 2.35) | 0% | 0.3% | 0.98 (0.70 to 1.37) |
| CBZ vs OXC | 1 | 9 | 1.55 (0.38 to 6.31) | NA | 9% | 1.09 (0.36 to 3.36) |
| CBZ vs TPM | 2 | 101 | 1.19 (0.56 to 2.50) | 62% | 9% | 1.15 (0.89 to 1.48) |
| CBZ vs GBP | 1 | 6 | 2.83 (0.31 to 25.5) | NA | 10.7% | 0.79 (0.10 to 6.08) |
| CBZ vs LEV | 2 | 251 | 1.04 (0.65 to 1.64) | 0% | 44.9% | 1.19 (0.78 to 1.83) |
| PHB vs PHT | 4 | 161 | 1.41 (0.76 to 2.62) | 46.9% | 20.3% | 0.69 (0.48 to 1.00) |
| PHB vs VPS | 2 | 98 | 1.87 (0.87 to 4.00) | 69.8% | 6.5% | 0.80 (0.57 to 1.12) |
| PHB vs LTG | No direct evidence | 0% | 0.89 (0.56 to 1.42) | |||
| PHB vs OXC | No direct evidence | 0% | 1.00 (0.31 to 3.20) | |||
| PHB vs TPM | No direct evidence | 0% | 1.05 (0.70 to 1.56) | |||
| PHB vs GBP | No direct evidence | 0% | 0.72 (0.09 to 5.68) | |||
| PHB vs LEV | No direct evidence | 0% | 1.09 (0.64 to 1.85) | |||
| PHT vs VPS | 4 | 394 | 1.11 (0.71 to 1.74) | 0% | 36.4% | 1.16 (0.88 to 1.53) |
| PHT vs LTG | 1 | 91 | 1.00 (0.40 to 2.46) | NA | 16.2% | 1.29 (0.85 to 1.97) |
| PHT vs OXC | 2 | 154 | 0.60 (0.33 to 1.10) | 49.7% | 25.2% | 1.44 (0.46 to 4.56) |
| PHT vs TPM | 1 | 150 | 0.63 (0.18 to 2.26) | NA | 9.8% | 1.51 (1.06 to 2.15) |
| PHT vs GBP | No direct evidence | 0% | 1.05 (0.13 to 8.14) | |||
| PHT vs LEV | No direct evidence | 0% | 1.57 (0.96 to 2.58) | |||
| VPS vs LTG | 3 | 377 | 0.64 (0.37 to 1.11) | 23.2% | 31.3% | 1.11 (0.77 to 1.60) |
| VPS vs OXC | No direct evidence | 0% | 1.24 (0.40 to 3.84) | |||
| VPS vs TPM* | 2 | 441 | 0.42 (0.23 to 0.80) | 46.4% | 21% | 1.30 (1.01 to 1.68) |
| VPS vs GBP | No direct evidence | 0% | 0.90 (0.12 to 6.92) | |||
| VPS vs LEV | 1 | 512 | 0.82 (0.48 to 1.40) | NA | 34% | 1.35 (0.86 to 2.13) |
| LTG vs OXC | 1 | 10 | 0.94 (0.25 to 3.57) | NA | 12.2% | 1.12 (0.36 to 3.48) |
| LTG vs TPM | 1 | 14 | 0.61 (0.28 to 1.30) | NA | 13.1% | 1.17 (0.78 to 1.77) |
| LTG vs GBP | 1 | 7 | 1.72 (0.20 to 14.9) | NA | 11.9% | 0.81 (0.11 to 6.25) |
| LTG vs LEV | No direct evidence | 0% | 1.22 (0.71 to 2.10) | |||
| OXC vs TPM | 1 | 14 | 1.90 (0.50 to 7.19) | NA | 13.6% | 1.05 (0.34 to 3.24) |
| OXC vs GBP | 1 | 7 | 1.83 (0.20 to 16.5) | NA | 13.3% | 0.73 (0.08 to 6.49) |
| OXC vs LEV | No direct evidence | 0% | 1.09 (0.33 to 3.62) | |||
| TPM vs GBP | 1 | 11 | 0.96 (0.11 to 8.29) | NA | 13.2% | 0.69 (0.09 to 5.32) |
| TPM vs LEV | No direct evidence | 0% | 1.04 (0.63 to 1.71) | |||
| GBP vs LEV | No direct evidence | 0% | 1.50 (0.19 to 12.0) | |||
| CBZ: carbamazepine; CI: confidence interval; GBP: gabapentin; HR: hazard ratio; LEV: levetiracetam; LTG: lamotrigine; OXC: oxcarbazepine; PHB: phenobarbitone; PHT: phenytoin; TPM: topiramate; VPS: sodium valproate; ZNS: zonisamide Generalised tonic‐clonic seizures with or without other seizure types is shortened to 'Generalised seizures' for brevity aOrder of drugs in the table: most commonly used drug first (carbamazepine), then drugs are ordered approximately by the date they were licenced as a monotherapy treatment (oldest first). For comparisons marked with a *, confidence intervals of direct evidence and network meta‐analysis do not overlap indicating that inconsistency may be present in the results | ||||||
| Drug | Number of participants | Number of participants | Number of events |
| CBZ | 5134 | 3023 | 9769 |
| PHB | 754 | 271 | 181 |
| PHT | 1384 | 614 | 1513 |
| VPS | 2303 | 1294 | 3599 |
| LTG | 3107 | 1608 | 6296 |
| OXC | 978 | 623 | 1000 |
| TPM | 1898 | 920 | 6316 |
| GBP | 1209 | 506 | 2580 |
| LEV | 948 | 1441 | 4258 |
| ZNS | 282 | 182 | 606 |
| Total | 18,045 | 10,482 | 36,118 |
| CBZ: carbamazepine; GBP: gabapentin; LEV: levetiracetam; LTG: lamotrigine; OXC: oxcarbazepine; PHB: phenobarbitone; PHT: phenytoin; TPM: topiramate; VPS: sodium valproate; ZNS: zonisamide aAdverse event data were provided as detailed individual participant data for 23 trials and we extracted summary adverse event information from 36 trial publications. No adverse event data were reported in 18 trial publications. | |||
| Event (general description)a,b,c | CBZ | PHB | PHT | VPS | LTG | OXC | TPM | GBP | LEV | ZNS | Total |
| Accidental injury | 100 | 0 | 100 | 28 | 110 | 5 | 95 | 36 | 58 | 8 | 540 |
| Anorexia or weight loss | 126 | 0 | 126 | 24 | 116 | 6 | 394 | 58 | 62 | 25 | 937 |
| Anxiety/depression | 203 | 0 | 203 | 59 | 171 | 32 | 309 | 82 | 163 | 16 | 1238 |
| Aphasia | 59 | 7 | 66 | 11 | 26 | 4 | 106 | 22 | 11 | 2 | 314 |
| Asthenia | 59 | 1 | 60 | 26 | 41 | 1 | 31 | 33 | 37 | 10 | 299 |
| Ataxia | 172 | 37 | 209 | 32 | 55 | 17 | 61 | 40 | 32 | 8 | 663 |
| Cognitive (memory, concentration, confusion etc.) | 321 | 41 | 362 | 100 | 204 | 44 | 439 | 127 | 73 | 19 | 1730 |
| Dental problems | 93 | 0 | 93 | 28 | 62 | 5 | 61 | 24 | 70 | 7 | 443 |
| Dizziness/faintness | 617 | 0 | 617 | 171 | 348 | 140 | 269 | 160 | 394 | 23 | 2739 |
| Drowsiness/fatigue | 1270 | 1 | 1271 | 422 | 539 | 233 | 628 | 326 | 477 | 33 | 5200 |
| Fever or viral infection | 379 | 0 | 379 | 68 | 172 | 24 | 84 | 58 | 338 | 37 | 1539 |
| Gastrointestinal disturbances | 683 | 20 | 703 | 246 | 394 | 33 | 236 | 142 | 284 | 42 | 2783 |
| Hair loss | 47 | 0 | 47 | 130 | 22 | 15 | 39 | 8 | 16 | 3 | 327 |
| Headache or migraine | 843 | 0 | 843 | 264 | 556 | 137 | 315 | 171 | 596 | 47 | 3772 |
| Impotence | 90 | 24 | 114 | 13 | 17 | 0 | 27 | 32 | 11 | 3 | 331 |
| Increased/worsened seizures | 151 | 0 | 151 | 31 | 164 | 6 | 58 | 48 | 140 | 6 | 755 |
| Infection | 121 | 0 | 121 | 19 | 90 | 4 | 56 | 27 | 63 | 5 | 506 |
| Laboratory results abnormal | 367 | 0 | 367 | 103 | 117 | 8 | 47 | 19 | 90 | 32 | 1150 |
| Menstrual problems | 110 | 0 | 110 | 28 | 31 | 1 | 22 | 18 | 39 | 4 | 363 |
| Mood or behavioural change | 279 | 41 | 320 | 128 | 163 | 25 | 415 | 121 | 121 | 15 | 1628 |
| Nausea/vomiting | 413 | 1 | 414 | 167 | 233 | 53 | 132 | 92 | 142 | 20 | 1667 |
| Pain | 345 | 1 | 346 | 65 | 250 | 6 | 154 | 48 | 251 | 25 | 1491 |
| Paraesthesia or tingling | 56 | 0 | 56 | 22 | 33 | 2 | 708 | 34 | 28 | 7 | 946 |
| Problems sleeping/nightmares | 108 | 1 | 109 | 46 | 197 | 16 | 147 | 31 | 101 | 14 | 770 |
| Rash or skin disorder | 701 | 17 | 718 | 46 | 420 | 73 | 163 | 113 | 125 | 31 | 2407 |
| Renal/urinary disorder | 152 | 0 | 152 | 27 | 78 | 2 | 92 | 57 | 93 | 21 | 674 |
| Respiratory disorder | 233 | 0 | 233 | 53 | 124 | 4 | 190 | 23 | 131 | 17 | 1008 |
| Tremor or twitch | 171 | 1 | 172 | 258 | 219 | 19 | 56 | 23 | 51 | 2 | 972 |
| Visual disturbance/nystagmus | 199 | 0 | 199 | 53 | 96 | 33 | 86 | 59 | 33 | 8 | 766 |
| Weight gain | 259 | 0 | 259 | 347 | 167 | 22 | 71 | 258 | 70 | 1 | 1454 |
| CBZ: carbamazepine; GBP: gabapentin; LEV: levetiracetam; LTG: lamotrigine; OXC: oxcarbazepine; PHB: phenobarbitone; PHT: phenytoin; TPM: topiramate; VPS: sodium valproate; ZNS: zonisamide aVerbatim or reported terms extracted from publications or provided in individual participant data were grouped under the definitions by one review author (SJN) and any uncertainties in definition were discussed with the senior clinical author (AGM). bAdverse event data were provided as detailed individual participant data for 23 trials and we extracted summary adverse event information from 36 trial publications. No adverse event data were reported in 18 trial publications. cSome trial publications reported only on the “most common” adverse events, the totals and frequencies are likely to be an underestimation of the true number of events and number of individuals experiencing events. Furthermore, detailed information was provided in the more recent trial publications and individual participant data requests of more recent trials, often involving newer antiepileptic drugs, such as LTG, LEV and TPM; which may indicate that these newer drugs are associated with more adverse events than older drugs such as PHB and PHT ,for which less detailed information was available. | |||||||||||