Protocolos de recuperación mejorados para la cirugía pancreática, hepática y gastrointestinal superior de carácter mayor
Información
- DOI:
- https://doi.org/10.1002/14651858.CD011382.pub2Copiar DOI

- Base de datos:
-
- Cochrane Database of Systematic Reviews
- Versión publicada:
-
- 01 febrero 2016see what's new
- Tipo:
-
- Intervention
- Etapa:
-
- Review
- Grupo Editorial Cochrane:
-
Grupo Cochrane de Salud digestiva
- Copyright:
-
- Copyright © 2016 The Cochrane Collaboration. Published by John Wiley & Sons, Ltd.
Cifras del artículo
Altmetric:
Citado por:
Autores
Contributions of authors
Conceiving of the review: KG
Designing the review: KG
Co‐ordinating the review: KG
Designing search strategies: KG
Data extraction: GB‐S, AB, KG
Data analysis: KG
Writing the review: KG, GBS
Providing critical comments on the review: AB, BRD
Securing funding for the review: KG, BRD
Performing previous work that served as the foundation of the current study: KG
Sources of support
Internal sources
-
University College London, UK.
External sources
-
National Institute for Health Research, UK.
This project was supported by the National Institute for Health Research, via Cochrane Programme Grant to the CHBG and UGPD groups. The views and opinions expressed therein are those of the authors and do not necessarily reflect those of the Systematic Reviews Programme, NIHR, NHS or the Department of Health.
Declarations of interest
This report comprises independent research funded by the National Institute for Health Research (NIHR) Cochrane Programme Grants, 13/89/03 (Evidence‐based diagnosis and management of upper digestive, hepato‐biliary and pancreatic disorders). The views expressed in this publication are those of the review author(s) and are not necessarily those of the National Health Service (NHS), the NIHR or the Department of Health.
GB‐S: none known.
AB: none known.
BD: none known.
KG: none known.
Acknowledgements
We thank Karin Dearness, Managing Editor, Cochrane Upper Gastrointestinal and Pancreatic Diseases (UGPD) Group, for providing administrative and logistical support for the conduct of the current review.
We thank the copy editors and the Cochrane Editorial Unit for their comments.
Version history
| Published | Title | Stage | Authors | Version |
| 2016 Feb 01 | Enhanced recovery protocols for major upper gastrointestinal, liver and pancreatic surgery | Review | Giles Bond‐Smith, Ajay P Belgaumkar, Brian R Davidson, Kurinchi Selvan Gurusamy | |
| 2014 Nov 13 | Enhanced recovery protocols for major upper gastrointestinal, liver and pancreatic surgery | Protocol | Kurinchi Selvan Gurusamy | |
Differences between protocol and review
Although we did not find multi‐arm trials, if we find multi‐arm trials in future, we will present the analysis by pooling the intervention groups and comparing it with control as the main analysis. Comparing each intervention with a split control group to avoid double counting will be presented as sensitivity analysis. This is following the recommendation of a statistician.
Different methods of dealing with multi‐arm trials were planned as a subgroup analysis; however, this has been moved to the sensitivity analysis section as this was an error in the protocol.
The time period for health‐related quality of life was revised from four weeks to three months to include any time until three months. This is because none of the trials reported health‐related quality of life beyond four weeks.
Keywords
MeSH
Medical Subject Headings (MeSH) Keywords
Medical Subject Headings Check Words
Humans;
PICO

Study flow diagram.

Risk of bias graph: review authors' judgements about each risk of bias item presented as percentages across all included studies.
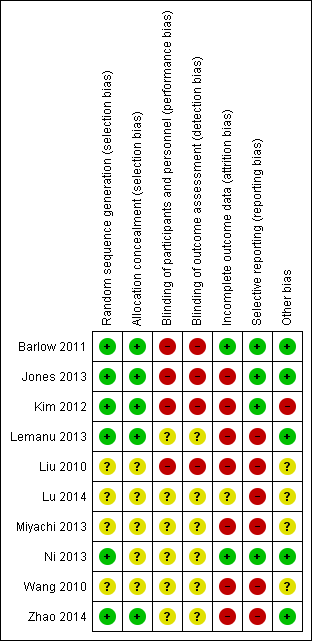
Risk of bias summary: review authors' judgements about each risk of bias item for each included study.

Comparison 1 Enhanced recovery protocol versus standard care, Outcome 1 Short‐term mortality.

Comparison 1 Enhanced recovery protocol versus standard care, Outcome 2 Serious adverse events (proportion).

Comparison 1 Enhanced recovery protocol versus standard care, Outcome 3 Serious adverse events (number).
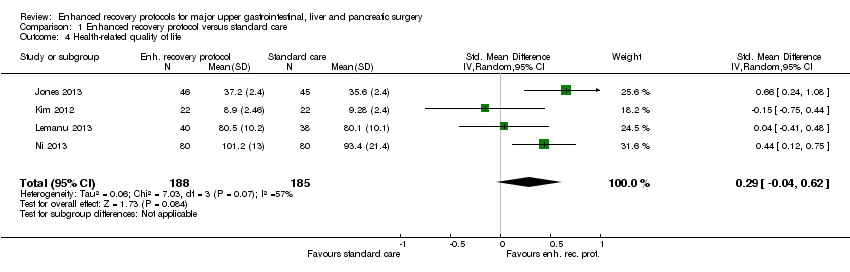
Comparison 1 Enhanced recovery protocol versus standard care, Outcome 4 Health‐related quality of life.

Comparison 1 Enhanced recovery protocol versus standard care, Outcome 5 Mild adverse events (proportion).
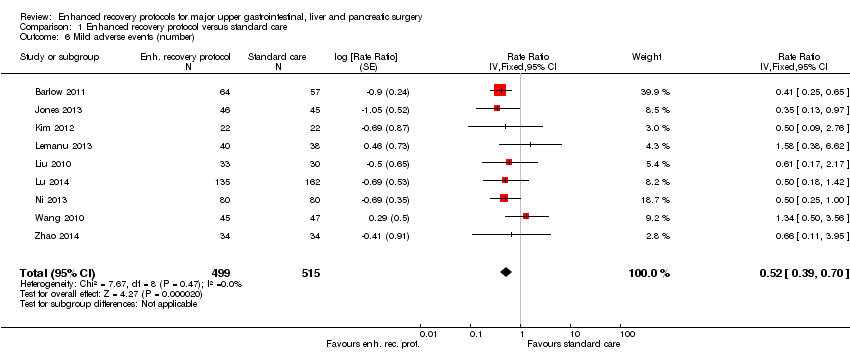
Comparison 1 Enhanced recovery protocol versus standard care, Outcome 6 Mild adverse events (number).

Comparison 1 Enhanced recovery protocol versus standard care, Outcome 7 Length of hospital stay.

Comparison 1 Enhanced recovery protocol versus standard care, Outcome 8 Readmissions.

Comparison 1 Enhanced recovery protocol versus standard care, Outcome 9 Costs.

Comparison 2 Enhanced recovery protocol versus standard care (subgroup analysis), Outcome 1 Short‐term mortality.
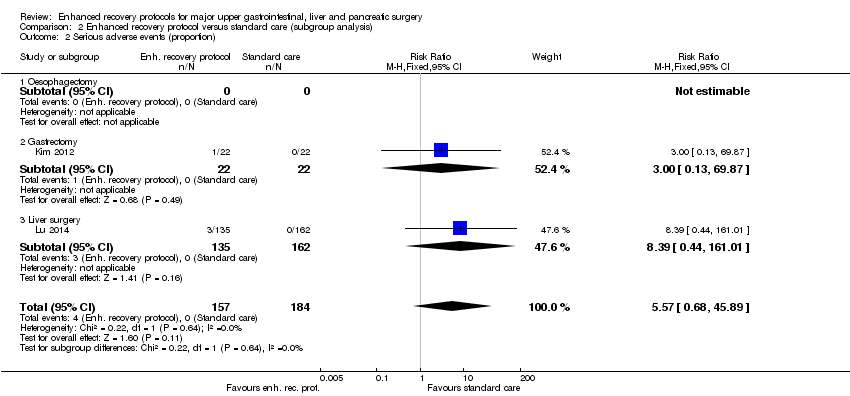
Comparison 2 Enhanced recovery protocol versus standard care (subgroup analysis), Outcome 2 Serious adverse events (proportion).

Comparison 2 Enhanced recovery protocol versus standard care (subgroup analysis), Outcome 3 Serious adverse events (number).

Comparison 2 Enhanced recovery protocol versus standard care (subgroup analysis), Outcome 4 Health‐related quality of life.

Comparison 3 Enhanced recovery protocol versus standard care (sensitivity analysis), Outcome 1 Health‐related quality of life.
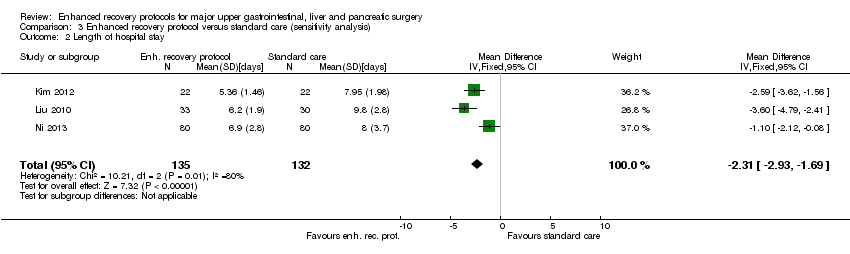
Comparison 3 Enhanced recovery protocol versus standard care (sensitivity analysis), Outcome 2 Length of hospital stay.

Comparison 3 Enhanced recovery protocol versus standard care (sensitivity analysis), Outcome 3 Costs.
| Enhanced recovery protocols versus standard care for major upper gastrointestinal, liver and pancreatic surgery | ||||||
| Patient or population: people with major upper gastrointestinal, liver and pancreatic surgery Control: standard care | ||||||
| Outcomes | Illustrative comparative risks* (95% CI) | Relative effect | No of Participants | Quality of the evidence | Comments | |
| Assumed risk | Corresponding risk | |||||
| Control | Enhanced recovery protocol versus standard care | |||||
| None of the trials reported long‐term mortality, medium‐term health‐related quality of life (3 months to 1 year), time to return to normal activity, or time to return to work. | ||||||
| Short‐term mortality | 2 per 1000 | 6 per 1000 | RR 2.79 | 868 | ⊕⊝⊝⊝ | |
| Serious adverse events (proportion) | 1 per 1000 | 6 per 1000 | RR 5.57 (0.68 to 45.89) | 341 | ⊕⊝⊝⊝ | Since there were no serious adverse events in the control group (in the two trials that reported the proportion of participants with serious adverse events), the control group risk was stated as 0.1% for this outcome alone |
| Serious adverse events (number) | 105 per 1000 | 76 per 1000 | Rate ratio 0.72 | 859 | ⊕⊝⊝⊝ | |
| Health‐related quality of life (until 3 months) | The mean health‐related quality of life in the intervention groups was | 373 | very low1,4 | SMD 0.29 (‐0.04 to 0.62) | ||
| Mild adverse events (proportion) | 188 per 1000 | 109 per 1000 | RR 0.58 | 525 | ⊕⊕⊝⊝ | |
| Mild adverse events (number) | 249 per 1000 | 129 per 1000 | Rate ratio 0.52 | 1014 | ⊕⊕⊝⊝ | |
| Length of hospital stay | The mean length of hospital stay in the control groups was | The mean length of hospital stay in the intervention groups was | 1014 | ⊕⊕⊝⊝ | The length of hospital stay reported in the trials included only the length of hospital stay during the admission for surgery and does not include the readmissions | |
| Readmissions | 24 per 1000 | 33 per 1000 | RR 1.4 | 733 | ⊕⊝⊝⊝ | |
| Costs | The mean costs in the control groups were | The mean costs in the intervention groups were | 282 | ⊕⊕⊝⊝ | ||
| *The basis for the assumed risk is the mean control group risk. The corresponding risk (and its 95% confidence interval) is based on the assumed risk in the comparison group and the relative effect of the intervention (and its 95% CI). | ||||||
| GRADE Working Group grades of evidence | ||||||
| 1 The risk of bias was high in all the trials. | ||||||
| Study name | Surgery | Preoperative education | Pain relief protocol | Early mobilisation protocol | Nutritional protocol | Growth factors | Outcomes reported |
| Major upper gastrointestinal surgery (oesophagectomy, gastrectomy and pancreatectomy) | No | No | No | Yes | No |
| |
| Open liver surgery | Yes | No | Yes | Yes | No |
| |
| Laparoscopic distal gastrectomy | Yes | Yes | Yes | Yes | No |
| |
| Laparoscopic sleeve gastrectomy | Yes | Yes | Yes | Yes | No |
| |
| Gastrectomy | Yes | Yes | Yes | Yes | No |
| |
| Liver surgery | No | No | Yes | Yes | No |
| |
| Gastrectomy | No | No | No | No | Yes | None of the outcomes of interest were reported | |
| Partial liver resection | Yes | Yes | Yes | Yes | No |
| |
| Gastrectomy | Yes | Yes | Ys | Yes | No |
| |
| Oesophagectomy | Yes | Yes | N | No | No |
| |
| The table shows the surgeries that the participants underwent, the elements of enhanced recovery protocol that were different between the intervention and control, and the outcomes reported in the trials. | |||||||
| Outcome or subgroup title | No. of studies | No. of participants | Statistical method | Effect size |
| 1 Short‐term mortality Show forest plot | 7 | 868 | Risk Ratio (M‐H, Fixed, 95% CI) | 2.79 [0.44, 17.73] |
| 2 Serious adverse events (proportion) Show forest plot | 2 | 341 | Risk Ratio (M‐H, Fixed, 95% CI) | 5.57 [0.68, 45.89] |
| 3 Serious adverse events (number) Show forest plot | 7 | 859 | Rate Ratio (Fixed, 95% CI) | 0.72 [0.45, 1.13] |
| 4 Health‐related quality of life Show forest plot | 4 | 373 | Std. Mean Difference (IV, Random, 95% CI) | 0.29 [‐0.04, 0.62] |
| 5 Mild adverse events (proportion) Show forest plot | 4 | 525 | Risk Ratio (M‐H, Fixed, 95% CI) | 0.58 [0.39, 0.85] |
| 6 Mild adverse events (number) Show forest plot | 9 | 1014 | Rate Ratio (Fixed, 95% CI) | 0.52 [0.39, 0.70] |
| 7 Length of hospital stay Show forest plot | 9 | 1014 | Mean Difference (IV, Fixed, 95% CI) | ‐2.19 [‐2.53, ‐1.85] |
| 8 Readmissions Show forest plot | 7 | 733 | Risk Ratio (M‐H, Fixed, 95% CI) | 1.40 [0.69, 2.87] |
| 9 Costs Show forest plot | 4 | 282 | Mean Difference (IV, Fixed, 95% CI) | ‐0.63 [‐0.84, ‐0.42] |
| Outcome or subgroup title | No. of studies | No. of participants | Statistical method | Effect size |
| 1 Short‐term mortality Show forest plot | 6 | 747 | Risk Ratio (M‐H, Fixed, 95% CI) | 0.98 [0.06, 15.17] |
| 1.1 Oesophagectomy | 0 | 0 | Risk Ratio (M‐H, Fixed, 95% CI) | 0.0 [0.0, 0.0] |
| 1.2 Gastrectomy | 3 | 548 | Risk Ratio (M‐H, Fixed, 95% CI) | 0.98 [0.06, 15.17] |
| 1.3 Liver surgery | 3 | 199 | Risk Ratio (M‐H, Fixed, 95% CI) | 0.0 [0.0, 0.0] |
| 2 Serious adverse events (proportion) Show forest plot | 2 | 341 | Risk Ratio (M‐H, Fixed, 95% CI) | 5.57 [0.68, 45.89] |
| 2.1 Oesophagectomy | 0 | 0 | Risk Ratio (M‐H, Fixed, 95% CI) | 0.0 [0.0, 0.0] |
| 2.2 Gastrectomy | 1 | 44 | Risk Ratio (M‐H, Fixed, 95% CI) | 3.0 [0.13, 69.87] |
| 2.3 Liver surgery | 1 | 297 | Risk Ratio (M‐H, Fixed, 95% CI) | 8.39 [0.44, 161.01] |
| 3 Serious adverse events (number) Show forest plot | 6 | Rate Ratio (Fixed, 95% CI) | 0.87 [0.53, 1.43] | |
| 3.1 Oesophagectomy | 1 | Rate Ratio (Fixed, 95% CI) | 0.33 [0.01, 8.12] | |
| 3.2 Gastrectomy | 2 | Rate Ratio (Fixed, 95% CI) | 1.10 [0.35, 3.49] | |
| 3.3 Liver surgery | 3 | Rate Ratio (Fixed, 95% CI) | 0.84 [0.48, 1.48] | |
| 4 Health‐related quality of life Show forest plot | 4 | 373 | Std. Mean Difference (IV, Random, 95% CI) | 0.29 [‐0.04, 0.62] |
| 4.1 Oesophagectomy | 0 | 0 | Std. Mean Difference (IV, Random, 95% CI) | 0.0 [0.0, 0.0] |
| 4.2 Gastrectomy | 2 | 122 | Std. Mean Difference (IV, Random, 95% CI) | ‐0.03 [‐0.39, 0.32] |
| 4.3 Liver surgery | 2 | 251 | Std. Mean Difference (IV, Random, 95% CI) | 0.52 [0.27, 0.77] |
| Outcome or subgroup title | No. of studies | No. of participants | Statistical method | Effect size |
| 1 Health‐related quality of life Show forest plot | 3 | 282 | Std. Mean Difference (IV, Random, 95% CI) | 0.17 [‐0.19, 0.53] |
| 2 Length of hospital stay Show forest plot | 3 | 267 | Mean Difference (IV, Fixed, 95% CI) | ‐2.31 [‐2.93, ‐1.69] |
| 3 Costs Show forest plot | 3 | 214 | Mean Difference (IV, Fixed, 95% CI) | ‐0.60 [‐0.81, ‐0.39] |