Aflibercept para la degeneración macular neovascular senil
Información
- DOI:
- https://doi.org/10.1002/14651858.CD011346.pub2Copiar DOI

- Base de datos:
-
- Cochrane Database of Systematic Reviews
- Versión publicada:
-
- 08 febrero 2016see what's new
- Tipo:
-
- Intervention
- Etapa:
-
- Review
- Grupo Editorial Cochrane:
-
Grupo Cochrane de Salud ocular y de la visión
- Copyright:
-
- Copyright © 2016 The Cochrane Collaboration. Published by John Wiley & Sons, Ltd.
Cifras del artículo
Altmetric:
Citado por:
Autores
Contributions of authors
Conceived of the review: SS, YJS, DVD, QDN.
Designed the review: SS, MH, YJS, DVD, QD.
Co‐ordinated the review: SS, EC.
Collected data for the review:
Designed electronic search strategies: Lori Rosman (CEV Trials Search Co‐ordinator).
Undertook electronic searches: Lori Rosman (CEV Trials Search Co‐ordinator).
Screened search results: SS, MKS, MAS, MH, AA, EC.
Organized retrieval of papers: EC.
Screened retrieved papers against inclusion criteria: EC, SS, Sueko Ng (SN).
Appraised quality of papers: EC, SS, SN.
Extracted data from papers: EC, SS, SN.
Managed data for the review:
Entered data into RevMan 2014: EC.
Verified data entered into RevMan 2014: SS.
Analyzed data: SS, EC, MKS, AA, MH, YJS, DVD.
Interpreted data:
Provided a methodological perspective: SS, EC, AA, MAS, MKS, DVD, QDN.
Provided a clinical perspective: SS, MKS, AB, AA, MKS, MH, DVD, QDN.
Provided a policy perspective: EC, DVD, QDN.
Assisted in writing the review: SS, EC, AB, MKS, MAS, AA, MH, DVD, QDN.
Performed previous work that was the foundation of the current study: DVD, QDN.
Sources of support
Internal sources
-
No sources of support supplied
External sources
-
Elizabeth Clearfield works for the Cochrane Eyes and Vision US Project, supported by cooperative agreement 1 U01 EY020522, National Eye Institute, National Institutes of Health, USA.
-
National Institute for Health Research (NIHR), UK.
-
Richard Wormald, Co‐ordinating Editor for the Cochrane Eyes and Vision (CEV) acknowledges financial support for his CEV research sessions from the Department of Health through the award made by the National Institute for Health Research to Moorfields Eye Hospital NHS Foundation Trust and UCL Institute of Ophthalmology for a Specialist Biomedical Research Centre for Ophthalmology.
-
The NIHR also funds the CEV Editorial Base in London.
The views expressed in this publication are those of the authors and not necessarily those of the NIHR, NHS, or the Department of Health.
-
Declarations of interest
Dr. Salman Sarwar: none known.
Ms. Elizabeth Clearfield: none known.
Dr. Mohamed K Soliman: none known.
Dr. Mohammad A Sadiq: none known.
Dr. Andrew J Baldwin: none known.
Dr. Mostafa Hanout: none known.
Dr. Aniruddha Agarwal: none known.
Dr. Yasir J Sepah: none known.
Dr. Diana V. Do's institution has received research funding from Genentech and Regeneron. Dr. Do has received consulting fees or honoraria from Allergan, Bayer, Genentech, Oligasis, and Regeneron, and has served as a consultant to Genentech and Regeneron within the past three years. Dr. Do chairs the Steering Committee for the VISTA/VIVID Study.
Dr. Quan Dong Nguyen's institution has received research funding from Genentech, Regeneron, AbbVie, Psivida, and XOMA. Dr. Nguyen has received consulting fees or honoraria from Allergan, Bausch and Lomb, Bayer, Genentech, Oligasis, Regeneron, and Santen. He has served on the Scientific Advisory Board for AbbVie, Genentech, Regeneron, Santen, and XOMA within the past three years. Dr. Nguyen chairs the Steering Committee for the RISE/RIDE Study, as well as the EYEGUARD, SAKURA, and VISUAL Studies.
Acknowledgements
We acknowledge Lori Rosman, CEV Trials Search Co‐ordinator, for developing the search strategy for this review and executing it. We thank Sueko Ng for assistance provided with screening and data abstraction.
Version history
| Published | Title | Stage | Authors | Version |
| 2016 Feb 08 | Aflibercept for neovascular age‐related macular degeneration | Review | Salman Sarwar, Elizabeth Clearfield, Mohamed Kamel Soliman, Mohammad Ali Sadiq, Andrew J Baldwin, Mostafa Hanout, Aniruddha Agarwal, Yasir J Sepah, Diana V Do, Quan Dong Nguyen | |
| 2014 Oct 23 | Aflibercept for neovascular age‐related macular degeneration | Protocol | Salman Sarwar, Jose R Maya, Mostafa Hanout, Yasir J Sepah, Diana V Do, Quan Dong Nguyen | |
Differences between protocol and review
In our original protocol (Sarwar 2014), we did not specify methods for assessing the quality of the evidence using the GRADE approach. We added this assessment to our methods to comply with standard Cochrane methodological expectations. In our protocol, we planned to not perform a meta‐analysis when we had detected considerable clinical, methodological, or statistical heterogeneity (I² > 50%). However, because the two included trials were similar clinically and methodologically, we performed meta‐analysis even when statistical heterogeneity (I² > 50%) was indicated.
Keywords
MeSH
Medical Subject Headings (MeSH) Keywords
- Angiogenesis Inhibitors [*therapeutic use];
- Choroidal Neovascularization [complications, *drug therapy];
- Macular Degeneration [*drug therapy, etiology];
- Ranibizumab [therapeutic use];
- Receptors, Vascular Endothelial Growth Factor [*therapeutic use];
- Recombinant Fusion Proteins [*therapeutic use];
- Visual Acuity;
Medical Subject Headings Check Words
Humans;
PICO

Study flow diagram.
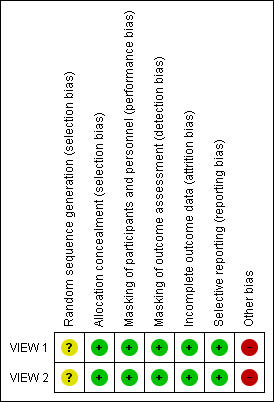
Risk of bias summary: review authors' judgements about each risk of bias item for each included study.

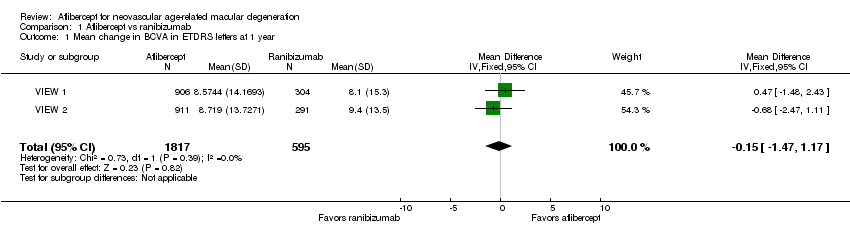
Forest plot of comparison: 1 Aflibercept vs ranibizumab, outcome: 1.1 Mean change in BCVA in ETDRS letters at 1 year.

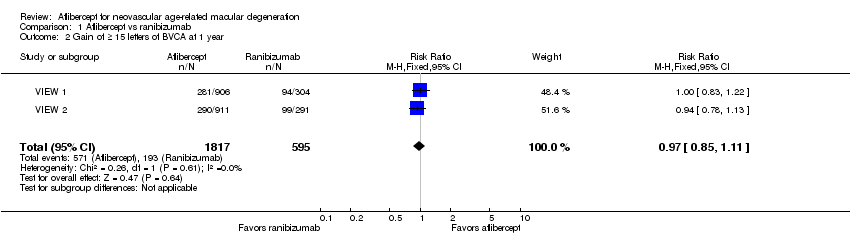
Forest plot of comparison: 1 Aflibercept vs ranibizumab, outcome: 1.2 Gain of ≥ 15 letters of BVCA at 1 year.

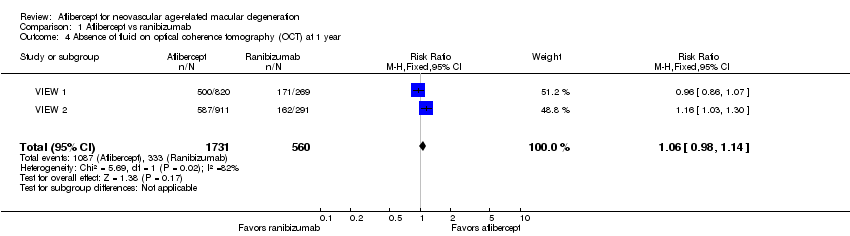
Forest plot of comparison: 1 Aflibercept vs ranibizumab, outcome: 1.4 Absence of fluid on optical coherence tomography (OCT) at 1 year.

Forest plot of comparison: 1 Aflibercept vs ranibizumab, outcome: 1.7 Mean change in vision‐related quality‐of‐life scores at 1 year.
Comparison 1 Aflibercept vs ranibizumab, Outcome 1 Mean change in BCVA in ETDRS letters at 1 year.
Comparison 1 Aflibercept vs ranibizumab, Outcome 2 Gain of ≥ 15 letters of BVCA at 1 year.

Comparison 1 Aflibercept vs ranibizumab, Outcome 3 Loss of ≥ 15 letters of BVCA at 1 year.
Comparison 1 Aflibercept vs ranibizumab, Outcome 4 Absence of fluid on optical coherence tomography (OCT) at 1 year.

Comparison 1 Aflibercept vs ranibizumab, Outcome 5 Mean change in size of the choroidal neovascularization at 1 year.

Comparison 1 Aflibercept vs ranibizumab, Outcome 6 Mean change in central retinal thickness at 1 year.

Comparison 1 Aflibercept vs ranibizumab, Outcome 7 Mean change in vision‐related quality‐of‐life scores at 1 year.

Comparison 1 Aflibercept vs ranibizumab, Outcome 8 Adverse events ‐ arterial thrombotic events at 1 year.
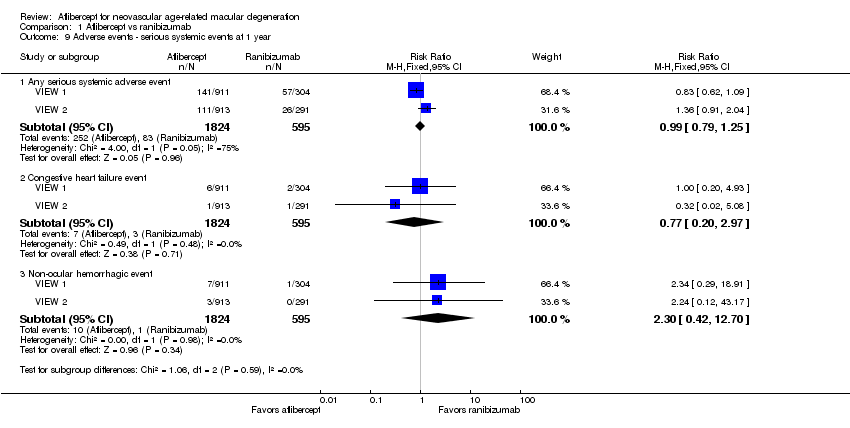
Comparison 1 Aflibercept vs ranibizumab, Outcome 9 Adverse events ‐ serious systemic events at 1 year.

Comparison 1 Aflibercept vs ranibizumab, Outcome 10 Adverse events ‐ serious ocular events at 1 year.
| Aflibercept vs ranibizumab for neovascular age‐related macular degeneration | ||||||
| Patient or population: people with age‐related macular degeneration Settings: clinical centers Intervention: intravitreal injections of aflibercept Comparison: intravitreal injections of ranibizumab | ||||||
| Outcomes | Illustrative comparative risks* (95% CI) | Relative effect | Number of participants | Quality of the evidence | Comments | |
| Assumed risk | Corresponding risk | |||||
| Ranibizumab | Aflibercept | |||||
| Mean change in BCVA in ETDRS letters at 1 year (number of letters) | Mean change in visual acuity across ranibizumab groups ranged from gains of 8.57 letters to 8.71 letters | Mean change in visual acuity in aflibercept groups was on average 0.15 fewer letters gained (95% CI 1.47 fewer letters to 1.17 more letters) | MD ‐0.15 | 2412 | ⊕⊕⊕⊕ | |
| Gain of ≥ 15 letters of BVCA at 1 year | 324 per 1000 | 314 per 1000 | RR 0.97 | 2412 (2) | ⊕⊕⊕⊕ | |
| Absence of fluid on optical coherence tomography (OCT) at 1 year | 595 per 1000 | 630 per 1000 | RR 1.06 | 2291 (2) | ⊕⊕⊕⊕ | |
| Quality‐of‐life measures at 1 year (National Eye Institute‐Visual Function Questionnaire [NEI‐VFQ]) | Mean improvement in composite NEI‐VQF score ranged across control groups from 4.9 to 6.3 points | Mean improvement in composite NEI‐VQF score in intervention groups was on average 0.39 points lower (95% CI 1.71 points lower to 0.93 points higher) | MD ‐0.39 | 2412 (2) | ⊕⊕⊕⊕ | |
| Adverse events ‐ serious systemic events at 1 year | 139 per 1000 | 138 per 1000 | RR 0.99 (0.79 to 1.25) | 2419 (2) | ⊕⊕⊕⊝ | |
| Adverse events ‐ serious ocular events at 1 year | 32 per 1000 | 20 per 1000 | RR 0.62 (0.36 to 1.07) | 2419 (2) | ⊕⊕⊕⊝ | |
| *The basis for the assumed risk (eg, median control group risk across studies) is provided in footnotes. The corresponding risk (and its 95% confidence interval) is based on the assumed risk in the comparison group and the relative effect of the intervention (and its 95% CI). The unit of analysis is the individual (one study eye per person). | ||||||
| GRADE Working Group grades of evidence aAdverse events downgraded to moderate quality as the number of events is small (wide confidence intervals) | ||||||
| Outcome or subgroup title | No. of studies | No. of participants | Statistical method | Effect size |
| 1 Mean change in BCVA in ETDRS letters at 1 year Show forest plot | 2 | 2412 | Mean Difference (IV, Fixed, 95% CI) | ‐0.15 [‐1.47, 1.17] |
| 2 Gain of ≥ 15 letters of BVCA at 1 year Show forest plot | 2 | 2412 | Risk Ratio (M‐H, Fixed, 95% CI) | 0.97 [0.85, 1.11] |
| 3 Loss of ≥ 15 letters of BVCA at 1 year Show forest plot | 2 | 2412 | Risk Ratio (M‐H, Fixed, 95% CI) | 0.89 [0.61, 1.30] |
| 4 Absence of fluid on optical coherence tomography (OCT) at 1 year Show forest plot | 2 | 2291 | Risk Ratio (M‐H, Fixed, 95% CI) | 1.06 [0.98, 1.14] |
| 5 Mean change in size of the choroidal neovascularization at 1 year Show forest plot | 2 | 2412 | Mean Difference (IV, Fixed, 95% CI) | ‐0.24 [‐0.78, 0.29] |
| 6 Mean change in central retinal thickness at 1 year Show forest plot | 2 | 2412 | Mean Difference (IV, Fixed, 95% CI) | ‐4.94 [‐15.48, 5.61] |
| 7 Mean change in vision‐related quality‐of‐life scores at 1 year Show forest plot | 2 | 2412 | Mean Difference (IV, Fixed, 95% CI) | ‐0.39 [‐1.71, 0.93] |
| 8 Adverse events ‐ arterial thrombotic events at 1 year Show forest plot | 2 | Risk Ratio (M‐H, Fixed, 95% CI) | Subtotals only | |
| 8.1 Any Antiplatelet Trialists' Collaboration arterial thrombolytic event | 2 | 2419 | Risk Ratio (M‐H, Fixed, 95% CI) | 1.04 [0.52, 2.11] |
| 8.2 Vascular death | 2 | 2419 | Risk Ratio (M‐H, Fixed, 95% CI) | 1.47 [0.32, 6.78] |
| 8.3 Non‐fatal myocardial infarction | 2 | 2419 | Risk Ratio (M‐H, Fixed, 95% CI) | 0.81 [0.32, 2.09] |
| 8.4 Non‐fatal stroke | 2 | 2419 | Risk Ratio (M‐H, Fixed, 95% CI) | 1.11 [0.27, 4.50] |
| 9 Adverse events ‐ serious systemic events at 1 year Show forest plot | 2 | Risk Ratio (M‐H, Fixed, 95% CI) | Subtotals only | |
| 9.1 Any serious systemic adverse event | 2 | 2419 | Risk Ratio (M‐H, Fixed, 95% CI) | 0.99 [0.79, 1.25] |
| 9.2 Congestive heart failure event | 2 | 2419 | Risk Ratio (M‐H, Fixed, 95% CI) | 0.77 [0.20, 2.97] |
| 9.3 Non‐ocular hemorrhagic event | 2 | 2419 | Risk Ratio (M‐H, Fixed, 95% CI) | 2.30 [0.42, 12.70] |
| 10 Adverse events ‐ serious ocular events at 1 year Show forest plot | 2 | Risk Ratio (M‐H, Fixed, 95% CI) | Subtotals only | |
| 10.1 Any serious ocular adverse event | 2 | 2419 | Risk Ratio (M‐H, Fixed, 95% CI) | 0.62 [0.36, 1.07] |
| 10.2 Visual acuity reduced | 2 | 2419 | Risk Ratio (M‐H, Fixed, 95% CI) | 1.08 [0.30, 3.93] |
| 10.3 Retinal hemorrhage | 2 | 2419 | Risk Ratio (M‐H, Fixed, 95% CI) | 0.65 [0.16, 2.60] |