Učinci aflibercepta u liječenju neovaskularne senilne makularne degeneracije
Abstract
Background
Central vision loss caused by age‐related macular degeneration (AMD) is the leading cause of blindness among the elderly in developed countries. Neovascular AMD is characterized by choroidal neovascularization (CNV). Growth of new blood vessels in patients with neovascular AMD is driven by a complex process that involves a signal protein called vascular endothelial growth factor A (VEGF‐A). Anti‐VEGF drugs that block this protein include ranibizumab, bevacizumab, and aflibercept.
Objectives
To assess and compare the effectiveness and safety of intravitreal injections of aflibercept versus ranibizumab, bevacizumab, or sham for treatment of patients with neovascular AMD.
Search methods
We searched the Cochrane Central Register of Controlled Trials (CENTRAL) (which contains the Cochrane Eyes and Vision Trials Register) (Issue 11, 2015), Ovid MEDLINE, Ovid MEDLINE In‐Process and Other Non‐Indexed Citations, Ovid MEDLINE Daily, Ovid OLDMEDLINE (January 1946 to November 2015), EMBASE (January 1980 to November 2015), PubMed (1948 to November 2015), Latin American and Caribbean Health Sciences Literature Database (LILACS) (1982 to November 2015), the metaRegister of Controlled Trials (mRCT) (www.controlled‐trials.com) (last searched December 4, 2014), ClinicalTrials.gov (www.clinicaltrials.gov), and the World Health Organization (WHO) International Clinical Trials Registry Platform (ICTRP) (www.who.int/ictrp/search/en). We did not use any date or language restrictions in the electronic search for trials. We last searched the electronic databases on November 30, 2015.
Selection criteria
We included randomized controlled trials (RCTs) in which aflibercept monotherapy was compared with ranibizumab, bevacizumab, or sham for participants with neovascular AMD who were treatment‐naive.
Data collection and analysis
We used standard methodological procedures of The Cochrane Collaboration for screening, data abstraction, and study assessment. Two review authors independently screened records, abstracted data, and assessed risk of bias of included studies; we resolved discrepancies by discussion or with the help of a third review author when needed.
Main results
We included two RCTs (total of 2457 participants, 2457 eyes). Trial participants had neovascular AMD with active subfoveal choroidal neovascular lesions. Both trials followed the same protocol and compared aflibercept at various doses versus ranibizumab, but they were carried out in different countries. One trial enrolled participants from the United States and Canada, and the second trial was conducted at 172 sites in Europe, Asia Pacific, Latin America, and the Middle East. The overall quality of the evidence was high, and included trials were at low risk for most bias domains assessed; however, both trials were funded by the manufacturers of aflibercept. For the purposes of analysis, we combined aflibercept groups regardless of dosing and analyzed them as a single group.
Visual acuity outcomes were similar between aflibercept and ranibizumab groups; at one year, participants in the aflibercept groups showed mean change in best‐corrected visual acuity (BCVA) from baseline similar to that of participants in the ranibizumab groups (mean difference (MD) ‐0.15 Early Treatment Diabetic Retinopathy Study (ETDRS) letters, 95% confidence interval (95% CI) ‐1.47 to 1.17; high‐quality evidence). At two years, the mean change in BCVA from baseline was 7.2 ETDRS letters for aflibercept groups versus 7.9 for ranibizumab groups. Sufficient data were not available for calculation of confidence intervals.
The proportion of participants who gained 15 or more letters of BCVA by one year of follow‐up was approximately 32% for both aflibercept and ranibizumab (RR 0.97, 95% CI 0.85 to 1.11; high‐quality evidence), and by two years of follow‐up was approximately 31% (RR 0.98, 95% CI 0.85 to 1.12; high‐quality evidence). Similar small proportions of participants in the aflibercept and ranibizumab groups lost 15 or more letters of BCVA at one year (RR 0.89, 95% CI 0.61 to 1.30; high‐quality evidence); this outcome was not reported for two‐year follow‐up. Data were not reported on the proportion of participants with BCVA worse than 20/200 at one‐ or two‐year follow‐up.
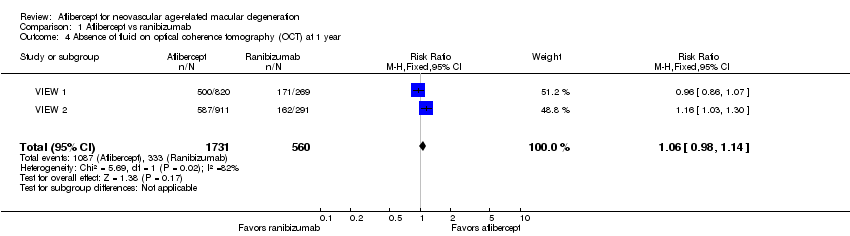
Participants treated with aflibercept or ranibizumab showed similar improvement in morphological outcomes, as assessed from images (central retinal thickness and CNV size). At one year, the proportion of eyes that achieved dry retina was similar between aflibercept and ranibizumab groups (absence of cystic intraretinal fluid and subretinal fluid on optical coherence tomography (OCT); RR 1.06, 95% CI 0.98 to 1.14; high‐quality evidence). In addition, investigators reported no difference in reduction of CNV area between aflibercept‐ and ranibizumab‐treated eyes at one year (MD ‐0.24 mm2, 95% CI ‐0.78 to 0.29; high‐quality evidence). Data were not reported for the proportion of eyes with absence of leakage on fluorescein angiography at one‐ or two‐year follow‐up.
Overall, occurrence of serious systemic adverse events was similar and comparable in aflibercept‐ and ranibizumab‐treated groups at one year (RR 0.99, 95% CI 0.79 to 1.25). Risk of any serious ocular adverse event was lower in the aflibercept group than in the ranibizumab group, but the risk estimate is imprecise (RR 0.62, 95% CI 0.36 to 1.07). As the result of imprecision, we graded the quality of evidence for all adverse events as moderate.
Authors' conclusions
Results of this review document the comparative effectiveness of aflibercept versus ranibizumab for visual acuity and morphological outcomes in eyes with neovascular AMD. Current available information on adverse effects of each medication suggests that the safety profile of aflibercept is comparable with that of ranibizumab; however, the number of participants who experienced adverse events was small, leading to imprecise estimates of absolute and relative effect sizes. The eight‐week dosing regimen of aflibercept represents reduced treatment requirements in comparison with monthly dosing regimens and thus has the potential to reduce treatment burden and risks associated with frequent injections.
PICO
Laički sažetak
Učinci aflibercepta u liječenju neovaskularne senilne makularne degeneracije
Istraživačko pitanje
U ovom Cochraneovom sustavnom pregledu literture ispitali smo koliko dobro djeluje aflibercept i koliko je siguran za liječenje osoba s neovaskularnom senilnom makularnom degeneracijom u usporedbi s drugim oblicima liječenja koji se trenutno koriste (ranibizumab i bevacizumab)?
Dosadašnje spoznaje
Jedan od uzroka gubitka vida u sredini oka je bolest koja se naziva „staračka degeneracija makule“ (engl. age‐related macular degeneration, AMD). AMD uzrokuje sljepoću u mnogih starijih ljudi u razvijenim zemljama. Procjenjuje se da diljem svijeta gotovo 9% (jedan od 11) ljudi od 45 do 85 godina starosti ima AMD. Oko 10% ljudi s AMD‐om razvije vrstu AMD koja se zove neovaskularni (mokri) AMD, koji nastaje iz novih krvnih žila koje se razvijaju u unutarnjem sloju oka tzv. choroidu. Ako se pacijent s tom vrstom AMD ne liječi, bolesno oko može izgubiti vid ili razviti druge probleme vezane za sljepoću.
Nove krvne žile rastu kada se stvara protein zvan vaskularni endotelni čimbenik rasta A (VEGF‐A). Lijekovi koji blokiraju taj protein nazivaju se anti‐VEGF lijekovi i oni se ubrizgavaju u oko, te se pokazalo da smanjuju tekućinu u stražnjem dijelu oka, a rast novih krvnih žila se usporava ili se skvrče. Ranibizumab i bevacizumab su bili najčešće korišteni lijekovi anti‐VEGF od 2006. do 2011. godine, kada je aflibercept postao dostupan. Aflibercept je izrađen tako da se jače veže s VEGF; dakle djeluje dulje nakon iniciranja, tako da bi pacijenti trebali primiti manje injekcija aflibercepta negoli ranibizumaba ili bevacizumaba.
Obilježja uključenih istraživanja
Nađene su dvije studije koje su uključile ukupno 2457 sudionika s neovaskularnom AMD. Ta su ispitivanja provedena su na različitim mjestima, ali su uglavnom slična. Jedno je provedeno samo u Sjevernoj Americi, a drugo u mnogim zemljama u mnogim dijelovima svijeta. Oba ispitivanja usporedila su aflibercept injekcije za oči u odnosu na ranibizumab injekcije, a financirala ih je tvrtka koja je proizvela filbercept. Ni jedno istraživanje nije usporedilo filibercept s injekcijama bevacuzimaba u oko. Dokazi se odnose na literaturu dostupnu do 30. studenoga 2015.
Ključni rezultati
Sudionici liječeni afliberceptom ili ranibizumabom iskusili su slična poboljšanja vidne oštrine godinu dana nakon početka liječenja. Ni u onih koji su dobili terapiju aflibercepta niti ranibizumaba nije bilo ozbiljnog, niti češćeg, gubitka vida. Malobrojni su prijavili ozbiljne nuspojave u oku u obje skupine – koje su liječene afliberceptom i ranibizumabom. Pojava ozbiljnih štetnih učinaka na zdravlje, kao što je unutarnje krvarenje, moždani udar i visok krvni tlak, bila je jednaka u obje skupine. Međutim, takvih je slučajeva bilo malo. Stoga nismo sigurni kakve su moguće razlke u štetnim učincima između osoba koje primaju aflibercept ili ranibizumab.
Kvaliteta dokaza
Dva pronađena pokusa su dobro napravljena i kvaliteta dokaza je ocijenjena kao visoka za rezultate dobivene za vid. Ocjena o visokoj kvaliteti znači da nove studije u budućnosti vjerojatno neće promijeniti te zaključke. Zbog neizvjesnosti štetnih posljedica i zbog malog broja uočenih štetnih događaja, kvaliteta dokaza za nuspojave je umjerena. Ocjena umjerene kvalitete znači da buduća istraživanja mogu imati značajan utjecaj na te zaključke.
Authors' conclusions
Summary of findings
| Aflibercept vs ranibizumab for neovascular age‐related macular degeneration | ||||||
| Patient or population: people with age‐related macular degeneration Settings: clinical centers Intervention: intravitreal injections of aflibercept Comparison: intravitreal injections of ranibizumab | ||||||
| Outcomes | Illustrative comparative risks* (95% CI) | Relative effect | Number of participants | Quality of the evidence | Comments | |
| Assumed risk | Corresponding risk | |||||
| Ranibizumab | Aflibercept | |||||
| Mean change in BCVA in ETDRS letters at 1 year (number of letters) | Mean change in visual acuity across ranibizumab groups ranged from gains of 8.57 letters to 8.71 letters | Mean change in visual acuity in aflibercept groups was on average 0.15 fewer letters gained (95% CI 1.47 fewer letters to 1.17 more letters) | MD ‐0.15 | 2412 | ⊕⊕⊕⊕ | |
| Gain of ≥ 15 letters of BVCA at 1 year | 324 per 1000 | 314 per 1000 | RR 0.97 | 2412 (2) | ⊕⊕⊕⊕ | |
| Absence of fluid on optical coherence tomography (OCT) at 1 year | 595 per 1000 | 630 per 1000 | RR 1.06 | 2291 (2) | ⊕⊕⊕⊕ | |
| Quality‐of‐life measures at 1 year (National Eye Institute‐Visual Function Questionnaire [NEI‐VFQ]) | Mean improvement in composite NEI‐VQF score ranged across control groups from 4.9 to 6.3 points | Mean improvement in composite NEI‐VQF score in intervention groups was on average 0.39 points lower (95% CI 1.71 points lower to 0.93 points higher) | MD ‐0.39 | 2412 (2) | ⊕⊕⊕⊕ | |
| Adverse events ‐ serious systemic events at 1 year | 139 per 1000 | 138 per 1000 | RR 0.99 (0.79 to 1.25) | 2419 (2) | ⊕⊕⊕⊝ | |
| Adverse events ‐ serious ocular events at 1 year | 32 per 1000 | 20 per 1000 | RR 0.62 (0.36 to 1.07) | 2419 (2) | ⊕⊕⊕⊝ | |
| *The basis for the assumed risk (eg, median control group risk across studies) is provided in footnotes. The corresponding risk (and its 95% confidence interval) is based on the assumed risk in the comparison group and the relative effect of the intervention (and its 95% CI). The unit of analysis is the individual (one study eye per person). | ||||||
| GRADE Working Group grades of evidence aAdverse events downgraded to moderate quality as the number of events is small (wide confidence intervals) | ||||||
Background
Description of the condition
Age‐related macular degeneration (AMD) is a progressive degenerative disease of the central part of the retina (the macula) that causes central vision loss. It is most common among people 55 years of age and older and is the leading cause of blindness among the elderly in developed countries (Friedman 2004). Global prevalence of any type or stage of AMD is estimated at 8.69% (95% confidence interval (CI) 4.26% to 17.40%) among people 45 to 85 years of age (Wong 2014). As the world population ages, projections suggest that 196 million people will have AMD by the year 2020 (Wong 2014). The estimated global prevalence of neovascular AMD is 0.46% (95% CI 0.18% to 1.08%) (Wong 2014). It is estimated that 1.75 million people in the United States (US) are affected by geographic atrophy or neovascular (wet) AMD (Friedman 2004). Risk factors implicated for AMD include older age, smoking, genetic predisposition and family history, and cardiovascular disease (Chakravarthy 2010; Hyman 2002; Schultz 2003; Thornton 2005).
The two main types of AMD are dry AMD and neovascular (wet) AMD (Bird 1995). Dry AMD is characterized by drusen (yellow deposits under the retina), changes in the retinal pigment epithelium (RPE), or both; it causes gradual vision loss until the fovea is affected by atrophy of the RPE (Bird 1995). Geographic atrophy is a form of dry AMD. Neovascular AMD, a form of wet AMD, is characterized by choroidal neovascularization (CNV). Associated clinical manifestations of neovascular AMD include subretinal fluid; intraretinal fluid; and retinal, subretinal, or sub‐RPE hemorrhage (Bird 1995). Approximately 10% of eyes with AMD manifest the neovascular type of AMD. If left untreated, neovascular AMD can cause severe vision loss (20/200 or worse) in most eyes (Wong 2008). This disease affects quality of life with consequent loss of independence among elderly people (AREDS 2005; Childs 2004; Clemons 2003; Dong 2004; Mangione 1999; Miskala 2004). Blurred vision, distortion of an image (metamorphopsia), and scotoma (a visual field defect or 'blind spot') are the most commonly reported symptoms among people with neovascular AMD (Fine 1986). Loss of visual acuity may not be noticed by the patient until both eyes are affected, or until or unless neovascularization is subfoveal.
Diagnostic evaluation of a patient with symptoms suggestive of neovascular AMD includes stereoscopic biomicroscopic examination of the macula, fluorescein angiography, and optical coherence tomography (OCT). Fluorescein angiography has been the gold standard for detecting and confirming the presence of choroidal neovascularization. Fluorescein angiography is an invasive imaging test in which serial retinal photographs are taken after fluorescein dye is injected into a vein. OCT is a noninvasive method of imaging posterior structures of the eye. This imaging technique is frequently used to detect and monitor morphological changes associated with choroidal neovascularization. However, fluorescein angiography is the best method for detecting new‐onset CNV (Do 2012).
Description of the intervention
Vascular endothelial growth factor‐A (VEGF‐A), a signal protein produced by cells in the back of the eye, acts as the driving force behind the development of new vessels in neovascular AMD. Drugs that can block this protein successfully have been shown to be effective not only by decreasing accumulated fluid in the back of the eye, but by causing regression of the new fragile vessels (Ferrara 2009). Available medications in this class include ranibizumab (Lucentis, Genentech Inc.), bevacizumab (Avastin, Genentech Inc.), and aflibercept (Eylea, Regeneron Pharmaceuticals, Inc.). These medications are given through intravitreal injection into the eye. Ranibuzimab is a recombinant, humanized, monoclonal, VEGF‐specific antibody fragment that inhibits all VEGF‐A isoforms. Monthly injections of ranibizumab have been widely used for treatment of patients with neovascular AMD since several clinical trials showed substantial visual gain with its use (Brown 2006;Brown 2011; Rosenfeld 2006). Bevacizumab is a monoclonal, humanized, VEGF‐specific full‐length antibody that was developed for use in various cancers and has been used off‐label for treatment of patients with neovascular AMD (CATT Research Group 2011;IVAN Trial 2013; Jansen 2013). Treatment with ranibizumab or bevacizumab usually requires monthly injections into the eye or injections given as needed on the basis of monthly assessments to monitor disease activity (Brown 2011; CATT Research Group 2011; IVAN Trial 2013; Rosenfeld 2006). Frequent injections and assessments place a significant burden on patients and caregivers and carry the risk of rare but serious adverse events associated with an injection into the eye (Haller 2013). The effectiveness (Solomon 2014) and safety (Moja 2014) of ranibizumab and bevacizumab for the treatment of patients with neovascular AMD have been analyzed in published Cochrane reviews and documented to be similar; thus, this review focuses on a comparison of outcomes of aflibercept treatment versus outcomes with other agents or no anti‐VEGF agent.
Aflibercept is a relatively new medication for neovascular AMD that was approved by the US Food and Drug Administration in November 2011 (FDA 2011). It had been known in the scientific literature as VEGF‐Trap (Stewart 2008). Aflibercept is a fusion protein made of key domains of VEGF receptors 1 (VEGFR1) and 2 (VEGFR2) fused with a portion of human antibody. Unlike ranibizumab and bevacizumab, aflibercept binds VEGF‐A, VEGF‐B, and another protein ‐ placental growth factor (PIGF) ‐ that is believed to play a role in progression of neovascular AMD. The binding affinity of aflibercept for VEGF (Kd = 0.5 pM) is substantially stronger than that of bevacizumab (Kd = 58 pM) or ranibizumab (Kd = 46 pM) (Holash 2002), leading to potentially longer duration of action in the eye that allows longer intervals between treatments. Less frequent dosing should lead to reduction in the risk of harm associated with intraocular injections (Brown 2011; Heier 2011; Heier 2012).
How the intervention might work
Aflibercept acts as a decoy receptor for VEGF. It binds both ends of activated dimerized VEGF very tightly between its arms and prevents it from interacting and activating native VEGFR1 and VEGFR2 receptors and cross linking. This binding results in blockage of the biological activity of VEGF and inhibits abnormal growth of blood vessels. It binds to PIGF in a similar fashion and prevents it from activating VEGFR1 receptors (Rudge 2007).
Why it is important to do this review
Several systematic reviews have assessed and compared the advantages and disadvantages of different dosing regimens of ranibizumab and bevacizumab tested in different clinical trials for the treatment of individuals with neovascular AMD (Mitchell 2011; Moja 2014; Schmucker 2010; Schmucker 2012; Solomon 2014). Data regarding the benefits and harms of aflibercept for treatment of neovascular AMD and comparison of its effects versus those of ranibizumab or bevacizumab are sparse. Synthesis and analysis of available data will help clinicians, patients, and caregivers when they choose among treatment options.
Objectives
To assess and compare the effectiveness and safety of intravitreal injections of aflibercept versus ranibizumab, bevacizumab, or sham for treatment of patients with neovascular AMD.
Methods
Criteria for considering studies for this review
Types of studies
We included randomized controlled trials (RCTs) only.
Types of participants
We included trials of participants with diagnosed subfoveal neovascular AMD, confirmed by fluorescein angiography, who received no previous treatment for AMD in the study eye.
Types of interventions
We included trials in which aflibercept monotherapy was compared with ranibizumab, bevacizumab, or sham. We excluded studies in which aflibercept was evaluated as part of combination therapy versus other active treatments, such as laser photocoagulation.
Types of outcome measures
Primary outcomes
The primary outcome for comparison of interventions was the mean change from baseline in number of letters of best‐corrected visual acuity (BCVA) at one year, as measured by the Early Treatment Diabetic Retinopathy Study (ETDRS) chart or equivalent.
Secondary outcomes
We included the following secondary outcomes for comparison of interventions.
-
Mean change in number of letters of BCVA at two years.
-
Proportion of participants who gained 15 or more letters of BCVA at one year and at two years.
-
Proportion of participants who lost 15 or more letters of BCVA at one year and at two years.
-
Proportion of participants with BCVA worse than 20/200 at one year and at two years.
-
Proportion of eyes with absence of fluid on optical coherence tomography (OCT) at one year and at two years.
-
Proportion of eyes with absence of leakage on fluorescein angiography at one year and at two years.
-
Mean number of injections received by one year and by two years.
-
Mean change in central retinal thickness from baseline to one year and to two years.
-
Mean change in extent of choroidal neovascularization (CNV) from baseline at one year and at two years.
Quality‐of‐life outcomes
We included quality‐of‐life outcomes as measured by a validated scale, such as the National Eye Institute Visual Function Questionnaire (NEI‐VFQ), at one year and at two years.
Adverse events
We included the following adverse events for comparison of interventions.
-
Proportion of participants with arterial thrombotic events at one year and at two years.
-
Proportion of participants with serious systemic adverse events at one year and at two years.
-
Proportion of eyes with serious ocular adverse events at one year and at two years.
Follow‐up
In our protocol (Sarwar 2014), we specified that we would not consider outcomes at less than one year of follow‐up and planned to use outcome data collected between nine and 18 months to estimate one‐year outcomes when 12‐month data were not reported from an individual study. It was not necessary to use this backup strategy, as investigators for each of the included studies reported data at one year of follow‐up. Similarly, we planned to use outcome data collected between 18 and 30 months to estimate two‐year outcomes. Therefore, we used 96‐week data published for the two included studies to estimate two‐year outcomes.
Search methods for identification of studies
Electronic searches
We searched the Cochrane Central Register of Controlled Trials (CENTRAL) (which contains the Cochrane Eyes and Vision Trials Register) (Issue 11, 2015), Ovid MEDLINE, Ovid MEDLINE In‐Process and Other Non‐Indexed Citations, Ovid MEDLINE Daily, Ovid OLDMEDLINE (January 1946 to November 2015), EMBASE (January 1980 to November 2015), PubMed (1948 to November 2015), Latin American and Caribbean Health Sciences Literature Database (LILACS) (1982 to November 2015), the metaRegister of Controlled Trials (mRCT) (www.controlled‐trials.com) (last searched December 4, 2014), ClinicalTrials.gov (www.clinicaltrials.gov), and the World Health Organization (WHO) International Clinical Trials Registry Platform (ICTRP) (www.who.int/ictrp/search/en). We did not use any date or language restrictions in the electronic search for trials. We last searched the electronic databases on November 30, 2015.
See: Appendices for details of search strategies for CENTRAL (Appendix 1), MEDLINE (Appendix 2), EMBASE (Appendix 3), PubMed (Appendix 4), LILACS (Appendix 5), mRCT (Appendix 6), ClinicalTrials.gov (Appendix 7), and the ICTRP (Appendix 8).
Searching other resources
We searched the reference lists of included trials and contacted investigators to request additional published and unpublished studies. We did not handsearch conference proceedings for the specific purposes of this review, as CEV personnel annually search major ophthalmology conference abstracts and add pertinent ones to the CENTRAL database.
Data collection and analysis
Selection of studies
We employed a two‐stage selection process. At the first stage, two review authors independently reviewed the titles and abstracts of all records identified by the searches. We classified each record as "definitely relevant," "possibly relevant," or "definitely not relevant." At the second stage, we obtained the full‐text reports of all records classified as "definitely relevant" or "possibly relevant" by both review authors following adjudication by discussion at the first stage. We grouped study reports by trial, and two review authors independently assessed each trial for relevance to the review by classifying it as "include," "exclude," or "unclear." We documented in the Characteristics of excluded studies table our assessments of studies excluded after review of full‐text reports. We assessed all studies as "include" or "exclude" after review of full‐text reports. Thus we did not have to contact study authors to ask for information as we had anticipated when we prepared our protocol. The two review authors resolved differences in study selection through discussion.
Data extraction and management
Two review authors independently extracted participant and intervention characteristics, details of study design and methods, and primary and secondary outcome data by using forms adapted from others developed by Cochrane Eyes and Vision. One review author entered data into RevMan (RevMan 2014), and a second review author verified the data entered. We resolved differences in data extraction by discussion. When desired data had not been reported or were represented only in graphic form, we had planned to contact trial report authors to request relevant data, or to use graph digitization software to estimate the numbers; however, it was not necessary to implement these strategies.
Assessment of risk of bias in included studies
Two review authors assessed each trial for potential bias according to the methods set out in Chapter 8 of the Cochrane Handbook for Systematic Reviews of Interventions (Higgins 2011). We considered the following "Risk of bias" domains.
-
Selection bias – random sequence generation and allocation concealment before randomization.
-
Performance bias – masking of participants and study personnel to the allocated intervention.
-
Detection bias – masking of outcome assessors during follow‐up examination for data related to primary and secondary outcomes.
-
Attrition bias – quantity of and reasons for incomplete or missing outcome data for each treatment group.
-
Reporting bias – evidence of selective outcome reporting.
-
Other sources of bias – support or funding for the study and potential conflicts of interests that could bias study results; other design flaws.
We classified each trial with respect to each "Risk of bias" domain as having "unclear risk," "low risk," or "high risk" of bias and provided documentation from trial reports to support our judgments. The two review authors resolved discrepancies in judgment through discussion and by asking a third review author to make the final judgment when they could not reach consensus.
Measures of treatment effect
We analyzed the primary and secondary outcome data analysis according to the methods described in our protocol (Sarwar 2014), which are in accordance with the guidance set out in Chapter 9 of the Cochrane Handbook for Systematic Reviews of Interventions (Deeks 2011). For the primary outcome (mean change in number of letters of BCVA at one year), we used the mean difference (MD) and corresponding 95% confidence interval (CI) to compare the mean change from baseline versus specific follow‐up time points between intervention groups. We calculated MDs and corresponding 95% CIs for other continuous outcomes, including mean change in number of letters of BCVA at two years; mean number of injections received during first year of the study; mean change in central retinal thickness at one year and at two years; and mean change in extent of CNV from baseline at one year and at two years.
We calculated risk ratios (RRs) and corresponding 95% CIs for dichotomous outcomes, including the proportion of participants who gained 15 or more letters of BCVA from baseline BCVA at one year and at two years; proportion of participants who lost 15 or more letters of BCVA from baseline BCVA at one year and at two years; proportion of participants with BCVA worse than 20/200 at one year and at two years; proportion of eyes with absence of fluid on OCT at one year and at two years; proportion of eyes with absence of leakage on fluorescein angiography at one year and at two years; proportion of participants with arterial thrombotic events at one year and at two years; proportion of participants with serious systemic adverse events at one year and at two years; and proportion of eyes with serious ocular adverse events at one year and at two years.
Unit of analysis issues
The unit of analysis was the individual participant (one study eye per participant).
Dealing with missing data
We planned to contact trial authors to ask for unreported or unclearly reported outcome data, such as data reported only in graph format, but it was not necessary to contact investigators of included trials. We did not impute data for the purposes of this review. Instead we documented outcomes with missing data and potential implications when we could not assume that data were missing at random.
Assessment of heterogeneity
We assessed clinical and methodological diversity among studies by reviewing participant characteristics and trial methods. We checked for statistical heterogeneity by using the I² statistic, which provides the percentage of variability in effect estimates that is due to heterogeneity rather than to sampling error (chance). We considered a value greater than 50% to indicate substantial statistical heterogeneity.
Assessment of reporting biases
We assessed risk of bias due to selective outcome reporting by comparing outcomes that the trial investigators intended to measure versus outcomes reported by trial authors. When available, we reviewed protocols, reports on trial design and methods, and clinical trial registers to determine intended outcomes. Otherwise, we compared outcomes measured as described in the Methods section versus outcomes reported in the Results section of published reports.
We planned to use funnel plots to assess for potential publication bias when 10 or more trials were included in a meta‐analysis; as this review included only two studies, it was not possible to implement this method.
Data synthesis
We used a fixed‐effect model, as only two trials were included in the meta‐analysis. If three or more trials had been included in a meta‐analysis, we planned to use a random‐effects model. We performed all statistical analyses using RevMan 5.3 (RevMan 2014). If we had detected considerable clinical, methodological, or statistical heterogeneity (I² > 50%), we planned not to perform a meta‐analysis but rather provide a narrative summary of study results. However, because two trials using identical study protocols were included, we conducted meta‐analysis even when statistical heterogeneity (I² > 50%) was indicated.
Subgroup analysis and investigation of heterogeneity
We planned to analyze different dose regimens of aflibercept versus the comparison intervention; however, we did not perform these subgroup analyses because different dose regimens were not evaluated by independent trials. We planned to perform subgroup analysis according to the comparison intervention reported in the included trials (eg, aflibercept vs placebo or sham injections, aflibercept vs ranibizumab); however, we did not perform these subgroup analyses, as only one comparison intervention (ranibizumab) was used in trials included in this review.
Sensitivity analysis
As included trials were too few, we did not conduct planned sensitivity analyses to assess the effects of excluding (1) trials judged to have high risk of bias as the result of incomplete outcome data or selective reporting, (2) unpublished trials, or (3) industry‐funded trials.
Summary of findings
We produced a "Summary of findings" table for outcomes at one year of follow‐up (summary of findings Table for the main comparison). Two review authors graded independently the overall certainty of evidence for each outcome using the GRADE (Grades of Recommendation, Assessment, Development, and Evaluation) classification (www.gradeworkinggroup.org/). The tables that we prepared include results for the following seven outcomes.
-
Mean change in number of letters from baseline BCVA.
-
Proportion of participants who gained 15 or more letters of BCVA from baseline.
-
Proportion of eyes with absence of fluid on OCT.
-
Proportion of eyes with absence of dye leakage on fluorescein angiography.
-
Quality of life.
-
Proportion of participants with serious systemic adverse events.
-
Proportion of eyes with serious ocular adverse events.
Results
Description of studies
Results of the search
Electronic searches yielded 9961 total records as of November 30, 2015. After removal of duplicates, we reviewed 7633 unique records. We assessed 13 records as "definitely relevant" or "possibly relevant" after screening titles and abstracts. Eight of these records were reports from two trials (VIEW 1; VIEW 2), both of which we included in the review (Figure 1). We excluded five records and provided reasons for exclusion in the Characteristics of excluded studies table.

Study flow diagram.
The VIEW 1 and VIEW 2 trials were two randomized, double‐masked, active‐controlled, phase 3 trials designed to assess the safety and efficacy of intravitreal aflibercept when used to treat patients with neovascular AMD. These two trials followed the same protocol; VIEW 1 included participants from 154 sites in Canada and the United States, and VIEW 2 included participants from 172 sites located elsewhere. Although data from both trials were reported in a single paper, these data were used to calculate separate estimates of one‐year outcomes. Two‐year outcomes were combined when reported.
We found no trials that compared aflibercept versus bevacizumab or sham intravitreal injections and met the inclusion criteria for this review.
Included studies
Types of participants
This review includes 2458 participants from two RCTs (VIEW 1, registered at clinicaltrials.gov NCT00509795; VIEW 2, registered at clinicaltrials.gov NCT00637377). VIEW 1 enrolled 1217 participants, and VIEW 2 enrolled 1240 participants. Criteria for participant selection common to the two RCTs included age 50 years or older, CNV lesions confirmed by fluorescein angiography, and BCVA score equivalent to 20/40 or worse. Both trials included one study eye per participant. Specific inclusion and exclusion criteria are described in greater detail in the Characteristics of included studies tables.
Types of interventions
Participants in VIEW 1 and VIEW 2 were randomly assigned to four cohorts: 0.5 mg aflibercept every four weeks (0.5q4), 2 mg aflibercept every four weeks (2q4), 2 mg aflibercept every eight weeks (2q8) following three monthly injections, and 0.5 mg ranibizumab every four weeks (Rq4). Both aflibercept and ranibizumab were administered by intravitreal injections, and the primary treatment period lasted one year (52 weeks). During the follow‐up phase ‐ from 52 weeks to 96 weeks ‐ all regimens were switched from a fixed monthly or bimonthly regimen to an as‐needed regimen with a minimum quarterly dosing ("capped PRN").
Types of outcome measures
Visual acuity outcomes
Both trials reported outcomes for best‐corrected visual acuity (BCVA), measured by using the Early Treatment Diabetic Retinopathy Study (ETDRS) chart, at one year and at two years. Investigators assessed BCVA outcomes by using multiple methods of aggregation, including mean change in number of letters, proportion of participants who gained 15 or more letters, and proportion of participants who maintained BCVA, defined by both trials as losing fewer than 15 letters. Neither trial reported the proportion of participants with BCVA worse than 20/200 at any time point.
Anatomic outcomes
Both trials used optical coherence tomography (OCT) to assess the proportion of eyes with absence of fluid at one‐year and two‐year follow‐up and mean change in central retinal thickness from baseline to one year and to two years. The two trials used fluorescein angiography to assess changes in CNV area from baseline to one year and two years. Neither trial reported the proportion of eyes with absence of leakage at any time point.
Mean number of injections
Both trials reported the mean number of injections received by each treatment group by one‐year and two‐year follow‐up. Treatment schedules were fixed for the first year in both trials (every four or eight weeks); therefore, this outcome will be biased on the basis of treatment group. For the second year of the trials, in which treatment schedules were switched to as‐needed dosing, this outcome was reported as the mean number of injections received between one‐year and two‐year follow‐up.
Quality‐of‐life outcomes
Both trials measured vision‐related quality‐of‐life outcomes by using the National Eye Institute Visual Function Questionnaire (NEI‐VFQ), and investigators measured outcomes as mean change from baseline in composite scores at one‐year follow‐up. They reported no data for two‐year follow‐up.
Adverse events
Both VIEW 1 and VIEW 2 reported information related to adverse events, including serious systemic adverse events (eg, death, arteriothrombotic events) and serious ocular adverse events (eg, severe visual acuity loss, retinal hemorrhage). We noted no variation between trials in the types of adverse events reported because the trials were designed similarly and used the same protocol.
Excluded studies
We excluded five studies after full‐text assessment. CLEAR‐AMD 1 examined various doses of aflibercept versus placebo following intravenous administration. This route of treatment is not used in practice, and although this study did compare aflibercept versus placebo ‐ a comparison we sought to review when drafting our protocol (Sarwar 2014) ‐ this comparison was not relevant to this review. We excluded one study because participants were not treatment‐naive (Zehetner 2015) and three studies that were not RCTs (Elshout 2014; Yoshida 2014; Zinkernagel 2015).
Risk of bias in included studies
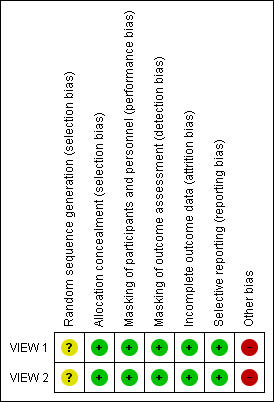
Because the two included RCTs used the same protocol and methods in different populations, "Risk of bias" assessments are the same for both trials (Figure 2). We assessed studies at low risk of bias for most domains. However, both trials were sponsored by the manufacturer of aflibercept; therefore, we assessed these trials at high risk of bias because of the funding source.

Risk of bias summary: review authors' judgements about each risk of bias item for each included study.
Allocation
We assessed these trials at low risk of selection bias. Participants were assigned to treatment groups according to a predetermined centralized randomization scheme with balanced allocation and managed by an interactive voice response system, minimizing the possibility of selection bias.
Masking (performance bias and detection bias)
We assessed these trials at low risk of performance and detection bias. Participants were masked to their particular treatment group. The only unmasked investigator was responsible for receipt, tracking, preparation, destruction, and administration of study drugs, as well as for safety assessments. All other study site personnel were masked to treatment assignment by separating of study records and masking of drug packaging.
Incomplete outcome data
The percentage of participants in each treatment group completing 52 weeks of follow‐up ranged from 91.1% to 96.4% in VIEW 1, and from 88.1 to 96.4% in VIEW 2. Trial investigators reported outcomes based on a full analysis set and a per protocol set by using the last observation carried forward (LOCF) approach to impute missing values. On the basis of these considerations, we assessed these trials at low risk of attrition bias.
Selective reporting
Both trials were registered on clinicaltrials.gov, where primary and secondary outcome measures were prespecified. Final reports of the two trials included all outcomes listed in the clinical trial register. Therefore, we assessed these trials at low risk of reporting bias.
Other potential sources of bias
Many of the corresponding trial authors were employees of or consultants to, or had received research funding from, the manufacturer of aflibercept, Regeneron Pharmaceuticals. Also, the manufacturer of aflibercept participated in trial design, collected and analyzed data, and prepared study reports. We judged this level of involvement to confer high risk of bias because the company may have been motivated to find aflibercept as an equal or superior treatment over ranibizumab, which is manufactured by a different company.
Effects of interventions
See: Summary of findings for the main comparison
Aflibercept vs no treatment, placebo, or sham
We found no trials in which aflibercept had been compared with no treatment or with placebo or sham intravitreal injections.
Aflibercept vs ranibizumab
To compare aflibercept versus ranibizumab for the treatment of patients with neovascular AMD, we performed meta‐analyses of one‐year results from VIEW 1 and VIEW 2. For these meta‐analyses, we combined data from all aflibercept treatment groups and compared them with data from ranibizumab groups. We reported together and summarized below two‐year results for VIEW 1 and VIEW 2.
Visual acuity outcomes
Mean change in BCVA
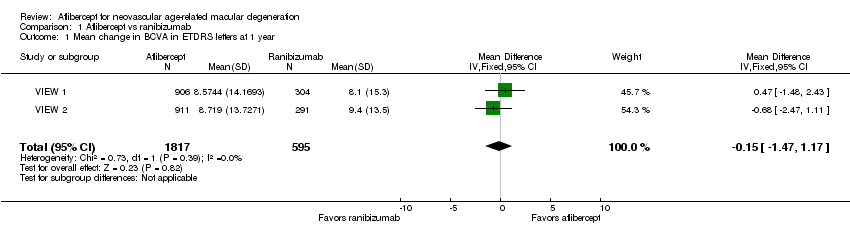
Both trials measured visual acuity using the ETDRS protocol. The mean difference (MD) in mean change in number of letters of BCVA from baseline to one year was less than one letter when aflibercept was compared with ranibizumab (MD ‐0.15, 95% CI ‐1.47 to 1.17; Analysis 1.1;Figure 3). Thus, eyes treated with aflibercept and ranibizumab showed similar gains in visual acuity at one year. We graded the quality of evidence for this outcome as high.
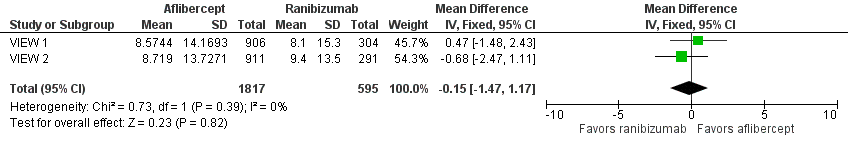
Forest plot of comparison: 1 Aflibercept vs ranibizumab, outcome: 1.1 Mean change in BCVA in ETDRS letters at 1 year.
At two years, the mean change in BCVA from baseline was 7.2 letters for the aflibercept groups versus 7.9 letters for the ranibizumab groups. Additional data regarding two‐year outcomes, such as standard deviation for the mean BCVA change, were not available for further analysis of this outcome.
Gain of 15 or more letters of BCVA
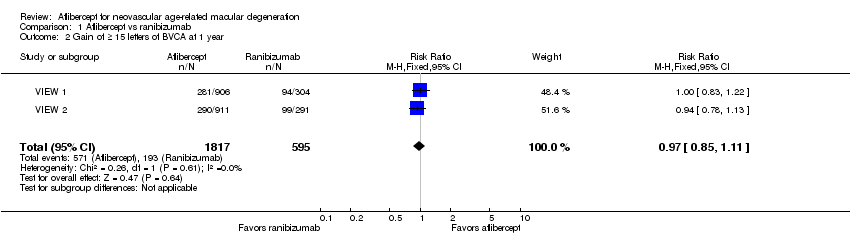
At one‐year follow‐up, the proportion of participants who gained 15 or more letters of BCVA was 31.4% in the aflibercept groups and 32.4% in the ranibizumab groups. For this outcome, a risk ratio (RR) greater than 1 favors treatment with aflibercept. The RR for the combined aflibercept groups versus the ranibizumab groups was 0.97 (95% CI 0.85 to 1.11), which indicates that similar proportions of participants in the aflibercept and ranibizumab groups showed large visual acuity gains (Analysis 1.2;Figure 4). We graded the quality of evidence for this outcome as high.

Forest plot of comparison: 1 Aflibercept vs ranibizumab, outcome: 1.2 Gain of ≥ 15 letters of BVCA at 1 year.
At two‐year follow‐up, 562 (30.9%) of 1817 participants in the aflibercept groups and 188 (31.6%) of 595 participants in the ranibizumab groups gained 15 or more letters from baseline. This outcome was comparable between the two groups (RR 0.98, 95% CI 0.85 to 1.12). We graded the quality of evidence for this outcome as high.
Loss of 15 or more letters of BCVA
At one‐year follow‐up, the proportion of participants who lost 15 or more letters of BCVA was 5.1% in the aflibercept groups and 5.7% in the ranibizumab groups. For this outcome, an RR less than 1 favors treatment with aflibercept, as it indicates that a higher proportion of participants lost letters of visual acuity ‐ a negative outcome ‐ in the ranibizumab groups (RR 0.89, 95% CI 0.61 to 1.30; Analysis 1.3). We graded the quality of evidence for this outcome as moderate due to imprecision.
Two‐year follow‐up reports for the combined VIEW 1 and VIEW 2 trials did not report on the proportion of participants who lost 15 or more letters of BCVA.
BCVA worse than 20/200
This outcome was not reported in the included studies at one year or at two years.
Anatomic outcomes
Absence of fluid on optical coherence tomography (OCT)
At one year, researchers found no significant difference between aflibercept and ranibizumab in the proportion of eyes who achieved dry retinas (absence of cystic intraretinal fluid and subretinal fluid on OCT). In VIEW 1, 61.0% of participants in the aflibercept groups and 63.6% of those in the ranibizumab group had no fluid evident on OCT images at one year; in VIEW 2, 64.4% in aflibercept groups and 55.7% in ranibizumab groups had no fluid. The RR for comparison of aflibercept and ranibizumab groups was 1.06 (95% CI 0.98 to 1.14; Analysis 1.4;Figure 5). We graded the quality of evidence for this outcome as high.

Forest plot of comparison: 1 Aflibercept vs ranibizumab, outcome: 1.4 Absence of fluid on optical coherence tomography (OCT) at 1 year.
At two years, only combined data from VIEW 1 and VIEW 2 were available. The proportion of participants with no retinal fluid evident on OCT images decreased in all treatment groups from one year to two years. A higher proportion of participants in the aflibercept groups (757/1520, 49.8%) showed absence of fluid on OCT compared with participants in the ranibizumab groups (231/508, 45.5%) (RR 1.10, 95% CI 0.98 1.22). We graded the quality of evidence for this outcome as high.
Absence of leakage on fluorescein angiography
The included studies reported no data for this outcome at one year or at two years.
Mean change in extent of choroidal neovascularization (CNV)
In these two trials, change in CNV area from baseline was measured in mm2. At one year, the MD in change in CNV area between aflibercept and ranibizumab groups was ‐0.24 mm2 (95% CI ‐0.78 to 0.29; Analysis 1.5). We graded the quality of evidence for this outcome as high.
Published analyses of combined data from VIEW 1 and VIEW 2 showed mean decreases in CNV area that were maintained from one‐year to two‐year follow‐up in all treatment groups; however, no data were provided for calculating the mean difference in changes in CNV area between groups at two years.
Mean change in central retinal thickness (CRT)
At one‐year follow‐up, the MD between aflibercept and ranibizumab was ‐4.94 µm (95% CI ‐15.48 to 5.61), which is neither a clinically nor statistically important difference (Analysis 1.6). We graded the quality of evidence for this outcome as high.
Investigators provided no data for calculating the mean difference in change in CRT between groups at two years.
Mean number of injections
The dosing schedule for all treatment groups was fixed for the first year of the trial (administered every four weeks or every eight weeks); therefore, we did not analyze data on the mean number of injections for one‐year follow‐up.
The mean number of injections during the "capped PRN" period of these trials (from the end of year one to the end of year two) was within one injection when aflibercept was compared with ranibizumab (MD ‐0.40, 95% CI ‐0.62 to ‐0.19). We graded the quality of evidence for this outcome as high.
Vision‐related quality‐of‐life (VRQoL)
In both VIEW 1 and VIEW 2, researchers assessed VRQoL by using the National Eye Institute Visual Function Questionnaire‐25 (NEI‐VFQ‐25). Composite scores range from 0 to 100, and higher scores represent higher visual functioning. Similar changes in NEI‐VFQ‐25 composite scores from baseline to one year were reported for both aflibercept and ranibizumab (MD ‐0.39, 95% CI ‐1.71 to 0.93; Analysis 1.7;Figure 6). We graded the quality of evidence for this outcome as high.

Forest plot of comparison: 1 Aflibercept vs ranibizumab, outcome: 1.7 Mean change in vision‐related quality‐of‐life scores at 1 year.
VRQoL data for two‐year follow‐up were not available.
Adverse events
For the VIEW studies (combined data from VIEW 1 and VIEW 2), 1.75% of participants in the aflibercept groups and 1.68% of those in the ranibizumab groups experienced any arterial thrombotic event, as defined by the Antiplatelet Trialists’ Collaboration (APTC), during the first year of follow‐up (RR 1.04, 95% CI 0.52 to 2.11; Analysis 1.8). At one year, the risk for vascular death was small (< 1%), with uncertainty regarding the effect between aflibercept groups and ranibizumab groups (RR 1.47, 95% CI 0.32 to 6.78; Analysis 1.8). Risks of non‐fatal myocardial infarction (RR 0.81, 95% CI 0.32 to 2.09) and non‐fatal stroke (RR 1.11, 95% CI 0.27 to 4.50) were also uncertain when aflibercept groups were compared with ranibizumab groups (Analysis 1.8).
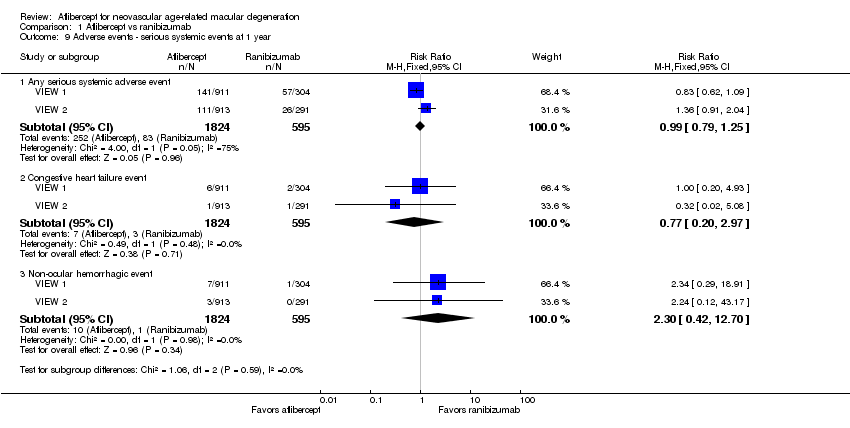
At one‐year follow‐up, the risk of any serious systemic adverse event was similar between aflibercept and ranibizumab groups (RR 0.99, 95% CI 0.79 to 1.25; Analysis 1.9). Congestive heart failure events were more frequent in the aflibercept group than in the ranibizumab group (RR 0.77, 95% CI 0.20 to 2.97; Analysis 1.9). Risk of a non‐ocular hemorrhagic event was lower in the aflibercept group than in the ranibizumab group (RR 2.30, 95% CI 0.42 to 12.70; Analysis 1.9).
At one‐year follow‐up, risk of any serious ocular adverse event was lower in the aflibercept group than in the ranibizumab group (RR 0.62, 95% CI 0.36 to 1.07; Analysis 1.10). Risk of visual acuity loss was similar between aflibercept and ranibizumab groups (RR 1.08, 95% CI 0.30 to 3.93), and risk of retinal hemorrhage was greater in the aflibercept group than in the ranibizumab group (RR 0.65, 95 % CI 0.16 to 2.60; Analysis 1.10).
Adverse event data from individual VIEW 1 and VIEW 2 trials were not available for analysis for two‐year outcomes. By two years, 3.3% (60/1824) of participants in the aflibercept group and 3.2% (19/595) of those in the ranibizumab group had experienced any arterial thrombotic event (RR 1.03, 95% CI 0.62 to 1.71). Risk for vascular death was 1.3% (24/1824) in the aflibercept group versus 0.5% (3/595) in the ranibizumab group (RR 2.61, 95% CI 0.79 to 8.64). Comparative risks of non‐fatal myocardial infarction (RR 0.68, 95% CI 0.34 to 1.34) and non‐fatal stroke (RR 0.85, 95% CI 0.30 to 2.37) were uncertain when aflibercept groups were compared with ranibizumab groups.
At two‐year follow‐up, the risk of any serious systemic adverse event was similar between aflibercept and ranibizumab groups (RR 0.98, 95% CI 0.83 to 1.15). Congestive heart failure events occurred in similar proportions in the aflibercept group and the ranibizumab group (RR 1.04, 95% CI 0.38 to 2.84). Non‐ocular hemorrhagic events occurred in less than one per cent of participants; these data were not reported for two‐year outcomes.
At two‐year follow‐up, the risk of any serious ocular adverse event was lower in the aflibercept group than in the ranibizumab group (RR 0.82, 95% CI 0.52 to 1.27). Risks of visual acuity loss (RR 0.91, 95% CI 0.33 to 2.53) and retinal hemorrhage (RR 1.06, 95 % CI 1.06 0.35 to 3.24) were similar between aflibercept and ranibizumab groups.
The small numbers of events led to risk estimates for these adverse events that are imprecise. As the result of imprecision, we graded the quality of evidence for all adverse events as moderate.
Aflibercept vs bevacizumab
We found no trials in which aflibercept had been compared with bevacizumab.
Discussion
Summary of main results
The two trials included in this systematic review were at low risk for most bias domains and demonstrated that benefits and harms of therapy with intravitreal aflibercept were similar to those with ranibizumab among participants with neovascular age‐related macular degeneration (AMD). Changes in visual acuity ‐ both gains and losses ‐ were similar among aflibercept‐ and ranibizumab‐treated eyes. Overall improvement in visual acuity correlated with anatomic improvements (eg, retinal thickening, choroidal neovascularization [CNV] size) for both agents. Although safety profiles (ocular and systemic) for aflibercept and ranibizumab were similar, and no safety signals were identified, neither VIEW 1 nor VIEW 2, alone or together, provided adequate power for precise evaluation of safety outcomes. Vision‐related quality‐of‐life outcomes correlated with clinical and anatomic outcomes. Scores and one‐year changes in scores were similar among aflibercept‐ and ranibizumab‐treated participants.
Aflibercept treatment regimens currently in use typically allow for intravitreal injections at eight‐week intervals with monthly monitoring. The decreased frequency of injections in comparison with ranibizumab and bevacizumab thus decreases the treatment burden and the potential for injection‐related complications. Ranibizumab and bevacizumab were the most commonly used treatments for neovascular AMD at the time the VIEW 1 and VIEW 2 studies were conducted. Analyses of available data indicate that aflibercept is equally effective and safe and may be considered as a first‐line treatment for patients with neovascular AMD because of the potential for fewer injections needed to achieve similar results.
Overall completeness and applicability of evidence
The goal of this review was to compare the effectiveness and safety of aflibercept for the treatment of patients with neovascular AMD versus ranibizumab, bevacizumab, or sham. Only data from randomized controlled trials (RCTs) with a minimum follow‐up of one year were selected for inclusion in this review. We found no trial in which aflibercept had been compared with bevacizumab or sham that met the eligibility criteria for this review. Thus, our analysis was limited to comparison of aflibercept and ranibizumab.
The primary outcome of this review was mean change from baseline in best‐corrected visual acuity (BCVA) (Early Treatment Diabetic Retinopathy Study [ETDRS] letters) to one‐year of follow‐up. Secondary outcomes included other visual acuity outcomes, morphologic characteristics assessed by optical coherence tomography (OCT) and fluorescein angiography, ocular and systemic adverse events, and vision‐related quality of life. We searched journal publications, conference abstracts, US Food and Drug Administration (FDA) documents, and clinical trial registers to identify relevant data.
For this review, we analyzed outcome data on 2457 participants from two large trials. VIEW 1 and VIEW 2 enrolled both men and women 50 years of age or older who had subfoveal neovascular AMD in the study eye, and were conducted in 174 countries on all continents except Africa and Antarctica.
Quality of the evidence
These studies were well designed; they evaluated both clinically relevant outcomes and patient‐important outcomes. We assessed the quality of evidence as high for most outcomes. Our analyses of outcomes consistently found no meaningful differences between aflibercept and ranibizumab. However, the numbers of participants included in the analyses of some infrequent outcomes, such as adverse events, were insufficient to rule out possible differences between treatments.
Potential biases in the review process
Two authors for this review were also investigators for the VIEW 1 and VIEW 2 trials and were authors of the reports from those studies. Other authors of this review were not affiliated with the included studies but are members of the department chaired by one of the VIEW 1 and VIEW 2 investigators/authors. Thus, this review has substantial potential for bias despite our efforts to provide an objective assessment and interpretation of available data.
It is important to note that both trials included in this review were sponsored by Regeneron Pharmaceuticals, the manufacturer of aflibercept. The company participated in trial design, collected and analyzed the data, and prepared the study reports for both trials.
Agreements and disagreements with other studies or reviews
Our clinical experience with aflibercept in the treatment of patients with neovascular AMD is consistent with the conclusions of this review ‐ that aflibercept provides similar visual acuity and morphologic outcomes with no excess of adverse events in comparison with ranibizumab. A review of the literature that summarized VIEW 1 and VIEW 2 findings concluded that "compared to current treatments, aflibercept has shown equal efficacy and safety" to ranibizumab (Thomas 2013). As of 2015, the American Academy of Ophthalmology has recommended anti‐vascular endothelial growth factor (VEGF) agents, including ranibizumab, bevacizumab, and aflibercept, as first‐line treatment for individuals with neovascular AMD (AAO 2015). A network meta‐analysis by Schmid et al comparing various anti‐VEGF agents and dosages estimated that standard doses of aflibercept (2 mg) and ranibizumab (0.5 mg) may perform slightly better than other doses of these agents (0.5 mg and 0.3 mg, respectively), bevacizumab (1.25 mg), and placebo with respect to visual acuity outcomes and serious adverse events at one‐year follow‐up (Schmid 2015).

Study flow diagram.
Risk of bias summary: review authors' judgements about each risk of bias item for each included study.

Forest plot of comparison: 1 Aflibercept vs ranibizumab, outcome: 1.1 Mean change in BCVA in ETDRS letters at 1 year.

Forest plot of comparison: 1 Aflibercept vs ranibizumab, outcome: 1.2 Gain of ≥ 15 letters of BVCA at 1 year.

Forest plot of comparison: 1 Aflibercept vs ranibizumab, outcome: 1.4 Absence of fluid on optical coherence tomography (OCT) at 1 year.

Forest plot of comparison: 1 Aflibercept vs ranibizumab, outcome: 1.7 Mean change in vision‐related quality‐of‐life scores at 1 year.
Comparison 1 Aflibercept vs ranibizumab, Outcome 1 Mean change in BCVA in ETDRS letters at 1 year.
Comparison 1 Aflibercept vs ranibizumab, Outcome 2 Gain of ≥ 15 letters of BVCA at 1 year.

Comparison 1 Aflibercept vs ranibizumab, Outcome 3 Loss of ≥ 15 letters of BVCA at 1 year.
Comparison 1 Aflibercept vs ranibizumab, Outcome 4 Absence of fluid on optical coherence tomography (OCT) at 1 year.

Comparison 1 Aflibercept vs ranibizumab, Outcome 5 Mean change in size of the choroidal neovascularization at 1 year.

Comparison 1 Aflibercept vs ranibizumab, Outcome 6 Mean change in central retinal thickness at 1 year.

Comparison 1 Aflibercept vs ranibizumab, Outcome 7 Mean change in vision‐related quality‐of‐life scores at 1 year.

Comparison 1 Aflibercept vs ranibizumab, Outcome 8 Adverse events ‐ arterial thrombotic events at 1 year.
Comparison 1 Aflibercept vs ranibizumab, Outcome 9 Adverse events ‐ serious systemic events at 1 year.

Comparison 1 Aflibercept vs ranibizumab, Outcome 10 Adverse events ‐ serious ocular events at 1 year.
| Aflibercept vs ranibizumab for neovascular age‐related macular degeneration | ||||||
| Patient or population: people with age‐related macular degeneration Settings: clinical centers Intervention: intravitreal injections of aflibercept Comparison: intravitreal injections of ranibizumab | ||||||
| Outcomes | Illustrative comparative risks* (95% CI) | Relative effect | Number of participants | Quality of the evidence | Comments | |
| Assumed risk | Corresponding risk | |||||
| Ranibizumab | Aflibercept | |||||
| Mean change in BCVA in ETDRS letters at 1 year (number of letters) | Mean change in visual acuity across ranibizumab groups ranged from gains of 8.57 letters to 8.71 letters | Mean change in visual acuity in aflibercept groups was on average 0.15 fewer letters gained (95% CI 1.47 fewer letters to 1.17 more letters) | MD ‐0.15 | 2412 | ⊕⊕⊕⊕ | |
| Gain of ≥ 15 letters of BVCA at 1 year | 324 per 1000 | 314 per 1000 | RR 0.97 | 2412 (2) | ⊕⊕⊕⊕ | |
| Absence of fluid on optical coherence tomography (OCT) at 1 year | 595 per 1000 | 630 per 1000 | RR 1.06 | 2291 (2) | ⊕⊕⊕⊕ | |
| Quality‐of‐life measures at 1 year (National Eye Institute‐Visual Function Questionnaire [NEI‐VFQ]) | Mean improvement in composite NEI‐VQF score ranged across control groups from 4.9 to 6.3 points | Mean improvement in composite NEI‐VQF score in intervention groups was on average 0.39 points lower (95% CI 1.71 points lower to 0.93 points higher) | MD ‐0.39 | 2412 (2) | ⊕⊕⊕⊕ | |
| Adverse events ‐ serious systemic events at 1 year | 139 per 1000 | 138 per 1000 | RR 0.99 (0.79 to 1.25) | 2419 (2) | ⊕⊕⊕⊝ | |
| Adverse events ‐ serious ocular events at 1 year | 32 per 1000 | 20 per 1000 | RR 0.62 (0.36 to 1.07) | 2419 (2) | ⊕⊕⊕⊝ | |
| *The basis for the assumed risk (eg, median control group risk across studies) is provided in footnotes. The corresponding risk (and its 95% confidence interval) is based on the assumed risk in the comparison group and the relative effect of the intervention (and its 95% CI). The unit of analysis is the individual (one study eye per person). | ||||||
| GRADE Working Group grades of evidence aAdverse events downgraded to moderate quality as the number of events is small (wide confidence intervals) | ||||||
| Outcome or subgroup title | No. of studies | No. of participants | Statistical method | Effect size |
| 1 Mean change in BCVA in ETDRS letters at 1 year Show forest plot | 2 | 2412 | Mean Difference (IV, Fixed, 95% CI) | ‐0.15 [‐1.47, 1.17] |
| 2 Gain of ≥ 15 letters of BVCA at 1 year Show forest plot | 2 | 2412 | Risk Ratio (M‐H, Fixed, 95% CI) | 0.97 [0.85, 1.11] |
| 3 Loss of ≥ 15 letters of BVCA at 1 year Show forest plot | 2 | 2412 | Risk Ratio (M‐H, Fixed, 95% CI) | 0.89 [0.61, 1.30] |
| 4 Absence of fluid on optical coherence tomography (OCT) at 1 year Show forest plot | 2 | 2291 | Risk Ratio (M‐H, Fixed, 95% CI) | 1.06 [0.98, 1.14] |
| 5 Mean change in size of the choroidal neovascularization at 1 year Show forest plot | 2 | 2412 | Mean Difference (IV, Fixed, 95% CI) | ‐0.24 [‐0.78, 0.29] |
| 6 Mean change in central retinal thickness at 1 year Show forest plot | 2 | 2412 | Mean Difference (IV, Fixed, 95% CI) | ‐4.94 [‐15.48, 5.61] |
| 7 Mean change in vision‐related quality‐of‐life scores at 1 year Show forest plot | 2 | 2412 | Mean Difference (IV, Fixed, 95% CI) | ‐0.39 [‐1.71, 0.93] |
| 8 Adverse events ‐ arterial thrombotic events at 1 year Show forest plot | 2 | Risk Ratio (M‐H, Fixed, 95% CI) | Subtotals only | |
| 8.1 Any Antiplatelet Trialists' Collaboration arterial thrombolytic event | 2 | 2419 | Risk Ratio (M‐H, Fixed, 95% CI) | 1.04 [0.52, 2.11] |
| 8.2 Vascular death | 2 | 2419 | Risk Ratio (M‐H, Fixed, 95% CI) | 1.47 [0.32, 6.78] |
| 8.3 Non‐fatal myocardial infarction | 2 | 2419 | Risk Ratio (M‐H, Fixed, 95% CI) | 0.81 [0.32, 2.09] |
| 8.4 Non‐fatal stroke | 2 | 2419 | Risk Ratio (M‐H, Fixed, 95% CI) | 1.11 [0.27, 4.50] |
| 9 Adverse events ‐ serious systemic events at 1 year Show forest plot | 2 | Risk Ratio (M‐H, Fixed, 95% CI) | Subtotals only | |
| 9.1 Any serious systemic adverse event | 2 | 2419 | Risk Ratio (M‐H, Fixed, 95% CI) | 0.99 [0.79, 1.25] |
| 9.2 Congestive heart failure event | 2 | 2419 | Risk Ratio (M‐H, Fixed, 95% CI) | 0.77 [0.20, 2.97] |
| 9.3 Non‐ocular hemorrhagic event | 2 | 2419 | Risk Ratio (M‐H, Fixed, 95% CI) | 2.30 [0.42, 12.70] |
| 10 Adverse events ‐ serious ocular events at 1 year Show forest plot | 2 | Risk Ratio (M‐H, Fixed, 95% CI) | Subtotals only | |
| 10.1 Any serious ocular adverse event | 2 | 2419 | Risk Ratio (M‐H, Fixed, 95% CI) | 0.62 [0.36, 1.07] |
| 10.2 Visual acuity reduced | 2 | 2419 | Risk Ratio (M‐H, Fixed, 95% CI) | 1.08 [0.30, 3.93] |
| 10.3 Retinal hemorrhage | 2 | 2419 | Risk Ratio (M‐H, Fixed, 95% CI) | 0.65 [0.16, 2.60] |