Radioterapia de haz externo para el carcinoma hepatocelular no resecable
Información
- DOI:
- https://doi.org/10.1002/14651858.CD011314.pub2Copiar DOI

- Base de datos:
-
- Cochrane Database of Systematic Reviews
- Versión publicada:
-
- 07 marzo 2017see what's new
- Tipo:
-
- Intervention
- Etapa:
-
- Review
- Grupo Editorial Cochrane:
-
Grupo Cochrane de Hepatobiliar
- Copyright:
-
- Copyright © 2017 The Cochrane Collaboration. Published by John Wiley & Sons, Ltd.
Cifras del artículo
Altmetric:
Citado por:
Autores
Contributions of authors
Omar Abdel‐Rahman: Collecting the data, performing the analyses, and writing the review.
Zeinab Elsayed: Collecting the data and revising the review.
Both authors agreed to the final version of the review submitted for publication.
Sources of support
Internal sources
-
None, Other.
External sources
-
None, Other.
Declarations of interest
Omar Abdel‐Rahman: none known.
Zeinab Elsayed: none known.
Acknowledgements
To the Cochrane Hepato‐Biliary Group and its supporting editorial team.
Special thanks go to Dr. Rouhan Wu (China) for translating the Chinese articles.
Peer Reviewers: Francesco Dionisi, Italy; Zehaui Wen, China.
Contact Editors: Rosa Simonetti, Italy; Christian Gluud, Denmark.
Sign‐off Editor: Christian Gluud, Denmark.
Cochrane Review Group funding acknowledgement: The Danish State is the largest single funder of the Cochrane Hepato‐Biliary Group through its investment in The Copenhagen Trial Unit, Centre for Clinical Intervention Research, Rigshospitalet, Copenhagen University Hospital, Denmark. Disclaimer: The views and opinions expressed in this review are those of the authors and do not necessarily reflect those of the Danish State or The Copenhagen Trial Unit.
Version history
| Published | Title | Stage | Authors | Version |
| 2017 Mar 07 | External beam radiotherapy for unresectable hepatocellular carcinoma | Review | Omar Abdel‐Rahman, Zeinab Elsayed | |
| 2014 Sep 18 | External beam radiotherapy for unresectable hepatocellular carcinoma | Protocol | Omar M Abdel‐Rahman, Zeinab Elsayed | |
Differences between protocol and review
We added 'liver‐related adverse events' as a secondary outcome because we considered it to be an important additional point to clarify in any analysis of local or systemic therapies for hepatocellular carcinoma.
Keywords
MeSH
Medical Subject Headings (MeSH) Keywords
- Alanine Transaminase [blood];
- Bilirubin [blood];
- Carcinoma, Hepatocellular [enzymology, pathology, *radiotherapy];
- Cause of Death;
- Chemoembolization, Therapeutic [mortality];
- Combined Modality Therapy [methods, mortality];
- Liver Neoplasms [enzymology, pathology, *radiotherapy];
- Radiotherapy [methods, mortality];
- Randomized Controlled Trials as Topic;
Medical Subject Headings Check Words
Female; Humans; Male; Middle Aged;
PICO
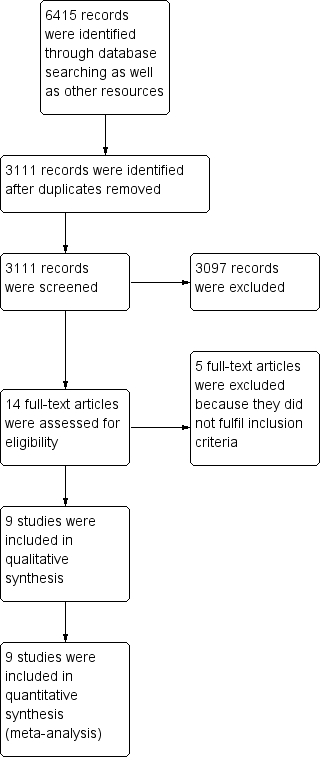
Study flow diagram.

Risk of bias graph: review authors' judgements about each risk of bias item presented as percentages across all included studies.

Risk of bias summary: review authors' judgements about each risk of bias item for each included study.

Trial Sequential Analysis comparing external beam radiotherapy (EBRT) plus transarterial chemoembolisation (TACE) versus TACE alone on the outcome 'all‐cause mortality at one year'. A subgroup of studies used three‐dimensional conformal radiotherapy. The diversity‐adjusted required information size (DARIS) of n = 1029 patients was calculated based upon a proportion of mortality of 50.3% of patients in the TACE group, a relative risk reduction of 20% in the EBRT + TACE group, an alpha (type I error) of 5%, a beta (type II error) of 10%, and a diversity of 0%. The blue curve presents the cumulative meta‐analysis Z‐score, and the inward‐sloping dotted red curves present the adjusted threshold for statistical significance according to the two‐sided trial sequential monitoring boundaries.

Trial Sequential Analysis comparing external beam radiotherapy (EBRT) versus transarterial chemoembolisation (TACE) on the outcome 'all‐cause mortality at one year'. The diversity‐adjusted required information size (DARIS) of n = 808 patients was calculated based upon a proportion of mortality of 57% of patients in the TACE group, a relative risk reduction of 20% in the EBRT group, an alpha (type I error) of 5%, a beta (type II error) of 10%, and a diversity of 0%. The blue curve presents the cumulative meta‐analysis Z‐score, and the inward‐sloping dotted red curves present the adjusted threshold for statistical significance according to the two‐sided trial sequential monitoring boundaries.

Trial Sequential Analysis comparing external beam radiotherapy (EBRT) plus transarterial chemoembolisation (TACE) versus TACE alone on the outcome 'complete response plus partial response ‐ subgroup of studies using three‐dimensional conformal radiotherapy'. The diversity‐adjusted required information size (DARIS) of n = 951 patients was calculated based upon a proportion of response of 52.5% of patients in the TACE group, a relative risk reduction of 20% in the TACE + EBRT group, an alpha (type I error) of 5%, a beta (type II error) of 10%, and a diversity of 0%. The blue curve presents the cumulative meta‐analysis Z‐score, and the inward‐sloping red curves present the adjusted threshold for statistical significance according to the two‐sided trial sequential monitoring boundaries.
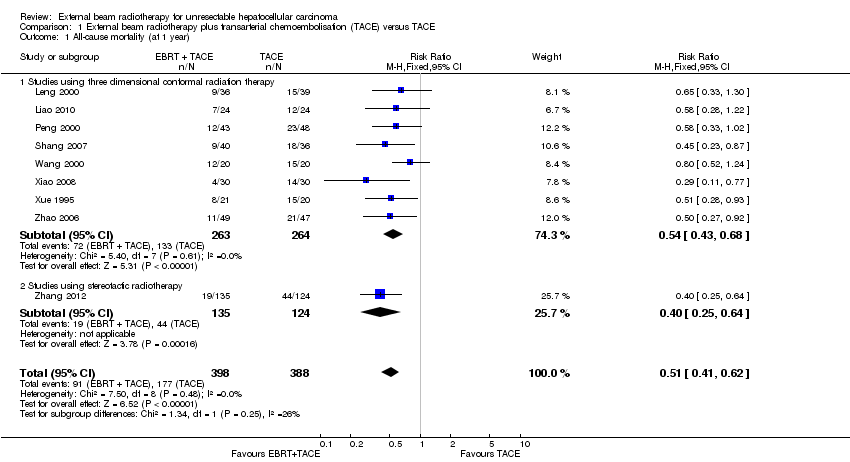
Comparison 1 External beam radiotherapy plus transarterial chemoembolisation (TACE) versus TACE, Outcome 1 All‐cause mortality (at 1 year).

Comparison 1 External beam radiotherapy plus transarterial chemoembolisation (TACE) versus TACE, Outcome 2 Complete response.

Comparison 1 External beam radiotherapy plus transarterial chemoembolisation (TACE) versus TACE, Outcome 3 Complete response + partial response.

Comparison 1 External beam radiotherapy plus transarterial chemoembolisation (TACE) versus TACE, Outcome 4 Elevated alanine aminotransferase.
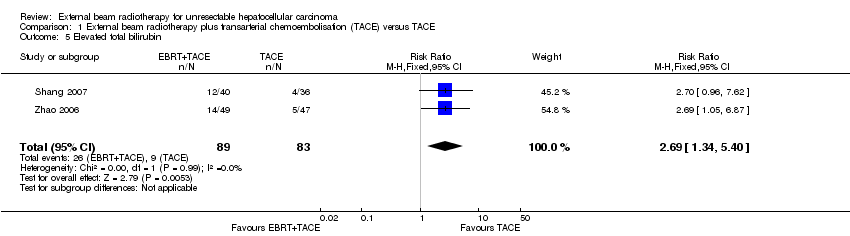
Comparison 1 External beam radiotherapy plus transarterial chemoembolisation (TACE) versus TACE, Outcome 5 Elevated total bilirubin.
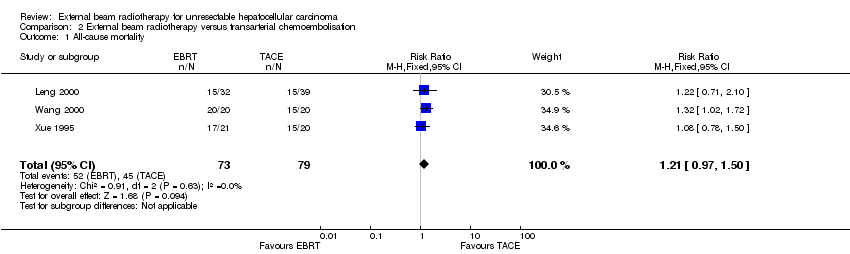
Comparison 2 External beam radiotherapy versus transarterial chemoembolisation, Outcome 1 All‐cause mortality.
| External beam radiotherapy (EBRT) plus transarterial chemoembolisation(TACE) versus TACE alone for unresectable hepatocellular carcinoma | ||||||
| Patient or population: people with unresectable hepatocellular carcinoma | ||||||
| Outcomes | Anticipated absolute effects* (95% CI) | Relative effect | № of participants | Quality of the evidence | Comments | |
| Risk with TACE | Risk with EBRT + TACE | |||||
| All‐cause mortality (at maximum 1‐year follow‐up) | Study population | RR 0.51 | 786 | ⊕⊕⊝⊝ | ||
| 456 per 1000 | 233 per 1000 | |||||
| Health‐related quality of life | No data were available for this outcome. | |||||
| Serious adverse events | No data were available for this outcome. | |||||
| Complete response plus partial response Length of follow‐up: 1 year | Study population | RR 1.58 | 620 | ⊕⊕⊝⊝ | ||
| 518 per 1000 | 819 per 1000 | |||||
| Elevated alanine aminotransferase Length of follow‐up: 1 year | Study population | RR 1.41 | 232 | ⊕⊝⊝⊝ | ||
| 319 per 1000 | 449 per 1000 | |||||
| Elevated total bilirubin Length of follow‐up: 1 year | Study population | RR 2.69 | 172 | ⊕⊝⊝⊝ | ||
| 108 per 1000 | 292 per 1000 | |||||
| *The risk in the intervention group (and its 95% confidence interval) is based on the assumed risk in the comparison group and the relative effect of the intervention (and its 95% CI). | ||||||
| GRADE Working Group grades of evidence | ||||||
| 1Downgraded two levels (‐2) due to: i) within‐study risk of bias: high risk of bias in all included trials; ii) publication bias: cannot be assessed. | ||||||
| External beam radiotherapy (EBRT) versus transarterial chemoembolisation(TACE) for unresectable hepatocellular carcinoma | ||||||
| Patient or population: people with unresectable hepatocellular carcinoma | ||||||
| Outcomes | Anticipated absolute effects* (95% CI) | Relative effect | № of participants | Quality of the evidence | Comments | |
| Risk with TACE | Risk with EBRT | |||||
| All‐cause mortality (at 1 year) | Study population | RR 1.21 | 152 | ⊕⊝⊝⊝ | ||
| 570 per 1000 | 689 per 1000 | |||||
| Serious adverse events | No data were available for this outcome. | |||||
| Complete response plus partial response Length of follow‐up: 1 year | 10 out of 20 trial participants attained partial response in the TACE arm. | 3 out of 21 trial participants attained a response in the EBRT arm. | ‐ | 41 (1 RCT) | ⊕⊝⊝⊝ | |
| Elevated alanine aminotransferase | No data were available for this outcome. | |||||
| Elevated total bilirubin | No data were available for this outcome. | |||||
| *The risk in the intervention group (and its 95% confidence interval) is based on the assumed risk in the comparison group and the relative effect of the intervention (and its 95% CI). | ||||||
| GRADE Working Group grades of evidence | ||||||
| 1Downgraded three levels (‐3) due to i) within‐study risk of bias: high risk of bias in all included trials; ii) publication bias: cannot be assessed; iii) imprecision: small number of trials. | ||||||
| Examples from table | Explanation |
| Outcomes | The tables provide the findings for the most important outcomes for someone making a decision. These include potential benefits and harms, whether the included studies provide data for these outcomes or not. Additional findings may be reported elsewhere in the review. |
| Assumed control group risk | Assumed control group risks can be based either on the control group risks reported in the included studies or on epidemiological data from elsewhere. When only one control group risk is provided, it is normally the median control group risk across the studies that provided data for that outcome. Risk is the probability of an outcome occurring. The control group risk is the risk of an outcome occurring in the comparison group (without the intervention). |
| Corresponding intervention group risk | Risk is the probability of an outcome occurring. The intervention group risk is the risk of an outcome occurring in the group receiving the intervention. |
| Relative effect | Relative effect or RR (risk ratio) Relative effects are ratios. Here the relative effect is expressed as a risk ratio. Risk is the probability of an outcome occurring. A RR is the ratio between the risk in the intervention group and the risk in the control group. If the risk in the control group is 10% (100 per 1000) and the risk in the intervention group is 1% (10 per 1000), the RR is 10/100 or 0.10. If the RR is exactly 1.0, this means that there is no difference between the occurrence of the outcome in the intervention and the control group. It is unusual for the RR to be exactly 1.0, and understanding what it means if it is above or below this value depends on whether the outcome being counted is judged to be good or bad. If the RR is greater than 1.0, the intervention increases the risk of the outcome. If it is a good outcome (e.g. the birth of a healthy baby), a RR > 1.0 indicates a desirable effect for the intervention, whereas if the outcome is bad (e.g. death), a RR > 1.0 indicates an undesirable effect. If the RR is less than 1.0, the intervention decreases the risk of the outcome. This indicates a desirable effect if it is a bad outcome (e.g. death) and an undesirable effect if it is a good outcome (e.g. birth of a healthy baby). |
| What is the difference between absolute and relative effects? The effect of an intervention can be described by comparing the risk of the intervention group with the risk of the control group. Such a comparison can be made in different ways. One way to compare two risks is to calculate the difference between the risks. This is the absolute effect. Consider the risk for blindness in a person with diabetes over a five‐year period. If the risk for blindness is found to be 20 in 1000 (2%) in a group of people treated conventionally and 10 in 1000 (1%) in people treated with a new drug, the absolute effect is derived by subtracting the intervention group risk from the control group risk: 2% ‐ 1% = 1%. Expressed in this way, it can be said that the new drug reduces the five‐year risk for blindness by 1% (absolute effect is 10 fewer per 1000). Another way to compare risks is to calculate the ratio of the two risks. Given the data above, the relative effect is derived by dividing the two risks, with the intervention risk being divided by the control risk: 1% ÷ 2% = ½ (0.50). Expressed in this way, as the 'relative effect', the five‐year risk for blindness with the new drug is 1/2 the risk with the conventional drug. Here the table presents risks as x per 1000 (or 100, etc.) instead of %, as this tends to be easier to understand. Whenever possible, the table presents the relative effect as the RR. The absolute effect is usually different for groups that are at high and low risk, whereas the relative effect is often the same, therefore, when it is relevant, we have reported indicative risks for groups at different levels of risk. Two or three indicative control group risks and the corresponding intervention group risks are presented when there are important differences across different populations. | |
| Mean difference | The mean difference (MD) is the average difference between the intervention group and the control group across studies. Here a weighted MD is used, which means the results of some of the studies make a greater contribution to the average than the results of others. Studies with more precise estimates for their results (narrower confidence intervals) are given more weight. This way of measuring effect is used when combining or comparing data for continuous outcomes such as weight, blood pressure, or pain measured on a scale. When different scales are used to measure the same outcome, e.g. different pain scales, a standardised mean difference (SMD) may be provided. This is a weighted mean difference standardised across studies giving the average difference in standard deviations for the measures of that outcome. |
| Confidence interval | A confidence interval (CI) is a range around an estimate that conveys how precise the estimate is; in this example the result is the estimate of the intervention group risk. The CI is a guide to how sure we can be about the quantity we are interested in (here the true absolute effect). The narrower the range between the two numbers, the more confident we can be about what the true value is; the wider the range, the less sure we can be. The width of the CI reflects the extent to which chance may be responsible for the observed estimate (with a wider interval reflecting more chance). |
| 95% confidence interval | As explained above, the CI indicates the extent to which chance may be responsible for the observed numbers. In the simplest terms, a 95% CI means that we can be 95% confident that the true size of effect is between the lower and upper confidence limit (e.g. 0 and 3 in the blindness drugs example mentioned above). Conversely, there is a 5% chance that the true effect is outside of this range. |
| Not statistically significant | Statistically significant means that a result is unlikely to have occurred by chance. The usual threshold for this judgement is that the results, or more extreme results, would occur by chance with a probability of less than 0.05 if the null hypothesis (no effect) was true. When results are not statistically significant, as in this example, this is stated to alert users to the possibility that the results may have occurred by chance. |
| No. of participants (studies) | The table provides the total number of participants across studies and the number of studies that provided data for that outcome. This indicates how much evidence there is for the outcome. |
| Quality of the evidence | The quality of the evidence is a judgement about the extent to which we can be confident that the estimates of effect are correct. These judgements are made using the GRADE system, and are provided for each outcome. The judgements are based on the type of study design (randomised trials versus observational studies), the risk of bias, the consistency of the results across studies, and the precision of the overall estimate across studies. For each outcome, the quality of the evidence is rated as high, moderate, low, or very low using the following definitions:
|
| ‐ | A "‐" indicates that the information is not relevant. |
| Outcome or subgroup title | No. of studies | No. of participants | Statistical method | Effect size |
| 1 All‐cause mortality (at 1 year) Show forest plot | 9 | 786 | Risk Ratio (M‐H, Fixed, 95% CI) | 0.51 [0.41, 0.62] |
| 1.1 Studies using three dimensional conformal radiation therapy | 8 | 527 | Risk Ratio (M‐H, Fixed, 95% CI) | 0.54 [0.43, 0.68] |
| 1.2 Studies using stereotactic radiotherapy | 1 | 259 | Risk Ratio (M‐H, Fixed, 95% CI) | 0.40 [0.25, 0.64] |
| 2 Complete response Show forest plot | 7 | 620 | Risk Ratio (M‐H, Fixed, 95% CI) | 2.14 [1.47, 3.13] |
| 2.1 Studies using three dimensional conformal radiation therapy | 6 | 361 | Risk Ratio (M‐H, Fixed, 95% CI) | 2.13 [1.34, 3.37] |
| 2.2 Studies using stereotactic radiotherapy | 1 | 259 | Risk Ratio (M‐H, Fixed, 95% CI) | 2.17 [1.12, 4.21] |
| 3 Complete response + partial response Show forest plot | 7 | 620 | Risk Ratio (M‐H, Fixed, 95% CI) | 1.58 [1.40, 1.78] |
| 3.1 Studies using three dimensional conformal radiation therapy | 6 | 361 | Risk Ratio (M‐H, Fixed, 95% CI) | 1.53 [1.31, 1.79] |
| 3.2 Studies using stereotactic radiotherapy | 1 | 259 | Risk Ratio (M‐H, Fixed, 95% CI) | 1.65 [1.36, 1.99] |
| 4 Elevated alanine aminotransferase Show forest plot | 3 | 232 | Risk Ratio (M‐H, Fixed, 95% CI) | 1.41 [1.08, 1.84] |
| 5 Elevated total bilirubin Show forest plot | 2 | 172 | Risk Ratio (M‐H, Fixed, 95% CI) | 2.69 [1.34, 5.40] |
| Outcome or subgroup title | No. of studies | No. of participants | Statistical method | Effect size |
| 1 All‐cause mortality Show forest plot | 3 | 152 | Risk Ratio (M‐H, Fixed, 95% CI) | 1.21 [0.97, 1.50] |