Fototerapia para la prevención del trastorno afectivo estacional
Información
- DOI:
- https://doi.org/10.1002/14651858.CD011269.pub2Copiar DOI

- Base de datos:
-
- Cochrane Database of Systematic Reviews
- Versión publicada:
-
- 08 noviembre 2015see what's new
- Tipo:
-
- Intervention
- Etapa:
-
- Review
- Grupo Editorial Cochrane:
-
Grupo Cochrane de Trastornos mentales comunes
- Copyright:
-
- Copyright © 2015 The Cochrane Collaboration. Published by John Wiley & Sons, Ltd.
Cifras del artículo
Altmetric:
Citado por:
Autores
Contributions of authors
GG and BN drafted and revised the protocol. MvN ran scoping searches. BG, JS, DW and CF provided clinical expertise for the Background section. GG, DW, JS, BG, CF, AG, AK, JW, LL, MvN, LM, and JH reviewed the protocol and provided feedback on individual drafts. JH was responsible for project management.
Sources of support
Internal sources
-
Internal funds of Cochrane Austria, Austria, Other.
External sources
-
No sources of support supplied
Declarations of interest
Barbara Nussbaumer ‐ no conflict of interest
Angela Kaminski‐Hartenthaler ‐ no conflict of interest
Catherine A Forneris ‐ no conflict of interest
Laura C Morgan ‐ no conflict of interest
Jeffrey H Sonis ‐ no conflict of interest
Bradley N Gaynes ‐ no conflict of interest
Amy Greenblatt ‐ no conflict of interest
Jörg Wipplinger ‐ no conflict of interest
Linda J Lux ‐ no conflict of interest
Dietmar Winkler ‐ no conflict of interest
Megan G Van Noord ‐ no conflict of interest
Julia Hofmann ‐ During the course of this review, Julia Hofmann became an employee of AstraZeneca, a pharmaceutical company that does not produce any products relevant for the prevention or treatment of seasonal affective disorder. We would like to point out though, that her current employment is in conflict with the Cochrane Commercial Sponsorship policy. Ms Hofmann will not take part in any future updates of the reviews.
Gerald Gartlehner ‐ no conflict of interest
Acknowledgements
We would like to thank Evelyn Auer for providing administrative support during the course of this study.
CRG Funding Acknowledgement:
The National Institute for Health Research (NIHR) is the largest single funder of the Cochrane Depression, Anxiety and Neurosis Group.
Disclaimer:
Views and opinions expressed herein are those of the review authors and do not necessarily reflect those of NIHR, NHS or the Department of Health.
Version history
| Published | Title | Stage | Authors | Version |
| 2019 Mar 18 | Light therapy for preventing seasonal affective disorder | Review | Barbara Nussbaumer‐Streit, Catherine A Forneris, Laura C Morgan, Megan G Van Noord, Bradley N Gaynes, Amy Greenblatt, Jörg Wipplinger, Linda J Lux, Dietmar Winkler, Gerald Gartlehner | |
| 2015 Nov 08 | Light therapy for preventing seasonal affective disorder | Review | Barbara Nussbaumer, Angela Kaminski‐Hartenthaler, Catherine A Forneris, Laura C Morgan, Jeffrey H Sonis, Bradley N Gaynes, Amy Greenblatt, Jörg Wipplinger, Linda J Lux, Dietmar Winkler, Megan G Van Noord, Julia Hofmann, Gerald Gartlehner | |
| 2014 Sep 02 | Light therapy for preventing seasonal affective disorder | Protocol | Barbara Nussbaumer, Angela Kaminski‐Hartenthaler, Catherine A Forneris, Laura C Morgan, Jeffrey H Sonis, Bradley N Gaynes, Amy Greenblatt, Jörg Wipplinger, Linda J Lux, Julia Hofmann, Dietmar Winkler, Megan G Van Noord, Gerald Gartlehner | |
Differences between protocol and review
In the protocol, we planned to contact the authors of publications to request missing results. As the only included study was published more than 20 years ago, we did not contact the study author.
Keywords
MeSH
Medical Subject Headings (MeSH) Keywords
Medical Subject Headings Check Words
Adult; Humans;
PICO

PRISMA flow diagram.
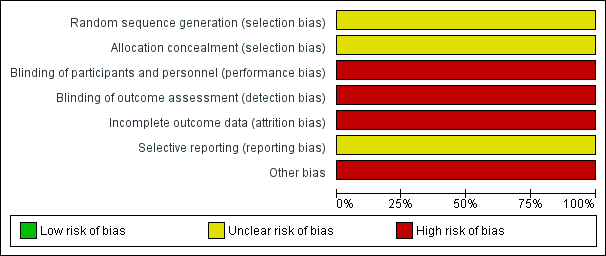
Risk of bias graph: review authors' judgements about each risk of bias item presented as percentages across included studies.
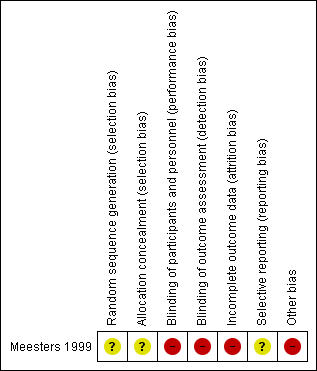
Risk of bias summary: review authors' judgements about each risk of bias item for the included study.

Comparison 1 Bright light therapy vs no light therapy, Outcome 1 Incidence of SAD (per protocol analysis).
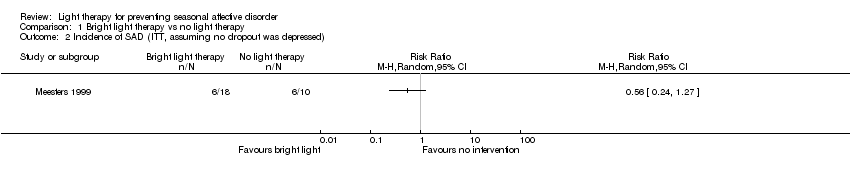
Comparison 1 Bright light therapy vs no light therapy, Outcome 2 Incidence of SAD (ITT, assuming no dropout was depressed).

Comparison 1 Bright light therapy vs no light therapy, Outcome 3 Incidence of SAD (ITT, assuming all dropouts were depressed).
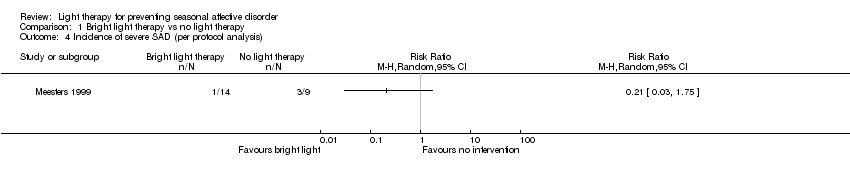
Comparison 1 Bright light therapy vs no light therapy, Outcome 4 Incidence of severe SAD (per protocol analysis).

Comparison 1 Bright light therapy vs no light therapy, Outcome 5 Incidence of severe SAD (ITT, assuming no dropout was depressed).
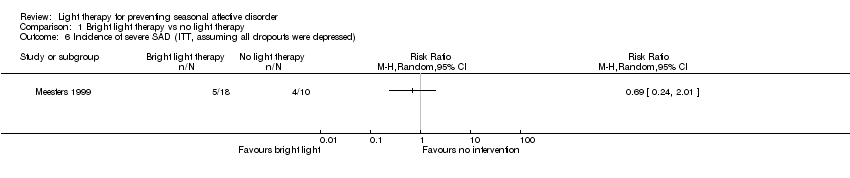
Comparison 1 Bright light therapy vs no light therapy, Outcome 6 Incidence of severe SAD (ITT, assuming all dropouts were depressed).

Comparison 1 Bright light therapy vs no light therapy, Outcome 7 Overall rate of discontinuation.

Comparison 2 Infrared light therapy vs no light therapy, Outcome 1 Incidence of SAD (per protocol analysis).

Comparison 2 Infrared light therapy vs no light therapy, Outcome 2 Incidence of SAD (ITT, assuming no dropout was depressed).

Comparison 2 Infrared light therapy vs no light therapy, Outcome 3 Incidence of SAD (ITT, assuming all dropouts were depressed).

Comparison 2 Infrared light therapy vs no light therapy, Outcome 4 Incidence of severe SAD (per protocol analysis).

Comparison 2 Infrared light therapy vs no light therapy, Outcome 5 Incidence of severe SAD (ITT, assuming no dropout was depressed).

Comparison 2 Infrared light therapy vs no light therapy, Outcome 6 Incidence of severe SAD (ITT, assuming all dropouts were depressed).
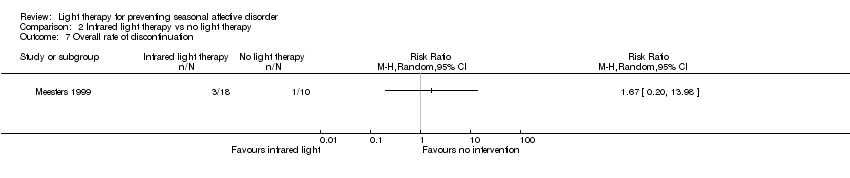
Comparison 2 Infrared light therapy vs no light therapy, Outcome 7 Overall rate of discontinuation.

Comparison 3 Light therapy (bright white and infrared) vs no light therapy, Outcome 1 Incidence of SAD (per protocol analysis).
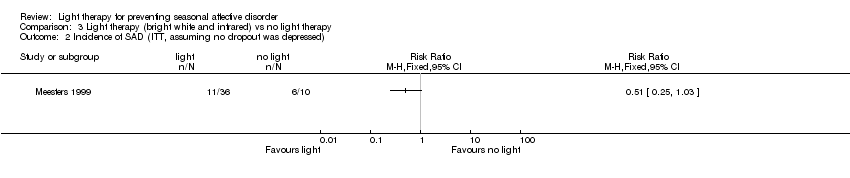
Comparison 3 Light therapy (bright white and infrared) vs no light therapy, Outcome 2 Incidence of SAD (ITT, assuming no dropout was depressed).

Comparison 3 Light therapy (bright white and infrared) vs no light therapy, Outcome 3 Incidence of SAD (ITT, assuming all dropouts were depressed).

Comparison 3 Light therapy (bright white and infrared) vs no light therapy, Outcome 4 Incidence of severe SAD (per protocol analysis).

Comparison 3 Light therapy (bright white and infrared) vs no light therapy, Outcome 5 Incidence of severe SAD (ITT, assuming no dropout was depressed).

Comparison 3 Light therapy (bright white and infrared) vs no light therapy, Outcome 6 Incidence of severe SAD (ITT, assuming all dropouts were depressed).

Comparison 3 Light therapy (bright white and infrared) vs no light therapy, Outcome 7 Overall discontinuation.
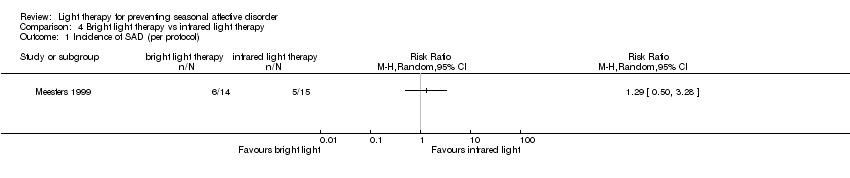
Comparison 4 Bright light therapy vs infrared light therapy, Outcome 1 Incidence of SAD (per protocol).

Comparison 4 Bright light therapy vs infrared light therapy, Outcome 2 Incidence of SAD (ITT, assuming no dropout was depressed).

Comparison 4 Bright light therapy vs infrared light therapy, Outcome 3 Incidence of SAD (ITT, assuming all dropouts were depressed).
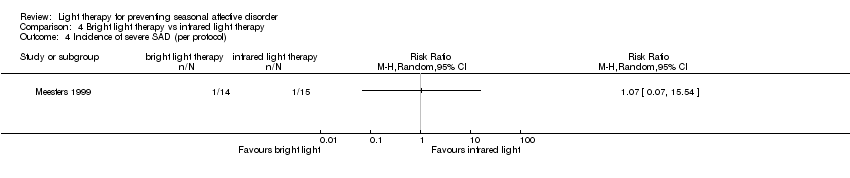
Comparison 4 Bright light therapy vs infrared light therapy, Outcome 4 Incidence of severe SAD (per protocol).

Comparison 4 Bright light therapy vs infrared light therapy, Outcome 5 Incidence of severe SAD (ITT, assuming no dropout was depressed).

Comparison 4 Bright light therapy vs infrared light therapy, Outcome 6 Incidence of severe SAD (ITT, assuming all dropouts were depressed).

Comparison 4 Bright light therapy vs infrared light therapy, Outcome 7 Overall discontinuation.
| Bright white light therapy compared with no light therapy for prevention of SAD | ||||||
| Patient or population: All participants were known SAD patients who had been successfully treated with conventional light therapy in previous winters | ||||||
| Outcomes | Illustrative comparative risks* (95% CI) | Relative effect | Number of participants | Quality of the evidence | Comments | |
| Assumed risk | Corresponding risk | |||||
| No light therapy | Light therapy | |||||
| Incidence of SAD (SIGH‐SAD score ≥ 20) (follow‐up 26 weeks) | Low | RR 0.64 | 23 | ⊕⊝⊝⊝ | ||
| 300 per 1000 | 192 per 1000 | |||||
| Moderate | ||||||
| 500 per 1000 | 320 per 1000 (150 to 690) | |||||
| High | ||||||
| 600 per 1000 | 276 per 1000 (210 to 966) | |||||
| Incidence of severe SAD (SIGH‐SAD‐SR (≥ 40)) (follow‐up 26 weeks) | Study population | RR 0.21 | 23 | ⊕⊝⊝⊝ | ||
| 333 per 1000 | 70 per 1000 | |||||
| Overall discontinuation (follow‐up 26 weeks) | Study population | RR 2.22 | 28 | ⊕⊝⊝⊝ | ||
| 100 per 1000 | 222 per 1000 | |||||
| *The basis for the assumed risk (e.g. median control group risk across studies) is provided in footnotes. The corresponding risk (and its 95% confidence interval) is based on the assumed risk in the comparison group and the relative effect of the intervention (and its 95% CI) | ||||||
| GRADE Working Group grades of evidence | ||||||
| aDowngraded 2 steps because of severe risk of bias due to non‐blinding and unclear randomisation process and allocation concealment; no intention‐to‐treat analysis was reported, outcomes were self rated, compliance throughout study duration was not checked and participant characteristics were not reported comprehensively bDowngraded 1 step because of small sample size (lack of power and random error could have influenced results) | ||||||
| Infrared light therapy compared with no light therapy for prevention of SAD | ||||||
| Patient or population: All participants were known SAD patients who had been successfully treated with conventional light therapy in previous winters | ||||||
| Outcomes | Illustrative comparative risks* (95% CI) | Relative effect | Number of participants | Quality of the evidence | Comments | |
| Assumed risk | Corresponding risk | |||||
| No light therapy | Infrared light therapy | |||||
| Incidence of SAD (SIGH‐SAD score ≥ 20) (follow‐up 26 weeks) | Low | RR 0.50 | 24 | ⊕⊝⊝⊝ | ||
| 300 per 1000 | 150 per 1000 (63 to 351) | |||||
| Moderate | ||||||
| 500 per 1000 | 250 per 1000 (105 to 585) | |||||
| High | ||||||
| 600 per 1000 | 300 per 1000 (126 to 702) | |||||
| Incidence of severe SAD (SIGH‐SAD‐SR (≥ 40)) (follow‐up 26 weeks) | Study population | RR 0.20 | 24 | ⊕⊝⊝⊝ | ||
| 333 per 1000 | 67 per 1000 | |||||
| Overall discontinuation (follow‐up 26 weeks) | Study population | RR 1.67 | 28 | ⊕⊝⊝⊝ | ||
| 100 per 1000 | 167 per 1000 | |||||
| *The basis for the assumed risk (e.g. median control group risk across studies) is provided in footnotes. The corresponding risk (and its 95% confidence interval) is based on the assumed risk in the comparison group and the relative effect of the intervention (and its 95% CI) | ||||||
| GRADE Working Group grades of evidence | ||||||
| aDowngraded 2 steps because of severe risk of bias due to non‐blinding and unclear randomisation process and allocation concealment; no intention‐to‐treat analysis was reported, outcomes were self rated, compliance throughout study duration was not checked and participant characteristics were not reported comprehensively bDowngraded 1 step because of small sample size (lack of power and random error could have influenced results) | ||||||
| Light therapy (bright white or infrared) compared with no light therapy for prevention of SAD | ||||||
| Patient or population: All participants were known SAD patients who had been successfully treated with conventional light therapy in previous winters | ||||||
| Outcomes | Illustrative comparative risks* (95% CI) | Relative effect | Number of participants | Quality of the evidence | Comments | |
| Assumed risk | Corresponding risk | |||||
| No light therapy | Infrared light therapy | |||||
| Incidence of SAD (SIGH‐SAD score ≥ 20) (follow‐up 26 weeks) | Low | RR 0.57 | 38 | ⊕⊝⊝⊝ | ||
| 300 per 1000 | 171per 1000 (90 to 330) | |||||
| Moderate | ||||||
| 500 per 1000 | 285 per 1000 (150 to 550) | |||||
| High | ||||||
| 600 per 1000 | 342 per 1000 (180 to 660) | |||||
| Incidence of severe SAD (SIGH‐SAD‐SR (≥ 40)) (follow‐up 26 weeks) | Study population | RR 0.21 | 38 | ⊕⊝⊝⊝ | ||
| 333 per 1000 | 70 per 1000 | |||||
| Overall discontinuation (follow‐up 26 weeks) | Study population | RR 1.94 | 46 | ⊕⊝⊝⊝ | ||
| 100 per 1000 | 194 per 1000 | |||||
| *The basis for the assumed risk (e.g. median control group risk across studies) is provided in footnotes. The corresponding risk (and its 95% confidence interval) is based on the assumed risk in the comparison group and the relative effect of the intervention (and its 95% CI) | ||||||
| GRADE Working Group grades of evidence | ||||||
| aDowngraded 2 steps because of severe risk of bias due to non‐blinding and unclear randomisation process and allocation concealment; no intention‐to‐treat analysis was reported, outcomes were self rated, compliance throughout study duration was not checked and participant characteristics were not reported comprehensively bDowngraded 1 step because of small sample size (lack of power and random error could have influenced results) | ||||||
| Bright white light therapy compared with infrared light therapy for prevention of SAD | ||||||
| Patient or population: All participants were known SAD patients who had been successfully treated with conventional light therapy in previous winters | ||||||
| Outcomes | Risk in both groups | Relative effect | Number of participants | Quality of the evidence | Comments | |
| Risk in this treatment group | Risk in this treatment group | |||||
| Infrared light therapy | Bright white light therapy | |||||
| Incidence of SAD (SIGH‐SAD score ≥ 20) (follow‐up 26 weeks) | Study population | RR 1.29 | 29 | ⊕⊝⊝⊝ | ||
| 333 per 1000 | 357 per 1000 | |||||
| Incidence of severe SAD (SIGH‐SAD‐SR (≥ 40)) (follow‐up 26 weeks) | Study population | RR 1.07 | 29 | ⊕⊝⊝⊝ | ||
| 67 per 1000 | 71 per 1000 | |||||
| Overall discontinuation (follow‐up 26 weeks) | Study population | RR 1.33 | 36 | ⊕⊝⊝⊝ | ||
| 167 per 1000 | 222 per 1000 | |||||
| CI: Confidence interval; RCT: Randomised controlled trial; RR: Risk ratio, SIGH‐SAD‐SR: Structured Interview Guide for the Hamilton Depression Rating Scale‐Seasonal Affective Disorders self rating version | ||||||
| GRADE Working Group grades of evidence | ||||||
| aDowngraded 2 steps because of severe risk of bias due to non‐blinding and unclear randomisation process and allocation concealment; no intention‐to‐treat analysis was reported, outcomes were self rated, compliance throughout study duration was not checked and participant characteristics were not reported comprehensively bDowngraded 1 step because of small sample size (lack of power and random error could have influenced results) | ||||||
| Outcome or subgroup title | No. of studies | No. of participants | Statistical method | Effect size |
| 1 Incidence of SAD (per protocol analysis) Show forest plot | 1 | Risk Ratio (M‐H, Random, 95% CI) | Totals not selected | |
| 2 Incidence of SAD (ITT, assuming no dropout was depressed) Show forest plot | 1 | Risk Ratio (M‐H, Random, 95% CI) | Totals not selected | |
| 3 Incidence of SAD (ITT, assuming all dropouts were depressed) Show forest plot | 1 | Risk Ratio (M‐H, Random, 95% CI) | Totals not selected | |
| 4 Incidence of severe SAD (per protocol analysis) Show forest plot | 1 | Risk Ratio (M‐H, Random, 95% CI) | Totals not selected | |
| 5 Incidence of severe SAD (ITT, assuming no dropout was depressed) Show forest plot | 1 | Risk Ratio (M‐H, Random, 95% CI) | Totals not selected | |
| 6 Incidence of severe SAD (ITT, assuming all dropouts were depressed) Show forest plot | 1 | Risk Ratio (M‐H, Random, 95% CI) | Totals not selected | |
| 7 Overall rate of discontinuation Show forest plot | 1 | Risk Ratio (M‐H, Random, 95% CI) | Totals not selected | |
| Outcome or subgroup title | No. of studies | No. of participants | Statistical method | Effect size |
| 1 Incidence of SAD (per protocol analysis) Show forest plot | 1 | Risk Ratio (M‐H, Fixed, 95% CI) | Totals not selected | |
| 2 Incidence of SAD (ITT, assuming no dropout was depressed) Show forest plot | 1 | Risk Ratio (M‐H, Fixed, 95% CI) | Totals not selected | |
| 3 Incidence of SAD (ITT, assuming all dropouts were depressed) Show forest plot | 1 | Risk Ratio (M‐H, Fixed, 95% CI) | Totals not selected | |
| 4 Incidence of severe SAD (per protocol analysis) Show forest plot | 1 | Risk Ratio (M‐H, Fixed, 95% CI) | Totals not selected | |
| 5 Incidence of severe SAD (ITT, assuming no dropout was depressed) Show forest plot | 1 | Risk Ratio (M‐H, Fixed, 95% CI) | Totals not selected | |
| 6 Incidence of severe SAD (ITT, assuming all dropouts were depressed) Show forest plot | 1 | Risk Ratio (M‐H, Fixed, 95% CI) | Totals not selected | |
| 7 Overall discontinuation Show forest plot | 1 | Risk Ratio (M‐H, Fixed, 95% CI) | Totals not selected | |
| Outcome or subgroup title | No. of studies | No. of participants | Statistical method | Effect size |
| 1 Incidence of SAD (per protocol) Show forest plot | 1 | Risk Ratio (M‐H, Random, 95% CI) | Totals not selected | |
| 2 Incidence of SAD (ITT, assuming no dropout was depressed) Show forest plot | 1 | Risk Ratio (M‐H, Random, 95% CI) | Totals not selected | |
| 3 Incidence of SAD (ITT, assuming all dropouts were depressed) Show forest plot | 1 | Risk Ratio (M‐H, Random, 95% CI) | Totals not selected | |
| 4 Incidence of severe SAD (per protocol) Show forest plot | 1 | Risk Ratio (M‐H, Random, 95% CI) | Totals not selected | |
| 5 Incidence of severe SAD (ITT, assuming no dropout was depressed) Show forest plot | 1 | Risk Ratio (M‐H, Random, 95% CI) | Totals not selected | |
| 6 Incidence of severe SAD (ITT, assuming all dropouts were depressed) Show forest plot | 1 | Risk Ratio (M‐H, Random, 95% CI) | Totals not selected | |
| 7 Overall discontinuation Show forest plot | 1 | Risk Ratio (M‐H, Random, 95% CI) | Totals not selected | |