Ингибиторы протонной помпы при функциональной диспепсии
Abstract
Background
Functional dyspepsia (FD or non‐ulcer dyspepsia) is defined as continuous or frequently recurring epigastric pain or discomfort for which no organic cause can be found. Acid suppressive therapy, including proton pump inhibitors (PPIs), has been proposed as a therapeutic option in FD, but its efficacy remains controversial. While PPIs are generally considered safe and well tolerated, they have been associated with adverse events, especially in the long term. For this reason, decisions on whether to initiate or continue PPI therapy should be made based on an appropriate clinical indication. Therefore, we conducted a systematic review to evaluate whether PPI therapy provides symptomatic relief in FD.
Objectives
To determine the efficacy of proton pump inhibitors in the improvement of global symptoms of dyspepsia and quality of life compared to placebo, H2 receptor antagonists or prokinetics, in people with functional dyspepsia.
Search methods
We searched in the following electronic databases: the Cochrane Library (to January 2016), MEDLINE (OvidSP; to February 2016), Embase (OvidSP; to February 2016), and SIGLE grey literature (up to February 2016) and clinical trial registries; we handsearched abstracts from conferences up to February 2016. We screened non‐systematic reviews, systematic reviews and guidelines to identify any additional trials. We contacted trialists to obtain missing information.
Selection criteria
All randomized controlled trials (RCTs) comparing any PPI with placebo, H2 receptor antagonists (H2RAs) or prokinetics for the treatment of FD. Participants were adults (aged 16 years or greater) with an adequate diagnosis of FD (any validated criteria such as Rome I, II, III or Lancet Working Group).
Data collection and analysis
Two review authors independently assessed eligibility, trial quality and extracted data. We collected data on dyspeptic symptoms, quality of life and number of overall adverse events. Specific adverse events were beyond the scope of this review.
Main results
We identified 23 RCTs from 22 papers (with 8759 participants) studying the effect of PPIs versus placebo, H2RAs or prokinetics for improvement of global symptoms of dyspepsia and quality of life in people with FD. Low‐dose PPIs had similar efficacy as standard‐dose PPIs, therefore we combined these subgroups for the analysis. Two to eight weeks of therapy with PPI was slightly more effective than placebo at relieving overall dyspepsia symptoms in people with FD (risk ratio (RR) 0.88, 95% confidence interval (CI) 0.82 to 0.94; participants = 5968; studies = 16; number needed to treat for an additional beneficial outcome (NNTB) 13; moderate quality evidence). PPIs may be slightly more effective than H2RAs (RR 0.88, 95% CI 0.74 to 1.04; participants = 740; studies = 2, NNTB 13; low quality evidence), and slightly more effective than prokinetics (RR 0.90, 95% CI 0.81 to 1.00; participants = 892; studies = 4; NNTB 20; low quality evidence) at relieving overall dyspepsia symptoms in people with FD. PPIs plus prokinetics were possibly slightly more effective than PPIs alone at relieving overall dyspepsia symptoms (RR 0.85, 95% CI 0.68 to 1.08; participants = 407; studies = 2; NNTB 18; moderate quality evidence).
The was no difference when subgrouped by Helicobacter pylori status, country of origin, or presence of reflux or Rome III subtypes. There were no differences in the number of adverse events observed between PPIs and any of the other treatments.
Authors' conclusions
There is evidence that PPIs are effective for the treatment of FD, independent of the dose and duration of treatment compared with placebo. PPIs may be slightly more effective than H2RAs for the treatment of FD; however, the evidence is scarce. The trials evaluating PPIs versus prokinetics are difficult to interpret as they are at risk of bias. Although the effect of these drugs seems to be small, the drugs are well tolerated.
PICO
Резюме на простом языке
Ингибиторы протонной помпы при функциональной диспепсии
Вопрос обзора
Насколько эффективны лекарственные средства, подавляющие секрецию желудочного сока (желудочной кислоты), для лечения диспепсии у взрослых без других серьезных заболеваний?
Актуальность
Подавление кислотности является возможным методом лечения функциональной диспепсии (расстройства желудка), которая характеризуется повторяющимися болями в желудке, вздутием живота, отрыжкой или чувством наполненности. Некоторые лекарства используются для лечения функциональной диспепсии; ингибиторы протонной помпы (ИПП) и антагонисты Н2‐рецепторов (H2RAs) уменьшают желудочную кислотность, а прокинетики ускоряют опорожнение желудка. Нет четких доказательств того, что одно лекарство является более эффективным, чем другое. Хотя лекарства считаются безопасными, у некоторых людей бывают побочные эффекты. Наиболее распространенными побочными эффектами являются головная боль, боль в животе (абдоминальная боль), вздутие живота, диарея и тошнота. Длительное применение ИПП было связано с инфекционной диареей (воспаление желудка и тонкой кишки), переломами костей и избыточным бактериальным ростом. Поэтому, мы должны знать, являются ли эти препараты эффективными и безопасными для людей с диспепсией (расстройством желудка).
Дата поиска
Мы провели поиск в медицинских базах данных на предмет клинических испытаний, в которых лечение было распределено случайным образом (так называемые рандомизированные контролируемые клинические испытания) у взрослых с функциональной диспепсией до февраля 2016 года. Мы включили результаты 23 исследований из 22 публикаций. Мы нашли одно текущее исследование и одно исследование, которое ожидает дальнейших деталей.
Характеристика исследований
Мы включили 23 исследования (с 8759 участниками). Среди них были шесть исследований (2304 участников), сравнивающих низкие дозы ИПП со стандартными дозами ИПП (доза, используемая в клинической практике); 16 исследований (5968 участников), сравнивающих ИПП с плацебо (симуляция лечения); два исследования (740 участников), сравнивающие ИПП с блокаторами Н2 ‐рецепторов; четыре исследования (892 участников), сравнивающие ИПП с прокинетиками и два исследования (407 участников), сравнивающие ИПП плюс прокинетики с только прокинетиками.
Продолжительность лечения составляла от двух до восьми недель. Семь исследований сообщили о лечении в течение двух недель; 11 исследований сообщили о лечении в течение четырех недель и пять исследований сообщили о лечении в течение восьми недель.
Источники финансирования исследований
Пятнадцать из 23 исследований были спонсированы и финансированы фармацевтическими компаниями и одно ‐ грантом учреждения. В семи исследованиях не было какой‐либо информации о финансировании.
Основные результаты
Наш обзор показал, что ИПП являются более эффективными, чем плацебо, и, вероятно, немного более эффективными, чем прокинетики и блокаторы Н2 ‐рецепторов для лечения функциональной диспепсии. Низкие дозы и стандартные дозы ИПП были одинаково эффективны для облегчения расстройства желудка, поэтому мы объединили результаты двух доз ИПП. ИПП были более эффективны, чем плацебо, 30% участников из группы ИПП сообщили об отсутствии или о минимальных симптомах по сравнению с 25% в группе плацебо. ИПП, вероятно, несколько более эффективны, чем блокаторы Н2 ‐рецепторов; однако, эти два исследования, участвующие в анализе, были настолько разными, что могли оказать влияние на результаты. ИПП были несколлько более эффективными, чем прокинетики. Не было каких‐либо различий в числе побочных эффектов при сравнении ИПП, H2RAs и прокинетиков.
Качество доказательств
Исследования, оценивающие эффекты ИПП по сравнению с плацебо, или ИПП в сочетании с прокинетиками с прокинетиками, были в целом хорошего качества. Однако, исследования, которые сравнивали ИПП с блокаторами Н2 ‐рецепторов и c прокинетиками, имели серьезные проблемы с качеством.
Authors' conclusions
Summary of findings
| PPI versus placebo for functional dyspepsia | ||||||
| Patient or population: adults with functional dyspepsia | ||||||
| Outcomes | Anticipated absolute effects* (95% CI) | Relative effect | No of participants | Quality of the evidence | Comments | |
| Risk with placebo | Risk with PPI | |||||
| Global symptoms of dyspepsia Follow‐up: 2 to 8 weeks | Study population | RR 0.88 | 5968 | ⊕⊕⊕⊝ | Measurement of no improvement. | |
| 751 per 1000 | 660 per 1000 | |||||
| Quality of life | SF‐36 scale from: 0 to 100 | ‐ | 453 | ⊕⊕⊕⊝ | Higher scores mean better quality of life. | |
| The mean quality of life was 0 | MD 1.11 lower | |||||
| Psychological General Well‐Being Index from: 0 to 110 | ‐ | 1177 | ⊕⊕⊕⊝ | Higher scores mean better quality of life. | ||
| The mean quality of life was 0 | MD 0.54 higher | |||||
| Adverse events Follow‐up: range 2 to 8 weeks | Study population | RR 1.04 | 2917 | ⊕⊕⊕⊝ | Number of adverse events. | |
| 167 per 1000 | 174 per 1000 | |||||
| *The risk in the intervention group (and its 95% confidence interval) is based on the assumed risk in the comparison group and the relative effect of the intervention (and its 95% CI). CI: confidence interval; H2RA: H2 receptor antagonist; MD: mean difference; PPI: proton pump inhibitor; RCT: randomized controlled trial; RR: risk ratio. | ||||||
| GRADE Working Group grades of evidence | ||||||
| 1 Downgraded one level due to serious inconsistency. 2 Downgraded one level due to imprecision (95% CI included appreciable benefit and harm). | ||||||
| PPI vs H2RA for functional dyspepsia | ||||||
| Patient or population: adults with functional dyspepsia | ||||||
| Outcomes | Anticipated absolute effects* (95% CI) | Relative effect | No of participants | Quality of the evidence | Comments | |
| Risk with H2RA | Risk with PPI | |||||
| Global symptoms of dyspepsia | Study population | RR 0.88 | 740 | ⊕⊕⊝⊝ | Measurement of no improvement. | |
| 739 per 1000 | 650 per 1000 | |||||
| Quality of life | 0 per 1000 | 0 per 1000 | Not estimable | (0 studies) | ‐ | No data available. |
| Adverse events Follow‐up range 2 to 8 weeks | Study population | RR 0.95 | 589 | ⊕⊕⊝⊝ | Number of adverse events. | |
| 144 per 1000 | 137 per 1000 | |||||
| *The risk in the intervention group (and its 95% confidence interval) is based on the assumed risk in the comparison group and the relative effect of the intervention (and its 95% CI). CI: confidence interval; H2RA: H2 receptor antagonist; PPI: proton pump inhibitor; RCT: randomized controlled trial; RR: risk ratio. | ||||||
| GRADE Working Group grades of evidence | ||||||
| 1 Downgraded two levels due to high risk of selection bias and performance bias in one study accounting for 33.9% of weight. 2 Downgraded one level due to serious imprecision. 3 Downgraded one level due to very few events (3). | ||||||
| PPI vs prokinetics for functional dyspepsia | ||||||
| Patient or population: adults with functional dyspepsia | ||||||
| Outcomes | Anticipated absolute effects* (95% CI) | Relative effect | No of participants | Quality of the evidence | Comments | |
| Risk with prokinetic | Risk with PPI | |||||
| Global symptoms of dyspepsia Follow‐up: range 2 to 4 weeks | Study population | RR 0.90 | 892 | ⊕⊕⊝⊝ | Measurement of no improvement. | |
| 571 per 1000 | 514 per 1000 | |||||
| Quality of life Follow‐up: range 2 to 4 weeks | The mean quality of life was 0 | MD 0.5 lower | ‐ | 262 | ⊕⊕⊕⊝ | Higher scores denote better outcome. |
| Adverse events Follow‐up: range 4 weeks | Study population | RR 0.84 | 899 | ⊕⊕⊕⊝ | Number of adverse events. | |
| 129 per 1000 | 109 per 1000 | |||||
| *The risk in the intervention group (and its 95% confidence interval) is based on the assumed risk in the comparison group and the relative effect of the intervention (and its 95% CI). CI: confidence interval; PPI: proton pump inhibitor; RCT: randomized controlled trial; RR: risk ratio. | ||||||
| GRADE Working Group grades of evidence | ||||||
| 1 Downgraded one level due to serious imprecision. 2 Downgraded one level due to serious inconsistency. 3 We did not consider the impact of risk of bias and inconsistency on the results to be serious enough to justify fully downgrading two levels so we have downgraded one level in respect of both considerations. | ||||||
| PPI + prokinetics vs prokinetics alone for functional dyspepsia | ||||||
| Patient or population: adults with functional dyspepsia | ||||||
| Outcomes | Anticipated absolute effects* (95% CI) | Relative effect | No of participants | Quality of the evidence | Comments | |
| Risk with prokinetic alone | Risk with PPI + prokinetic | |||||
| Global symptoms of dyspepsia Follow‐up range: 2 to 4 weeks | Study population | RR 0.85 | 407 | ⊕⊕⊕⊝ | Measurement of no improvement. | |
| 444 per 1000 | 377 per 1000 | |||||
| Quality of life Follow‐up: 4 weeks | The mean quality of life was 0 | MD 1.1 lower | ‐ | 258 | ⊕⊕⊕⊝ | Higher scores denote better outcome. |
| Adverse events Follow‐up: 4 weeks | Study population | RR 0.60 | 407 | ⊕⊕⊕⊝ | Number of adverse events. | |
| 220 per 1000 | 132 per 1000 | |||||
| *The risk in the intervention group (and its 95% confidence interval) is based on the assumed risk in the comparison group and the relative effect of the intervention (and its 95% CI). CI: confidence interval; PPI: proton pump inhibitor; RCT: randomized controlled trial; RR: risk ratio. | ||||||
| GRADE Working Group grades of evidence | ||||||
| 1 Downgraded one level due to imprecision (95% CI included appreciable benefit and harm). | ||||||
Background
Description of the condition
See 'Glossary of medical terms' in Appendix 1.
Since the mid‐to‐late 1990s, the definition of functional dyspepsia (FD, or non‐ulcer dyspepsia) has undergone major changes since the initial working party definition in 1988, to the consecutive Rome I to III (Colin‐Jones 1988; Drossman 1999; Drossman 2006) and most recently the Rome IV definitions (Stanghellini 2016). This process has been in line with a change in our understanding of the pathophysiological basis of FD and its categorization (Talley 2016).
FD is defined as continuous or frequently recurring epigastric pain or discomfort for which no organic cause can be found (Drossman 2006). Other symptoms, such as upper abdominal bloating, excessive burping and early satiety could also be present; a normal upper endoscopy is usually required to rule out any underlying organic disease (Abraham 2004). FD is a highly prevalent disorder, affecting 10% to 15% of the general population (Lacy 2013), and it accounts for 3% to 5% of all primary care clinic visits in North America. About 50% of European and North American people with dyspepsia receive pharmacological treatment, and more than 30% report missing work or school hours because of burdensome symptoms (Overland 2014). Therefore, FD incurs direct and indirect costs (total yearly cost estimated at USD1595 per person), with additional costs associated with their impaired work productivity (Lacy 2013).
The clinical management of FD is problematic, reflecting the unknown cause and poorly understood pathophysiology (Talley 1991; Talley 1995). Different treatments have been proposed for the condition, including H2 receptor antagonists (H2RA), prokinetic agents (Bekhti 1979; Holtmann 2002; Talley 1998 (BOND); Talley 1998 (OPERA); Van Outryve 1993), proton pump inhibitors (PPIs) (McColl 1998; Wong 2002), Helicobacter pylori eradication therapy (Blum 1998; Froehlich 2001; Hamilton 2000; Talley 1999a; Talley 1999b), and even antidepressants or psychological interventions (Bolling‐Sternevald 2003; Calvert 2002). It has been previously shown that omeprazole (a PPI) produces higher intragastric pH values in H. pylori‐positive compared to H. pylori‐negative people (Verdú 1995). The apparently increased effect of omeprazole during H. pylori infection may be a result of the production of acid neutralizing compounds by the H. pylori (Bercik 2000).
Drugs that reduce gastric acid secretion are commonly prescribed for people with dyspepsia, but the efficacy of acid suppression in treating the condition is still controversial. Gastric acid secretion is a complex process regulated by at least three types of receptors (histamine, gastrin and acetylcholine) on the parietal cell. In contrast to H2RAs or anticholinergic agents, which only partially inhibit histamine‐, gastrin‐ or acetylcholine‐stimulated acid secretion, PPIs inhibit acid secretion in response to all stimulatory agents (Robinson 2004). Although gastric acid secretion is normal in people with FD (Chen 2000), a subset of these people benefit from strong acid suppression with a PPI (Wong 2002). Acid secretion inhibitory drugs are therefore widely prescribed to people with FD worldwide, but the underlying mechanisms of their effect are unknown (Suzuki 2011). It has been shown that about one‐third of people with FD have a normal 24‐hour pH profile (Chen 2000; Moayyedi 2011), and a clear relationship between acid exposure and severity of symptoms is far from evident in these people (Moayyedi 2003; Moayyedi 2011). The effect of H2RAs seems to be overestimated (Talley 1998 (BOND); Talley 1998 (OPERA)), and studies on the efficacy of PPIs have had variable results, depending on the protocol and inclusion criteria used (Bolling‐Sternevald 2003; Hansen 1998; Suzuki 2011). While PPIs are generally considered safe and well tolerated, there have been reports of associated Clostridium difficile infection, pneumonia, risk of fractures and acute interstitial nephritis (Wilhelm 2013) in the long term. This has been a controversial topic that has been studied in detail (Abramowitz 2016; Scarpignato 2016). For this reason, decisions on whether to initiate or continue PPI therapy should be made based on an appropriate clinical indication (Yang 2010).
Description of the intervention
PPIs are the most widely used agents for the suppression of gastric acid. Following on from their demonstrated success in the treatment of gastroesophageal reflux disease and peptic ulcers, PPIs have been widely employed in the treatment of dyspeptic symptoms and in people with FD (Camillieri 2013; Lacy 2012). They have been proposed as the first step in the treatment of people with FD after H. pylori eradication (in people who are positive for H. pylori). However, the real effect of PPIs has been controversial. Evidence from randomized controlled trials (RCTs) suggests that the efficacy of PPIs in FD may be confined to those people who have co‐existing reflux symptoms (Lacy 2012).
How the intervention might work
PPIs may be beneficial in a subset of people with FD. One meta‐analysis of placebo‐controlled RCTs of PPIs in FD included 3725 participants across seven studies (Wang 2007). Overall, the meta‐analysis concluded that PPI treatment was superior to placebo with a number needed to treat for an additional beneficial outcome (NNTB) of 15. In subgroup analyses, they found that the benefit of PPI over placebo was confined to people with 'ulcer‐like' and 'reflux‐like' dyspepsia; they found no advantage of PPI treatment among people with 'dysmotility‐like' or unspecified dyspepsia (Drossman 1999).
PPIs may also have advantages compared to prokinetics. Prokinetic agents are conceptually appealing: they have the potential to improve gastric emptying and are commonly used worldwide; however, the effect in FD is not clearly supported by the evidence (Lacy 2012).
PPIs may also benefit in comparison with H2RAs (Barbera 1995).
Why it is important to do this review
From 2000 to 2007, several systematic reviews and meta‐analyses were published which considered different treatments for FD, including PPIs (Hansen 1998; Moayyedi 2011; Suzuki 2011). Since then, newer RCTs addressing this issue have been added to the medical literature. However, no new systematic reviews have evaluated these studies and a former Cochrane Review has been withdrawn (Moayyedi 2011).
Acid secretion inhibitory drugs are widely prescribed to people with FD worldwide, but the underlying mechanisms of their effect are unknown. PPIs have been considered to be 'safe' drugs; however, some adverse effects were reported (Johnson 2013). Evidence of the real effect of PPIs in FD will therefore help us to understand better the need for PPIs in this specific population and to avoid the indiscriminate use of these drugs.
Due to the importance of the topic, we have conducted a systematic review of RCTs evaluating PPI therapy in FD using Cochrane methodology.
Objectives
To determine the efficacy of proton pump inhibitors in the improvement of global symptoms of dyspepsia and quality of life compared to placebo, H2 receptor antagonists or prokinetics, in people with functional dyspepsia.
Methods
Criteria for considering studies for this review
Types of studies
We included RCTs comparing the efficacy of different PPIs in people with an adequate diagnosis of FD (any validated criteria such as Rome I, II, III or Lancet Working Group) (Colin‐Jones 1988; Drossman 1999; Drossman 2006). We included cross‐over studies only if the results were available before the cross‐over, so that the study could be evaluated as a parallel‐group study. We excluded cluster‐randomized trials.
Types of participants
We considered studies involving people aged over 16 years, of both genders, with a diagnosis of FD according to any well‐defined criteria (such as Rome I, II, III or Lancet Working Group; Table 1), with a normal upper gastrointestinal endoscopy and with upper gastrointestinal symptoms including epigastric pain/discomfort. We excluded studies involving participants with other gastrointestinal conditions, such as peptic ulcer, organic dyspepsia and reflux disease. If a study included populations with different conditions, we only considered people with FD.
| Functional dyspepsia | Rome I (1991) | Rome II (1999) | Rome III (2006) | AGA Working Group | Lancet Working Group (1998) |
| Main criteria | Pain or discomfort centred in the upper abdomen with no evidence of organic disease. | Persistent or recurrent symptoms (pain or discomfort centred in the upper abdomen). AND No evidence that dyspepsia is exclusively relieved by defecation or associated with the onset of a change in stool frequency or stool form (exclude irritable bowel syndrome and exclude reflux). | ≥ 1 symptoms need to be present:
| Chronic or recurrent pain or discomfort centred in the upper abdomen. | Chronic or recurrent pain or discomfort centred in the upper abdomen or retrosternal pain, discomfort, heartburn, nausea, vomiting or other symptoms of the gastrointestinal tract. |
| Normal upper endoscopy | Required. | Required. | Required. | Required. | Required. |
| Symptoms present for the last... | ‐ | 12 weeks which need not be consecutive. | Criteria fulfilled for the last 3 months. | ≥ 3 months. | ≥ 4 weeks. |
| Onset of symptoms | ‐ | 12 months. | 6 months. | ‐ | ‐ |
| Subtypes |
|
|
| ‐ | Reflux‐like dyspepsia. |
AGA: American Gastroenterological Association.
Types of interventions
We included trials comparing oral administration of any dose of any PPI available (omeprazole, esomeprazole, pantoprazole, lansoprazole, dex‐lansoprazole or rabeprazole; for doses see Table 2) with placebo, H2RAs or prokinetics. We considered a combination of treatments in either intervention or control groups only if the combination of treatment was present in both groups. We considered therapy of at least two weeks' duration. We recorded and compared the time of the intervention and follow‐up.
| Proton pump inhibitor | Daily standard dose |
| Dex‐lansoprazole | 30 mg |
| Esomeprazole | 20 mg to 40 mg |
| Lansoprazole | 30 mg |
| Omeprazole | 20 mg |
| Pantoprazole | 40 mg |
| Rabeprazole | 20 mg |
Types of outcome measures
We measured outcomes as continuous (mean score pre‐ and post‐treatment) and dichotomous (improved or not improved). We measured the number of events in each group for adverse events.
Primary outcomes
-
Global symptoms of dyspepsia (using the most stringent definition of not symptom‐free) or epigastric pain/discomfort pain if global symptoms were not reported.
Secondary outcomes
-
Quality of life (QoL).
-
Adverse events.
Search methods for identification of studies
Electronic searches
We conducted a literature search to identify all published and unpublished RCTs. We considered studies regardless of language and publication status to avoid biases. We translated the non‐English language papers and fully assessed them for potential inclusion in the review as necessary. We only included data from abstracts if we were able to obtain further details from the investigators. We searched for potential studies the following electronic databases:
-
the Cochrane Library (to January 2016) (Appendix 2);
-
MEDLINE (OvidSP) (1946 to February 2016) (Appendix 3);
-
Embase (OvidSP) (1974 to February 2016) (Appendix 4).
The Cochrane Library databases include Cochrane Database of Systematic Reviews (CDSR), Cochrane Central Register of Controlled Trials (CENTRAL), Cochrane Methodology Register (CMR), Database of Abstracts of Reviews of Effects (DARE), Health Technology Assessment Database (HTA) and NHS Economic Evaluation Database (EED). The search strategies were constructed by using a combination of subject headings and text words relating to dyspepsia and PPIs.
Searching other resources
We performed handsearching of healthcare journals and conference proceedings (i.e. Digestive Diseases Week, United European Gastroenterology Week). We checked the reference lists of all primary studies and reviewed articles for additional references. We contacted the authors of identified trials and ask them to identify other published and unpublished studies. We contacted manufacturers and experts in the field. We searched for errata or retractions from eligible trials in PubMed (www.ncbi.nlm.nih.gov/pubmed) and reported the date this was done within the review. We also conducted a search of ClinicalTrials.gov for clinical trials. We made efforts to identify unpublished studies. We searched the grey literature (e.g. conference reports, technical reports and dissertations) using SIGLE (Appendix 5)). EAGLE (the European Association for Grey Literature Exploitation) has closed the SIGLE (System for Information on Grey Literature; www.opengrey.eu/) database, which was one of the most widely used databases of grey literature.
Data collection and analysis
Selection of studies
We used Review Manager 5 to collect and manage citations (Reference Manager 2014). We identified and excluded duplicates and collate multiple reports of the same study, so that each study, rather than each report, was the unit of interest in the review. We recorded the selection process in sufficient detail to complete a PRISMA flow diagram (Figure 1).

Study flow diagram.
To ensure that we identified all eligible studies, two review authors (MIP and YY) independently screened the abstracts and selected trials according to the inclusion and exclusion criteria. We documented study selection or exclusion and created a list of studies to be included in the analysis (see Characteristics of included studies table). We resolved any disagreement through discussion or consultation with a third review author (PM). At this initial stage, we included studies where there was disagreement or where it was difficult to decide whether a study should be included.
We identified studies in which participants with an adequate diagnosis of FD (any valid criteria for FD with a normal upper gastrointestinal endoscopy) were randomized to receive any type of PPI versus another prespecified treatment or placebo. We considered and recorded the general characteristics and outcomes of each study using a screening form. We piloted the form on the first five studies included in the list and made changes if necessary. The screening form recorded the title, author, date, study design (only RCTs were included), population characteristics, intervention and control treatment duration, and outcomes according to the PICO question (population (P), intervention (I), comparison (C) and outcome(s) (O)). We provided a section for general comments, for any review author considerations and future discussion. We identified and removed duplicate studies at this initial stage.
We combined the results of the title and abstract screening performed by the review authors and document and discussed decisions about inclusion in the final full‐text screening list. To ensure that inclusion and exclusion criteria were properly interpreted and selection bias was minimized, two different review authors (MIP and YY) performed the screening of the full texts. For papers in languages other than English, we requested translation by a translator from Cochrane with experience in systematic reviews and medicine. If the paper met the inclusion criteria, we asked the translator to extract data on the predefined data extraction form. The two review authors received the full‐text journal articles and translations to perform the screening. We collected the full‐text screening data in an Excel sheet and compared the results. We calculated the level of agreement after each step: title and abstract screening, full‐text screening and data extraction using Kappa statistics for categorical data (GraphPad), and raw agreement for continuous data. We reported raw agreement as a percentage and Kappa as fair agreement (К = 0.4 to 0.59), good agreement (0.6 to 0.74) or excellent agreement (0.75 or greater).
Data extraction and management
We used a standard data collection form for study characteristics and outcome data, which was piloted on five studies. Two review authors (MIP and YY) extracted the following study characteristics from included studies.
-
Methods: study design, total duration of study and run‐in, number of study centres and location, study setting, withdrawals, date of study.
-
Participants: number, mean age, age range, gender, severity of condition, diagnostic criteria, inclusion criteria, exclusion criteria.
-
Interventions: intervention, comparison, concomitant medications, excluded medications.
-
Outcomes: primary and secondary outcomes specified and collected, time points reported.
-
Notes: funding for trial, notable conflicts of interest of trial authors.
Two review authors (MIP and YY) independently extracted outcome data from the included studies. We noted in the Characteristics of included studies table if outcome data were reported in an unusable way. We resolved disagreements by consensus or by involving a third review author (PM). One review author (MIP) copied across the data from the data collection form into Review Manager 5 (RevMan 2012). Two review authors (YY and PM) double‐checked that the data were entered correctly by comparing the study reports with how the data were presented in the systematic review.
We collected blinding information by individually identifying the person blinded. If this information was not reported, we recorded the study as 'single‐blind' (implying that probably only the study participants were blinded), 'double‐blind' (implying that the study participants, healthcare providers, data collectors and assessors were blinded but not the data analysts) or 'triple‐blind' (implying that the data analysts were also blinded).
If any information was missing at the end of data extraction process, we contacted the authors of the trials to recover the specific information. We included information on the following outcomes on the form: global symptoms and independent symptoms related to FD (epigastric pain, distension, early satiety, postprandial fullness, belching, reflux‐like), and QoL and adverse events. We detailed common adverse events (such as such as diarrhoea, intolerance, nausea, headaches). We recorded participant demographics, treatment outcomes and adverse events as mean (standard deviation (SD)), n/N or % when applicable. We also collected information to assess possible risk of bias (randomization, concealment, blinding of participants and outcome assessors, incomplete outcome data, selective reporting and other biases).
Assessment of risk of bias in included studies
Two review authors (MIP and YY) independently assessed the risk of bias for each study using the criteria outlined in the Cochrane Handbook for Systematic Reviews of Interventions (Higgins 2011). We resolved any disagreement by discussion or by involving a third review author (PM).
We assessed the risk of bias according to the following domains: random sequence generation; allocation concealment; blinding of participants and personnel; blinding of outcome assessment; incomplete outcome data; selective outcome reporting other bias. We graded each potential source of bias as high, low or unclear and provide a quote from the study report together with a justification for our judgement in the 'Risk of bias' table for each study.
We summarized the 'Risk of bias' judgements across different studies for each of the domains listed. We considered blinding separately for different key outcomes where necessary, for example, for unblinded outcome assessment, risk of bias for all‐cause mortality may be very different from a participant‐reported pain scale). Where information on risk of bias related to unpublished data or correspondence with a trialist, we noted this in the 'Risk of bias' table.
When considering treatment effects, we took into account the risk of bias of the studies that contributed to that outcome. We entered the data related to risk of bias into Review Manager 5 (RevMan 2012) and construct the 'Risk of bias' tables. We generated two figures with the Review Manager 5 software: a 'Risk of bias' summary, which represents all the judgements in a cross‐tabulation of study by entry and a 'Risk of bias' graph, which illustrates the proportion of studies complying with each of the judgements (low, high and unclear risk of bias).
GRADE and 'Summary of findings' tables
We used the GRADE system for the assessment of the quality of the evidence, and developed 'Summary of findings' tables using the GRADEpro software (GRADEpro). One review author (MIPS) performed GRADE assessment and another review author (PM) checked the consistency of the information. We graded the quality of evidence as high, moderate, low or very low, depending on study limitations, consistency, directness, precision and publication bias of each study.
Measures of treatment effect
We analyzed dichotomous data as risk ratio (RR) and continuous data as mean difference (MD) or standardized mean difference (SMD). We reported information regarding the study population follow‐up (participants enrolled and randomized) as the data collected from discontinued participants over the total number of participants for each arm (n/N). We reported the total number of participants with symptoms related to dyspepsia in each arm at each time point (before and after treatment) as a number over the total sample population (n/N) in each arm.
We reported the comparison of binary data as an RR with an associated 95% confidence interval (CI), and the NNTB. The number needed to treat was calculated according to the following formula: NNTB = 100/ARR and ARR = 100 × ACR × (1 ‐ RR) (Higgins 2011).
We collected continuous outcome data (dyspepsia score and QoL) in three different ways:
-
unit of measurement or, if unit of measurement could not be reported (i.e. visual analogue scale), we considered the data to be unit‐less;
-
measure of central tendency: mean, median, mode;
-
measure of variance, such as SD, standard error (SE), interquartile range or 95% CI.
If we were not provided with the raw data, we collected the reported analysis.
We collected change scores (the difference between scores before and after intervention) for comparison. We undertook meta‐analyses only where this was meaningful (i.e. if the treatments, participants and the underlying clinical question were similar enough for pooling to make sense). A common way in which trialists indicate that they have skewed data is by reporting medians and interquartile ranges. When we encounter this, we noted that the data were skewed and considered the implication of this. Where multiple trial arms were reported in a single trial, we included only the relevant arms. If two comparisons (e.g. drug A versus placebo and drug B versus placebo) needed to be entered into the same meta‐analysis, we halved the control group to avoid double‐counting.
Unit of analysis issues
The unit of analysis was the individual participant included in the studies. We analyzed cross‐over studies as parallel‐group study only if the results were available before the cross‐over.
Dealing with missing data
We contacted investigators or study sponsors to verify key study characteristics and obtain missing numerical outcome data where possible (e.g. when a study was identified as an abstract only). We contacted study investigators whenever possible to request missing data. If this was not possible, or data were not provided, we considered that participants with missing data did not have the outcome of interest. We performed sensitivity analyses to assess robustness of the results relative to reasonable changes in the assumptions that were made.
We addressed the potential impact of missing data on the findings of the meta‐analysis in the Discussion section.
Assessment of heterogeneity
Heterogeneity in systematic reviews can occur because of artefactual or real differences in treatment effects across the different studies included in the review (Tett 2013), and the reasons behind it should be carefully investigated. We considered all EPICOT components (evidence, population, intervention, comparison, outcome and time stamp), as well as internal validity issues (such as compliance, cointervention and randomization) in the analysis.
We pre‐identified potential sources of heterogeneity that could be related to the criteria considered for the FD definition and differences in the demographics of the included population: time, duration and dose of PPI; undetected cointervention and differences in outcomes measurements. To address the most important possible sources of heterogeneity, we performed subgroup analysis.
We assessed statistical heterogeneity with both the I2 statistic and the Chi2 test. An I2 value of 0% indicates no observed heterogeneity and larger values denote heterogeneity. We considered that heterogeneity might be not important when I2 was between 0% and 40%; moderate heterogeneity when I2 was between 30% and 60%; substantial heterogeneity when I2 was between 50% and 90% and considerable heterogeneity when the I2 was greater than 75%; or there was a P value of less than 0.1 for the Chi2 test (Higgins 2011).
Assessment of reporting biases
We attempted to contact study authors and asked them to provide missing outcome data. Where this was not possible, and the missing data were thought to introduce serious bias, we explored the impact of including such studies in the overall assessment of results by a sensitivity analysis.
If we could pool more than 10 trials, we created and examined a funnel plot to explore possible publication biases. In the graph, the effect estimates were shown on the horizontal scale and the measure of study size on the vertical axis. Asymmetric funnel plots suggested small‐study effects, publication bias, delayed publication (time lag), selective reporting outcome or even differences in methodological quality.
Data synthesis
To be able to combine the results, we considered some possible differences before performing the meta‐analysis. We created a forest plot of the meta‐analysis for quantitative synthesis. We addressed differences in the research question, population, intervention, comparators, outcomes and methodology. We included different comparators (placebo or other active comparators such as H2RAs or prokinetics) in the analysis. However, we separated studies with different comparators into different subgroups for their analysis. For quantitative analysis, we performed a meta‐analysis using Review Manager 5 (RevMan 2012). We calculated a summary statistic for each study to describe the observed intervention effect. In the case of dichotomous outcomes, we calculated an RR and for continuous data we calculated an MD. When outcomes were assessed by different instruments, we used the SMD when possible. We calculated a summary (pooled) intervention effect estimate as a weighted mean of the intervention effects estimated in the individual studies. We chose the weights to reflect the amount of information that each study contained. For the combination of intervention effect estimates across studies, we assumed that the studies were not all estimating the same intervention effect, but estimating intervention effects that followed a distribution across studies. We therefore considered a random‐effects model meta‐analysis to be adequate (Kwok 2013). However, since the correct selection of the model is controversial, we also performed a fixed‐effect model analysis and compared the results of both. If these models had similar results, we considered that the chances of heterogeneity being present across the studies were low. Otherwise, if the results were different, we considered the random‐effects model as the most appropriate for the reasons previously described. To communicate the strength of evidence against the null hypothesis of no intervention effect, we used measures of dispersion (such as SE) to derive a CI and a P value.
Subgroup analysis and investigation of heterogeneity
We carried out the following subgroup analyses to reveal any effect that might explain any heterogeneity:
-
treatment duration (less than four weeks versus four weeks and versus greater than four weeks);
-
dose (standard‐dose versus low‐dose of PPI);
-
PPI subtype;
-
H. pylori status (H. pylori‐negative versus H. pylori‐positive);
-
presence of reflux, defined as abnormal 24‐hour pH study (pH less than 4 for more than 4% of the 24‐hour recording versus pH less than 4 for less than 4% of the 24‐hour recording);
-
risk of bias (low versus unclear versus high risk of bias);
-
geographical location (e.g. western versus eastern studies);
-
trial funding sources (industry‐sponsored versus non‐industry‐sponsored studies).
We assessed differences between subgroups with the I2 statistic to test for subgroup interactions.
Sensitivity analysis
We performed the following sensitivity analyses defined a priori to assess the robustness of our conclusions. This involved:
-
abstract inclusion;
-
eligibility criteria (exclusion of open‐label studies).
Results
Description of studies
Results of the search
The search up to March 2016 identified 1692 records. After removal of duplicates, we initially screened 1338 citations resulting from the electronic searches. Based on consideration of their titles and abstracts we excluded 1275 citations while 63 papers were targeted for full‐article review, either because they were potentially relevant, or because not enough information was reported in the title and abstract to make a final decision. We included 23 studies from 22 papers (Characteristics of included studies table), excluded 38 studies (Characteristics of excluded studies table), one study is awaiting classification (Characteristics of studies awaiting classification table) and one study is ongoing (Characteristics of ongoing studies table). The ongoing study was started in 2009, the completion date has passed and the status has not been verified since 2011 (Figure 1). There was very good inter‐reviewer agreement at the full‐text stage (k = 0.94, SE of kappa = 0.046; 95% CI 0.84 to 1.0).
Included studies
We included 23 studies from 22 publications (Characteristics of included studies table). Of the 23 included studies, 20 were written in English and three in Chinese (Jiang 2011; Li 2003; Yang 2014). Two studies identified during the search were published only as abstracts (Kamiya 2011; Tominaga 2010). We contacted authors from these studies and requested further information, which they supplied.
Country of origin
Four out of 23 studies were from Japan (Iwakiri 2013; Kamiya 2011; Suzuki 2013 (ELF); Tominaga 2010); two studies from the US (Gerson 2005; Peura 2004); three from China (Jiang 2011; Li 2003; Yang 2014); two from the UK (Dillon 2004; Fletcher 2011); two from Germany (Blum 2000; Hengels 1998); one from Canada (Van Zanten 2006); one from Hong Kong (Wong 2002); one from Korea (Jung 2016); one from Norway (Farup 1999); and one from Taiwan (Hsu 2011). Five studies were from multiple countries (Bolling‐Sternevald 2002; Talley 1998 (BOND); Talley 1998 (OPERA); Talley 2007; Van Rensburg 2008).
Interventions
Fifteen studies included two treatment arms (Bolling‐Sternevald 2002; Dillon 2004; Fletcher 2011; Gerson 2005; Hengels 1998; Hsu 2011; Jiang 2011; Kamiya 2011; Li 2003; Suzuki 2013 (ELF); Talley 2007; Tominaga 2010; Van Rensburg 2008; Van Zanten 2006; Yang 2014); six studies included three arms (Farup 1999; Jung 2016; Peura 2004; Talley 1998 (BOND); Talley 1998 (OPERA); Wong 2002); and two studies included four arms (Blum 2000; Iwakiri 2013).
From the studies with two arms, 11 compared standard doses of PPIs either with placebo (Bolling‐Sternevald 2002; Fletcher 2011; Gerson 2005; Talley 2007; Van Zanten 2006; Van Rensburg 2008), prokinetics (Hsu 2011; Jiang 2011; Kamiya 2011;Yang 2014), or H2RA (ranitidine) (Dillon 2004); three compared low‐dose PPIs either with placebo (Hengels 1998; Suzuki 2013 (ELF); Tominaga 2010), or prokinetics (Li 2003).
From the studies with three arms, five compared low and standard doses of PPIs with placebo (Farup 1999; Peura 2004; Talley 1998 (BOND); Talley 1998 (OPERA); Wong 2002), and one compared standard‐dose PPI, prokinetic, and PPI plus prokinetic (Jung 2016).
From the two studies with four arms, one compared low‐dose PPI, with standard‐dose PPI, ranitidine and placebo (Blum 2000), and one compared low‐dose, standard‐dose and high‐dose PPIs and placebo (Iwakiri 2013).
Duration of intervention
The duration of intervention ranged from two to eight weeks. Seven studies reported treatment for two weeks (Blum 2000; Bolling‐Sternevald 2002; Fletcher 2011; Hengels 1998; Hsu 2011; Jiang 2011; Li 2003); 11 studies reported treatment for four weeks (Farup 1999; Gerson 2005; Jung 2016; Kamiya 2011; Suzuki 2013 (ELF); Talley 1998 (BOND); Talley 1998 (OPERA); Tominaga 2010; Van Rensburg 2008; Wong 2002; Yang 2014); and five studies reported eight weeks of treatment (Dillon 2004; Iwakiri 2013; Peura 2004; Talley 2007; Van Zanten 2006).
Definition of functional dyspepsia
The definition for FD differed according to the study and the year of publication. Six studies defined FD as "persistent or recurrent epigastric pain and/or discomfort in participants with normal findings at upper gastrointestinal endoscopy and with symptoms at least one month's duration" (Blum 2000; Bolling‐Sternevald 2002; Farup 1999; Li 2003; Talley 1998 (BOND); Talley 1998 (OPERA)). The same studies considered the presence of symptoms during the seven‐day run‐in period. Five studies defined FD based on the Rome II criteria (Dillon 2004; Gerson 2005; Peura 2004; Van Zanten 2006; Wong 2002); eight studies on Rome III criteria (Hsu 2011; Iwakiri 2013; Jiang 2011; Jung 2016; Kamiya 2011; Suzuki 2013 (ELF); Tominaga 2010; Yang 2014); and three using the AGA Working Group definition (Fletcher 2011; Talley 2007; Van Rensburg 2008). One study included participants with dyspeptic symptoms present for at least one week (Hengels 1998).
Excluded studies
After full‐text review, we excluded 38 studies (Almazar 2015; Bolling‐Sternvald 2003; Burkov 2009; Bytzer 2000; Cheung 2013; Chuang 2001; Delaney 2008; Fan 2012; Fransen 2012; Goves 1998; Guo 2011; Ivanova 2002; Jones 1997; Jones 1999; Kamada 2013; Kamiya 2012; Leung 2007; Lewin van den Broek 2001; Madsen 2004; Madsen 2008; Mazure 1996; Meineche‐Schmidt 1999; Meineche‐Schmidt 2000; Meneiche‐Schmidt 2004; Miwa 2015; Mönnikes 2009; Mönnikes 2012; Nagahara 2015; Rabeneck 2001 (SODA); Reimer 2010; Rui 2015; Sakaguchi 2012; Sakurai 2012 (J‐FOCUS); Schwartz 2001; Theodoropoulos 2009; Veldhuyzen van Zanten 2005; van Zanten 2007; Zeng 2007). The reasons for exclusion were detailed in Characteristics of excluded studies table.
Studies awaiting classification
One study was published as an abstract only (Pilichiewicz 2011). We contacted the authors requesting further information but received no response.
Ongoing studies
One study was published as an abstract only and is an ongoing trial (NCT01456273). We contacted the authors requesting further information but received no response.
Risk of bias in included studies
Sequence generation (selection bias)
We categorized 15 trials as being at low risk of selection bias (Bolling‐Sternevald 2002; Fletcher 2011; Hsu 2011; Iwakiri 2013; Jiang 2011; Jung 2016; Li 2003; Peura 2004; Suzuki 2013 (ELF); Talley 1998 (BOND); Talley 1998 (OPERA); Talley 2007; Van Rensburg 2008; Van Zanten 2006; Wong 2002), and the rest as unclear risk of selection bias. A graphical representation of the 'risk of bias' assessment is shown in Figure 2 (a summary of the risk of bias) and Figure 3 (which shows the risk of bias for individual studies).
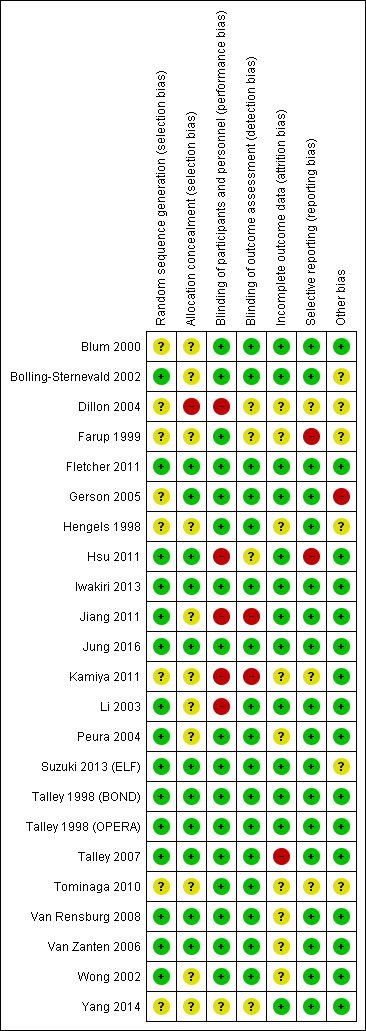
Risk of bias summary: review authors' judgements about each risk of bias item for each included study.
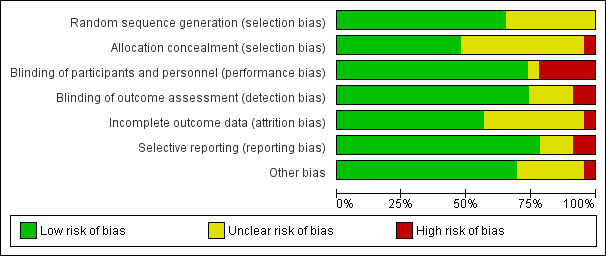
Risk of bias graph: review authors' judgements about each risk of bias item presented as percentages across all included studies.
Allocation
Allocation concealment was adequate and therefore at low risk of bias in 11 trials (Fletcher 2011; Gerson 2005; Hsu 2011; Iwakiri 2013; Jung 2016; Suzuki 2013 (ELF); Talley 1998 (BOND); Talley 1998 (OPERA); Talley 2007; Van Rensburg 2008; Van Zanten 2006). One study was single blind and therefore at high risk of selection bias related to allocation concealment (Dillon 2004). The rest of the studies were unclear risk of bias.
Blinding
Seventeen studies were designed as double‐blind, and therefore as low risk of bias. Five studies were at high risk for performance bias (one single‐blind study (Dillon 2004), four open‐label studies (Hsu 2011; Jiang 2011; Kamiya 2011; Tominaga 2010), and one with no blinding (Li 2003)). Blinding of participants and personnel was unclear in one study (Yang 2014).
Seventeen studies were at low risk and two studies were at high risk of detection bias (Jiang 2011; Kamiya 2011). Blinding of outcomes assessors was unclear in four studies (Dillon 2004; Farup 1999; Hsu 2011; Yang 2014).
Incomplete outcome data
Thirteen studies reported all planned outcomes, which also provided data for intention‐to‐treat (ITT) analysis. Discontinued participants were imbalanced between arms in one study (Talley 2007), and therefore identified at high risk for attrition bias. Information on lost to follow‐up or discontinuation of treatment was unclear in nine studies (Dillon 2004; Farup 1999; Hengels 1998; Kamiya 2011; Peura 2004; Tominaga 2010; Van Rensburg 2008; Van Zanten 2006; Wong 2002). Most trials did not report data from participants who dropped out.
Selective reporting
We attempted to identify protocols to check that studies reported prespecified outcomes. Eighteen studies reported all intended outcomes, and therefore were at low risk of bias. One study reported that symptomatic improvement was initially planned for low‐dose omeprazole versus high‐dose (Farup 1999). Because of similar effect and low numbers of participants, the results were grouped; however, the individual data were not shown. This study, and another that terminated early (Hsu 2011), were identified as high risk of reporting bias. There was insufficient information on planned outcomes in other three trials and therefore risk for reporting bias was unclear for these studies (Dillon 2004; Kamiya 2011; Tominaga 2010).
Other potential sources of bias
Sixteen trials were at low risk of other bias. Six trials were at unclear risk of other bias (Bolling‐Sternevald 2002; Dillon 2004; Farup 1999; Hengels 1998; Suzuki 2013 (ELF); Tominaga 2010). We identified one study in which the groups had imbalanced symptoms scores at baseline, with a potential bias on the treatment effect estimate (Gerson 2005).
Risk of bias across studies
A funnel plot was performed including studies comparing PPI versus placebo. Visually the funnel plot appeared to be symmetrical (Figure 4); decreasing the chances of publication bias.
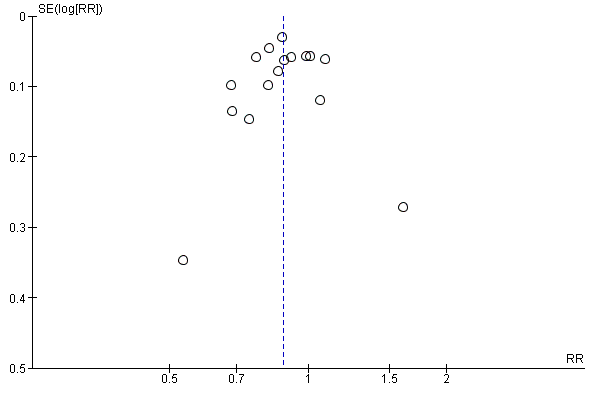
Funnel plot of comparison: 3 Proton pump inhibitors versus placebo, outcome: 3.1 Global symptoms (two to eight weeks).
Effects of interventions
See: Summary of findings for the main comparison Proton pump inhibitors (PPI) compared to placebo for functional dyspepsia; Summary of findings 2 Proton pump inhibitors (PPI) compared to H2 receptor antagonists (H2RA) for functional dyspepsia; Summary of findings 3 Proton pump inhibitors (PPI) compared to prokinetics for functional dyspepsia; Summary of findings 4 Proton pump inhibitors plus prokinetics compared to prokinetics alone for functional dyspepsia
Each paper could contribute more than one trial to the review as some evaluated more than two interventions.
Standard‐dose versus low‐dose proton pump inhibitor
Global symptoms of dyspepsia
Six studies with 2304 participants provided data to compare low‐ and standard‐dose PPI therapy for a reduction of global symptoms of dyspepsia (Blum 2000; Iwakiri 2013; Peura 2004; Talley 1998 (BOND); Talley 1998 (OPERA); Wong 2002). There was no difference between the two doses of PPI therapy (RR of remaining dyspeptic on standard‐dose PPI 0.97, 95% CI 0.92 to 1.02; P = 0.21) with no heterogeneity between subgroups (I2 = 0%; Chi2 = 2.54; degrees of freedom (df) = 5; P = 0.77) (Analysis 1.1). Therefore, we combined results of all doses of PPI therapy in the following analyses.
Proton pump inhibitor versus placebo
Global symptoms of dyspepsia
Sixteen eligible studies with 5968 participants were included in the global assessment of dyspepsia analysis (Blum 2000; Bolling‐Sternevald 2002; Farup 1999; Fletcher 2011; Gerson 2005; Hengels 1998; Iwakiri 2013; Peura 2004; Suzuki 2013 (ELF); Talley 1998 (BOND); Talley 1998 (OPERA); Talley 2007; Tominaga 2010; Van Rensburg 2008; Van Zanten 2006; Wong 2002). PPI therapy was more effective than placebo, with 30% of the PPI group reporting no or minimal symptoms compared with 25% of the placebo group (RR of remaining dyspeptic 0.88, 95% CI 0.82 to 0.94; P < 0.001, random‐effects model) with an NNTB of 13. There was considerable heterogeneity between trials (I2 = 71%; Chi2 = 51.2; df = 15; P < 0.001) (Analysis 2.1) with funnel plot symmetry (Begg‐Mazumdar Kendall Tau ‐0.13 (P = 0.45); Egger's bias ‐0.33 (95% CI ‐2.49 to 1.83; P = 0.75); Horbold‐Egger ‐0.62 (92.5% CI ‐2.67 to 1.43; P = 0.57).
Quality of life
Six studies investigated the effect of PPIs versus placebo on QoL (Blum 2000; Bolling‐Sternevald 2002; Talley 1998 (BOND); Talley 1998 (OPERA); Van Zanten 2006; Wong 2002). Blum 2000 assessed QoL using validated questionnaire translated to German. The authors reported an improvement on QoL with standard doses of omeprazole compared to placebo in H. pylori‐positive participants but the effect was not so pronounced in H. pylori‐negative participants (data were not shown). In a similar direction, Van Zanten 2006 found differences in improvement of five domains of the Quality of Life in Reflux and Dyspepsia (QoLRAD) questionnaire at four weeks but not at eight weeks for esomeprazole versus placebo. In contrast, four trials found no differences in QoL assessed by the Psychological General Well‐Being Index (PGWBI) (Bolling‐Sternevald 2002; Talley 1998 (BOND); Talley 1998 (OPERA)) or by the 36‐item Short Form (SF‐36) (Wong 2002). Data were not shown in the study by Bolling‐Sternevald 2002.
We found data for quantitative analysis for three studies from two papers (Talley 1998 (BOND); Talley 1998 (OPERA); Wong 2002). There were no differences in QoL between PPIs and placebo assessed by the PGWBI (MD 0.54, 95% CI ‐1.55 to 2.63) (Talley 1998 (BOND); Talley 1998 (OPERA)) or by the SF‐36 (MD ‐1.11, 95% CI ‐5.32 to 3.10) (Wong 2002) (Analysis 2.9).
Adverse events
Thirteen studies comparing PPIs versus placebo reported information on adverse events (Blum 2000; Bolling‐Sternevald 2002; Farup 1999; Fletcher 2011;Hengels 1998; Iwakiri 2013; Peura 2004; Talley 1998 (BOND); Talley 1998 (OPERA); Talley 2007; Van Rensburg 2008; Van Zanten 2006; Wong 2002). We excluded data from seven studies from the meta‐analysis (Bolling‐Sternevald 2002; Farup 1999; Peura 2004; Suzuki 2013 (ELF); Talley 1998 (BOND); Talley 1998 (OPERA); Wong 2002). Peura 2004 reported individual adverse events on diarrhoea (8/308 for lansoprazole versus 4/308 for placebo) and headache (7/308 for lansoprazole and 9/308 for placebo) rather than overall adverse events. Farup 1999 found no clinically significant adverse events; however, information on adverse events was not shown. Suzuki 2013 (ELF) reported only mild symptoms during the test period; however, it was unclear to which group the adverse events were attributed. The other four trials reported participants that dropped out of the study due to adverse events rather than overall adverse events (Bolling‐Sternevald 2002; Talley 1998 (BOND); Talley 1998 (OPERA); Wong 2002). Two studies did not report adverse events (Gerson 2005; Tominaga 2010). There were no differences on adverse events in PPIs compared to placebo (RR 1.04, 95% CI 0.80 to 1.35) (Analysis 2.10).
Proton pump inhibitor versus H2 receptor antagonist
Global symptoms of dyspepsia
We identified two trials comparing the effect of PPIs versus H2‐receptor antagonist on global assessment of dyspepsia (Blum 2000; Dillon 2004). One study compared omeprazole 20 mg and 10 mg with ranitidine 150 mg over a period of two weeks (Blum 2000). The other study was a completed trial that was only published in abstract form, evaluating the effect of lansoprazole 30 mg versus ranitidine 150 mg twice daily over a period of eight weeks (Dillon 2004). There was no difference between PPI and H2RA therapy (RR of remaining dyspeptic on PPI therapy 0.88, 95% CI 0.74 to 1.04; P = 0.14) with an NNTB of 13. There was substantial heterogeneity between the two trials (I2 = 51%; Chi2 = 2.05; df = 1) (Analysis 3.1).
Quality of life
No studies compared the effect of PPIs versus H2RAs for QoL.
Adverse events
One study comparing PPIs versus H2RA reported adverse events (Blum 2000). There were no differences on adverse events in PPIs compared to H2RA therapy (RR 0.95, 95% CI 0.62 to 1.45) (Analysis 3.2).
Proton pump inhibitor versus prokinetic
Global symptoms of dyspepsia
We identified five studies comparing the effect of PPI versus different prokinetics with 990 participants (Hsu 2011; Jiang 2011; Jung 2016; Kamiya 2011; Li 2003). The length of treatment for all studies was two to four weeks. Two of the studies compared mosapride 5 mg three times a day versus lansoprazole (Hsu 2011) or pantoprazole (Jiang 2011) for two weeks. One study compared itopride versus rabeprazole (Kamiya 2011), one study compared cisapride versus omeprazole (Li 2003), and one study investigated the effect of a new prokinetic, DA 9701 with pantoprazole 40 mg (Jung 2016). One study was published as an abstract, and the manuscript was provided by the author (Kamiya 2011). A decrease in FD scores (GSRS) was observed in people randomized to rabeprazole compared to itopride after two weeks (P = 0.002) and four weeks (P = 0.049) of treatment. However, we found insufficient information for data synthesis. Therefore, the meta‐analysis included four studies. Pooled data revealed a small difference in favour of PPI compared to prokinetics (RR 0.90, 95% CI 0.81 to 1.00; P = 0.04) with an NNTB of 20. There was no heterogeneity observed between the studies (I2 = 0%; Chi2 = 0.81; df = 3; P = 0.85) (Analysis 4.1).
Quality of life
One study evaluated the effect of pantoprazole versus prokinetics using the Korean version of the Nepean Dyspepsia Index. There was no difference on QoL after four weeks of treatment (MD ‐0.50, 95% CI ‐4.42 to 3.42).
Adverse events
Four studies comparing PPIs versus prokinetics reported adverse events (Hsu 2011; Jiang 2011; Jung 2016; Li 2003). There were no differences on adverse events in PPIs compared to prokinetics therapy (RR 0.84, 95% CI 0.39 to 1.83) (Analysis 4.3).
Proton pump inhibitor plus prokinetic versus prokinetic alone
Global symptoms of dyspepsia
Two studies evaluated the effect of PPIs combined with prokinetics compared to prokinetics alone on global assessment of dyspepsia (Jung 2016; Yang 2014). One study evaluated the effect of pantoprazole plus mosapride versus mosapride three times a day for one, three and six months (Yang 2014). The other study evaluated the effect of pantoprazole plus DA 9701 compared to pantoprazole alone or DA 9701 alone for four weeks (Jung 2016). There was no difference between PPI plus prokinetics compared to prokinetics alone (RR 0.85, 95% CI 0.68 to 1.08; P = 0.18) with an NNTB of 18. There was no heterogeneity between the studies (I2 = 0%; Chi2 = 0.45; df = 1; P = 0.5) (Analysis 5.1).
Quality of life
Two studies evaluated QoL in people with FD treated with PPIs plus prokinetics versus prokinetics alone (Jung 2016; Yang 2014). One study compared pantoprazole plus DA 9701 versus DA 9701 alone using the Korean version of the Nepean Dyspepsia Index. There was no difference on QoL after four weeks of treatment (MD ‐1.10, 95% CI ‐5.22 to 3.02) (Jung 2016). One study reported that QoL scores assessed by the Functional Digestive Disorders Quality of Life questionnaire (FDDQL) were significantly higher in the PPI plus prokinetic group versus prokinetic alone group at four weeks of treatment (mean ± SD: 89.52 ± 6.04 with pantoprazole plus mosapride versus 70.56 ± 6.08 with mosapride; P < 0.001); however, baseline data were not provided (Yang 2014).
Adverse events
Two studies comparing PPIs combined with prokinetics versus prokinetics alone reported adverse events (Jiang 2011; Jung 2016). There were slightly fewer adverse events with PPIs plus prokinetics compared to prokinetics alone (RR 0.60, 95% CI 0.39 to 0.93) (Analysis 5.3).
Subgroup analyses
Duration of treatment
We performed a subgroup analysis to assess the efficacy of PPI versus placebo according to the duration of treatment (Analysis 2.2). From the 16 studies, four studies involving 1169 participants evaluated the effect of PPI versus placebo after two weeks of treatment (Blum 2000; Bolling‐Sternevald 2002; Fletcher 2011; Hengels 1998) (RR of remaining dyspeptic on PPI after two weeks 0.78, 95% CI 0.70 to 0.87). Ten studies from nine papers involving 3540 participants evaluated the effect of PPI versus placebo after four weeks of treatment (Farup 1999; Gerson 2005; Suzuki 2013 (ELF); Talley 1998 (BOND); Talley 1998 (OPERA); Talley 2007; Tominaga 2010; Van Rensburg 2008; Van Zanten 2006; Wong 2002) (RR of remaining dyspeptic on PPI after four weeks 0.93, 95% CI 0.84 to 1.03). Two studies involving 1259 participants evaluated the effect of PPI versus placebo after eight weeks of treatment (Iwakiri 2013; Peura 2004) (RR of remaining dyspeptic on PPI after eight weeks 0.89, 95% CI 0.84 to 0.94). There was no difference between subgroups (I2 = 65%; Chi2 = 5.71; df = 2; P = 0.061).
Dose
As mentioned at the beginning of the Effects of interventions section, there was no difference between the two doses of PPI therapy (RR of remaining dyspeptic on standard‐dose versus low‐dose PPI 0.97, 95% CI 0.92 to 1.02; P = 0.21) with no heterogeneity between studies (I2 = 0%; Chi2 = 2.54; df = 5; P = 0.77) (Analysis 1.1). All doses were combined for the analyses, therefore subgroup analyses on dose was not possible.
Geographical location
We performed a subgroup analysis to assess the efficacy of PPI versus placebo according to the origin of the study (Analysis 2.3). For the multicentre studies, we allocated them to the Western countries subgroup, as most of the sites were in the Western area. Twelve studies, involving 5009 participants evaluating the effect of PPI versus placebo originated in western countries (RR of remaining dyspeptic 0.86, 95% CI 0.80 to 0.92) (Blum 2000; Bolling‐Sternevald 2002; Farup 1999; Fletcher 2011; Gerson 2005; Hengels 1998; Peura 2004; Talley 1998 (BOND); Talley 1998 (OPERA); Talley 2007; Van Rensburg 2008; Van Zanten 2006). Four studies involving 959 participants evaluating the effect of PPI versus placebo originated in Eastern countries (RR of remaining dyspeptic 0.97, 95% CI 0.84 to 1.11) (Iwakiri 2013; Suzuki 2013 (ELF); Tominaga 2010; Wong 2002) (Analysis 2.3). There was no difference between subgroups (Chi2 = 2.21; df = 1; P = 0.14).
Helicobacter pylori status
Eight studies comparing PPIs versus placebo provided information of the impact of H. pylori status on dyspepsia (Blum 2000; Bolling‐Sternevald 2002; Hengels 1998; Iwakiri 2013; Talley 1998 (BOND); Talley 1998 (OPERA); Talley 2007; Wong 2002). Data from individual studies Talley 1998 (BOND) and Talley 1998 (OPERA) were not provided in the paper, therefore they were combined for the analysis. There was insufficient information on H. pylori status in eligible comparison in the study by Talley 2007, for the previous reason this study was excluded from the analysis. In addition, one of the studies reported that H. pylori status had no effect on treatment response; however, data were not reported in the paper (Van Zanten 2006). Subgroup analysis in studies evaluating PPI versus placebo in the relief of dyspeptic symptoms in H. pylori‐positive participants (RR 0.84, 95% CI 0.76 to 0.93) and H. pylori‐negative participants (RR 0.94, 95% CI 0.83 to 1.06) showed no difference between subgroups (I2 = 44.2%; Chi2 = 1.79; df = 1; P = 0.18) (Analysis 2.4).
Proton pump inhibitor subtype
We performed a subgroup analysis to assess the efficacy of PPI versus placebo according to the PPI subtype (Analysis 2.5). Six studies including 2107 participants compared standard doses of omeprazole (20 mg/day) versus placebo (Blum 2000; Bolling‐Sternevald 2002; Farup 1999; Gerson 2005; Talley 1998 (BOND); Talley 1998 (OPERA)) (RR of dyspeptic symptoms on omeprazole 0.87, 95% CI 0.77 to 0.98). Five studies compared lansoprazole versus placebo; three used standard‐dose (30 mg/day) (Fletcher 2011; Peura 2004; Wong 2002), and four use low‐dose (15 mg/day) (Hengels 1998; Peura 2004; Suzuki 2013 (ELF); Wong 2002) (RR of dyspeptic symptoms on lansoprazole 0.82, 95% CI 0.70 to 0.97). Two studies compared esomeprazole 40 mg/day (Talley 2007; Van Zanten 2006) (RR of dyspeptic symptoms on esomeprazole 0.95, 95% CI 0.83 to 1.08). One study compared pantoprazole 20 mg versus placebo (Van Rensburg 2008) (RR of dyspeptic symptoms on pantoprazole 0.82, 95% CI 0.68 to 1.00). One study compared different doses of rabeprazole (10 mg/day, 20 mg/day and 40 mg/day) with placebo (Iwakiri 2013) and one study compared rabeprazole 10 mg/day with placebo (Tominaga 2010) (RR of dyspeptic symptoms on rabeprazole 0.95, 95% CI 0.84 to 1.08). There was no difference between subgroups (I2 = 0%; Chi2 = 3.62; df = 4; P = 0.46).
Presence of reflux (abnormal 24‐hour pH study)
Two studies provided data on the efficacy of PPI therapy versus placebo in participants subgrouped according to abnormal 24‐hour pH study (greater than 4% pH less than 4: RR 0.91, 95% CI 0.70 to 1.19) or normal 24‐hour pH study (less than 4% pH less than 4: RR 1.27, 95% CI 0.49 to 3.29) (Bolling‐Sternevald 2002; Gerson 2005). There was no difference between subgroups (I2 = 0%; Chi2 = 0.45; df = 1; P = 0.50) (Analysis 2.6).
Rome III dyspepsia subtypes
Two studies provided data on the efficacy of PPI therapy versus placebo in participants subgrouped according to Rome III epigastric pain syndrome (RR of remaining dyspeptic 0.99, 95% CI 0.76 to 1.28) and postprandial distress subtypes (RR of remaining dyspeptic 0.89, 95% CI 0.77 to 1.03) (Iwakiri 2013; Suzuki 2013 (ELF). There was no difference between subgroups (I2 = 0%; Chi2 = 0.48; df = 1; P = 0.49) (Analysis 2.7).
Risk of bias
Three studies comparing PPIs versus placebo had high risk of bias (Farup 1999; Gerson 2005; Talley 2007) (RR 1.00, 95% CI 0.64 to 1.56). The other studies were at low risk of bias (RR 0.83, 95% CI 0.72 to 0.95) or unclear risk of bias (RR 0.89, 95% CI 0.82 to 0.96). There was no difference between subgroups (I2 = 0%; Chi2 = 1.08; df = 2; P = 0.58) (Analysis 2.8).
Funding
Source of funding was unclear in seven studies (Dillon 2004; Hengels 1998; Hsu 2011; Jiang 2011; Kamiya 2011; Li 2003; Yang 2014), and 16 studies were funded by a pharmaceutical company (Blum 2000; Bolling‐Sternevald 2002; Farup 1999; Fletcher 2011; Gerson 2005; Iwakiri 2013; Jung 2016; Peura 2004; Suzuki 2013 (ELF); Talley 1998 (BOND); Talley 1998 (OPERA); Talley 2007; Tominaga 2010; Van Rensburg 2008; Van Zanten 2006; Wong 2002). Considering that pharmaceutical companies sponsored all the studies with clear funding source, there was no need to perform the intended subgroup analysis to explore whether trial funding sources might have influenced the results.
Sensitivity analyses
Abstract inclusion
One study comparing PPIs versus H2RAs was published as a conference abstract (Dillon 2004). Sensitivity analysis removing this study showed that PPIs and H2RAs had similar effect on the relief of overall dyspeptic symptoms (RR 0.93, 95% CI 0.84 to 1.04; P = 0.21) (Analysis 3.3). However, it is unclear whether the exclusion of this study resolved heterogeneity as this analysis then included only one study.
Eligibility criteria (exclusion of open‐label studies)
We planned a sensitivity analysis to assess the effect of study quality, based on the exclusion of non‐blinded trials which were at high risk of performance or detection bias. There was no study at high‐risk of performance or detection bias in the comparison PPI versus placebo, therefore, sensitivity analysis was not performed for this comparison.
One study comparing PPIs versus H2RAs was at high risk of performance and selection bias (Dillon 2004). Sensitivity analysis removing this study showed that PPIs and H2RAs had a similar effect on the relief of overall dyspeptic symptoms (RR 0.93, 95% CI 0.84 to 1.04; P = 0.21) (Analysis 3.3). However, it is unclear whether the exclusion of this study resolved heterogeneity as this analysis then included only one study.
Three out of four studies comparing PPIs versus prokinetics were at high risk of performance bias (Hsu 2011; Jiang 2011; Li 2003), and one study was at high risk of detection bias (Jiang 2011). Sensitivity analysis after removing these studies showed that PPIs and prokinetics had similar effects on the relief of overall dyspeptic symptoms (RR 0.85, 95% CI 0.62 to 1.16; P = 0.31) (Analysis 4.5). However, it is unclear whether the exclusion of this study resolved heterogeneity as this analysis then included only one study.
Discussion
Summary of main results
Acid secretion inhibitory drugs are widely prescribed to people with FD worldwide, but the underlying mechanisms for their effectiveness in FD are unknown. One meta‐analysis showed that PPIs were effective in improving symptoms of FD, suggesting that a modest proportion of people with FD have an acid‐related disorder (Moayyedi 2011).
We demonstrated that PPIs were more effective than placebo for the treatment of FD, independent of the dose or duration of treatment. The symmetry found in the forest plot suggested that reporting bias (publication bias) was not a risk. We performed both effect estimates models and found results were similar. However, we found substantial heterogeneity between the studies. Subgroup analysis suggested that the variation in results between studies may not be explained by differences on country of origin, H. pylori status or subtype of PPI.
The effect of PPIs over placebo was not influenced by the presence of reflux symptoms or different subtypes of FD, suggesting that differentiation of these subtypes may not be needed.
We assessed the effect of other anti‐secretory alternatives, such as H2RAs. PPIs are probably slightly more effective than H2RAs for the treatment of FD. However, the evidence comes from only two RCTs including 740 participants and the effect size was small. Therefore, we consider there is insufficient data to be confident on the real effect estimate.
Prokinetics are an option for the treatment of FD. Our analysis showed that PPIs are probably slightly more effective than prokinetics at relieving overall dyspepsia symptoms in people with FD. However, we found that the majority of the studies involved in the analysis had methodological problems, which are likely to influence on the results.
This was already noted by an assessment of the quality of papers comparing prokinetics with placebo (Abraham 2004), suggesting that there is a need of studies with a greater quality.
PPIs were no more effective than placebo in improving QoL. However, data for quantitative analysis were available in a small proportion of studies reporting QoL as an outcome. Future studies are needed to confirm these results.
Finally, there were no differences in the rate of adverse events between PPIs and any of the comparisons including placebo, indicating that PPIs are safe for the treatment of FD.
Overall completeness and applicability of evidence
We identified 16 studies comparing PPIs versus placebo (Blum 2000; Bolling‐Sternevald 2002; Farup 1999; Fletcher 2011; Gerson 2005; Hengels 1998; Iwakiri 2013; Peura 2004; Suzuki 2013 (ELF); Talley 1998 (BOND); Talley 1998 (OPERA); Talley 2007; Tominaga 2010; Van Rensburg 2008; Van Zanten 2006; Wong 2002). In addition, we found one ongoing study from Brazil (NCT01456273; see Characteristics of ongoing studies table) and one study from Australia (Pilichiewicz 2011; see Characteristics of studies awaiting classification table) that were published as conference abstracts. We attempted to contact authors, but we did not obtain additional information. We will include these studies at updates of this review if we obtain further information and the trials meet our inclusion criteria.
All 16 published papers evaluating the effect of PPIs over placebo reported the effect of both treatments on symptoms of dyspepsia as an outcome. However, only nine of the 16 studies assessed QoL, and only three studies provided information that could be extracted and used for quantitative analysis.
Considering the 16 studies comparing PPIs versus placebo included in this review, we can conclude that these results are applicable to all people with FD independently of the criteria for definition. The fact that the results from our review were similar to the findings of previous systematic reviews (Moayyedi 2006; Wang 2007) support the beneficial effect of PPIs in FD. All the five studies included in the meta‐analysis of PPIs versus prokinetics originated from eastern countries, which may limit the results to this specific population (Hsu 2011; Jiang 2011; Jung 2016; Kamiya 2011; Li 2003).
Quality of the evidence
Proton pump inhibitor versus placebo
Overall, the quality of evidence was moderate. We downgraded the quality of evidence due to serious inconsistency. Even though some of the trials had an unclear risk of bias, the effect was evident and the majority of the studies reported a beneficial effect of PPI versus placebo. We are moderately confident that the true effect is likely to be close to that of the estimate of the effect.
Proton pump inhibitor versus H2 receptor antagonist
The quality of evidence was low. We downgraded the quality of evidence two levels due to a high risk of selection and performance bias in one study accounting for 22% of weight, and due to serious inconsistency. Our confidence in the effect estimate is limited: the true effect may be substantially different from the estimate of the effect.
Proton pump inhibitor versus prokinetic
All studies except one were open‐label; therefore, there was a high risk of performance and detection bias attributed to these studies. We downgraded the quality of evidence to low meaning that our confidence in the effect estimate is limited: the true effect may be substantially different from the estimate of the effect.
Proton pump inhibitors plus prokinetics versus prokinetics alone
The quality of evidence was moderate. We downgraded the quality of evidence one level due to serious imprecision. We are moderately confident that the true effect is likely to be close to that of the estimate of the effect.
Potential biases in the review process
We based our methods and reporting were based on the recommendation of the Cochrane Handbook for Systematic Reviews of Interventions (Higgins 2011). We consider that our methods and meta‐analyses were rigorous while searching for studies, selecting studies, performing data extraction and analysing data.
We aimed to be as transparent as possible and published the protocol in advance. However, as seen in all meta‐analyses, there may be some potential limitations related to our study.
One potential limitation could be related to the lack of information obtained from authors in two unpublished studies (Pilichiewicz 2011 (presently awaiting classification); NCT01456273 (presently an ongoing trial)), which we excluded from the review due to a lack of data. Although the lack of this information is likely to decrease our confidence in the results, this was outside of the control of the review authors.
Also, we noted that 12 out of 15 studies reported positive results, raising the possibility of publication bias. However, we considered that this is unlikely as the funnel plot was symmetrical.
Agreements and disagreements with other studies or reviews
There are multiple narrative reviews (Camillieri 2013; Savarino 2017; Stanghellini 2016; Suzuki 2011), but only two systematic reviews and meta‐analyses investigating the effects of PPIs in FD (Moayyedi 2006; Wang 2007). The scope of the reviews differed considerably. The comprehensive review evaluated different strategies for the treatment of FD including PPIs (Moayyedi 2006), while Wang 2007 limited the analysis to the effect of PPIs compared to placebo for the treatment of FD. The current review aimed to determine the efficacy of PPIs for FD not only compared with placebo but to other therapeutic options. In our review, two to eight weeks of PPIs were more effective than placebo in overall symptom improvement in people with FD. Although our review included eight more studies evaluating the effect of PPIs versus other treatments compared to the Moayyedi 2006 review, the results are consistent with the previous analyses. Similar to Moayyedi 2006 and Wang 2007, we found that PPIs are more effective than placebo in treating people with FD. We anticipated potential differences between studies that may have influenced the results, and prespecified analyses to identify sources of heterogeneity. In concordance with previous analyses, we found no differences in the effect between duration of treatment and dose of PPIs, by the presence of Rome III dyspepsia subtype. There is a discrepancy with our findings on the dyspepsia subtype compared to the analysis from Wang 2007, and this could be related to the inclusion of studies with different definitions of FD. While Wang 2007 considered reflux‐like or dysmotility‐like dyspepsia according to Rome II criteria, our analysis included also investigated epigastric pain syndrome versus postprandial distress syndrome according to Rome III criteria. The definition of FD using the Rome III criteria is stricter than previous definitions of FD in excluding participants with reflux symptoms, and, therefore, this could lead to differences on the results.
We have confirmed the findings from Moayyedi 2006 on the lack of a positive effect of PPIs over placebo on improving QoL.
We performed a subgroup analysis to investigate whether the effect of PPIs compared with placebo changed according to country of origin and PPI subtype. Although this was suggested by Wang 2007 as a potential source of heterogeneity, this was not the case in our analysis as we found no differences between subgroups. We also found no difference between PPI subtype. Our meta‐analysis is the first to perform subgroup analysis on PPI subtype and these results should be confirmed in future analyses.
Our analysis found that PPIs were slightly more effective than H2RAs. As previously reported by Moayyedi 2006, we found substantial heterogeneity and methodological differences between the two studies that may explain the inconsistent results. Wang 2007 did not assess the effect of PPIs versus H2RAs. Therefore, there is a need of studies comparing the effect of PPIs versus H2RAs in the treatment of FD, as they may be a more cost‐effective alternative.
Our results found that PPIs were slightly more effective than prokinetics at relieving overall dyspepsia symptoms in people with FD. This goes in a similar direction to the review by Moayyedi 2006. However, we consider that these results should be taken with caution, due to serious methodological concerns related to the majority of studies comparing PPIs versus prokinetics.
Finally, our review demonstrated that PPIs were relatively safe drugs with a similar number of adverse events compared to placebo, H2RAs and prokinetics. The safety of PPIs was in concordance with the results by Moayyedi 2006, but not explored in Wang 2007.
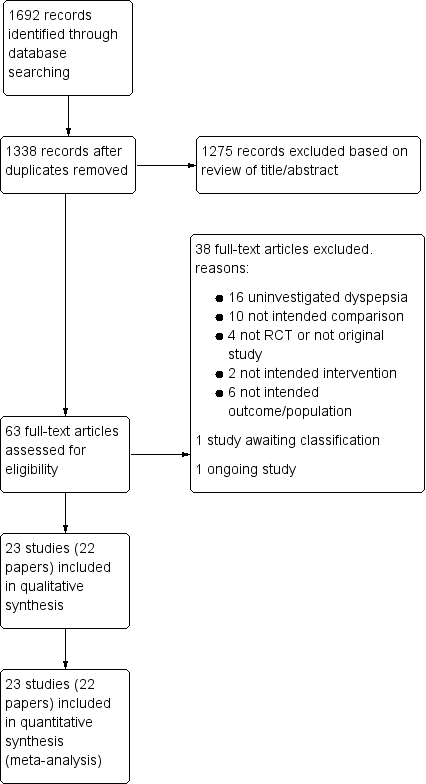
Study flow diagram.

Risk of bias summary: review authors' judgements about each risk of bias item for each included study.

Risk of bias graph: review authors' judgements about each risk of bias item presented as percentages across all included studies.

Funnel plot of comparison: 3 Proton pump inhibitors versus placebo, outcome: 3.1 Global symptoms (two to eight weeks).

Comparison 1 Standard‐dose versus low‐dose proton pump inhibitors (PPI), Outcome 1 Global symptoms of dyspepsia.

Comparison 2 Proton pump inhibitors (PPI) versus placebo, Outcome 1 Global symptoms of dyspepsia (2 to 8 weeks).

Comparison 2 Proton pump inhibitors (PPI) versus placebo, Outcome 2 Global symptoms of dyspepsia by duration of treatment.
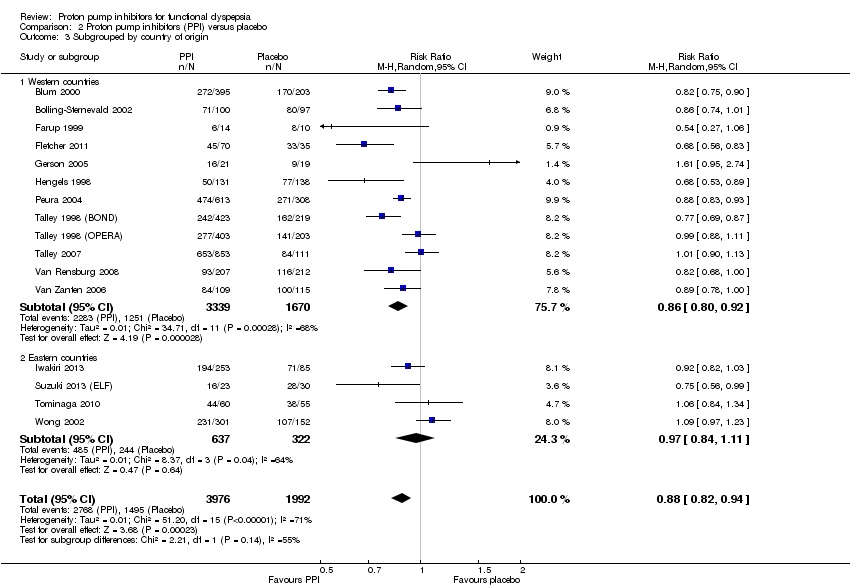
Comparison 2 Proton pump inhibitors (PPI) versus placebo, Outcome 3 Subgrouped by country of origin.

Comparison 2 Proton pump inhibitors (PPI) versus placebo, Outcome 4 Subgrouped byHelicobacter pylori status.

Comparison 2 Proton pump inhibitors (PPI) versus placebo, Outcome 5 Subgroup by PPI subtype.

Comparison 2 Proton pump inhibitors (PPI) versus placebo, Outcome 6 Subgrouped by 24‐hour pH study.

Comparison 2 Proton pump inhibitors (PPI) versus placebo, Outcome 7 Subgrouped by Rome III dyspepsia subtypes.

Comparison 2 Proton pump inhibitors (PPI) versus placebo, Outcome 8 Subgrouped by low vs unclear vs high risk of bias.

Comparison 2 Proton pump inhibitors (PPI) versus placebo, Outcome 9 Quality of life.

Comparison 2 Proton pump inhibitors (PPI) versus placebo, Outcome 10 Adverse events.
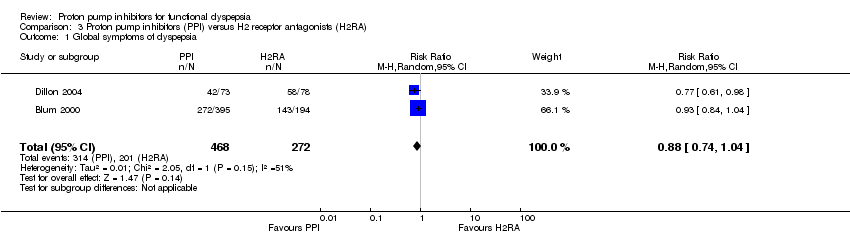
Comparison 3 Proton pump inhibitors (PPI) versus H2 receptor antagonists (H2RA), Outcome 1 Global symptoms of dyspepsia.

Comparison 3 Proton pump inhibitors (PPI) versus H2 receptor antagonists (H2RA), Outcome 2 Adverse events.

Comparison 3 Proton pump inhibitors (PPI) versus H2 receptor antagonists (H2RA), Outcome 3 Exclusion of study published in abstract format/open‐label studies.

Comparison 4 Proton pump inhibitors (PPI) versus prokinetics, Outcome 1 Global symptoms of dyspepsia (2 to 4 weeks).

Comparison 4 Proton pump inhibitors (PPI) versus prokinetics, Outcome 2 Quality of life.

Comparison 4 Proton pump inhibitors (PPI) versus prokinetics, Outcome 3 Adverse events.

Comparison 4 Proton pump inhibitors (PPI) versus prokinetics, Outcome 4 Exclusion of studies published in abstract format.

Comparison 4 Proton pump inhibitors (PPI) versus prokinetics, Outcome 5 Exclusion of open‐label studies.

Comparison 5 Proton pump inhibitors (PPI) plus prokinetics versus prokinetics alone, Outcome 1 Global symptoms of dyspepsia (2 to 4 weeks).

Comparison 5 Proton pump inhibitors (PPI) plus prokinetics versus prokinetics alone, Outcome 2 Quality of life.

Comparison 5 Proton pump inhibitors (PPI) plus prokinetics versus prokinetics alone, Outcome 3 Adverse events.
| PPI versus placebo for functional dyspepsia | ||||||
| Patient or population: adults with functional dyspepsia | ||||||
| Outcomes | Anticipated absolute effects* (95% CI) | Relative effect | No of participants | Quality of the evidence | Comments | |
| Risk with placebo | Risk with PPI | |||||
| Global symptoms of dyspepsia Follow‐up: 2 to 8 weeks | Study population | RR 0.88 | 5968 | ⊕⊕⊕⊝ | Measurement of no improvement. | |
| 751 per 1000 | 660 per 1000 | |||||
| Quality of life | SF‐36 scale from: 0 to 100 | ‐ | 453 | ⊕⊕⊕⊝ | Higher scores mean better quality of life. | |
| The mean quality of life was 0 | MD 1.11 lower | |||||
| Psychological General Well‐Being Index from: 0 to 110 | ‐ | 1177 | ⊕⊕⊕⊝ | Higher scores mean better quality of life. | ||
| The mean quality of life was 0 | MD 0.54 higher | |||||
| Adverse events Follow‐up: range 2 to 8 weeks | Study population | RR 1.04 | 2917 | ⊕⊕⊕⊝ | Number of adverse events. | |
| 167 per 1000 | 174 per 1000 | |||||
| *The risk in the intervention group (and its 95% confidence interval) is based on the assumed risk in the comparison group and the relative effect of the intervention (and its 95% CI). CI: confidence interval; H2RA: H2 receptor antagonist; MD: mean difference; PPI: proton pump inhibitor; RCT: randomized controlled trial; RR: risk ratio. | ||||||
| GRADE Working Group grades of evidence | ||||||
| 1 Downgraded one level due to serious inconsistency. 2 Downgraded one level due to imprecision (95% CI included appreciable benefit and harm). | ||||||
| PPI vs H2RA for functional dyspepsia | ||||||
| Patient or population: adults with functional dyspepsia | ||||||
| Outcomes | Anticipated absolute effects* (95% CI) | Relative effect | No of participants | Quality of the evidence | Comments | |
| Risk with H2RA | Risk with PPI | |||||
| Global symptoms of dyspepsia | Study population | RR 0.88 | 740 | ⊕⊕⊝⊝ | Measurement of no improvement. | |
| 739 per 1000 | 650 per 1000 | |||||
| Quality of life | 0 per 1000 | 0 per 1000 | Not estimable | (0 studies) | ‐ | No data available. |
| Adverse events Follow‐up range 2 to 8 weeks | Study population | RR 0.95 | 589 | ⊕⊕⊝⊝ | Number of adverse events. | |
| 144 per 1000 | 137 per 1000 | |||||
| *The risk in the intervention group (and its 95% confidence interval) is based on the assumed risk in the comparison group and the relative effect of the intervention (and its 95% CI). CI: confidence interval; H2RA: H2 receptor antagonist; PPI: proton pump inhibitor; RCT: randomized controlled trial; RR: risk ratio. | ||||||
| GRADE Working Group grades of evidence | ||||||
| 1 Downgraded two levels due to high risk of selection bias and performance bias in one study accounting for 33.9% of weight. 2 Downgraded one level due to serious imprecision. 3 Downgraded one level due to very few events (3). | ||||||
| PPI vs prokinetics for functional dyspepsia | ||||||
| Patient or population: adults with functional dyspepsia | ||||||
| Outcomes | Anticipated absolute effects* (95% CI) | Relative effect | No of participants | Quality of the evidence | Comments | |
| Risk with prokinetic | Risk with PPI | |||||
| Global symptoms of dyspepsia Follow‐up: range 2 to 4 weeks | Study population | RR 0.90 | 892 | ⊕⊕⊝⊝ | Measurement of no improvement. | |
| 571 per 1000 | 514 per 1000 | |||||
| Quality of life Follow‐up: range 2 to 4 weeks | The mean quality of life was 0 | MD 0.5 lower | ‐ | 262 | ⊕⊕⊕⊝ | Higher scores denote better outcome. |
| Adverse events Follow‐up: range 4 weeks | Study population | RR 0.84 | 899 | ⊕⊕⊕⊝ | Number of adverse events. | |
| 129 per 1000 | 109 per 1000 | |||||
| *The risk in the intervention group (and its 95% confidence interval) is based on the assumed risk in the comparison group and the relative effect of the intervention (and its 95% CI). CI: confidence interval; PPI: proton pump inhibitor; RCT: randomized controlled trial; RR: risk ratio. | ||||||
| GRADE Working Group grades of evidence | ||||||
| 1 Downgraded one level due to serious imprecision. 2 Downgraded one level due to serious inconsistency. 3 We did not consider the impact of risk of bias and inconsistency on the results to be serious enough to justify fully downgrading two levels so we have downgraded one level in respect of both considerations. | ||||||
| PPI + prokinetics vs prokinetics alone for functional dyspepsia | ||||||
| Patient or population: adults with functional dyspepsia | ||||||
| Outcomes | Anticipated absolute effects* (95% CI) | Relative effect | No of participants | Quality of the evidence | Comments | |
| Risk with prokinetic alone | Risk with PPI + prokinetic | |||||
| Global symptoms of dyspepsia Follow‐up range: 2 to 4 weeks | Study population | RR 0.85 | 407 | ⊕⊕⊕⊝ | Measurement of no improvement. | |
| 444 per 1000 | 377 per 1000 | |||||
| Quality of life Follow‐up: 4 weeks | The mean quality of life was 0 | MD 1.1 lower | ‐ | 258 | ⊕⊕⊕⊝ | Higher scores denote better outcome. |
| Adverse events Follow‐up: 4 weeks | Study population | RR 0.60 | 407 | ⊕⊕⊕⊝ | Number of adverse events. | |
| 220 per 1000 | 132 per 1000 | |||||
| *The risk in the intervention group (and its 95% confidence interval) is based on the assumed risk in the comparison group and the relative effect of the intervention (and its 95% CI). CI: confidence interval; PPI: proton pump inhibitor; RCT: randomized controlled trial; RR: risk ratio. | ||||||
| GRADE Working Group grades of evidence | ||||||
| 1 Downgraded one level due to imprecision (95% CI included appreciable benefit and harm). | ||||||
| Functional dyspepsia | Rome I (1991) | Rome II (1999) | Rome III (2006) | AGA Working Group | Lancet Working Group (1998) |
| Main criteria | Pain or discomfort centred in the upper abdomen with no evidence of organic disease. | Persistent or recurrent symptoms (pain or discomfort centred in the upper abdomen). AND No evidence that dyspepsia is exclusively relieved by defecation or associated with the onset of a change in stool frequency or stool form (exclude irritable bowel syndrome and exclude reflux). | ≥ 1 symptoms need to be present:
| Chronic or recurrent pain or discomfort centred in the upper abdomen. | Chronic or recurrent pain or discomfort centred in the upper abdomen or retrosternal pain, discomfort, heartburn, nausea, vomiting or other symptoms of the gastrointestinal tract. |
| Normal upper endoscopy | Required. | Required. | Required. | Required. | Required. |
| Symptoms present for the last... | ‐ | 12 weeks which need not be consecutive. | Criteria fulfilled for the last 3 months. | ≥ 3 months. | ≥ 4 weeks. |
| Onset of symptoms | ‐ | 12 months. | 6 months. | ‐ | ‐ |
| Subtypes |
|
|
| ‐ | Reflux‐like dyspepsia. |
| AGA: American Gastroenterological Association. | |||||
| Proton pump inhibitor | Daily standard dose |
| Dex‐lansoprazole | 30 mg |
| Esomeprazole | 20 mg to 40 mg |
| Lansoprazole | 30 mg |
| Omeprazole | 20 mg |
| Pantoprazole | 40 mg |
| Rabeprazole | 20 mg |
| Outcome or subgroup title | No. of studies | No. of participants | Statistical method | Effect size |
| 1 Global symptoms of dyspepsia Show forest plot | 6 | 2304 | Risk Ratio (M‐H, Random, 95% CI) | 0.97 [0.92, 1.02] |
| Outcome or subgroup title | No. of studies | No. of participants | Statistical method | Effect size |
| 1 Global symptoms of dyspepsia (2 to 8 weeks) Show forest plot | 16 | 5968 | Risk Ratio (M‐H, Random, 95% CI) | 0.88 [0.82, 0.94] |
| 2 Global symptoms of dyspepsia by duration of treatment Show forest plot | 16 | Risk Ratio (M‐H, Random, 95% CI) | Subtotals only | |
| 2.1 2 weeks' therapy | 4 | 1169 | Risk Ratio (M‐H, Random, 95% CI) | 0.78 [0.70, 0.87] |
| 2.2 4 weeks' therapy | 10 | 3540 | Risk Ratio (M‐H, Random, 95% CI) | 0.93 [0.84, 1.03] |
| 2.3 8 weeks' therapy | 2 | 1259 | Risk Ratio (M‐H, Random, 95% CI) | 0.89 [0.84, 0.94] |
| 3 Subgrouped by country of origin Show forest plot | 16 | 5968 | Risk Ratio (M‐H, Random, 95% CI) | 0.88 [0.82, 0.94] |
| 3.1 Western countries | 12 | 5009 | Risk Ratio (M‐H, Random, 95% CI) | 0.86 [0.80, 0.92] |
| 3.2 Eastern countries | 4 | 959 | Risk Ratio (M‐H, Random, 95% CI) | 0.97 [0.84, 1.11] |
| 4 Subgrouped byHelicobacter pylori status Show forest plot | 6 | 3023 | Risk Ratio (M‐H, Random, 95% CI) | 0.89 [0.82, 0.96] |
| 4.1 H. pylori negative | 6 | 1721 | Risk Ratio (M‐H, Random, 95% CI) | 0.94 [0.83, 1.06] |
| 4.2 H. pylori positive | 6 | 1302 | Risk Ratio (M‐H, Random, 95% CI) | 0.84 [0.76, 0.93] |
| 5 Subgroup by PPI subtype Show forest plot | 16 | 5968 | Risk Ratio (M‐H, Random, 95% CI) | 0.88 [0.82, 0.94] |
| 5.1 Omeprazole vs placebo | 6 | 2107 | Risk Ratio (M‐H, Random, 95% CI) | 0.87 [0.77, 0.98] |
| 5.2 Esomeprazole vs placebo | 2 | 1188 | Risk Ratio (M‐H, Random, 95% CI) | 0.95 [0.83, 1.08] |
| 5.3 Lansoprazole vs placebo | 5 | 1801 | Risk Ratio (M‐H, Random, 95% CI) | 0.82 [0.70, 0.97] |
| 5.4 Pantoprazole vs placebo | 1 | 419 | Risk Ratio (M‐H, Random, 95% CI) | 0.82 [0.68, 1.00] |
| 5.5 Rabeprazole vs placebo | 2 | 453 | Risk Ratio (M‐H, Random, 95% CI) | 0.95 [0.84, 1.08] |
| 6 Subgrouped by 24‐hour pH study Show forest plot | 2 | 168 | Risk Ratio (M‐H, Random, 95% CI) | 1.03 [0.73, 1.47] |
| 6.1 Abnormal 24‐hour pH test (> 4% pH < 4) | 2 | 75 | Risk Ratio (M‐H, Random, 95% CI) | 0.91 [0.70, 1.19] |
| 6.2 Normal 24‐hour pH test (< 4% pH < 4) | 2 | 93 | Risk Ratio (M‐H, Random, 95% CI) | 1.27 [0.49, 3.29] |
| 7 Subgrouped by Rome III dyspepsia subtypes Show forest plot | 2 | 326 | Risk Ratio (M‐H, Random, 95% CI) | 0.91 [0.80, 1.03] |
| 7.1 Epigastric pain syndrome | 2 | 77 | Risk Ratio (M‐H, Random, 95% CI) | 0.99 [0.76, 1.28] |
| 7.2 Postprandial distress syndrome | 2 | 249 | Risk Ratio (M‐H, Random, 95% CI) | 0.89 [0.77, 1.03] |
| 8 Subgrouped by low vs unclear vs high risk of bias Show forest plot | 16 | 5968 | Risk Ratio (M‐H, Random, 95% CI) | 0.88 [0.82, 0.94] |
| 8.1 Low risk of bias | 5 | 1744 | Risk Ratio (M‐H, Random, 95% CI) | 0.83 [0.72, 0.95] |
| 8.2 Unclear risk of bias | 8 | 3196 | Risk Ratio (M‐H, Random, 95% CI) | 0.89 [0.82, 0.96] |
| 8.3 High risk of bias | 3 | 1028 | Risk Ratio (M‐H, Random, 95% CI) | 1.00 [0.64, 1.56] |
| 9 Quality of life Show forest plot | 3 | Mean Difference (IV, Random, 95% CI) | Subtotals only | |
| 9.1 Psychological General Well‐Being Index | 2 | 1177 | Mean Difference (IV, Random, 95% CI) | 0.54 [‐1.55, 2.63] |
| 9.2 36‐item Short Form | 1 | 453 | Mean Difference (IV, Random, 95% CI) | ‐1.11 [‐5.32, 3.10] |
| 10 Adverse events Show forest plot | 7 | 2917 | Risk Ratio (M‐H, Random, 95% CI) | 1.04 [0.80, 1.35] |
| Outcome or subgroup title | No. of studies | No. of participants | Statistical method | Effect size |
| 1 Global symptoms of dyspepsia Show forest plot | 2 | 740 | Risk Ratio (M‐H, Random, 95% CI) | 0.88 [0.74, 1.04] |
| 2 Adverse events Show forest plot | 1 | 589 | Risk Ratio (M‐H, Random, 95% CI) | 0.95 [0.62, 1.45] |
| 3 Exclusion of study published in abstract format/open‐label studies Show forest plot | 1 | 589 | Risk Ratio (M‐H, Random, 95% CI) | 0.93 [0.84, 1.04] |
| Outcome or subgroup title | No. of studies | No. of participants | Statistical method | Effect size |
| 1 Global symptoms of dyspepsia (2 to 4 weeks) Show forest plot | 4 | 892 | Risk Ratio (M‐H, Random, 95% CI) | 0.90 [0.81, 1.00] |
| 2 Quality of life Show forest plot | 1 | 262 | Mean Difference (IV, Random, 95% CI) | ‐0.5 [‐4.42, 3.42] |
| 3 Adverse events Show forest plot | 4 | 899 | Risk Ratio (M‐H, Random, 95% CI) | 0.84 [0.39, 1.83] |
| 4 Exclusion of studies published in abstract format Show forest plot | 4 | 892 | Risk Ratio (M‐H, Random, 95% CI) | 0.90 [0.81, 1.00] |
| 5 Exclusion of open‐label studies Show forest plot | 1 | 262 | Risk Ratio (M‐H, Random, 95% CI) | 0.85 [0.62, 1.16] |
| Outcome or subgroup title | No. of studies | No. of participants | Statistical method | Effect size |
| 1 Global symptoms of dyspepsia (2 to 4 weeks) Show forest plot | 2 | 407 | Risk Ratio (M‐H, Random, 95% CI) | 0.85 [0.68, 1.08] |
| 2 Quality of life Show forest plot | 1 | 258 | Mean Difference (IV, Random, 95% CI) | ‐1.10 [‐5.22, 3.02] |
| 3 Adverse events Show forest plot | 2 | 407 | Risk Ratio (M‐H, Random, 95% CI) | 0.60 [0.39, 0.93] |