Inhibidores de la bomba de protones para la dispepsia funcional
Resumen
Antecedentes
La dispepsia funcional (DF o dispepsia no ulcerosa) se define como dolor o malestar epigástrico continuo o frecuentemente recurrente para el que no se puede encontrar una causa orgánica. El tratamiento supresivo de los ácidos, que incluye los inhibidores de la bomba de protones (IBP), se ha propuesto como una opción terapéutica en la DF, pero su eficacia todavía es polémica. Aunque los IBP en general se consideran seguros y bien tolerados, se han asociado con eventos adversos, especialmente a largo plazo. Por este motivo, las decisiones sobre si iniciar o continuar el tratamiento con IBP se deben basar en una indicación clínica apropiada. Por lo tanto, se realizó una revisión sistemática para evaluar si el tratamiento con IBP proporciona alivio sintomático en la DF.
Objetivos
Determinar la eficacia de los inhibidores de la bomba de protones en la mejoría de los síntomas generales de dispepsia y en la calidad de vida en comparación con placebo, antagonistas de los receptores H2 o proquinéticos, en pacientes con dispepsia funcional.
Métodos de búsqueda
Se realizaron búsquedas en las siguientes bases de datos electrónicas: la Cochrane Library (hasta mayo de 2017), MEDLINE (OvidSP; hasta mayo de 2017), Embase (OvidSP; hasta mayo de 2017) y SIGLE grey literature (hasta mayo de 2017) y registros de ensayos clínicos; se realizaron búsquedas manuales en los resúmenes de los congresos hasta mayo de 2017. Se examinaron revisiones no sistemáticas, revisiones sistemáticas y guías para identificar cualquier ensayo adicional. Se contactó con los autores de los ensayos para obtener la información que faltaba.
Criterios de selección
Todos los ensayos controlados aleatorizados (ECA) que compararon cualquier IBP con placebo, antagonistas de los receptores H2 (ARH2) o proquinéticos para el tratamiento de la DF de al menos dos semanas de duración. Los participantes fueron adultos (16 años de edad o más) con un diagnóstico adecuado de DF (cualquiera de los criterios validados como Roma I, II, III o Lancet Working Group).
Obtención y análisis de los datos
Dos autores de la revisión de forma independiente evaluaron la elegibilidad y la calidad de los ensayos y extrajeron los datos. Se obtuvieron datos sobre los síntomas dispépticos, la calidad de vida y el número de eventos adversos generales. Los eventos adversos específicos estuvieron más allá del alcance de esta revisión.
Resultados principales
Se identificaron 25 ECA a partir de 27 artículos (con 8453 participantes) que estudiaron el efecto de los IBP versus placebo, ARH2 o proquinéticos para la mejoría de los síntomas generales de dispepsia y la calidad de vida en los pacientes con DF. Los IBP a dosis baja tuvieron una eficacia similar a los IBP a dosis estándar, por lo que estos subgrupos se combinaron para el análisis. El IBP fue más efectivo que el placebo para aliviar los síntomas de dispepsia general en pacientes con DF (riesgos relativos (RR) 0,88; intervalo de confianza (IC) del 95%: 0,82 a 0,94; participantes = 6172; estudios = 18; número necesario a tratar para un resultado beneficioso adicional (NNTB) 11; evidencia de calidad moderada). Los IBP pueden tener poco o ningún efecto en comparación con los ARH2 (RR 0,88; IC del 95%: 0,74 a 1,04; participantes = 740; estudios = 2; evidencia de baja calidad), y pueden ser ligeramente más efectivos que los procinéticos (RR 0,89; IC del 95%: 0,81 a 0,99; participantes = 1033; estudios = 5; NNTB 16; evidencia de baja calidad) para aliviar los síntomas generales de la dispepsia en los pacientes con DF. Los IBP más procinéticos tienen probablemente poco o ningún efecto en comparación con los IBP solos en el alivio de los síntomas de dispepsia general (RR 0,85; IC del 95%: 0,68 a 1,08; participantes = 407; estudios = 2; evidencia de calidad moderada).
No hubo diferencias cuando se subagruparon según el estado del Helicobacter pylori, el país de origen ni según la presencia del reflujo o subtipos Roma III. No hubo diferencias en el número de eventos adversos observados entre los IBP y ninguno de los otros tratamientos. Hubo menos eventos adversos en la combinación de IBP más procinéticos en comparación con los procinéticos solos (RR 0,60; IC del 95%: 0,39 a 0,93; participantes = 407; estudios = 2; evidencia de calidad moderada).
Conclusiones de los autores
Hay evidencia de que los IBP son efectivos para el tratamiento de la DF, independientemente de la dosis y la duración del tratamiento en comparación con placebo. Los IBP pueden ser ligeramente más efectivos que los procinéticos para el tratamiento de la DF; sin embargo, la evidencia es escasa. Los ensayos que evalúan los IBP versus los proquinéticos son difíciles de interpretar ya que tienen riesgo de sesgo. Aunque su efecto parece ser pequeño, estos fármacos se toleran bien.
PICO
Resumen en términos sencillos
Inhibidores de la bomba de protones para la dispepsia funcional
Pregunta de la revisión
¿Cuán efectivos son los fármacos que suprimen el ácido del estómago para el tratamiento de la indigestión en adultos que no presentan otra enfermedad grave?
Antecedentes
La supresión de los ácidos es un posible tratamiento para la dispepsia funcional (indigestión), es decir, dolor recurrente en el estómago, hinchazón abdominal, eructos o sensación de llenura. Se utilizan varios fármacos para tratar la dispepsia funcional; los inhibidores de la bomba de protones (IBP) y los antagonistas de los receptores H2 (ARH2) reducen los ácidos del estómago y los proquinéticos aceleran el vaciamiento del estómago. No hay evidencia clara de que un fármaco sea más efectivo que otro. Aunque estos fármacos se consideran seguros, algunos pacientes tienen efectos secundarios. Los efectos secundarios más frecuentes son cefalea, dolor de barriga (abdominal), hinchazón abdominal, diarrea y deseos de vomitar (náuseas). El uso a largo plazo de los IBP se ha asociado con diarrea infecciosa (inflamación del estómago y del intestino delgado), fractura ósea e hiperproliferación bacteriana. Por lo tanto, es necesario saber si estos fármacos son efectivos y seguros para los pacientes con indigestión.
Fecha de la búsqueda
Se buscaron en las bases de datos médicas ensayos clínicos en los que el tratamiento se asignó al azar (llamados ensayos controlados aleatorizados) en adultos con dispepsia funcional hasta mayo de 2017. Se incluyeron los resultados de 25 estudios de 27 publicaciones. Se encontraron dos estudios en espera de más detalles y ningún otro estudio en curso.
Características de los estudios
Se incluyeron 25 estudios con 8453 participantes. Hubo seis estudios (2304 participantes) que compararon los IBP de dosis baja versus los IBP de dosis estándar (la dosis utilizada en la práctica clínica); 18 estudios (6172 participantes) que compararon los IBP con el placebo (tratamiento de simulación); dos estudios (740 participantes) que compararon los IBP con los ARH2; cinco estudios (1033 participantes) que compararon los IBP con los procinéticos y dos estudios (407 participantes) que compararon los IBP más procinéticos versus los procinéticos solos.
La duración del tratamiento fue de al menos dos semanas. Siete estudios informaron sobre el tratamiento durante dos semanas, 12 estudios informaron sobre el tratamiento durante cuatro semanas y cinco estudios informaron sobre más de seis semanas de tratamiento. El período de tratamiento no estaba claro en un estudio.
Fuentes de financiación de los estudios
Diecisiete de los 25 estudios fueron patrocinados o financiados por una empresa farmacéutica y dos por una subvención institucional. No hubo información sobre la financiación en ocho estudios.
Resultados clave
La revisión mostró que los IBP son más efectivos que el placebo, y probablemente son ligeramente más efectivos que los procinéticos para el tratamiento de la dispepsia funcional. Los IBP a dosis baja y los IBP a dosis estándar fueron igualmente efectivos para el alivio de la indigestión, por lo que se combinaron los resultados de las dos dosis de IBP. Los IBP fueron más efectivos que placebo; el 31% del grupo de IBP no informó síntomas o informó síntomas mínimos en comparación con el 26% del grupo placebo. El efecto del IBP probablemente fue ligeramente más efectivo que el de los ARH2; sin embargo, los dos estudios incluidos en el análisis fueron muy diferentes, lo que puede haber influido en los resultados. No hubo diferencias en el número de efectos secundarios informados cuando se compararon los IBP, los ARH2 y los proquinéticos.
Calidad de la evidencia
Los estudios que evaluaron el efecto de los IBP en comparación con placebo o de los IBP combinados con los proquinéticos versus los proquinéticos en general fueron de buena calidad. Sin embargo, los estudios que compararon los IBP versus los ARH2 y los proquinéticos tuvieron graves problemas de calidad.
Authors' conclusions
Summary of findings
| PPI versus placebo for functional dyspepsia | ||||||
| Patient or population: functional dyspepsia | ||||||
| Outcomes | Anticipated absolute effects* (95% CI) | Relative effect | № of participants | Quality of the evidence | Comments | |
| Risk with placebo | Risk with Proton pump inhibitors (PPI) | |||||
| Global symptoms of dyspepsia (> 2 weeks) | Study population | RR 0.88 | 6172 | ⊕⊕⊕⊝ | Measurement of no improvement. | |
| 714 per 1000 | 629 per 1000 | |||||
| Quality of life | The mean post‐treatment PGWB score was 99.84, the mean post‐treatment SF‐36 score was 66.2 | SMD 0.01 higher | 1630 | ⊕⊕⊕⊝ | Higher scores means better quality of life. | |
| Adverse events | Study population | RR 0.99 | 2693 | ⊕⊕⊕⊝ | Number of adverse events. | |
| 191 per 1000 | 189 per 1000 | |||||
| *The risk in the intervention group (and its 95% confidence interval) is based on the assumed risk in the comparison group and the relative effect of the intervention (and its 95% CI). CI: confidence interval; MD: mean difference; PPI: proton pump inhibitor; RCT: randomized controlled trial; RR: risk ratio; SF‐36: 36‐item Short Form. | ||||||
| GRADE Working Group grades of evidence | ||||||
| 1Downgraded one level due to serious inconsistency between studies. 2Downgraded one level due to imprecision. | ||||||
| PPI versus H2RA for functional dyspepsia | ||||||
| Patient or population: adults with functional dyspepsia | ||||||
| Outcomes | Anticipated absolute effects* (95% CI) | Relative effect | No of participants | Quality of the evidence | Comments | |
| Risk with H2RA | Risk with PPI | |||||
| Global symptoms of dyspepsia Follow‐up: range 2‐8 weeks | Study population | RR 0.88 | 740 | ⊕⊕⊝⊝ | Measurement of no improvement. | |
| 739 per 1000 | 650 per 1000 | |||||
| Quality of life Follow‐up: range 2‐8 weeks | ‐ | ‐ | Not estimable | (0 studies) | ‐ | No data available. |
| Adverse events Follow‐up range 2‐8 weeks | Study population | RR 0.97 | 589 | ⊕⊕⊕⊝ | Number of adverse events. | |
| 144 per 1000 | 137 per 1000 | |||||
| *The risk in the intervention group (and its 95% confidence interval) is based on the assumed risk in the comparison group and the relative effect of the intervention (and its 95% CI). CI: confidence interval; H2RA: H2 receptor antagonist; PPI: proton pump inhibitor; RCT: randomized controlled trial; RR: risk ratio. | ||||||
| GRADE Working Group grades of evidence | ||||||
| 1Downgraded two levels due to imprecision, substantial heterogeneity (I2 = 51%) and high risk of bias in one of the two studies. 2Downgraded one level due to serious imprecision (95% CI included appreciable benefit and harm and low number of events). | ||||||
| PPI versus prokinetics for functional dyspepsia | ||||||
| Patient or population: adults with functional dyspepsia | ||||||
| Outcomes | Anticipated absolute effects* (95% CI) | Relative effect | No of participants | Quality of the evidence | Comments | |
| Risk with prokinetic | Risk with PPI | |||||
| Global symptoms of dyspepsia Follow‐up: range 2‐4 weeks | Study population | RR 0.89 | 1033 | ⊕⊕⊝⊝ | Measurement of no improvement. | |
| 495 per 1000 | 441 per 1000 | |||||
| Quality of life Follow‐up: range 2‐4 weeks | The mean NDI score change from baseline was 20.4 | MD 0.5 lower | 262 | ⊕⊕⊕⊝ | Higher scores denote better outcome. | |
| Adverse events Follow‐up: 4 weeks | Study population | RR 1.09 | 1033 | ⊕⊕⊕⊝ | Number of adverse events. | |
| 113 per 1000 | 123 per 1000 | |||||
| *The risk in the intervention group (and its 95% confidence interval) is based on the assumed risk in the comparison group and the relative effect of the intervention (and its 95% CI). CI: confidence interval; PPI: proton pump inhibitor; RCT: randomized controlled trial; RR: risk ratio. | ||||||
| GRADE Working Group grades of evidence | ||||||
| 1Downgraded one level due to serious imprecision. 2Downgraded one level due to risk of bias in four of the five studies. 3We did not consider the impact of risk of bias and inconsistency on the results to be serious enough to justify fully downgrading two levels so we have downgraded one level in respect of both considerations. | ||||||
| PPI + prokinetics versus prokinetics alone for functional dyspepsia | ||||||
| Patient or population: adults with functional dyspepsia | ||||||
| Outcomes | Anticipated absolute effects* (95% CI) | Relative effect | No of participants | Quality of the evidence | Comments | |
| Risk with prokinetic alone | Risk with PPI + prokinetic | |||||
| Global symptoms of dyspepsia Follow‐up range: 2 to 4 weeks | Study population | RR 0.85 | 407 | ⊕⊕⊕⊝ | Measurement of no improvement. | |
| 444 per 1000 | 377 per 1000 | |||||
| Quality of life Follow‐up: 4 weeks | NDI | ‐ | 258 | ⊕⊕⊕⊝ | Higher scores denote better outcome. | |
| The mean NDI score change from baseline was 20.4 | MD for NDI score change from baseline 1.10 lower (5.22 lower to 3.02 higher) | |||||
| FDDQL | ‐ | 149 | ⊕⊕⊕⊝ | Higher scores denote better outcome. | ||
| The mean post‐treatment FDDQL score was 70.56 | MD for FDDQL score 18.96 higher (17.01 lower to 20.91 higher) | |||||
| Adverse events Follow‐up: 4 weeks | Study population | RR 0.60 | 407 | ⊕⊕⊕⊝ | Number of adverse events. | |
| 220 per 1000 | 132 per 1000 | |||||
| *The risk in the intervention group (and its 95% confidence interval) is based on the assumed risk in the comparison group and the relative effect of the intervention (and its 95% CI). CI: confidence interval; MD: mean difference; PPI: proton pump inhibitor; RCT: randomized controlled trial; RR: risk ratio. | ||||||
| GRADE Working Group grades of evidence | ||||||
| 1Downgraded one level due to serious imprecision . | ||||||
Background
Description of the condition
See 'Glossary of medical terms' in Appendix 1.
Since the mid‐to‐late 1990s, the definition of functional dyspepsia (FD, or non‐ulcer dyspepsia) has undergone major changes since the initial working party definition in 1988, to the consecutive Rome I to III (Colin‐Jones 1988; Drossman 1999; Drossman 2006), and most recently the Rome IV definitions (Stanghellini 2016). This process has been in line with a change in our understanding of the pathophysiological basis of FD and its categorization (Talley 2016).
FD is defined as continuous or frequently recurring epigastric pain or discomfort for which no organic cause can be found (Drossman 2006). Other symptoms, such as upper abdominal bloating, excessive burping and early satiety could also be present; a normal upper endoscopy is usually required to rule out any underlying organic disease (Abraham 2004). FD is a highly prevalent disorder, affecting 10% to 15% of the general population (Lacy 2013), and it accounts for 3% to 5% of all primary care clinic visits in North America. About 50% of European and North American people with dyspepsia receive pharmacological treatment, and more than 30% report missing work or school hours because of burdensome symptoms (Overland 2014). Therefore, FD incurs direct and indirect costs (total yearly cost estimated at USD1595 per person), with additional costs associated with their impaired work productivity (Lacy 2013).
The clinical management of FD is problematic, reflecting the unknown cause and poorly understood pathophysiology (Talley 1991; Talley 1995). Different treatments have been proposed for the condition, including H2 receptor antagonists (H2RA), prokinetic agents (Bekhti 1979; Holtmann 2002; Talley 1998 (BOND); Talley 1998 (OPERA); Van Outryve 1993), proton pump inhibitors (PPIs) (McColl 1998; Wong 2002), Helicobacter pylori eradication therapy (Blum 1998; Froehlich 2001; Hamilton 2000; Talley 1999a; Talley 1999b), and even antidepressants or psychological interventions (Bolling‐Sternevald 2003; Calvert 2002). It has been previously shown that omeprazole (a PPI) produces higher intragastric pH values in H pylori‐positive compared to H pylori‐negative people (Verdú 1995). The apparently increased effect of omeprazole during H pylori infection may be a result of the production of acid‐neutralizing compounds by the H pylori (Bercik 2000).
Drugs that reduce gastric acid secretion are commonly prescribed for people with dyspepsia, but the efficacy of acid suppression in treating the condition is still controversial. Gastric acid secretion is a complex process regulated by at least three types of receptors (histamine, gastrin and acetylcholine) on the parietal cell. In contrast to H2RAs or anticholinergic agents, which only partially inhibit histamine‐, gastrin‐ or acetylcholine‐stimulated acid secretion, PPIs inhibit acid secretion in response to all stimulatory agents (Robinson 2004). Although gastric acid secretion is normal in people with FD (Chen 2000), a subset of these people benefit from strong acid suppression with a PPI (Wong 2002). Acid secretion inhibitory drugs are therefore widely prescribed to people with FD worldwide, but the underlying mechanisms of their effect are unknown (Suzuki 2011). It has been shown that about one‐third of people with FD have a normal 24‐hour pH profile (Chen 2000; Moayyedi 2011), and a clear relationship between acid exposure and severity of symptoms is far from evident in these people (Moayyedi 2003; Moayyedi 2011). The effect of H2RAs seems to be overestimated (Talley 1998 (BOND); Talley 1998 (OPERA)), and studies on the efficacy of PPIs have had variable results, depending on the protocol and inclusion criteria used (Bolling‐Sternevald 2003; Hansen 1998; Suzuki 2011). While PPIs are generally considered safe and well tolerated, there have been reports of associated Clostridium difficile infection, pneumonia, risk of fractures and acute interstitial nephritis in the long term (Wilhelm 2013). This has been a controversial topic that has been studied in detail (Abramowitz 2016; Scarpignato 2016). For this reason, decisions on whether to initiate or continue PPI therapy should be made based on an appropriate clinical indication (Yang 2010).
Description of the intervention
PPIs are the most widely used agents for the suppression of gastric acid. Following on from their demonstrated success in the treatment of gastroesophageal reflux disease and peptic ulcers, PPIs have been widely employed in the treatment of dyspeptic symptoms and in people with FD (Camillieri 2013; Lacy 2012). They have been proposed as the first step in the treatment of people with FD after H pylori eradication (in people who are positive for H pylori). However, the real effect of PPIs has been controversial. Evidence from randomized controlled trials (RCTs) suggests that the efficacy of PPIs in FD may be confined to those people who have coexisting reflux symptoms (Lacy 2012).
How the intervention might work
PPIs may be beneficial in a subset of people with FD. One meta‐analysis of placebo‐controlled RCTs of PPIs in FD included 3725 participants across seven studies (Wang 2007). Overall, the meta‐analysis concluded that PPI treatment was superior to placebo with a number needed to treat for an additional beneficial outcome (NNTB) of 15. In subgroup analyses, they found that the benefit of PPI over placebo was confined to people with 'ulcer‐like' and 'reflux‐like' dyspepsia; they found no advantage of PPI treatment among people with 'dysmotility‐like' or unspecified dyspepsia (Drossman 1999).
PPIs may also have advantages compared to prokinetics. Prokinetic agents are conceptually appealing: they have the potential to improve gastric emptying and are commonly used worldwide; however, the effect in FD is not clearly supported by the evidence (Lacy 2012).
PPIs may also benefit in comparison with H2RAs (Barbera 1995).
Why it is important to do this review
From 2000 to 2007, several systematic reviews and meta‐analyses were published which considered different treatments for FD, including PPIs (Hansen 1998; Moayyedi 2011; Suzuki 2011). Since then, newer RCTs addressing this issue have been added to the medical literature. However, no new systematic reviews have evaluated these studies and a former Cochrane Review has been withdrawn (Moayyedi 2011).
Acid secretion inhibitory drugs are widely prescribed to people with FD worldwide, but the underlying mechanisms of their effect are unknown. PPIs have been considered to be 'safe' drugs; however, some adverse effects were reported (Johnson 2013). Evidence of the real effect of PPIs in FD will therefore help us to understand better the need for PPIs in this specific population and to avoid the indiscriminate use of these drugs.
Due to the importance of the topic, we have conducted a systematic review of RCTs evaluating PPI therapy in FD using Cochrane methodology.
Objectives
To determine the efficacy of proton pump inhibitors in the improvement of global symptoms of dyspepsia and quality of life compared to placebo, H2 receptor antagonists or prokinetics, in people with functional dyspepsia.
Methods
Criteria for considering studies for this review
Types of studies
We included RCTs comparing the efficacy of different PPIs in people with an adequate diagnosis of FD (any validated criteria such as Rome I, II, III, IV or Lancet Working Group) (Colin‐Jones 1988; Drossman 1999; Drossman 2006; Stanghellini 2016). We included cross‐over studies only if the results were available before the cross‐over, so that the study could be evaluated as a parallel‐group study. We excluded cluster‐randomized trials.
Types of participants
We considered studies involving people aged over 16 years, of both genders, with a diagnosis of FD according to any well‐defined criteria (such as Rome I, II, III, IV or Lancet Working Group; Table 1), with a normal upper gastrointestinal endoscopy and with upper gastrointestinal symptoms including epigastric pain/discomfort. We excluded studies involving participants with other gastrointestinal conditions, such as peptic ulcer, organic dyspepsia and reflux disease. If a study included populations with different conditions, we only considered people with FD.
| Functional dyspepsia | Rome I (1991) | Rome II (1999) | Rome III (2006) Rome IV (2016) | AGA Working Group | Lancet Working Group (1998) |
| Main criteria | Pain or discomfort centred in the upper abdomen with no evidence of organic disease. | Persistent or recurrent symptoms (pain or discomfort centred in the upper abdomen). AND No evidence that dyspepsia is exclusively relieved by defecation or associated with the onset of a change in stool frequency or stool form (exclude irritable bowel syndrome and exclude reflux). | ≥ 1 symptoms need to be present:
| Chronic or recurrent pain or discomfort centred in the upper abdomen. | Chronic or recurrent pain or discomfort centred in the upper abdomen or retrosternal pain, discomfort, heartburn, nausea, vomiting or other symptoms of the gastrointestinal tract. |
| Normal upper endoscopy | Required. | Required. | Required. | Required. | Required. |
| Symptoms present for the last... | ‐ | 12 weeks, which need not be consecutive. | Criteria fulfilled for the last 3 months. | ≥ 3 months. | ≥ 4 weeks. |
| Onset of symptoms | ‐ | 12 months. | 6 months. | ‐ | ‐ |
| Subtypes |
|
|
| ‐ | Reflux‐like dyspepsia. |
AGA: American Gastroenterological Association.
Types of interventions
We included trials comparing oral administration of any dose of any PPI available (omeprazole, esomeprazole, pantoprazole, lansoprazole, dex‐lansoprazole or rabeprazole; for doses see Table 2) with placebo, H2RAs or prokinetics. We considered a combination of treatments in either intervention or control groups only if the combination of treatment was present in both groups. We considered therapy of at least two weeks' duration. We recorded and compared the time of the intervention and follow‐up.
| Proton pump inhibitor | Daily standard dose |
| Dex‐lansoprazole | 30 mg |
| Esomeprazole | 20 mg to 40 mg |
| Lansoprazole | 30 mg |
| Omeprazole | 20 mg |
| Pantoprazole | 40 mg |
| Rabeprazole | 20 mg |
Types of outcome measures
We measured outcomes as continuous (mean score pre‐ and post‐treatment) and dichotomous (improved or not improved). We measured the number of events in each group for adverse events.
Primary outcomes
-
Global symptoms of dyspepsia (using the most stringent definition of not symptom‐free) or epigastric pain/discomfort if global symptoms were not reported.
Secondary outcomes
-
Quality of life (QoL).
-
Adverse events.
Search methods for identification of studies
Electronic searches
We conducted a literature search to identify all published and unpublished RCTs. We considered studies regardless of language and publication status to avoid biases. We translated the non‐English language papers and fully assessed them for potential inclusion in the review as necessary. We only included data from abstracts if we were able to obtain further details from the investigators. We searched the following electronic databases for potential studies:
-
the Cochrane Library (to May 2017) (Appendix 2);
-
MEDLINE (OvidSP) (1946 to May 2017) (Appendix 3);
-
Embase (OvidSP) (1974 to May 2017) (Appendix 4).
The Cochrane Library databases include Cochrane Database of Systematic Reviews (CDSR), Cochrane Central Register of Controlled Trials (CENTRAL), Cochrane Methodology Register (CMR), Database of Abstracts of Reviews of Effects (DARE), Health Technology Assessment Database (HTA) and NHS Economic Evaluation Database (EED). The search strategies were constructed by using a combination of subject headings and text words relating to dyspepsia and PPIs.
Searching other resources
We performed handsearching of healthcare journals and conference proceedings (i.e. Digestive Diseases Week, United European Gastroenterology Week). We checked the reference lists of all primary studies and review articles for additional references. We contacted the authors of identified trials and ask them to identify other published and unpublished studies. We contacted manufacturers and experts in the field. We searched for errata or retractions from eligible trials in PubMed (www.ncbi.nlm.nih.gov/pubmed) and reported the date this was done within the review. We also conducted a search of ClinicalTrials.gov for clinical trials. We made efforts to identify unpublished studies. We searched the grey literature (e.g. conference reports, technical reports and dissertations) using SIGLE (Appendix 5)). EAGLE (the European Association for Grey Literature Exploitation) has closed the SIGLE (System for Information on Grey Literature; www.opengrey.eu/) database, which was one of the most widely used databases of grey literature.
Data collection and analysis
Selection of studies
We used Review Manager 5 to collect and manage citations (Reference Manager 2014). We identified and excluded duplicates and collate multiple reports of the same study, so that each study, rather than each report, was the unit of interest in the review. We recorded the selection process in sufficient detail to complete a PRISMA flow diagram (Figure 1).
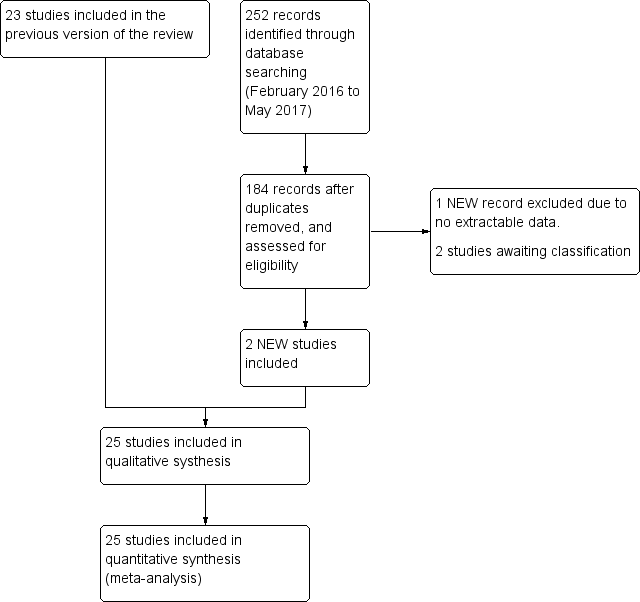
Study flow diagram.
To ensure that we identified all eligible studies, two review authors (MIP and YY) independently screened the abstracts and selected trials according to the inclusion and exclusion criteria. We documented study selection or exclusion and created a list of studies to be included in the analysis (see Characteristics of included studies table). We resolved any disagreement through discussion or consultation with a third review author (PM). At this initial stage, we included studies where there was disagreement or where it was difficult to decide whether a study should be included.
We identified studies in which participants with an adequate diagnosis of FD (any valid criteria for FD with a normal upper gastrointestinal endoscopy) were randomized to receive any type of PPI versus another prespecified treatment or placebo. We considered and recorded the general characteristics and outcomes of each study using a screening form. We piloted the form on the first five studies included in the list and made changes if necessary. The screening form recorded the title, author, date, study design (only RCTs were included), population characteristics, intervention and control treatment duration, and outcomes according to the PICO question (population (P), intervention (I), comparison (C) and outcome(s) (O)). We provided a section for general comments, for any review author considerations and future discussion. We identified and removed duplicate studies at this initial stage.
We combined the results of the title and abstract screening performed by the review authors and document and discussed decisions about inclusion in the final full‐text screening list. To ensure that inclusion and exclusion criteria were properly interpreted and selection bias was minimized, three different review authors (AH, MIP and YY) performed the screening of the full texts. For papers in languages other than English, we requested translation by a translator from Cochrane with experience in systematic reviews and medicine. If the paper met the inclusion criteria, we asked the translator to extract data on the predefined data extraction form. The two review authors received the full‐text journal articles and translations to perform the screening. We collected the full‐text screening data in an Excel sheet and compared the results. We calculated the level of agreement after each step: title and abstract screening, full‐text screening and data extraction using Kappa statistics for categorical data (GraphPad), and raw agreement for continuous data. We reported raw agreement as a percentage and Kappa as fair agreement (К = 0.4 to 0.59), good agreement (0.6 to 0.74) or excellent agreement (0.75 or greater).
Data extraction and management
We used a standard data collection form for study characteristics and outcome data, which was piloted on five studies. Three review authors (AH, MIP and YY) extracted the following study characteristics from included studies.
-
Methods: study design, total duration of study and run‐in, number of study centres and location, study setting, withdrawals, date of study.
-
Participants: number, mean age, age range, gender, severity of condition, diagnostic criteria, inclusion criteria, exclusion criteria.
-
Interventions: intervention, comparison, concomitant medications, excluded medications.
-
Outcomes: primary and secondary outcomes specified and collected, time points reported.
-
Notes: funding for trial, notable conflicts of interest of trial authors.
Two review authors (MIP and AH) independently extracted outcome data from the included studies. We noted in the Characteristics of included studies table if outcome data were reported in an unusable way. We resolved disagreements by consensus or by involving a third review author (PM). One review author (MIP) copied across the data from the data collection form into Review Manager 5 (RevMan 2014). Two review authors (YY and PM) double‐checked that the data were entered correctly by comparing the study reports with how the data were presented in the systematic review.
We collected blinding information by individually identifying the person blinded. If this information was not reported, we recorded the study as 'single‐blind' (implying that probably only the study participants were blinded), 'double‐blind' (implying that the study participants, healthcare providers, data collectors and assessors were blinded but not the data analysts) or 'triple‐blind' (implying that the data analysts were also blinded).
If any information was missing at the end of data extraction process, we contacted the authors of the trials to recover the specific information. We included information on the following outcomes on the form: global symptoms, QoL and adverse events. We detailed common adverse events (such as such as diarrhoea, intolerance, nausea, headaches). We recorded participant demographics, treatment outcomes and adverse events as mean (standard deviation (SD)), n/N or % when applicable. We also collected information to assess possible risk of bias (randomization, concealment, blinding of participants and outcome assessors, incomplete outcome data, selective reporting and other biases).
Assessment of risk of bias in included studies
Three review authors (AH, MIP and YY) independently assessed the risk of bias for each study using the criteria outlined in the Cochrane Handbook for Systematic Reviews of Interventions (Higgins 2011).
We assessed the risk of bias according to the following domains: random sequence generation; allocation concealment; blinding of participants and personnel; blinding of outcome assessment; incomplete outcome data; selective outcome reporting and other bias. We graded each potential source of bias as high, low or unclear and provide a quote from the study report together with a justification for our judgement in the 'Risk of bias' table for each study.
We summarized the 'Risk of bias' judgements across different studies for each of the domains listed. We considered blinding separately for different key outcomes where necessary, for example, for unblinded outcome assessment, risk of bias for all‐cause mortality may be very different from a participant‐reported pain scale). Where information on risk of bias related to unpublished data or correspondence with a trialist, we noted this in the 'Risk of bias' table.
When considering treatment effects, we took into account the risk of bias of the studies that contributed to that outcome. We entered the data related to risk of bias into Review Manager 5 (RevMan 2014) and construct the 'Risk of bias' tables. We generated two figures with the Review Manager 5 software: a 'Risk of bias' summary, which represents all the judgements in a cross‐tabulation of study by entry and a 'Risk of bias' graph, which illustrates the proportion of studies complying with each of the judgements (low, high and unclear risk of bias).
GRADE and 'Summary of findings' tables
We used the GRADE system for the assessment of the quality of the evidence, and developed 'Summary of findings' tables using the GRADEpro software (GRADEpro). One review author (MIPS) performed GRADE assessment and another checked the consistency of the information. We graded the quality of evidence as high, moderate, low or very low, depending on study limitations, consistency, directness, precision and publication bias of each outcome.
Measures of treatment effect
We analyzed dichotomous data as risk ratio (RR) and continuous data as mean difference (MD) or standardized mean difference (SMD). We reported information regarding the study population follow‐up (participants enrolled and randomized) as the data collected from discontinued participants over the total number of participants for each arm (n/N). We reported the total number of participants with symptoms related to dyspepsia in each arm at each time point (before and after treatment) as a number over the total sample population (n/N) in each arm.
We reported the comparison of binary data as an RR with an associated 95% confidence interval (CI), and the NNTB. The number needed to treat was calculated according to the following formula: NNTB = 100/ARR and ARR = 100 × ACR × (1 ‐ RR), where ARR was the absolute risk reduction and ACR was the assumed control risk (Higgins 2011). Standardized MD (SMD) was used to pool post‐treatment quality scores from different studies, since different scales were used to assess QoL. However,post‐treatment scores and change from baseline scores from different quality scales were not pooled as final values and change scores should not be combined as standardized mean differences (Deeks 2011).
We collected continuous outcome data in three different ways:
-
unit of measurement or, if unit of measurement could not be reported (i.e. visual analogue scale), we considered the data to be unit‐less;
-
measure of central tendency: mean, median, mode;
-
measure of variance, such as SD, standard error (SE), interquartile range or 95% CI.
If we were not provided with the raw data, we collected the reported analysis.
We collected change scores (the difference between scores before and after intervention) for comparison. We compared the final values of post‐treatment scores when change scores were not available. We undertook meta‐analyses only where this was meaningful (i.e. if the treatments, participants and the underlying clinical question were similar enough for pooling to make sense). A common way in which trialists indicate that they have skewed data is by reporting medians and interquartile ranges. When we encounter this, we noted that the data were skewed and considered the implication of this. Where multiple trial arms were reported in a single trial, we included only the relevant arms. If two comparisons (e.g. drug A versus placebo and drug B versus placebo) needed to be entered into the same meta‐analysis, we halved the control group to avoid double‐counting.
Unit of analysis issues
The unit of analysis was the individual participant included in the studies. We analyzed cross‐over studies as parallel‐group study only if the results were available before the cross‐over.
Dealing with missing data
We contacted investigators or study sponsors to verify key study characteristics and obtain missing numerical outcome data where possible (e.g. when a study was identified as an abstract only). We contacted study investigators whenever possible to request missing data. If this was not possible, or data were not provided, we considered that participants with missing data did not have the outcome of interest. We performed sensitivity analyses to assess robustness of the results relative to reasonable changes in the assumptions that were made.
We addressed the potential impact of missing data on the findings of the meta‐analysis in the Discussion section.
Assessment of heterogeneity
Heterogeneity in systematic reviews can occur because of artefactual or real differences in treatment effects across the different studies included in the review (Tett 2013), and the reasons behind it should be carefully investigated. We considered all EPICOT components (evidence, population, intervention, comparison, outcome and time stamp), as well as internal validity issues (such as compliance, cointervention and randomization) in the analysis.
We preidentified potential sources of heterogeneity that could be related to the criteria considered for the FD definition and differences in the demographics of the included population: time, duration and dose of PPI; undetected cointervention and differences in outcomes measurements. To address the most important possible sources of heterogeneity, we performed subgroup analysis.
We assessed statistical heterogeneity with both the I2 statistic and the Chi2 test. An I2 value of 0% indicates no observed heterogeneity and larger values denote heterogeneity. We considered that heterogeneity might be not important when the I2 statistic was between 0% and 40%; moderate heterogeneity when between 30% and 60%; substantial heterogeneity when between 50% and 90% and considerable heterogeneity when greater than 75%; or there was a P value of less than 0.1 for the Chi2 test (Higgins 2011).
Assessment of reporting biases
We attempted to contact study authors and asked them to provide missing outcome data. Where this was not possible, and the missing data were thought to introduce serious bias, we explored the impact of including such studies in the overall assessment of results by a sensitivity analysis.
If we could pool more than 10 trials, we created and examined a funnel plot to explore possible publication biases. In the graph, the effect estimates were shown on the horizontal scale and the measure of study size on the vertical axis. Asymmetric funnel plots suggested small‐study effects, publication bias, delayed publication (time lag), selective reporting outcome or even differences in methodological quality. Egger's test was used for detecting significant funnel plot asymmetry (RevMan 2014).
Data synthesis
To be able to combine the results, we considered some possible differences before performing the meta‐analysis. We created a forest plot of the meta‐analysis for quantitative synthesis. We addressed differences in the research question, population, intervention, comparators, outcomes and methodology. We included different comparators (placebo or other active comparators such as H2RAs or prokinetics) in the analysis. However, we separated studies with different comparators into different subgroups for their analysis. For quantitative analysis, we performed a meta‐analysis using Review Manager 5 (RevMan 2014). We calculated a summary statistic for each study to describe the observed intervention effect. In the case of dichotomous outcomes, we calculated an RR and for continuous data we calculated an MD. When outcomes were assessed by different instruments, we used the SMD when possible. We calculated a summary (pooled) intervention effect estimate as a weighted mean of the intervention effects estimated in the individual studies. We chose the weights to reflect the amount of information that each study contained. For the combination of intervention effect estimates across studies, we assumed that the studies were not all estimating the same intervention effect, but estimating intervention effects that followed a distribution across studies. We therefore considered a random‐effects model meta‐analysis to be adequate (Kwok 2013). However, since the correct selection of the model is controversial, we also performed a fixed‐effect model analysis and compared the results of both. If these models had similar results, we considered that the chances of heterogeneity being present across the studies were low. Otherwise, if the results were different, we considered the random‐effects model as the most appropriate for the reasons previously described. To communicate the strength of evidence against the null hypothesis of no intervention effect, we used measures of dispersion (such as SE) to derive a CI and a P value.
Subgroup analysis and investigation of heterogeneity
We carried out the following subgroup analyses to reveal any effect that might explain any heterogeneity:
-
treatment duration (less than four weeks versus four weeks and versus greater than four weeks);
-
dose (standard‐dose versus low‐dose of PPI);
-
PPI subtype;
-
H pylori status (H pylori‐negative versus H pylori‐positive);
-
presence of reflux, defined as abnormal 24‐hour pH study (pH less than 4 for more than 4% of the 24‐hour recording versus pH less than 4 for less than 4% of the 24‐hour recording);
-
risk of bias (low versus unclear versus high risk of bias);
-
geographical location (e.g. western versus eastern studies);
-
trial funding sources (industry‐sponsored versus non‐industry‐sponsored studies).
We assessed differences between subgroups with the I2 statistic to test for subgroup interactions.
Sensitivity analysis
We performed sensitivity analyses using different summary statistics (RR versus odds ratio (OR)) and meta‐analytic models (fixed‐effect versus random‐effects), to assess the robustness of our results.
Results
Description of studies
Results of the search
The search up to May 2017 identified 1876 records. After removal of duplicates, we initially screened 1521 citations resulting from the electronic searches. Based on consideration of their titles and abstracts, we excluded 1453 citations while 67 papers were targeted for full‐article review, either because they were potentially relevant, or because not enough information was reported in the title and abstract to make a final decision. We included 25 studies from 27 papers (Characteristics of included studies table), excluded 38 studies (Characteristics of excluded studies table), two studies were classified as awaiting classification (Characteristics of studies awaiting classification table). (Figure 1). There was very good inter‐reviewer agreement at the full‐text stage (k = 0.94, SE of kappa = 0.046; 95% CI 0.84 to 1.0).
Included studies
We included 25 studies from 27 publications (Characteristics of included studies table). Of the 25 included studies, 22 were published in English and three in Chinese (Jiang 2011; Li 2003; Yang 2014). Four studies identified during the search were published only as abstracts (Catapani 2015; Dillon 2004; Hengels 1998; Tominaga 2010). We contacted authors from these studies and requested further information. Only two authors supplied additional information (Catapani 2015; Tominaga 2010).
Country of origin
Four of 25 studies were from Japan (Iwakiri 2013; Kamiya 2017; Suzuki 2013 (ELF); Tominaga 2010); three from the US (Gerson 2005; Majewski 2016; Peura 2004); three from China (Jiang 2011; Li 2003; Yang 2014); two from the UK (Dillon 2004; Fletcher 2011); two from Germany (Blum 2000; Hengels 1998); one from Canada (Van Zanten 2006); one from Hong Kong (Wong 2002); one from Korea (Jung 2016); one from Norway (Farup 1999); one from Brazil (Catapani 2015), and one from Taiwan (Hsu 2011). Five studies were from multiple countries (Bolling‐Sternevald 2002; Talley 1998 (BOND); Talley 1998 (OPERA); Talley 2007; Van Rensburg 2008).
Interventions
Seventeen studies included two treatment arms (Bolling‐Sternevald 2002; Catapani 2015; Dillon 2004; Fletcher 2011; Gerson 2005; Hengels 1998; Hsu 2011; Jiang 2011; Kamiya 2017; Li 2003; Majewski 2016; Suzuki 2013 (ELF); Talley 2007; Tominaga 2010; Van Rensburg 2008; Van Zanten 2006; Yang 2014); six studies included three arms (Farup 1999; Jung 2016; Peura 2004; Talley 1998 (BOND); Talley 1998 (OPERA); Wong 2002); and two studies included four arms (Blum 2000; Iwakiri 2013).
From the studies with two arms, 12 compared standard doses of PPIs either with placebo (Bolling‐Sternevald 2002; Fletcher 2011; Gerson 2005; Majewski 2016; Talley 2007; Van Rensburg 2008; Van Zanten 2006), prokinetics (Hsu 2011; Jiang 2011; Kamiya 2017; Yang 2014), or H2RA (ranitidine) (Dillon 2004); four compared low‐dose PPIs either with placebo (Hengels 1998; Suzuki 2013 (ELF); Tominaga 2010), or prokinetics (Li 2003). The dose of PPI was not reported in Catapani 2015.
From the studies with three arms, five compared low and standard doses of PPIs with placebo (Farup 1999; Peura 2004; Talley 1998 (BOND); Talley 1998 (OPERA); Wong 2002), and one compared standard‐dose PPI, prokinetic and PPI plus prokinetic (Jung 2016).
From the two studies with four arms, one compared low‐dose PPI with standard‐dose PPI, ranitidine and placebo (Blum 2000), and one compared low‐dose, standard‐dose and high‐dose PPIs and placebo (Iwakiri 2013).
Duration of intervention
The duration of intervention ranged from two to eight weeks. Seven studies reported treatment for two weeks (Blum 2000; Bolling‐Sternevald 2002; Fletcher 2011; Hengels 1998; Hsu 2011; Jiang 2011; Li 2003); 12 studies reported treatment for four weeks (Farup 1999; Gerson 2005; Jung 2016; Kamiya 2017; Majewski 2016; Suzuki 2013 (ELF); Talley 1998 (BOND); Talley 1998 (OPERA); Tominaga 2010; Van Rensburg 2008; Wong 2002; Yang 2014); five studies reported eight weeks of treatment (Dillon 2004; Iwakiri 2013; Peura 2004; Talley 2007; Van Zanten 2006); and one study had unclear duration although participants were followed up for six months (Catapani 2015).
Definition of functional dyspepsia
The definition for FD differed according to the study and the year of publication. Six studies defined FD as "persistent or recurrent epigastric pain and/or discomfort in participants with normal findings at upper gastrointestinal endoscopy and with symptoms at least one month's duration" (Blum 2000; Bolling‐Sternevald 2002; Farup 1999; Li 2003; Talley 1998 (BOND); Talley 1998 (OPERA)). The same studies considered the presence of symptoms during the seven‐day run‐in period. Seven studies defined FD based on the Rome II criteria (Catapani 2015; Dillon 2004; Gerson 2005; Majewski 2016; Peura 2004; Van Zanten 2006; Wong 2002); eight studies on Rome III criteria (Hsu 2011; Iwakiri 2013; Jiang 2011; Jung 2016; Kamiya 2017; Suzuki 2013 (ELF); Tominaga 2010; Yang 2014); and three using the American Gastroenterological Association (AGA) Working Group definition (Fletcher 2011; Talley 2007; Van Rensburg 2008). One study included participants with dyspeptic symptoms present for at least one week (Hengels 1998).
Excluded studies
After full‐text review, we excluded 38 studies (Almazar 2015; Bolling‐Sternvald 2003; Burkov 2009; Bytzer 2000; Cheung 2013; Chuang 2001; Delaney 2008; Fan 2012; Fransen 2012; Goves 1998; Guo 2011; Ivanova 2002; Jones 1997; Jones 1999; Kamada 2013; Leung 2007; Lewin van den Broek 2001; Madsen 2004; Madsen 2008; Mazure 1996; Meineche‐Schmidt 1999; Meineche‐Schmidt 2000; Meineche‐Schmidt 2004; Miwa 2015; Mönnikes 2009; Mönnikes 2012; Nagahara 2015; Pilichiewicz 2011; Rabeneck 2001 (SODA); Reimer 2010; Rui 2015; Sakaguchi 2012; Sakurai 2012 (J‐FOCUS); Schwartz 2001; Theodoropoulos 2009; van Zanten 2007; Veldhuyzen van Zanten 2005; Zeng 2007). The reasons for exclusion were detailed in Characteristics of excluded studies table.
Studies awaiting classification
Two studies, one published only as an abstract, did not reported extractable data (Puttapitakpong 2016; Yamawaki 2016). We contacted the authors requesting further information but received no response.
Ongoing studies
The search found no ongoing studies.
Risk of bias in included studies
Sequence generation (selection bias)
We categorized 18 trials at low risk of selection bias (Bolling‐Sternevald 2002; Catapani 2015; Fletcher 2011; Hsu 2011; Iwakiri 2013; Jiang 2011; Jung 2016; Kamiya 2017; Li 2003; Majewski 2016; Peura 2004; Suzuki 2013 (ELF); Talley 1998 (BOND); Talley 1998 (OPERA); Talley 2007; Van Rensburg 2008; Van Zanten 2006; Wong 2002), and the rest at unclear risk of selection bias. A graphical representation of the 'risk of bias' assessment is shown in Figure 2 (a summary of the risk of bias) and Figure 3 (which shows the risk of bias for individual studies).
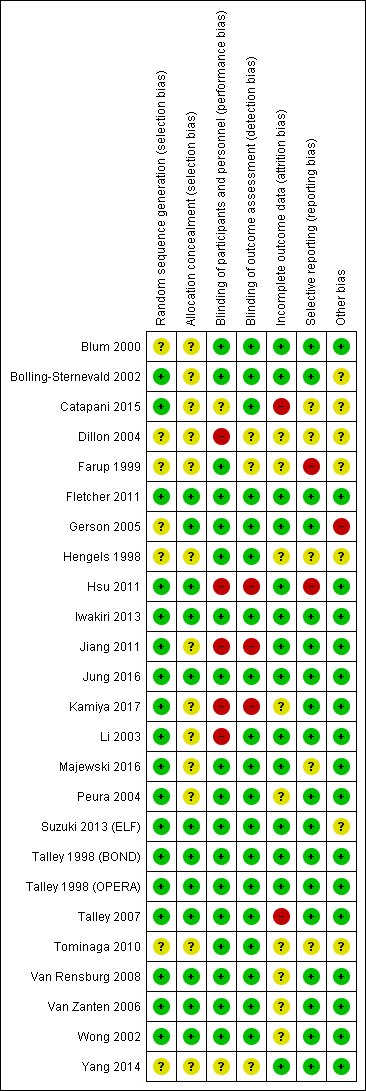
Risk of bias summary: review authors' judgements about each risk of bias item for each included study.
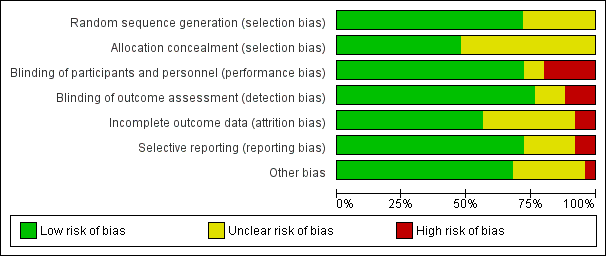
Risk of bias graph: review authors' judgements about each risk of bias item presented as percentages across all included studies.
Allocation
Allocation concealment was adequate and therefore at low risk of bias in 12 trials (Fletcher 2011; Gerson 2005; Hsu 2011; Iwakiri 2013; Jung 2016; Suzuki 2013 (ELF); Talley 1998 (BOND); Talley 1998 (OPERA); Talley 2007; Van Rensburg 2008; Van Zanten 2006; Wong 2002). The rest of the studies were at unclear risk of bias.
Blinding
Eighteen studies were designed as double‐blind, and therefore at low risk of bias (Blum 2000; Bolling‐Sternevald 2002; Farup 1999; Fletcher 2011; Gerson 2005; Hengels 1998; Iwakiri 2013; Jung 2016; Majewski 2016; Peura 2004Suzuki 2013 (ELF); Talley 1998 (BOND); Talley 1998 (OPERA); Talley 2007; Tominaga 2010; Van Rensburg 2008; Van Zanten 2006; Wong 2002). Five studies were at high risk for performance bias (one single‐blind study (Dillon 2004), four open‐label studies (Hsu 2011; Jiang 2011; Kamiya 2017; Li 2003). Blinding of personnel was performed and was unclear for participants in one study (Catapani 2015). Blinding of participants and personnel was unclear in one study (Yang 2014).
Nineteen studies were at low risk of detection bias (Blum 2000; Bolling‐Sternevald 2002; Catapani 2015; Fletcher 2011; Gerson 2005; Hengels 1998; Iwakiri 2013; Jung 2016; Li 2003; Majewski 2016; Peura 2004; Suzuki 2013 (ELF); Talley 1998 (BOND); Talley 1998 (OPERA); Talley 2007; Tominaga 2010; Van Rensburg 2008; Van Zanten 2006; Wong 2002) and three studies were at high risk of detection bias (Hsu 2011; Jiang 2011; Kamiya 2017). Blinding of outcomes assessors was unclear in three studies (Dillon 2004; Farup 1999; Yang 2014).
Incomplete outcome data
Fourteen studies reported all planned outcomes, which also provided data for intention‐to‐treat (ITT) analysis (Blum 2000; Bolling‐Sternevald 2002; Fletcher 2011; Gerson 2005; Hsu 2011; Iwakiri 2013; Jiang 2011; Jung 2016; Li 2003; Majewski 2016; Suzuki 2013 (ELF); Talley 1998 (BOND); Talley 1998 (OPERA); Yang 2014). Discontinued participants were imbalanced between arms in two studies, and therefore identified at high risk for attrition bias (Catapani 2015; Talley 2007). Information on lost to follow‐up or discontinuation of treatment was unclear or the potential impact of missing data on effect estimates was unclear in nine studies (Dillon 2004; Farup 1999; Hengels 1998; Kamiya 2017; Peura 2004; Tominaga 2010; Van Rensburg 2008; Van Zanten 2006; Wong 2002). Most trials did not report data from participants who dropped out.
Selective reporting
We attempted to identify protocols to check that studies reported prespecified outcomes. Eighteen studies reported all intended outcomes, and therefore were at low risk of bias (Blum 2000; Bolling‐Sternevald 2002; Fletcher 2011; Gerson 2005; Iwakiri 2013; Jiang 2011; Jung 2016; Kamiya 2017; Li 2003; Peura 2004; Suzuki 2013 (ELF); Talley 1998 (BOND); Talley 1998 (OPERA); Talley 2007: Van Rensburg 2008; Van Zanten 2006; Wong 2002; Yang 2014). One study reported that symptomatic improvement was initially planned for low‐dose omeprazole versus high‐dose (Farup 1999). Because of similar effect and low numbers of participants, the results were grouped; however, the individual data were not shown. This study, and another that terminated early (Hsu 2011), were identified at high risk of reporting bias. There was insufficient information on planned outcomes in other five trials and therefore risk for reporting bias was unclear for these studies (Catapani 2015; Dillon 2004; Hengels 1998; Majewski 2016; Tominaga 2010).
Other potential sources of bias
Seventeen trials were at low risk of other bias (Blum 2000; Fletcher 2011; Hsu 2011; Iwakiri 2013; Jiang 2011; Jung 2016; Kamiya 2017; Li 2003; Majewski 2016; Peura 2004; Talley 1998 (BOND); Talley 1998 (OPERA); Talley 2007; Van Rensburg 2008; Van Zanten 2006; Wong 2002; Yang 2014). Seven trials were at unclear risk of other bias (Bolling‐Sternevald 2002; Catapani 2015; Dillon 2004; Farup 1999; Hengels 1998; Suzuki 2013 (ELF); Tominaga 2010). We identified one study in which the groups had imbalanced symptoms scores at baseline, with a potential bias on the treatment effect estimate (Gerson 2005).
Reporting bias
A funnel plot was performed including studies comparing PPI versus placebo. Visually the funnel plot appeared to be symmetrical (Figure 4); decreasing the chances of publication bias. No significant funnel plot asymmetry was seen using Egger's test (P = 0.47).
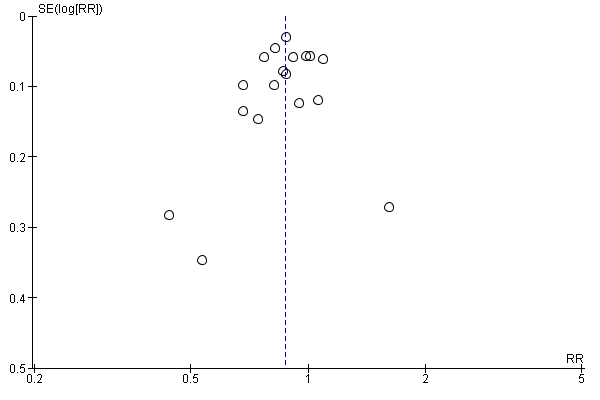
Funnel plot of comparison: 3 Proton pump inhibitors versus placebo, outcome: 3.1 Global symptoms (two to eight weeks).
Effects of interventions
See: Summary of findings for the main comparison Proton pump inhibitors (PPI) compared to placebo for functional dyspepsia; Summary of findings 2 Proton pump inhibitors (PPI) compared to H2 receptor antagonists (H2RA) for functional dyspepsia; Summary of findings 3 Proton pump inhibitors (PPI) compared to prokinetics for functional dyspepsia; Summary of findings 4 Proton pump inhibitors plus prokinetics compared to prokinetics alone for functional dyspepsia
Some trials contributed more than one comparison as some evaluated more than two interventions.
Standard‐dose versus low‐dose proton pump inhibitor
Global symptoms of dyspepsia
Six studies with 2304 participants provided data to compare low‐ and standard‐dose PPI therapy for a reduction of global symptoms of dyspepsia (Blum 2000; Iwakiri 2013; Peura 2004; Talley 1998 (BOND); Talley 1998 (OPERA); Wong 2002). There was no difference between the two doses of PPI therapy (RR of remaining dyspeptic on standard‐dose PPI 0.97, 95% CI 0.92 to 1.02; P = 0.21) with no heterogeneity between subgroups (I2 = 0%; Chi2 = 2.54; degrees of freedom (df) = 5; P = 0.77) (Analysis 1.1). Therefore, we combined results of all doses of PPI therapy in the following analyses.
Proton pump inhibitor versus placebo
Global symptoms of dyspepsia
Eighteen eligible studies with 6172 participants were included in the global assessment of dyspepsia analysis (Blum 2000; Bolling‐Sternevald 2002; Catapani 2015; Farup 1999; Fletcher 2011; Gerson 2005; Hengels 1998; Iwakiri 2013; Majewski 2016; Peura 2004; Suzuki 2013 (ELF); Talley 1998 (BOND); Talley 1998 (OPERA); Talley 2007; Tominaga 2010; Van Rensburg 2008; Van Zanten 2006; Wong 2002).
PPI therapy was more effective than placebo, with 31.1% of the PPI group reporting no or minimal symptoms compared with 25.8% of the placebo group (RR of remaining dyspeptic 0.88, 95% CI 0.82 to 0.94; P < 0.001, random‐effects model) with an NNTB of 11. There was considerable heterogeneity between trials (I2 = 71%; Chi2 = 57.74; df = 17; P < 0.001) (Analysis 2.1) with no significant funnel plot asymmetry Egger's bias (‐0.63, 95% CI ‐2.49 to 1.21; P = 0.47). In a sensitivity analysis, the effect remained significant with OR (OR 0.63, 95% CI 0.49 to 0.81) and with fixed‐effect model (RR 0.88, 95% CI 0.85 to 0.91).
Quality of life
Six studies investigated the effect of PPIs versus placebo on QoL (Blum 2000; Bolling‐Sternevald 2002; Talley 1998 (BOND); Talley 1998 (OPERA); Van Zanten 2006; Wong 2002).
Blum 2000 assessed QoL using a validated questionnaire translated into German. The authors reported an improvement on QoL with standard doses of omeprazole compared to placebo in H pylori‐positive participants, but the effect was not so pronounced in H pylori‐negative participants (data were not shown). In a similar direction, Van Zanten 2006 found differences in improvement of five domains of the Quality of Life in Reflux and Dyspepsia (QoLRAD) questionnaire at four weeks but not at eight weeks for esomeprazole versus placebo. In contrast, four trials found no differences in QoL assessed by the Psychological General Well‐Being Index (PGWBI) (Bolling‐Sternevald 2002; Talley 1998 (BOND); Talley 1998 (OPERA)), or by the 36‐item Short Form (SF‐36) (Wong 2002). Data were not shown in the study by Bolling‐Sternevald 2002.
We found data for quantitative analysis for three studies from two papers (Talley 1998 (BOND); Talley 1998 (OPERA); Wong 2002). There were no differences in QoL between PPIs and placebo assessed by the PGWBI (Talley 1998 (BOND); Talley 1998 (OPERA)), and by SF‐36 (Wong 2002) (SMD 0.01, 95% CI ‐0.09 to 0.11) (Analysis 2.10).
Adverse events
Fourteen studies comparing PPIs versus placebo reported information on adverse events (Blum 2000; Bolling‐Sternevald 2002; Farup 1999; Fletcher 2011; Hengels 1998; Iwakiri 2013; Peura 2004; Suzuki 2013 (ELF); Talley 1998 (BOND); Talley 1998 (OPERA); Talley 2007; Van Rensburg 2008; Van Zanten 2006; Wong 2002). We excluded data from eight studies from the meta‐analysis (Bolling‐Sternevald 2002; Farup 1999; Peura 2004; Suzuki 2013 (ELF); Talley 1998 (BOND); Talley 1998 (OPERA); Van Zanten 2006; Wong 2002). Peura 2004 and Van Zanten 2006 reported individual adverse events rather than overall adverse events. Farup 1999 found no clinically significant adverse events; however, information on adverse events was not shown. Suzuki 2013 (ELF) reported only mild symptoms during the test period; however, it was unclear to which group the adverse events were attributed. The other four trials reported participants that dropped out of the study due to adverse events rather than overall adverse events (Bolling‐Sternevald 2002; Talley 1998 (BOND); Talley 1998 (OPERA); Wong 2002).
There were no differences on adverse events in PPIs compared to placebo (RR 0.99, 95% CI 0.73 to 1.33). However, there was significant heterogeneity between studies (I2 = 55%, P = 0.06) (Analysis 2.11).
Proton pump inhibitor versus H2 receptor antagonist
Global symptoms of dyspepsia
We identified two trials with 740 participants, comparing the effect of PPIs versus H2RA on global assessment of dyspepsia (Blum 2000; Dillon 2004). One study compared omeprazole 20 mg and 10 mg with ranitidine 150 mg over two weeks (Blum 2000). The other study was a completed trial that was only published in abstract form, evaluating the effect of lansoprazole 30 mg versus ranitidine 150 mg twice daily over eight weeks (Dillon 2004). There was no difference between PPI and H2RA therapy (RR of remaining dyspeptic on PPI therapy 0.88, 95% CI 0.74 to 1.04; P = 0.14). There was substantial heterogeneity between the trials (I2 = 51%; Chi2 = 2.05; df = 1) (Analysis 3.1). In a sensitivity analysis, the effect remained non‐significant with a random‐effects model (OR 0.66, 95% CI 0.40 to 1.07) or with a fixed‐effect model (RR 0.90, 95% CI 0.81 to 0.99).
Quality of life
No studies compared the effect of PPIs versus H2RAs for QoL.
Adverse events
One study comparing PPIs versus H2RA reported adverse events (Blum 2000). There were no differences on adverse events in PPIs compared to H2RA therapy (RR 0.97, 95% CI 0.64 to 1.46) (Analysis 3.2).
Proton pump inhibitor versus prokinetic
Global symptoms of dyspepsia
We identified five studies with 1033 participants comparing the effect of PPI versus different prokinetics (Hsu 2011; Jiang 2011; Jung 2016; Kamiya 2017; Li 2003). The length of treatment for all studies was two to four weeks. Two of the studies compared mosapride 5 mg three times a day versus lansoprazole (Hsu 2011) or pantoprazole (Jiang 2011) for two weeks. One study compared itopride versus rabeprazole (Kamiya 2017), one study compared cisapride versus omeprazole (Li 2003), and one study investigated the effect of a new prokinetic, DA 9701 with pantoprazole 40 mg (Jung 2016).
Pooled data revealed a small difference in favour of PPI compared to prokinetics (RR 0.89, 95% CI 0.81 to 0.99; P = 0.03) with an NNTB of 16. There was no heterogeneity between the studies (I2 = 0%; Chi2 = 0.92; df = 4; P = 0.92) (Analysis 4.1). In a sensitivity analysis, the effect was in a similar direction with an OR (OR 0.78, 95% CI 0.60 to 1.00) and with a fixed‐effect model (RR 0.90, 95% CI 0.81 to 1.00). Whilst an NNT of 16 may (or may not) be clinically significant, the 95%CI do include a clinically significant effect.
Quality of life
One study evaluated the effect of pantoprazole versus prokinetics using the Korean version of the Nepean Dyspepsia Index (Jung 2016). There was no difference on change of QoL scores from baseline after four weeks of treatment (MD ‐0.50, 95% CI ‐4.42 to 3.42) (Analysis 4.2).
Adverse events
All studies comparing PPIs versus prokinetics reported adverse events. There were no differences on adverse events in PPIs compared to prokinetics therapy (RR 1.09, 95% CI 0.79 to 1.49) (Analysis 4.3). No significant heterogeneity was observed between studies (I2 = 0%, P = 0.71).
Proton pump inhibitor plus prokinetic versus prokinetic alone
Global symptoms of dyspepsia
Two studies evaluated the effect of PPIs combined with prokinetics compared to prokinetics alone on global assessment of dyspepsia (Jung 2016; Yang 2014). One study evaluated the effect of pantoprazole plus mosapride versus mosapride three times a day for one, three and six months (Yang 2014). One study evaluated the effect of pantoprazole plus DA 9701 compared to pantoprazole alone or DA 9701 alone for four weeks (Jung 2016).
There was no difference between PPI plus prokinetics compared to prokinetics alone (RR 0.85, 95% CI 0.68 to 1.08; P = 0.18). There was no heterogeneity between the studies (I2 = 0%; Chi2 = 0.45; df = 1; P = 0.5) (Analysis 5.1). In a sensitivity analysis, the effect remained non‐significant with a random‐effects model (OR 0.77, 95% CI 0.52 to 1.14) and with a fixed‐effect model (RR 0.86, 95% CI 0 to 68 to 1.08).
Quality of life
Two studies evaluated QoL in people with FD treated with PPIs plus prokinetics versus prokinetics alone (Jung 2016; Yang 2014). One study compared pantoprazole plus DA 9701 versus DA 9701 alone using the Korean version of the Nepean Dyspepsia Index and reported the change of QoL scores from baseline (MD ‐1.10, 95% CI ‐5.22 to 3.02); the second study reported post‐treatment QoL scores assessed by the Functional Digestive Disorders Quality of Life questionnaire (FDDQL) (MD 18.96, 95% CI 17.01 to 20.91). There were no differences in QoL between PPIs+ prokinetics vs prokinetics alone. Data were not pooled as final values and change scores should not be combined as standardized mean differences (Deeks 2011). (Analysis 5.2).
Adverse events
Two studies comparing PPIs combined with prokinetics versus prokinetics alone reported adverse events (Jung 2016; Yang 2014). There were slightly fewer adverse events with PPIs plus prokinetics compared to prokinetics alone (RR 0.60, 95% CI 0.39 to 0.93) (Analysis 5.3).
Subgroup analyses
Duration of treatment
We performed a subgroup analysis to assess the efficacy of PPI versus placebo according to the duration of treatment (Analysis 2.2). One of the 18 studies did not provide information on the duration of treatment (Catapani 2015). From the 18 studies, four studies involving 1169 participants evaluated the effect of PPI versus placebo after two weeks of treatment (RR of remaining dyspeptic after two weeks 0.78, 95% CI 0.70 to 0.87) (Blum 2000; Bolling‐Sternevald 2002; Fletcher 2011; Hengels 1998). Nine studies from eight papers involving 2425 participants evaluated the effect of PPI versus placebo after four weeks of treatment (Farup 1999; Gerson 2005; Majewski 2016; Suzuki 2013 (ELF); Talley 1998 (BOND); Talley 1998 (OPERA); Tominaga 2010; Van Rensburg 2008; Wong 2002) (RR of remaining dyspeptic after four weeks 0.89, 95% CI 0.76 to 1.03). Four studies involving 2447 participants evaluated the effect of PPI versus placebo after eight weeks of treatment (RR of remaining dyspeptic after eight weeks 0.92, 95% CI 0.86 to 0.98) (Analysis 2.2) (Iwakiri 2013; Peura 2004; Talley 2007; Van Zanten 2006). There was significant difference between subgroups (I2 = 66.6%; Chi2 = 5.99; df = 2; P = 0.05).
Dose
As mentioned at the beginning of the Effects of interventions section, there was no difference between the two doses of PPI therapy (RR of remaining dyspeptic on standard‐dose versus low‐dose PPI (RR 0.97, 95% CI 0.92 to 1.02; P = 0.21) with no heterogeneity between studies (I2 = 0%; Chi2 = 2.54; df = 5; P = 0.77) (Analysis 1.1). All doses were combined for the analyses, therefore subgroup analyses on dose was not possible.
Geographical location
We performed a subgroup analysis to assess the efficacy of PPI versus placebo according to the origin of the study (Analysis 2.3). For the multicentre studies, we allocated them to the Western countries subgroup, as most of the sites were in the Western area. Fourteen studies, involving 5213 participants evaluating the effect of PPI versus placebo originated in western countries (RR of remaining dyspeptic 0.85, 95% CI 0.79 to 0.92) (Blum 2000; Bolling‐Sternevald 2002; Catapani 2015; Farup 1999; Fletcher 2011; Gerson 2005; Hengels 1998; Majewski 2016; Peura 2004; Talley 1998 (BOND); Talley 1998 (OPERA); Talley 2007; Van Rensburg 2008; Van Zanten 2006). Four studies involving 959 participants evaluating the effect of PPI versus placebo originated in Eastern countries (RR of remaining dyspeptic 0.97, 95% CI 0.84 to 1.11) (Analysis 2.3) (Iwakiri 2013; Suzuki 2013 (ELF); Tominaga 2010; Wong 2002). There was no difference between subgroups (Chi2 = 2.46; df = 1; P = 0.12).
Helicobacter pylori status
Nine studies comparing PPIs versus placebo provided information of the impact of H pylori status on dyspepsia (Blum 2000; Bolling‐Sternevald 2002; Hengels 1998; Iwakiri 2013; Talley 1998 (BOND); Talley 1998 (OPERA); Talley 2007; Van Zanten 2006; Wong 2002). Data from individual studies Talley 1998 (BOND) and Talley 1998 (OPERA) were not provided in the paper, therefore they were combined for the analysis. There was insufficient information on H pylori status in eligible comparison in the study by Talley 2007, for the previous reason this study was excluded from the analysis. In addition, one of the studies reported that H pylori status had no effect on treatment response; however, data were not reported in the paper (Van Zanten 2006). Subgroup analysis in studies evaluating PPI versus placebo in the relief of dyspeptic symptoms in H pylori‐positive participants (RR 0.84, 95% CI 0.76 to 0.93) and H pylori‐negative participants (RR 0.94, 95% CI 0.83 to 1.06) showed no difference between subgroups (I2 = 44.2%; Chi2 = 1.79; df = 1; P = 0.18) (Analysis 2.4).
Proton pump inhibitor subtype
We performed a subgroup analysis to assess the efficacy of PPI versus placebo according to the PPI subtype (Analysis 2.5). Seven studies including 2238 participants compared omeprazole (doses were combined) versus placebo (RR of dyspeptic symptoms on omeprazole 0.88, 95% CI 0.79 to 0.98) (Blum 2000; Bolling‐Sternevald 2002; Catapani 2015; Farup 1999; Gerson 2005; Talley 1998 (BOND); Talley 1998 (OPERA)). Five studies compared lansoprazole versus placebo; three used standard‐dose (30 mg/day) (Fletcher 2011; Peura 2004; Wong 2002), and four use low‐dose (15 mg/day) (Hengels 1998; Peura 2004; Suzuki 2013 (ELF); Wong 2002). The RR of dyspeptic symptoms on lansoprazole was 0.82 (95% CI 0.70 to 0.97 (combined doses)). Three studies compared esomeprazole 40 mg/day (RR of dyspeptic symptoms on esomeprazole 0.84, 95% CI 0.65 to 1.09) (Majewski 2016; Talley 2007; Van Zanten 2006). One study compared pantoprazole 20 mg versus placebo (RR of dyspeptic symptoms on pantoprazole 0.82, 95% CI 0.68 to 1.00) (Van Rensburg 2008). One study compared different doses of rabeprazole (10 mg/day, 20 mg/day and 40 mg/day) with placebo (Iwakiri 2013) and one study compared rabeprazole 10 mg/day with placebo (Tominaga 2010). The RR of dyspeptic symptoms with rabeprazole was 0.95 (95% CI 0.84 to 1.08 (doses combined)). There was no difference between subgroups (I2 = 0%; Chi2 = 2.71; df = 4; P = 0.61) (Analysis 2.5).
Presence of reflux (abnormal 24‐hour pH study)
Two studies provided data on the efficacy of PPI therapy versus placebo in participants subgrouped according to abnormal 24‐hour pH study (greater than 4% pH less than 4: RR 0.91, 95% CI 0.70 to 1.19) or normal 24‐hour pH study (less than 4% pH less than 4: RR 1.27, 95% CI 0.49 to 3.29) (Bolling‐Sternevald 2002; Gerson 2005). There was no difference between subgroups (I2 = 0%; Chi2 = 0.45; df = 1; P = 0.50) (Analysis 2.6).
Rome III dyspepsia subtypes
Two studies provided data on the efficacy of PPI therapy versus placebo in participants subgrouped according to Rome III epigastric pain syndrome (RR of remaining dyspeptic 0.99, 95% CI 0.76 to 1.28) and postprandial distress subtypes (RR of remaining dyspeptic 0.89, 95% CI 0.77 to 1.03) (Iwakiri 2013; Suzuki 2013 (ELF)). There was no difference between subgroups (I2 = 0%; Chi2 = 0.48; df = 1; P = 0.49) (Analysis 2.7).
Risk of bias
Four studies comparing PPIs versus placebo had high risk of bias (Catapani 2015; Farup 1999; Gerson 2005; Talley 2007) (RR 1.00, 95% CI 0.80 to 1.24). The other studies were at low risk of bias (4 studies, RR 0.84, 95% CI 0.73 to 0.98) or unclear risk of bias (10 studies, RR 0.86, 95% CI 0.79 to 0.94). There was no difference between subgroups (I2 = 0%; Chi2 = 1.61; df = 2; P = 0.45) (Analysis 2.8).
Funding
Source of funding was unclear in eight studies (Catapani 2015; Dillon 2004; Hengels 1998; Hsu 2011; Jiang 2011; Kamiya 2017; Li 2003; Yang 2014), and 17 studies were funded by a pharmaceutical company (Blum 2000; Bolling‐Sternevald 2002; Farup 1999; Fletcher 2011; Gerson 2005; Iwakiri 2013; Jung 2016; Majewski 2016; Peura 2004; Suzuki 2013 (ELF); Talley 1998 (BOND); Talley 1998 (OPERA); Talley 2007; Tominaga 2010; Van Rensburg 2008; Van Zanten 2006; Wong 2002). Considering that pharmaceutical companies sponsored all the studies with clear funding source, there was no need to perform the intended subgroup analysis to explore whether trial funding sources might have influenced the results.
Data from abstracts
Three included studies were published solely in abstract form (RR 0.89, 95% CI 0.68 to 1.15) (Catapani 2015; Hengels 1998; Hsu 2011). The other studies were published as full text (14 studies, RR 0.87, 95% CI 0.81 to 0.94). There was no difference between subgroups (I2 = 0%; Chi2 = 0.01; df = 1; P = 0.90) (Analysis 2.9).
Discussion
Summary of main results
Our updated review demonstrated that PPIs were more effective than placebo for the treatment of FD, independent of the dose or duration of treatment. The symmetry found in the forest plot suggested that reporting bias (publication bias) was not a risk. We performed both effect estimates models and found results were similar. However, we found substantial heterogeneity between the studies. In concordance with our previous review, subgroup analysis suggested that the variation in results between studies may not be explained by differences on country of origin, H pylori status or subtype of PPI.
The effect of PPIs over placebo was not influenced by the presence of reflux symptoms or different subtypes of FD, suggesting that differentiation of these subtypes may not be needed.
PPIs may be slightly more effective than H2RAs for the treatment of FD. However, no study has been published since our last review, therefore the evidence remains from the previous two RCTs including 740 participants and the effect size was small. Therefore, we consider there is insufficient data to be confident on the real effect estimate.
PPIs may be slightly more effective than prokinetics at relieving overall dyspepsia symptoms in people with FD. However, the studies involved in the analysis had methodological problems, which are likely to influence the results.
PPIs were no more effective than placebo in improving QoL. However, we found no new data in our update. Future studies are needed to confirm these results.
Finally, similar to our previous analysis, there were no differences in the rate of adverse events between PPIs and any of the comparisons including placebo, indicating that PPIs are safe for the treatment of FD.
Overall completeness and applicability of evidence
We identified two new studies comparing PPIs versus placebo (Catapani 2015; Majewski 2016). In the previous version of the review, we listed Catapani 2015 as an ongoing study as it was only available as an abstract. For this update, the authors of the study provided us with additional information, and therefore, we were able to include this study in our analysis. Kamiya 2017 was included in the previous version of this review listed under authors' latest publication in 2011. Since then, the authors have published two further reports.
Considering the 18 studies comparing PPIs versus placebo included in this review, we can conclude that these results are applicable to all people with FD independently of the criteria for definition. The fact that the results from our review were similar to the findings of previous systematic reviews (Moayyedi 2006; Wang 2007) support the beneficial effect of PPIs in FD (see Agreements and disagreements with other studies or reviews). All the five studies included in the meta‐analysis of PPIs versus prokinetics originated from eastern countries, which may limit the results to this specific population (Hsu 2011; Jiang 2011; Jung 2016; Kamiya 2017; Li 2003).
Quality of the evidence
Proton pump inhibitor versus placebo
Overall, the quality of evidence was moderate. We downgraded the quality of evidence due to serious inconsistency. Even though some of the trials had an unclear risk of bias, the effect was evident and the majority of the studies reported a beneficial effect of PPI versus placebo. We were moderately confident that the true effect was likely to be close to that of the estimate of the effect.
Proton pump inhibitor versus H2 receptor antagonist
The quality of evidence was low. We downgraded the quality of evidence two levels due to imprecision, substantial heterogeneity (I2 = 51%) and high a risk bias in one of the two included studies. Our confidence in the effect estimate was limited: the true effect may be substantially different from the estimate of the effect.
Proton pump inhibitor versus prokinetic
All studies except one were open‐label; therefore, there was a high risk of performance and detection bias attributed to these studies. We downgraded the quality of evidence to low meaning that our confidence in the effect estimate was limited: the true effect may be substantially different from the estimate of the effect.
Proton pump inhibitors plus prokinetics versus prokinetics alone
The quality of evidence was moderate. We downgraded the quality of evidence one level due to serious imprecision. We were moderately confident that the true effect was likely to be close to that of the estimate of the effect.
Potential biases in the review process
We based our methods and reporting on recommendations of the Cochrane Handbook for Systematic Reviews of Interventions (Higgins 2011). We consider that our methods and meta‐analyses were rigorous while searching for studies, selecting studies, performing data extraction and analysing data.
We aimed to be as transparent as possible and published the protocol in advance. However, as seen in all meta‐analyses, there may be some potential limitations related to our study.
One potential limitation could be related to the lack of information obtained from authors in one study (Pilichiewicz 2011), which we excluded from the review due to a lack of data. Although the lack of this information is likely to decrease our confidence in the results, this was outside of the control of the review authors.
Agreements and disagreements with other studies or reviews
There are multiple narrative reviews (Camillieri 2013; Savarino 2017; Stanghellini 2016; Suzuki 2011), but only two systematic reviews and meta‐analyses investigating the effects of PPIs in FD (Moayyedi 2006; Wang 2007). The scope of the reviews differed considerably. Moayyedi 2006 was a comprehensive review evaluating different strategies for the treatment of FD including PPIs, while Wang 2007 limited the analysis to the effect of PPIs compared to placebo for the treatment of FD. The current review aimed to determine the efficacy of PPIs for FD compared with placebo and to other therapeutic options. In our review, two to eight weeks of treatment with PPIs were more effective than placebo in overall symptom improvement in people with FD. Although our review included eight more studies evaluating the effect of PPIs versus other treatments, compared to the Moayyedi 2006 review, the results were consistent with the previous analyses. Similar to Moayyedi 2006 and Wang 2007, we found that PPIs were more effective than placebo in treating people with FD. We anticipated potential differences between studies that may have influenced the results, and prespecified analyses to identify sources of heterogeneity. In concordance with previous analyses, we found no differences in the effect between duration of treatment and dose of PPIs, or by the presence of Rome III dyspepsia subtype. There is a discrepancy with our findings on the dyspepsia subtype compared to the analysis from Wang 2007, and this could be related to the inclusion of studies with different definitions of FD. While Wang 2007 considered reflux‐like or dysmotility‐like dyspepsia according to Rome II criteria, our analysis also included investigated epigastric pain syndrome versus postprandial distress syndrome according to Rome III criteria. The definition of FD using the Rome III criteria is stricter than previous definitions of FD in excluding participants with reflux symptoms, and, therefore, this could lead to differences on the results.
We have confirmed the findings from Moayyedi 2006 on the lack of a positive effect of PPIs over placebo on improving QoL.
We performed a subgroup analysis to investigate whether the effect of PPIs compared with placebo changed according to country of origin and PPI subtype. Although this was suggested by Wang 2007 as a potential source of heterogeneity, this was not the case in our analysis as we found no differences between subgroups. We also found no difference between PPI subtype. Our meta‐analysis is the first to perform subgroup analysis on PPI subtype and these results should be confirmed in future analyses.
Our analysis found that PPIs were slightly more effective than H2RAs. As previously reported by Moayyedi 2006, we found substantial heterogeneity and methodological differences between the two studies that may explain the inconsistent results. Wang 2007 did not assess the effect of PPIs versus H2RAs. Therefore, there is a need of studies comparing the effect of PPIs versus H2RAs in the treatment of FD, as they may be a more cost‐effective alternative.
Our results found that PPIs were slightly more effective than prokinetics at relieving overall dyspepsia symptoms in people with FD. This goes in a similar direction to the review by Moayyedi 2006. However, we consider that these results should be taken with caution, due to serious methodological concerns related to the majority of studies comparing PPIs versus prokinetics.
Finally, our review demonstrated that PPIs were relatively safe drugs with a similar number of adverse events compared to placebo, H2RAs and prokinetics. The safety of PPIs was in concordance with the results by Moayyedi 2006, but not explored in Wang 2007.

Study flow diagram.

Risk of bias summary: review authors' judgements about each risk of bias item for each included study.

Risk of bias graph: review authors' judgements about each risk of bias item presented as percentages across all included studies.

Funnel plot of comparison: 3 Proton pump inhibitors versus placebo, outcome: 3.1 Global symptoms (two to eight weeks).

Comparison 1 Standard‐dose versus low‐dose proton pump inhibitors (PPI), Outcome 1 Global symptoms of dyspepsia.

Comparison 2 Proton pump inhibitors (PPI) versus placebo, Outcome 1 Global symptoms of dyspepsia.

Comparison 2 Proton pump inhibitors (PPI) versus placebo, Outcome 2 Global symptoms of dyspepsia by duration of treatment.
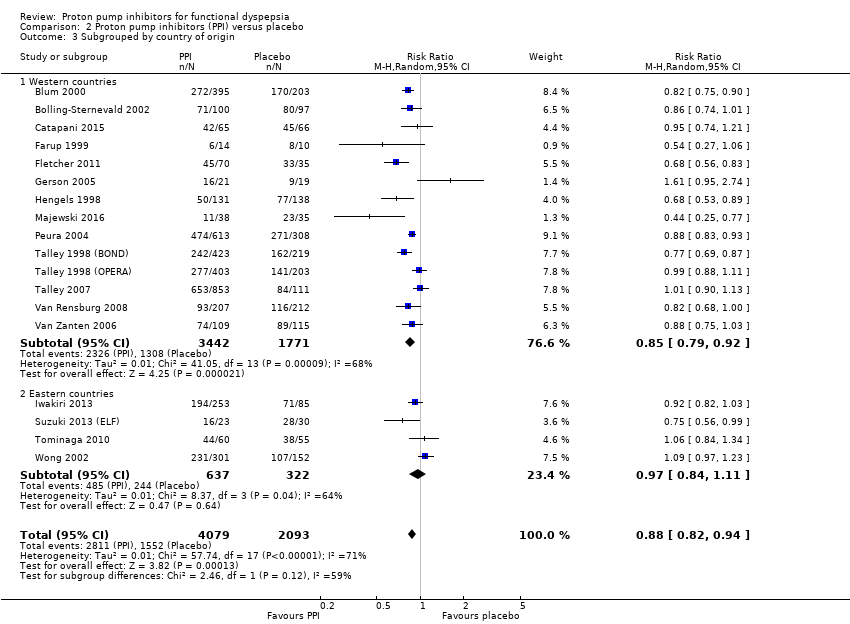
Comparison 2 Proton pump inhibitors (PPI) versus placebo, Outcome 3 Subgrouped by country of origin.
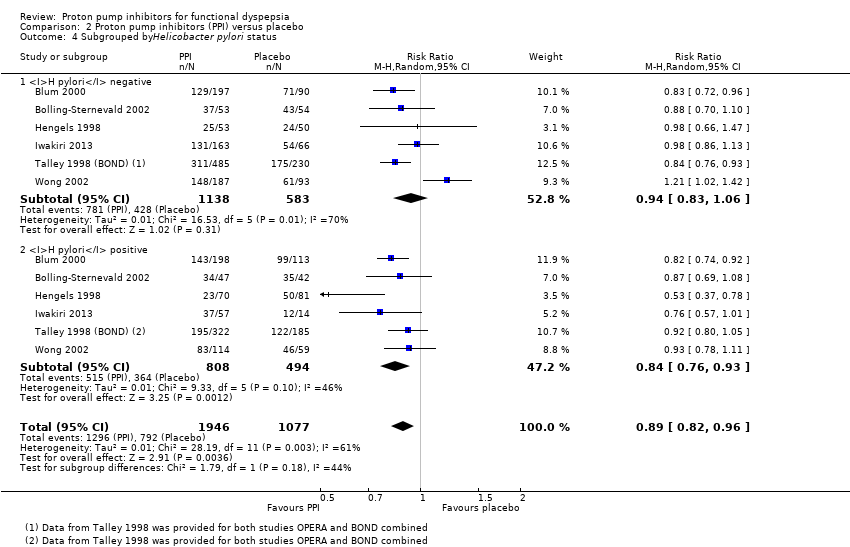
Comparison 2 Proton pump inhibitors (PPI) versus placebo, Outcome 4 Subgrouped byHelicobacter pylori status.

Comparison 2 Proton pump inhibitors (PPI) versus placebo, Outcome 5 Subgroup by PPI subtype.

Comparison 2 Proton pump inhibitors (PPI) versus placebo, Outcome 6 Subgrouped by 24‐hour pH study.

Comparison 2 Proton pump inhibitors (PPI) versus placebo, Outcome 7 Subgrouped by Rome III dyspepsia subtypes.
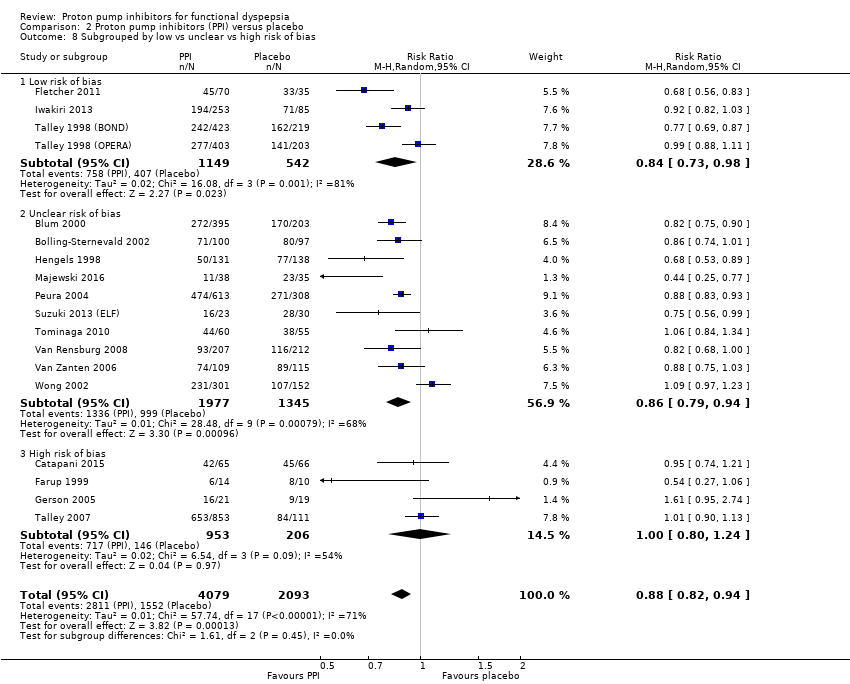
Comparison 2 Proton pump inhibitors (PPI) versus placebo, Outcome 8 Subgrouped by low vs unclear vs high risk of bias.

Comparison 2 Proton pump inhibitors (PPI) versus placebo, Outcome 9 Subgrouped by publication type.

Comparison 2 Proton pump inhibitors (PPI) versus placebo, Outcome 10 Quality of life.

Comparison 2 Proton pump inhibitors (PPI) versus placebo, Outcome 11 Adverse events.

Comparison 3 Proton pump inhibitors (PPI) versus H2 receptor antagonists (H2RA), Outcome 1 Global symptoms of dyspepsia.

Comparison 3 Proton pump inhibitors (PPI) versus H2 receptor antagonists (H2RA), Outcome 2 Adverse events.

Comparison 4 Proton pump inhibitors (PPI) versus prokinetics, Outcome 1 Global symptoms of dyspepsia (2‐4 weeks).

Comparison 4 Proton pump inhibitors (PPI) versus prokinetics, Outcome 2 Quality of life.

Comparison 4 Proton pump inhibitors (PPI) versus prokinetics, Outcome 3 Adverse events.

Comparison 5 Proton pump inhibitors (PPI) plus prokinetics versus prokinetics alone, Outcome 1 Global symptoms of dyspepsia (2‐4 weeks).

Comparison 5 Proton pump inhibitors (PPI) plus prokinetics versus prokinetics alone, Outcome 2 Quality of life.

Comparison 5 Proton pump inhibitors (PPI) plus prokinetics versus prokinetics alone, Outcome 3 Adverse events.
| PPI versus placebo for functional dyspepsia | ||||||
| Patient or population: functional dyspepsia | ||||||
| Outcomes | Anticipated absolute effects* (95% CI) | Relative effect | № of participants | Quality of the evidence | Comments | |
| Risk with placebo | Risk with Proton pump inhibitors (PPI) | |||||
| Global symptoms of dyspepsia (> 2 weeks) | Study population | RR 0.88 | 6172 | ⊕⊕⊕⊝ | Measurement of no improvement. | |
| 714 per 1000 | 629 per 1000 | |||||
| Quality of life | The mean post‐treatment PGWB score was 99.84, the mean post‐treatment SF‐36 score was 66.2 | SMD 0.01 higher | 1630 | ⊕⊕⊕⊝ | Higher scores means better quality of life. | |
| Adverse events | Study population | RR 0.99 | 2693 | ⊕⊕⊕⊝ | Number of adverse events. | |
| 191 per 1000 | 189 per 1000 | |||||
| *The risk in the intervention group (and its 95% confidence interval) is based on the assumed risk in the comparison group and the relative effect of the intervention (and its 95% CI). CI: confidence interval; MD: mean difference; PPI: proton pump inhibitor; RCT: randomized controlled trial; RR: risk ratio; SF‐36: 36‐item Short Form. | ||||||
| GRADE Working Group grades of evidence | ||||||
| 1Downgraded one level due to serious inconsistency between studies. 2Downgraded one level due to imprecision. | ||||||
| PPI versus H2RA for functional dyspepsia | ||||||
| Patient or population: adults with functional dyspepsia | ||||||
| Outcomes | Anticipated absolute effects* (95% CI) | Relative effect | No of participants | Quality of the evidence | Comments | |
| Risk with H2RA | Risk with PPI | |||||
| Global symptoms of dyspepsia Follow‐up: range 2‐8 weeks | Study population | RR 0.88 | 740 | ⊕⊕⊝⊝ | Measurement of no improvement. | |
| 739 per 1000 | 650 per 1000 | |||||
| Quality of life Follow‐up: range 2‐8 weeks | ‐ | ‐ | Not estimable | (0 studies) | ‐ | No data available. |
| Adverse events Follow‐up range 2‐8 weeks | Study population | RR 0.97 | 589 | ⊕⊕⊕⊝ | Number of adverse events. | |
| 144 per 1000 | 137 per 1000 | |||||
| *The risk in the intervention group (and its 95% confidence interval) is based on the assumed risk in the comparison group and the relative effect of the intervention (and its 95% CI). CI: confidence interval; H2RA: H2 receptor antagonist; PPI: proton pump inhibitor; RCT: randomized controlled trial; RR: risk ratio. | ||||||
| GRADE Working Group grades of evidence | ||||||
| 1Downgraded two levels due to imprecision, substantial heterogeneity (I2 = 51%) and high risk of bias in one of the two studies. 2Downgraded one level due to serious imprecision (95% CI included appreciable benefit and harm and low number of events). | ||||||
| PPI versus prokinetics for functional dyspepsia | ||||||
| Patient or population: adults with functional dyspepsia | ||||||
| Outcomes | Anticipated absolute effects* (95% CI) | Relative effect | No of participants | Quality of the evidence | Comments | |
| Risk with prokinetic | Risk with PPI | |||||
| Global symptoms of dyspepsia Follow‐up: range 2‐4 weeks | Study population | RR 0.89 | 1033 | ⊕⊕⊝⊝ | Measurement of no improvement. | |
| 495 per 1000 | 441 per 1000 | |||||
| Quality of life Follow‐up: range 2‐4 weeks | The mean NDI score change from baseline was 20.4 | MD 0.5 lower | 262 | ⊕⊕⊕⊝ | Higher scores denote better outcome. | |
| Adverse events Follow‐up: 4 weeks | Study population | RR 1.09 | 1033 | ⊕⊕⊕⊝ | Number of adverse events. | |
| 113 per 1000 | 123 per 1000 | |||||
| *The risk in the intervention group (and its 95% confidence interval) is based on the assumed risk in the comparison group and the relative effect of the intervention (and its 95% CI). CI: confidence interval; PPI: proton pump inhibitor; RCT: randomized controlled trial; RR: risk ratio. | ||||||
| GRADE Working Group grades of evidence | ||||||
| 1Downgraded one level due to serious imprecision. 2Downgraded one level due to risk of bias in four of the five studies. 3We did not consider the impact of risk of bias and inconsistency on the results to be serious enough to justify fully downgrading two levels so we have downgraded one level in respect of both considerations. | ||||||
| PPI + prokinetics versus prokinetics alone for functional dyspepsia | ||||||
| Patient or population: adults with functional dyspepsia | ||||||
| Outcomes | Anticipated absolute effects* (95% CI) | Relative effect | No of participants | Quality of the evidence | Comments | |
| Risk with prokinetic alone | Risk with PPI + prokinetic | |||||
| Global symptoms of dyspepsia Follow‐up range: 2 to 4 weeks | Study population | RR 0.85 | 407 | ⊕⊕⊕⊝ | Measurement of no improvement. | |
| 444 per 1000 | 377 per 1000 | |||||
| Quality of life Follow‐up: 4 weeks | NDI | ‐ | 258 | ⊕⊕⊕⊝ | Higher scores denote better outcome. | |
| The mean NDI score change from baseline was 20.4 | MD for NDI score change from baseline 1.10 lower (5.22 lower to 3.02 higher) | |||||
| FDDQL | ‐ | 149 | ⊕⊕⊕⊝ | Higher scores denote better outcome. | ||
| The mean post‐treatment FDDQL score was 70.56 | MD for FDDQL score 18.96 higher (17.01 lower to 20.91 higher) | |||||
| Adverse events Follow‐up: 4 weeks | Study population | RR 0.60 | 407 | ⊕⊕⊕⊝ | Number of adverse events. | |
| 220 per 1000 | 132 per 1000 | |||||
| *The risk in the intervention group (and its 95% confidence interval) is based on the assumed risk in the comparison group and the relative effect of the intervention (and its 95% CI). CI: confidence interval; MD: mean difference; PPI: proton pump inhibitor; RCT: randomized controlled trial; RR: risk ratio. | ||||||
| GRADE Working Group grades of evidence | ||||||
| 1Downgraded one level due to serious imprecision . | ||||||
| Functional dyspepsia | Rome I (1991) | Rome II (1999) | Rome III (2006) Rome IV (2016) | AGA Working Group | Lancet Working Group (1998) |
| Main criteria | Pain or discomfort centred in the upper abdomen with no evidence of organic disease. | Persistent or recurrent symptoms (pain or discomfort centred in the upper abdomen). AND No evidence that dyspepsia is exclusively relieved by defecation or associated with the onset of a change in stool frequency or stool form (exclude irritable bowel syndrome and exclude reflux). | ≥ 1 symptoms need to be present:
| Chronic or recurrent pain or discomfort centred in the upper abdomen. | Chronic or recurrent pain or discomfort centred in the upper abdomen or retrosternal pain, discomfort, heartburn, nausea, vomiting or other symptoms of the gastrointestinal tract. |
| Normal upper endoscopy | Required. | Required. | Required. | Required. | Required. |
| Symptoms present for the last... | ‐ | 12 weeks, which need not be consecutive. | Criteria fulfilled for the last 3 months. | ≥ 3 months. | ≥ 4 weeks. |
| Onset of symptoms | ‐ | 12 months. | 6 months. | ‐ | ‐ |
| Subtypes |
|
|
| ‐ | Reflux‐like dyspepsia. |
| AGA: American Gastroenterological Association. | |||||
| Proton pump inhibitor | Daily standard dose |
| Dex‐lansoprazole | 30 mg |
| Esomeprazole | 20 mg to 40 mg |
| Lansoprazole | 30 mg |
| Omeprazole | 20 mg |
| Pantoprazole | 40 mg |
| Rabeprazole | 20 mg |
| Outcome or subgroup title | No. of studies | No. of participants | Statistical method | Effect size |
| 1 Global symptoms of dyspepsia Show forest plot | 6 | 2304 | Risk Ratio (M‐H, Random, 95% CI) | 0.97 [0.92, 1.02] |
| Outcome or subgroup title | No. of studies | No. of participants | Statistical method | Effect size |
| 1 Global symptoms of dyspepsia Show forest plot | 18 | 6172 | Risk Ratio (M‐H, Random, 95% CI) | 0.88 [0.82, 0.94] |
| 2 Global symptoms of dyspepsia by duration of treatment Show forest plot | 17 | Risk Ratio (M‐H, Random, 95% CI) | Subtotals only | |
| 2.1 2 weeks' therapy | 4 | 1169 | Risk Ratio (M‐H, Random, 95% CI) | 0.78 [0.70, 0.87] |
| 2.2 4 weeks' therapy | 9 | 2425 | Risk Ratio (M‐H, Random, 95% CI) | 0.89 [0.76, 1.03] |
| 2.3 8 weeks' therapy | 4 | 2447 | Risk Ratio (M‐H, Random, 95% CI) | 0.92 [0.86, 0.98] |
| 3 Subgrouped by country of origin Show forest plot | 18 | 6172 | Risk Ratio (M‐H, Random, 95% CI) | 0.88 [0.82, 0.94] |
| 3.1 Western countries | 14 | 5213 | Risk Ratio (M‐H, Random, 95% CI) | 0.85 [0.79, 0.92] |
| 3.2 Eastern countries | 4 | 959 | Risk Ratio (M‐H, Random, 95% CI) | 0.97 [0.84, 1.11] |
| 4 Subgrouped byHelicobacter pylori status Show forest plot | 6 | 3023 | Risk Ratio (M‐H, Random, 95% CI) | 0.89 [0.82, 0.96] |
| 4.1 H pylori negative | 6 | 1721 | Risk Ratio (M‐H, Random, 95% CI) | 0.94 [0.83, 1.06] |
| 4.2 H pylori positive | 6 | 1302 | Risk Ratio (M‐H, Random, 95% CI) | 0.84 [0.76, 0.93] |
| 5 Subgroup by PPI subtype Show forest plot | 18 | 6172 | Risk Ratio (M‐H, Random, 95% CI) | 0.88 [0.82, 0.94] |
| 5.1 Omeprazole vs placebo | 7 | 2238 | Risk Ratio (M‐H, Random, 95% CI) | 0.88 [0.79, 0.98] |
| 5.2 Esomeprazole vs placebo | 3 | 1261 | Risk Ratio (M‐H, Random, 95% CI) | 0.84 [0.65, 1.09] |
| 5.3 Lansoprazole vs placebo | 5 | 1801 | Risk Ratio (M‐H, Random, 95% CI) | 0.82 [0.70, 0.97] |
| 5.4 Pantoprazole vs placebo | 1 | 419 | Risk Ratio (M‐H, Random, 95% CI) | 0.82 [0.68, 1.00] |
| 5.5 Rabeprazole vs placebo | 2 | 453 | Risk Ratio (M‐H, Random, 95% CI) | 0.95 [0.84, 1.08] |
| 6 Subgrouped by 24‐hour pH study Show forest plot | 2 | 168 | Risk Ratio (M‐H, Random, 95% CI) | 1.03 [0.73, 1.47] |
| 6.1 Abnormal 24‐hour pH test (> 4% pH < 4) | 2 | 75 | Risk Ratio (M‐H, Random, 95% CI) | 0.91 [0.70, 1.19] |
| 6.2 Normal 24‐hour pH test (< 4% pH < 4) | 2 | 93 | Risk Ratio (M‐H, Random, 95% CI) | 1.27 [0.49, 3.29] |
| 7 Subgrouped by Rome III dyspepsia subtypes Show forest plot | 2 | 326 | Risk Ratio (M‐H, Random, 95% CI) | 0.91 [0.80, 1.03] |
| 7.1 Epigastric pain syndrome | 2 | 77 | Risk Ratio (M‐H, Random, 95% CI) | 0.99 [0.76, 1.28] |
| 7.2 Postprandial distress syndrome | 2 | 249 | Risk Ratio (M‐H, Random, 95% CI) | 0.89 [0.77, 1.03] |
| 8 Subgrouped by low vs unclear vs high risk of bias Show forest plot | 18 | 6172 | Risk Ratio (M‐H, Random, 95% CI) | 0.88 [0.82, 0.94] |
| 8.1 Low risk of bias | 4 | 1691 | Risk Ratio (M‐H, Random, 95% CI) | 0.84 [0.73, 0.98] |
| 8.2 Unclear risk of bias | 10 | 3322 | Risk Ratio (M‐H, Random, 95% CI) | 0.86 [0.79, 0.94] |
| 8.3 High risk of bias | 4 | 1159 | Risk Ratio (M‐H, Random, 95% CI) | 1.00 [0.80, 1.24] |
| 9 Subgrouped by publication type Show forest plot | 18 | 6172 | Risk Ratio (M‐H, Random, 95% CI) | 0.88 [0.82, 0.94] |
| 9.1 Full text | 15 | 5657 | Risk Ratio (M‐H, Random, 95% CI) | 0.87 [0.81, 0.94] |
| 9.2 Abstract | 3 | 515 | Risk Ratio (M‐H, Random, 95% CI) | 0.89 [0.68, 1.15] |
| 10 Quality of life Show forest plot | 3 | 1630 | Std. Mean Difference (IV, Random, 95% CI) | 0.01 [‐0.09, 0.11] |
| 10.1 Psychological General Well‐Being Index | 2 | 1177 | Std. Mean Difference (IV, Random, 95% CI) | 0.03 [‐0.09, 0.15] |
| 10.2 36‐item Short Form | 1 | 453 | Std. Mean Difference (IV, Random, 95% CI) | ‐0.05 [‐0.25, 0.14] |
| 11 Adverse events Show forest plot | 6 | 2693 | Risk Ratio (M‐H, Random, 95% CI) | 0.99 [0.73, 1.33] |
| Outcome or subgroup title | No. of studies | No. of participants | Statistical method | Effect size |
| 1 Global symptoms of dyspepsia Show forest plot | 2 | 740 | Risk Ratio (M‐H, Random, 95% CI) | 0.88 [0.74, 1.04] |
| 2 Adverse events Show forest plot | 1 | 589 | Risk Ratio (M‐H, Random, 95% CI) | 0.97 [0.64, 1.46] |
| Outcome or subgroup title | No. of studies | No. of participants | Statistical method | Effect size |
| 1 Global symptoms of dyspepsia (2‐4 weeks) Show forest plot | 5 | 1033 | Risk Ratio (M‐H, Random, 95% CI) | 0.89 [0.81, 0.99] |
| 2 Quality of life Show forest plot | 1 | 262 | Mean Difference (IV, Random, 95% CI) | ‐0.5 [‐4.42, 3.42] |
| 3 Adverse events Show forest plot | 5 | 1033 | Risk Ratio (M‐H, Random, 95% CI) | 1.09 [0.79, 1.49] |
| Outcome or subgroup title | No. of studies | No. of participants | Statistical method | Effect size |
| 1 Global symptoms of dyspepsia (2‐4 weeks) Show forest plot | 2 | 407 | Risk Ratio (M‐H, Random, 95% CI) | 0.85 [0.68, 1.08] |
| 2 Quality of life Show forest plot | 2 | Mean Difference (IV, Random, 95% CI) | Subtotals only | |
| 2.1 Nepean Dyspepsia Index | 1 | 258 | Mean Difference (IV, Random, 95% CI) | ‐1.10 [‐5.22, 3.02] |
| 2.2 FDDQL scale | 1 | 149 | Mean Difference (IV, Random, 95% CI) | 18.96 [17.01, 20.91] |
| 3 Adverse events Show forest plot | 2 | 407 | Risk Ratio (M‐H, Random, 95% CI) | 0.60 [0.39, 0.93] |