Tratamiento antiadherencias después de una histeroscopia quirúrgica para la subfertilidad femenina
Información
- DOI:
- https://doi.org/10.1002/14651858.CD011110.pub3Copiar DOI

- Base de datos:
-
- Cochrane Database of Systematic Reviews
- Versión publicada:
-
- 27 noviembre 2017see what's new
- Tipo:
-
- Intervention
- Etapa:
-
- Review
- Grupo Editorial Cochrane:
-
Grupo Cochrane de Ginecología y fertilidad
- Copyright:
-
- Copyright © 2017 The Cochrane Collaboration. Published by John Wiley & Sons, Ltd.
Cifras del artículo
Altmetric:
Citado por:
Autores
Contributions of authors
JB: co‐ordinating author.
SW, FB and TD: co‐authored protocol, provided comments and criticisms on the methods and content of the review, and were involved in data extraction and risk of bias assessment.
BWM: responsible for overall supervision of the methods and consulted 'ad hoc' for assistance in resolving disagreements.
HT: involved in data extraction and risk of bias assessment for the updated version.
SJC: assisted in the search for and selection of studies, translated two Chinese articles, sent queries in Chinese to the corresponding authors of three Chinese articles, and was involved in data extraction and risk of bias assessment.
Sources of support
Internal sources
-
CEBAM, Cochrane Belgium, Belgium.
Logistical support by the Managing Secretary
External sources
-
No sources of support supplied
Declarations of interest
JB: no conflicts of interest.
SW: no conflicts of interest.
TD is a Professor in Reproductive Medicine, Department of Development and Regeneration, University of Leuven (KU Leuven), Belgium, and Professor Adjunct, Department of Obstetrics and Gynecology, Yale University, New Haven, USA. Since October 2015, he has been appointed as Vice‐President and Head of Global Medical Affairs Fertility, Merck KGaA, Darmstadt, Germany. His participation in this publication is part of his academic work. Merck KGaA is not involved in the development or marketing of products related to hysteroscopy. Professor D'Hooghe's employment by Merck is not in breach of Cochrane's Commercial Sponsorship Policy (clause 2) as he does not have a real or potential financial interest in the outcome of this review. This matter was referred to Cochrane's Funding Arbiter for advice.
HT has received conference travel assistance from Merck.
FJB has received monetary compensation for the following: member of the external advisory board for Merck Serono and Ferring, the Netherlands; educational activities for Ferring BV, the Netherlands; consultancy work for Gedeon Richter, Belgium; strategic co‐operation with Roche on automated anti‐Müllerian hormone (AMH) assay development; and research co‐operation with Ansh Labs.
SJC: no conflicts of interest.
BWM has received consultancy from ObsEva Geneva, Guerbet, and Merck; payment for review preparation from European Journal of Obstetrics and Gynecology and Reproductive Biology; and travel/accommodation/meeting expenses for various non‐commercial scientific meetings.
Acknowledgements
Cochrane Gynaecology and Fertility Group (CGFG). We wish to thank Professor Cindy Farquhar, CGF Co‐ordinating Editor, Ms Helen Nagels, CGF Managing Editor and Ms Jane Marjoribanks for editorial review. Ms Marian Showell, CGF Information Specialist, assisted in developing several of the search strategies used in the present review. We also thank the referees for their remarks and criticisms during the peer review process. The efforts of all these people combined have increased the validity of the present updated Cochrane Review.
Dr Jenneke Kasius coauthored the protocol for the 'Background' section, assisted in the search for and selection of studies and was involved in data extraction and risk of bias assessment of the first version of this Cochrane review. She has moved from the Department of Reproductive Medicine and Gynecology of the University Medical Center Utrecht to Radboud University Medical Centre Nijmegen, the Netherlands for postgraduate training as a gynaecological oncologist.
Ms Elizabeth Bosselaers (Managing Secretary CEBAM, Cochrane Belgium) for logistical support, language correction and assistance with the plain language summary. Ms Sofie De Wit (Managing Secretary Department of Obstetrics and Gynaecology, Imeldahospital Bonheiden, Belgium) for providing comments and criticisms on the content of the 'Plain language summary' section.
Ms Roos Colman, Biostatistician of the Biostatistics Unit, Campus UZ Gent, De Pintelaan 185, 4K3, Entrance 42, B‐9000 Ghent, Belgium for statistical advice.
Dr Pierandrea De Iaco (Italy), Dr Murali Subbaiah (India), Prof Dr Attilio DiSpiezio Sardo (Italy), Prof Dr Paolo Vercellini (Italy), Dr Mohamed Amer (Egypt) and Dr Moty Pansky (Israel) for answering queries.
Version history
| Published | Title | Stage | Authors | Version |
| 2017 Nov 27 | Anti‐adhesion therapy following operative hysteroscopy for treatment of female subfertility | Review | Jan Bosteels, Steven Weyers, Thomas M D'Hooghe, Helen Torrance, Frank J Broekmans, Su Jen Chua, Ben Willem J Mol | |
| 2015 Nov 09 | Anti‐adhesion therapy following operative hysteroscopy for treatment of female subfertility | Review | Jan Bosteels, Steven Weyers, Jenneke Kasius, Frank J Broekmans, Ben Willem J Mol, Thomas M D'Hooghe | |
| 2014 May 23 | Anti‐adhesion therapy following operative hysteroscopy for treating female subfertility | Protocol | Jan Bosteels, Steven Weyers, Jenneke Kasius, Frank J Broekmans, Ben Willem J Mol, Thomas M D'Hooghe | |
Differences between protocol and review
-
In the protocol, we defined two primary outcomes: live birth (positive outcome) and presence of intrauterine adhesions (IUAs) at second‐look hysteroscopy (adverse outcome). We defined as secondary outcomes the following: clinical pregnancy, miscarriage, mean adhesion scores and severity of adhesions at second‐look hysteroscopy. In the full review, we decided to include only one primary outcome, namely, live birth or ongoing pregnancy ‐ the primary outcome of interest for women with subfertility. Clinical pregnancy, miscarriage, presence of IUAs at second‐look hysteroscopy, mean adhesion scores and severity of adhesions present at second‐look hysteroscopy were defined as secondary outcomes. We made this change on the basis of advice provided by the peer review editorial team in the interest of simplification and readability. We similarly avoided use of the outcome 'incidence of de novo adhesions'; several included studies enrolled participants with existing IUAs, and at second‐look hysteroscopy the distinction between de novo and recurrent adhesions may not be possible and may not be clinically relevant.
-
Term delivery and ongoing pregnancy were used in the review as a surrogate outcome for live birth because the number of studies reporting live birth was very limited. We used sensitivity analyses to study the impact of including only studies reporting live birth versus all studies reporting live birth or a surrogate outcome.
-
The protocol prespecified that data would be extracted simultaneously and independently by two review authors. For practical reasons, data were extracted by at least one pair of review authors: for the previous review. JB extracted data from all studies, and TD/FB/JK/SW divided all studies between them, and each extracted data from only a portion of the included studies. In cases of disagreement, BWM acted as a 'third' review author for arbitration. For the updated version, we used a similar approach for practical reasons. See Potential biases in the review process.
-
We clarified the inclusion criteria to specify that studies in which at least a proportion of women were undergoing operative hysteroscopy for subfertility were eligible.
-
In the review we reported numbers needed to treat for a beneficial effect (NNTB) when there were statistically significant differences between both comparison groups. This was not prespecified in the protocol.
-
In the 2017 update authors updated the Methods sections to current Cochrane standards, and changed the format of Effects of the interventions to improve readability of the review.
Keywords
MeSH
Medical Subject Headings (MeSH) Keywords
- Amnion [transplantation];
- Estrogens [therapeutic use];
- Gels [therapeutic use];
- Hysteroscopy [*adverse effects];
- Infertility, Female [*surgery];
- Intrauterine Devices;
- Live Birth [epidemiology];
- Randomized Controlled Trials as Topic;
- Second‐Look Surgery [statistics & numerical data];
- Tissue Adhesions [epidemiology, etiology, therapy];
- Uterine Diseases [epidemiology, etiology, *therapy];
Medical Subject Headings Check Words
Female; Humans; Pregnancy;
PICO

Study flow diagram: summary of searches since 2015. PICO: population, intervention, comparator, outcome; RCT: randomised controlled trial.

Risk of bias graph: review authors' judgements about each risk of bias item presented as percentages across all included studies.
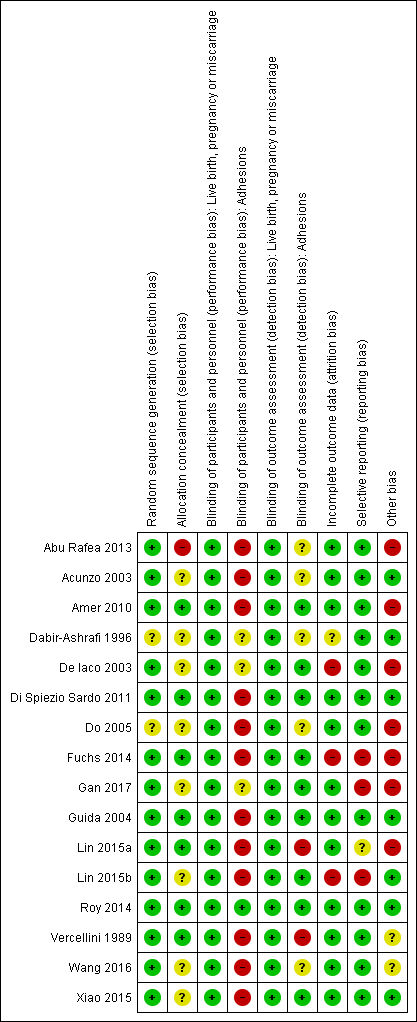
Risk of bias summary: review authors' judgements about each risk of bias item for each included study.
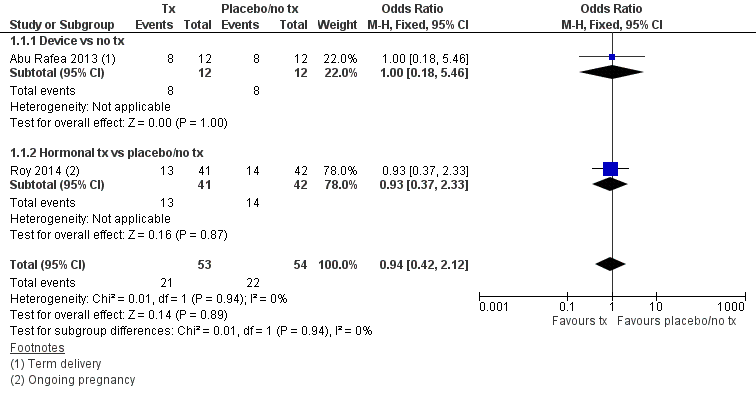
Forest plot of comparison: 1 Anti‐adhesion therapy versus placebo or no treatment (tx) following operative hysteroscopy, outcome: 1.1 Live birth.

Forest plot of comparison: 1 Anti‐adhesion therapy versus placebo or no treatment (tx) following operative hysteroscopy, outcome: 1.4 Presence of intrauterine adhesions at second‐look hysteroscopy.
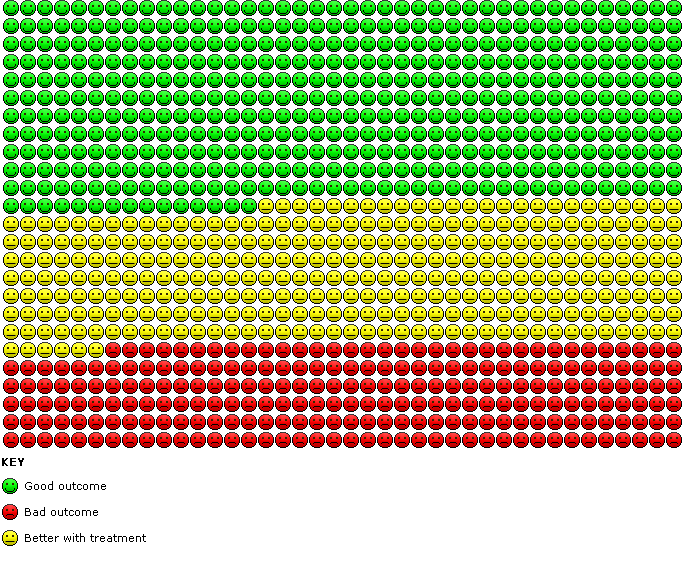
Cates' plot of numbers needed to treat for an additional beneficial outcome (NNTB) for Analysis 1.4 assuming medium risk of 545 women per 1000 with intrauterine adhesions at second‐look hysteroscopy in the control group (no treatment or placebo). Randomly compared to control, the use of device with or without hormonal treatment or hormonal treatment or barrier gels (intervention) decreased the number of women with intrauterine adhesions at second‐look hysteroscopy to 234 women per 1000 (95% confidence interval 153 to 365 women per 1000). Figure drawn using www.nntonline.net.

Comparison 1 Anti‐adhesion therapy versus placebo or no treatment (tx) following operative hysteroscopy, Outcome 1 Live birth.
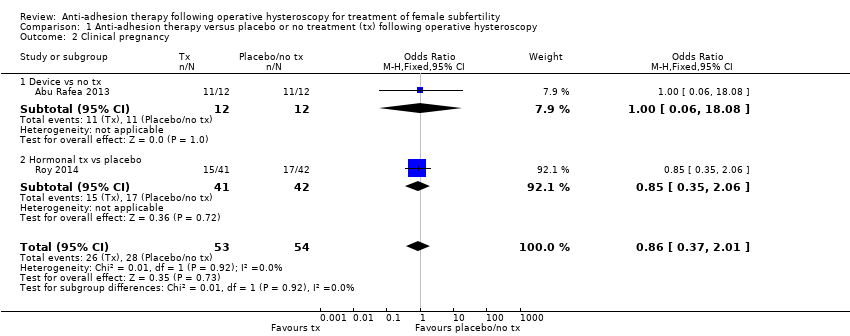
Comparison 1 Anti‐adhesion therapy versus placebo or no treatment (tx) following operative hysteroscopy, Outcome 2 Clinical pregnancy.

Comparison 1 Anti‐adhesion therapy versus placebo or no treatment (tx) following operative hysteroscopy, Outcome 3 Miscarriage.

Comparison 1 Anti‐adhesion therapy versus placebo or no treatment (tx) following operative hysteroscopy, Outcome 4 Presence of intrauterine adhesions at second‐look hysteroscopy.
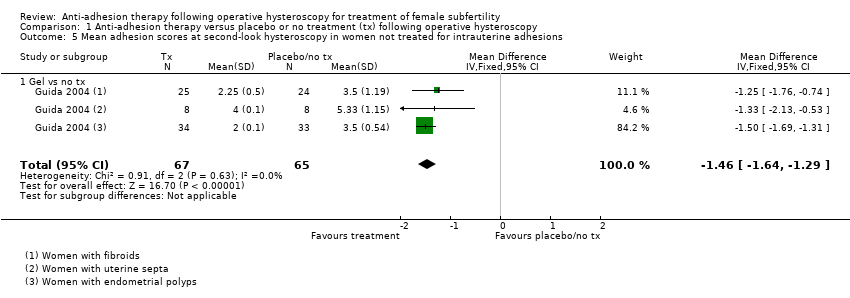
Comparison 1 Anti‐adhesion therapy versus placebo or no treatment (tx) following operative hysteroscopy, Outcome 5 Mean adhesion scores at second‐look hysteroscopy in women not treated for intrauterine adhesions.

Comparison 1 Anti‐adhesion therapy versus placebo or no treatment (tx) following operative hysteroscopy, Outcome 6 Mean adhesion scores at second‐look hysteroscopy in women treated for intrauterine adhesions.
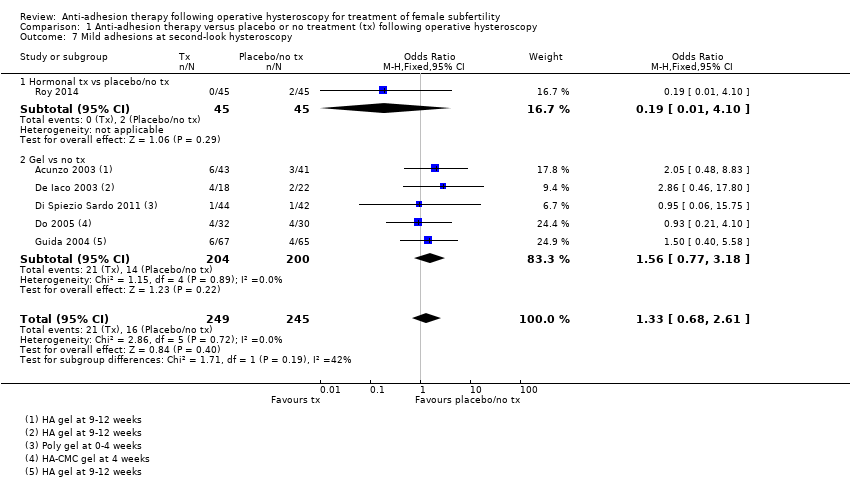
Comparison 1 Anti‐adhesion therapy versus placebo or no treatment (tx) following operative hysteroscopy, Outcome 7 Mild adhesions at second‐look hysteroscopy.
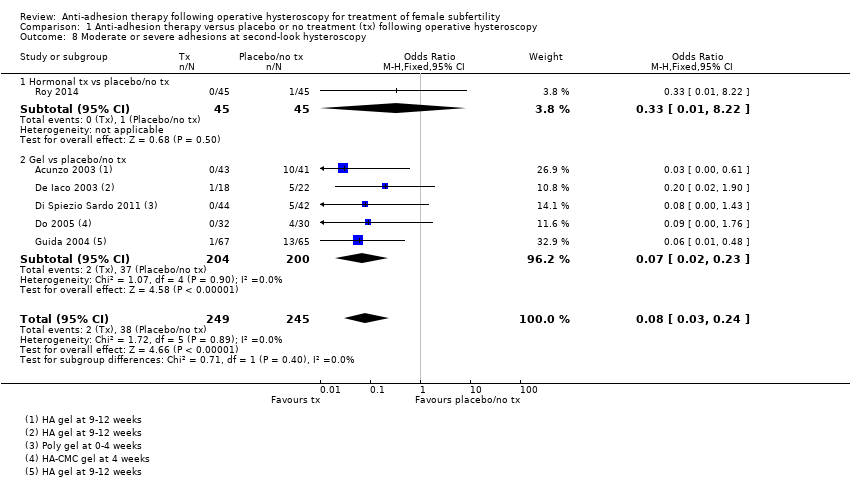
Comparison 1 Anti‐adhesion therapy versus placebo or no treatment (tx) following operative hysteroscopy, Outcome 8 Moderate or severe adhesions at second‐look hysteroscopy.

Comparison 2 Anti‐adhesion therapy A versus anti‐adhesion therapy B following operative hysteroscopy, Outcome 1 Live birth.
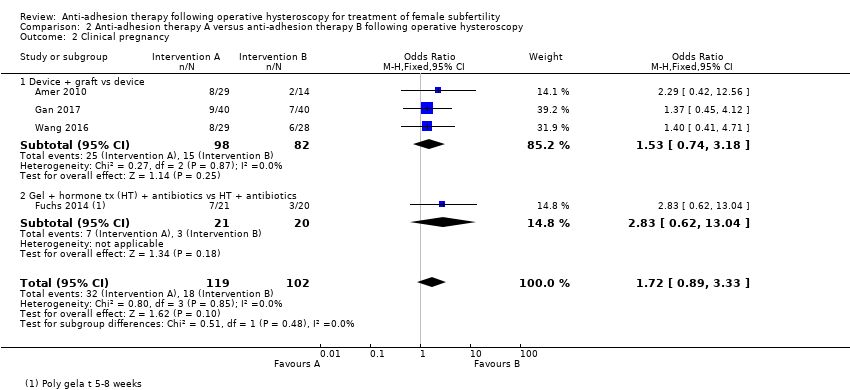
Comparison 2 Anti‐adhesion therapy A versus anti‐adhesion therapy B following operative hysteroscopy, Outcome 2 Clinical pregnancy.

Comparison 2 Anti‐adhesion therapy A versus anti‐adhesion therapy B following operative hysteroscopy, Outcome 3 Miscarriage.

Comparison 2 Anti‐adhesion therapy A versus anti‐adhesion therapy B following operative hysteroscopy, Outcome 4 Presence of intrauterine adhesions at second‐look hysteroscopy.

Comparison 2 Anti‐adhesion therapy A versus anti‐adhesion therapy B following operative hysteroscopy, Outcome 5 Mean adhesion scores in women treated for intrauterine adhesions.
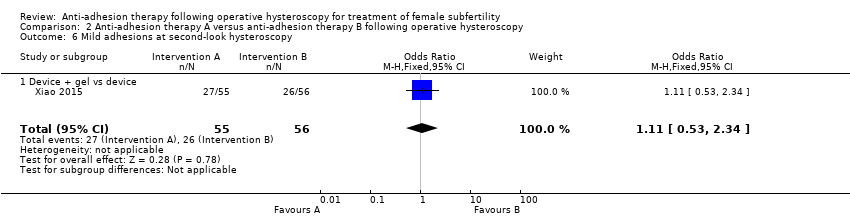
Comparison 2 Anti‐adhesion therapy A versus anti‐adhesion therapy B following operative hysteroscopy, Outcome 6 Mild adhesions at second‐look hysteroscopy.
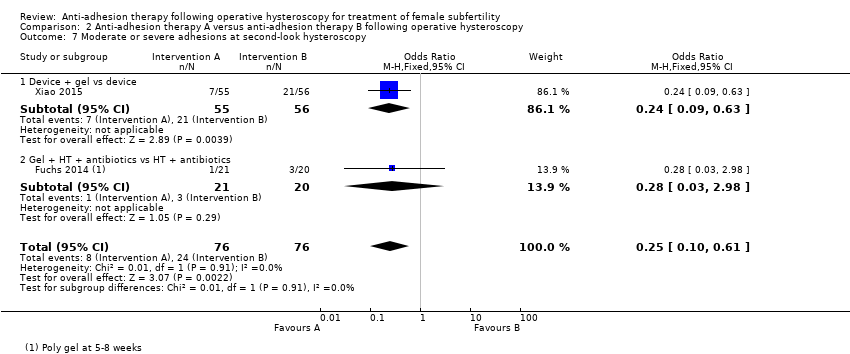
Comparison 2 Anti‐adhesion therapy A versus anti‐adhesion therapy B following operative hysteroscopy, Outcome 7 Moderate or severe adhesions at second‐look hysteroscopy.
| Any anti‐adhesion therapy versus placebo or no treatment following operative hysteroscopy | ||||||
| Patient or population: women treated by operative hysteroscopy for uterine pathology associated with subfertility or adverse pregnancy outcome Settings: single centre, Hysteroscopy Unit or Department of Obstetrics and Gynaecology of a university or non‐university tertiary care hospital Intervention: any anti‐adhesion therapy Comparison: no treatment or placebo | ||||||
| Outcomes | Illustrative comparative risks* (95% CI) | Relative effect | No of participants | Quality of the evidence | Comments | |
| Assumed risk | Corresponding risk | |||||
| No treatment or placebo | Anti‐adhesion therapy | |||||
| Live birth a | No treatment or placebo | Device or hormonal treatment | OR 0.94 (0.42 to 2.12) | 107 | ⊕⊝⊝⊝ | ‐ |
| Mean‐risk populationb | ||||||
| 407 per 1000 | 399 per 1000 | |||||
| Presence of intrauterine adhesions at second‐look hysteroscopy (second‐look hysteroscopy at 4‐12 weeks after operative hysteroscopy) | No treatment or placebo | Device ± hormonal treatment or hormonal treatment or barrier gel | OR 0.35 g (0.21 to 0.60) | 560 (8 RCTs) | ⊕⊕⊝⊝ | ‐ |
| Low‐risk populationf | ||||||
| 0 per 1000 | 0 per 1000 | |||||
| Medium‐risk population f | ||||||
| 545 per 1000 | 234 per 1000 | |||||
| High‐risk population f | ||||||
| 875 per 1000 | 376 per 1000 | |||||
| *The basis for the assumed risk is provided in footnotes. The corresponding risk (and its 95% confidence interval) is based on assumed risk in the comparison group and the relative effect of the intervention (and its 95% CI). | ||||||
| GRADE Working Group grades of evidence. | ||||||
| a The two included studies reported term delivery (Abu Rafea 2013) or ongoing pregnancy (Roy 2014), which we used as a surrogate outcome for live birth. b The assumed risk for the mean‐risk population was the pooled risk of all live births in control groups of the two included studies. c Downgraded one level for serious risk of bias: one study was at high risk of bias in several domains, including allocation concealment. d Downgraded one level for serious imprecision; only 43 events in total. e Downgraded one level for serious indirectness, because only 30% (35/118) of all randomised women in this analysis were subfertile. f The assumed risk for low‐, medium‐ and high‐risk population based on presence of intrauterine adhesions following hysteroscopic removal of endometrial polyps/following removal of submucous fibroids and intrauterine adhesions (mean of both)/removal of uterine septum, respectively, based on findings of a prospective cohort study (Yang 2013). G Two studies reported no events (Lin 2015a; Vercellini 1989). h Downgraded one level for serious risk of bias: all eight studies had several limitations but none was at high risk for selection bias related to random sequence generation or allocation concealment. i Downgraded one level for serious indirectness, because in four of eight studies less than 50% of participants were subfertile and in four of eight studies it was unclear whether subfertile women were included. | ||||||
| Any anti‐adhesion therapy A versus anti‐adhesion therapy B following operative hysteroscopy | ||||||
| Patient or population: women treated by operative hysteroscopy for uterine pathology Settings: multicentric, Hysteroscopy Unit of Department of Obstetrics and Gynaecology of a university, university‐affiliated or non‐university tertiary care hospital Intervention: anti‐adhesion therapy A Comparison: anti‐adhesion therapy B | ||||||
| Outcomes | Illustrative comparative risks* (95% CI) | Relative effect | No of participants | Quality of the evidence | Comments | |
| Assumed risk | Corresponding risk | |||||
| Anti‐adhesion therapy B | Anti‐adhesion therapy A | |||||
| Live birth a | Device | Device + graft | OR 1.48 (0.57 to 3.83) | 180 (3 RCTs) | ⊕⊕⊝⊝ Low c,d | ‐ |
| 98 per 1000 b | 138 per 1000 (60 to 315) | |||||
| Presence of intrauterine adhesions at second‐look hysteroscopy (6‐12 weeks) | Device or hormonal treatment with antibiotics | Device ± graft/gel or gel + hormonal treatment + and antibiotics | OR 0.55 (0.36 to 0.83) | 451 (5 RCTs) | ⊕⊕⊝⊝ | ‐ |
| Low‐risk population e | ||||||
| 0 per 1000 | 0 per 1000 | |||||
| Medium‐risk population e | ||||||
| 545 per 1000 | 403 per 1000 | |||||
| High‐risk population e | ||||||
| 875 per 1000 | 647 per 1000 | |||||
| *The basis for the assumed risk is provided in the footnotes. The corresponding risk (and its 95% confidence interval) is based on the assumed risk in the comparison group and the relative effect of the intervention (and its 95% CI). | ||||||
| GRADE Working Group grades of evidence. | ||||||
| a The three included studies reported term delivery (Wang 2016) or ongoing pregnancy (Amer 2010; Gan 2017; Wang 2016), which we used as a surrogate outcome for live birth. b The assumed risk for the average‐risk population is the pooled risk of all the live births in the control groups of the three included studies. c Downgraded one level for serious risk of bias: despite several limitations none of the studies was at high risk for selection bias related to random sequence generation or allocation concealment. d Downgraded one level for serious imprecision‐ only 21 events in total. e The assumed risk for low/medium/high‐risk population is based on the presence of intrauterine adhesions following hysteroscopic removal of endometrial polyps/following removal of submucous fibroids and IUAs (mean of both)/removal of uterine septum, respectively, based on findings of a prospective cohort study (Yang 2013). f Downgraded one level for serious risk of bias: despite several limitations none of the studies was at high risk for selection bias related to random sequence generation or allocation concealment. g Downgraded one level for serious indirectness because, in two of five studies, less than 50% of participants were subfertile; in one of five studies, it was unclear if subfertile women were included and in two of five studies, the proportion of infertile women was not reported. | ||||||
| Outcome | Balloon group (intervention: n = 82) | IUD group (control: n = 80) | P value |
| AFS score before surgery (median, 95% CI) | 8 (5 to 12) | 8 (5 to 12) | 1.00 |
| Median reduction in AFS score | 7 (2 to 12) | 7 (0 to 12) | 1.00 |
| IUD: intrauterine device; n: number of participants. | |||
| Statistic | Fresh amnion graft (group 2: n = 14) | Dried amnion graft (group 3: n = 15) | No amnion graft (group 1: n = 14) | P value |
| Median | 1.5 | 2 | 2 | ‐ |
| IQR | 1 to 2 | 1 to 2 | 1 to 2 | 0.27 |
| IQR: interquartile range; n: number of participants. | ||||
| Statistic | Amnion graft (intervention: n = 40) | No graft (control: n = 40) | P value |
| Median | 2 | 4 | ‐ |
| IQR | 2 to 5 | 2 to 6 | 0.03 |
| IQR: interquartile range; n: number of participants. | |||
| Outcome or subgroup title | No. of studies | No. of participants | Statistical method | Effect size |
| 1 Live birth Show forest plot | 2 | 107 | Odds Ratio (M‐H, Fixed, 95% CI) | 0.94 [0.42, 2.12] |
| 1.1 Device vs no tx | 1 | 24 | Odds Ratio (M‐H, Fixed, 95% CI) | 1.0 [0.18, 5.46] |
| 1.2 Hormonal tx vs placebo/no tx | 1 | 83 | Odds Ratio (M‐H, Fixed, 95% CI) | 0.93 [0.37, 2.33] |
| 2 Clinical pregnancy Show forest plot | 2 | 107 | Odds Ratio (M‐H, Fixed, 95% CI) | 0.86 [0.37, 2.01] |
| 2.1 Device vs no tx | 1 | 24 | Odds Ratio (M‐H, Fixed, 95% CI) | 1.0 [0.06, 18.08] |
| 2.2 Hormonal tx vs placebo | 1 | 83 | Odds Ratio (M‐H, Fixed, 95% CI) | 0.85 [0.35, 2.06] |
| 3 Miscarriage Show forest plot | 2 | 54 | Odds Ratio (M‐H, Fixed, 95% CI) | 0.68 [0.18, 2.57] |
| 3.1 Device vs no tx | 1 | 22 | Odds Ratio (M‐H, Fixed, 95% CI) | 0.66 [0.11, 4.00] |
| 3.2 Hormonal tx vs placebo | 1 | 32 | Odds Ratio (M‐H, Fixed, 95% CI) | 0.72 [0.10, 5.01] |
| 4 Presence of intrauterine adhesions at second‐look hysteroscopy Show forest plot | 8 | 560 | Odds Ratio (M‐H, Fixed, 95% CI) | 0.35 [0.21, 0.60] |
| 4.1 Device vs no tx | 1 | 60 | Odds Ratio (M‐H, Fixed, 95% CI) | 0.0 [0.0, 0.0] |
| 4.2 Device + hormonal tx vs placebo/no tx | 1 | 11 | Odds Ratio (M‐H, Fixed, 95% CI) | 0.0 [0.0, 0.0] |
| 4.3 Hormonal tx vs placebo | 1 | 85 | Odds Ratio (M‐H, Fixed, 95% CI) | 0.14 [0.01, 2.72] |
| 4.4 Gel vs no tx | 5 | 404 | Odds Ratio (M‐H, Fixed, 95% CI) | 0.37 [0.21, 0.64] |
| 5 Mean adhesion scores at second‐look hysteroscopy in women not treated for intrauterine adhesions Show forest plot | 1 | 132 | Mean Difference (IV, Fixed, 95% CI) | ‐1.46 [‐1.64, ‐1.29] |
| 5.1 Gel vs no tx | 1 | 132 | Mean Difference (IV, Fixed, 95% CI) | ‐1.46 [‐1.64, ‐1.29] |
| 6 Mean adhesion scores at second‐look hysteroscopy in women treated for intrauterine adhesions Show forest plot | 1 | 84 | Mean Difference (IV, Fixed, 95% CI) | ‐3.3 [‐3.37, ‐3.23] |
| 6.1 Gel vs no tx | 1 | 84 | Mean Difference (IV, Fixed, 95% CI) | ‐3.3 [‐3.37, ‐3.23] |
| 7 Mild adhesions at second‐look hysteroscopy Show forest plot | 6 | 494 | Odds Ratio (M‐H, Fixed, 95% CI) | 1.33 [0.68, 2.61] |
| 7.1 Hormonal tx vs placebo/no tx | 1 | 90 | Odds Ratio (M‐H, Fixed, 95% CI) | 0.19 [0.01, 4.10] |
| 7.2 Gel vs no tx | 5 | 404 | Odds Ratio (M‐H, Fixed, 95% CI) | 1.56 [0.77, 3.18] |
| 8 Moderate or severe adhesions at second‐look hysteroscopy Show forest plot | 6 | 494 | Odds Ratio (M‐H, Fixed, 95% CI) | 0.08 [0.03, 0.24] |
| 8.1 Hormonal tx vs placebo/no tx | 1 | 90 | Odds Ratio (M‐H, Fixed, 95% CI) | 0.33 [0.01, 8.22] |
| 8.2 Gel vs placebo/no tx | 5 | 404 | Odds Ratio (M‐H, Fixed, 95% CI) | 0.07 [0.02, 0.23] |
| Outcome or subgroup title | No. of studies | No. of participants | Statistical method | Effect size |
| 1 Live birth Show forest plot | 3 | 180 | Odds Ratio (M‐H, Fixed, 95% CI) | 1.48 [0.57, 3.83] |
| 1.1 Device + graft vs device | 3 | 180 | Odds Ratio (M‐H, Fixed, 95% CI) | 1.48 [0.57, 3.83] |
| 2 Clinical pregnancy Show forest plot | 4 | 221 | Odds Ratio (M‐H, Fixed, 95% CI) | 1.72 [0.89, 3.33] |
| 2.1 Device + graft vs device | 3 | 180 | Odds Ratio (M‐H, Fixed, 95% CI) | 1.53 [0.74, 3.18] |
| 2.2 Gel + hormone tx (HT) + antibiotics vs HT + antibiotics | 1 | 41 | Odds Ratio (M‐H, Fixed, 95% CI) | 2.83 [0.62, 13.04] |
| 3 Miscarriage Show forest plot | 3 | 40 | Odds Ratio (M‐H, Fixed, 95% CI) | 0.80 [0.20, 3.19] |
| 3.1 Device + graft vs device | 3 | 40 | Odds Ratio (M‐H, Fixed, 95% CI) | 0.80 [0.20, 3.19] |
| 4 Presence of intrauterine adhesions at second‐look hysteroscopy Show forest plot | 5 | 451 | Odds Ratio (M‐H, Fixed, 95% CI) | 0.55 [0.36, 0.83] |
| 4.1 Device vs device | 1 | 162 | Odds Ratio (M‐H, Fixed, 95% CI) | 0.81 [0.42, 1.57] |
| 4.2 Device + graft vs device | 2 | 137 | Odds Ratio (M‐H, Fixed, 95% CI) | 0.53 [0.25, 1.10] |
| 4.3 Device + gel vs device | 1 | 111 | Odds Ratio (M‐H, Fixed, 95% CI) | 0.31 [0.13, 0.76] |
| 4.4 Gel + HT + antibiotics vs HT + antibiotics | 1 | 41 | Odds Ratio (M‐H, Fixed, 95% CI) | 0.28 [0.03, 2.98] |
| 5 Mean adhesion scores in women treated for intrauterine adhesions Show forest plot | 3 | Mean Difference (IV, Random, 95% CI) | Subtotals only | |
| 5.1 Device vs device | 1 | 162 | Mean Difference (IV, Random, 95% CI) | 0.0 [‐0.68, 0.68] |
| 5.2 Device + graft vs device | 1 | 57 | Mean Difference (IV, Random, 95% CI) | ‐3.10 [‐4.17, ‐2.03] |
| 5.3 Device + gel vs device | 1 | 111 | Mean Difference (IV, Random, 95% CI) | ‐1.6 [‐2.32, ‐0.88] |
| 6 Mild adhesions at second‐look hysteroscopy Show forest plot | 1 | 111 | Odds Ratio (M‐H, Fixed, 95% CI) | 1.11 [0.53, 2.34] |
| 6.1 Device + gel vs device | 1 | 111 | Odds Ratio (M‐H, Fixed, 95% CI) | 1.11 [0.53, 2.34] |
| 7 Moderate or severe adhesions at second‐look hysteroscopy Show forest plot | 2 | 152 | Odds Ratio (M‐H, Fixed, 95% CI) | 0.25 [0.10, 0.61] |
| 7.1 Device + gel vs device | 1 | 111 | Odds Ratio (M‐H, Fixed, 95% CI) | 0.24 [0.09, 0.63] |
| 7.2 Gel + HT + antibiotics vs HT + antibiotics | 1 | 41 | Odds Ratio (M‐H, Fixed, 95% CI) | 0.28 [0.03, 2.98] |