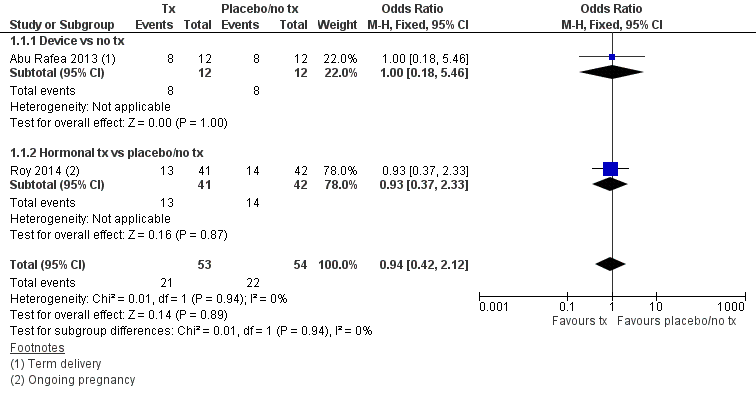
| 1 Live birth Show forest plot | 2 | 107 | Odds Ratio (M‐H, Fixed, 95% CI) | 0.94 [0.42, 2.12] |
|
| 1.1 Device vs no tx | 1 | 24 | Odds Ratio (M‐H, Fixed, 95% CI) | 1.0 [0.18, 5.46] |
| 1.2 Hormonal tx vs placebo/no tx | 1 | 83 | Odds Ratio (M‐H, Fixed, 95% CI) | 0.93 [0.37, 2.33] |
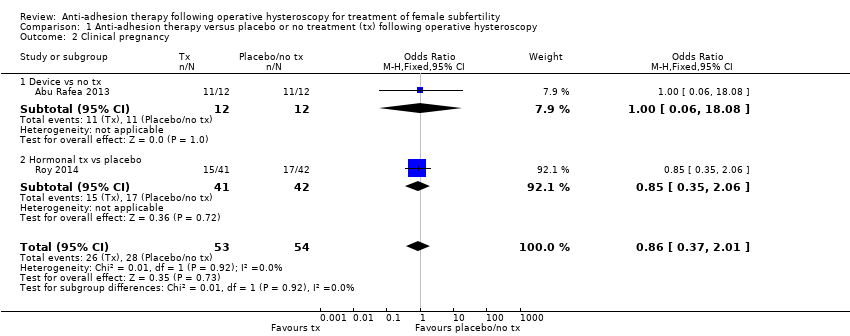
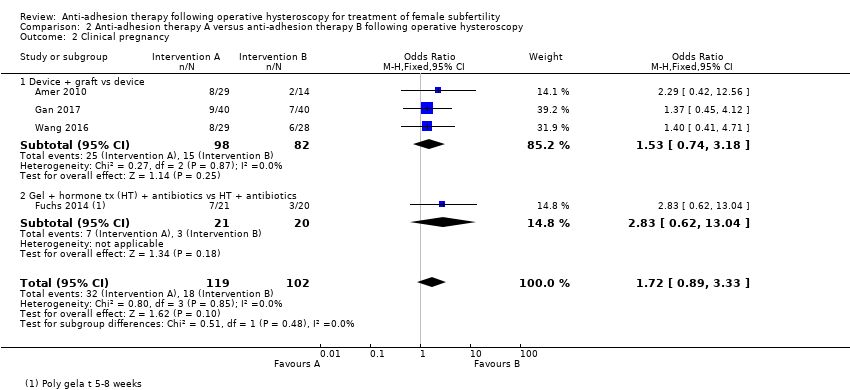
| 2 Clinical pregnancy Show forest plot | 2 | 107 | Odds Ratio (M‐H, Fixed, 95% CI) | 0.86 [0.37, 2.01] |
|
| 2.1 Device vs no tx | 1 | 24 | Odds Ratio (M‐H, Fixed, 95% CI) | 1.0 [0.06, 18.08] |
| 2.2 Hormonal tx vs placebo | 1 | 83 | Odds Ratio (M‐H, Fixed, 95% CI) | 0.85 [0.35, 2.06] |
| 3 Miscarriage Show forest plot | 2 | 54 | Odds Ratio (M‐H, Fixed, 95% CI) | 0.68 [0.18, 2.57] |
|
| 3.1 Device vs no tx | 1 | 22 | Odds Ratio (M‐H, Fixed, 95% CI) | 0.66 [0.11, 4.00] |
| 3.2 Hormonal tx vs placebo | 1 | 32 | Odds Ratio (M‐H, Fixed, 95% CI) | 0.72 [0.10, 5.01] |
| 4 Presence of intrauterine adhesions at second‐look hysteroscopy Show forest plot | 8 | 560 | Odds Ratio (M‐H, Fixed, 95% CI) | 0.35 [0.21, 0.60] |
|
| 4.1 Device vs no tx | 1 | 60 | Odds Ratio (M‐H, Fixed, 95% CI) | 0.0 [0.0, 0.0] |
| 4.2 Device + hormonal tx vs placebo/no tx | 1 | 11 | Odds Ratio (M‐H, Fixed, 95% CI) | 0.0 [0.0, 0.0] |
| 4.3 Hormonal tx vs placebo | 1 | 85 | Odds Ratio (M‐H, Fixed, 95% CI) | 0.14 [0.01, 2.72] |
| 4.4 Gel vs no tx | 5 | 404 | Odds Ratio (M‐H, Fixed, 95% CI) | 0.37 [0.21, 0.64] |
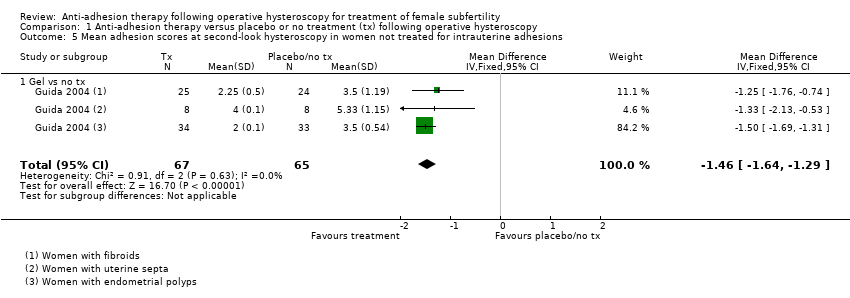
| 5 Mean adhesion scores at second‐look hysteroscopy in women not treated for intrauterine adhesions Show forest plot | 1 | 132 | Mean Difference (IV, Fixed, 95% CI) | ‐1.46 [‐1.64, ‐1.29] |
|
| 5.1 Gel vs no tx | 1 | 132 | Mean Difference (IV, Fixed, 95% CI) | ‐1.46 [‐1.64, ‐1.29] |
| 6 Mean adhesion scores at second‐look hysteroscopy in women treated for intrauterine adhesions Show forest plot | 1 | 84 | Mean Difference (IV, Fixed, 95% CI) | ‐3.3 [‐3.37, ‐3.23] |
|
| 6.1 Gel vs no tx | 1 | 84 | Mean Difference (IV, Fixed, 95% CI) | ‐3.3 [‐3.37, ‐3.23] |
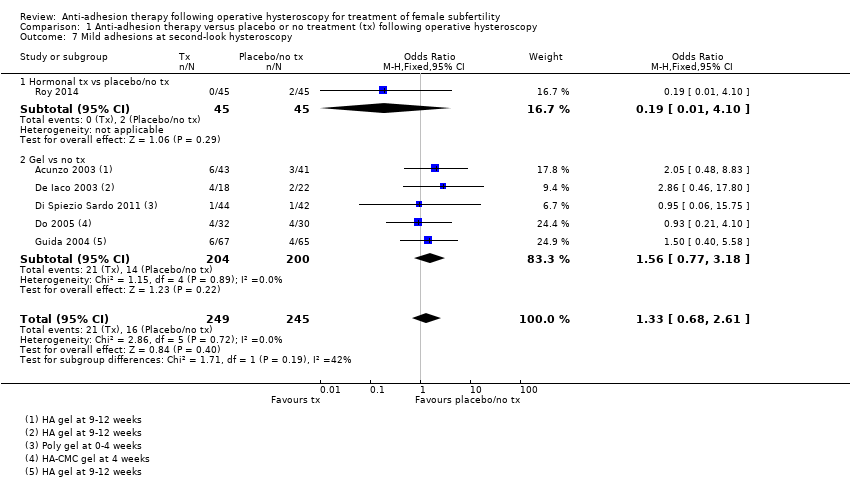
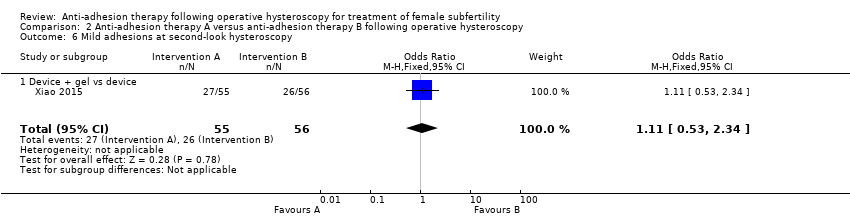
| 7 Mild adhesions at second‐look hysteroscopy Show forest plot | 6 | 494 | Odds Ratio (M‐H, Fixed, 95% CI) | 1.33 [0.68, 2.61] |
|
| 7.1 Hormonal tx vs placebo/no tx | 1 | 90 | Odds Ratio (M‐H, Fixed, 95% CI) | 0.19 [0.01, 4.10] |
| 7.2 Gel vs no tx | 5 | 404 | Odds Ratio (M‐H, Fixed, 95% CI) | 1.56 [0.77, 3.18] |
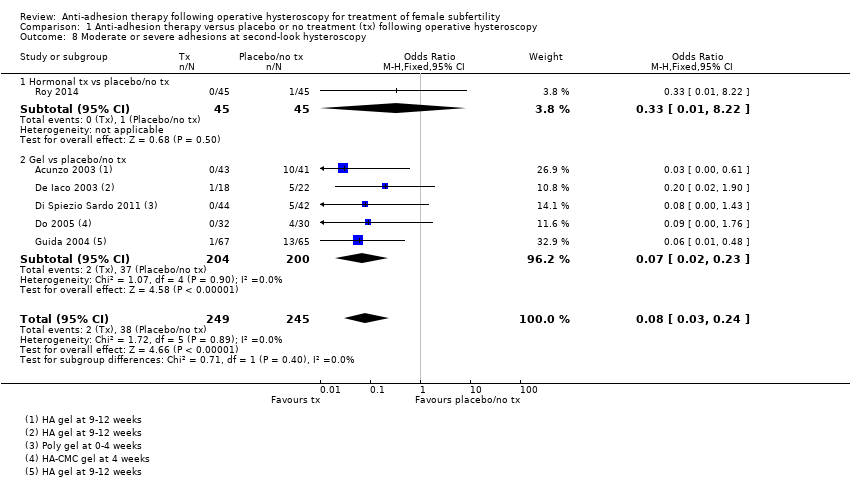
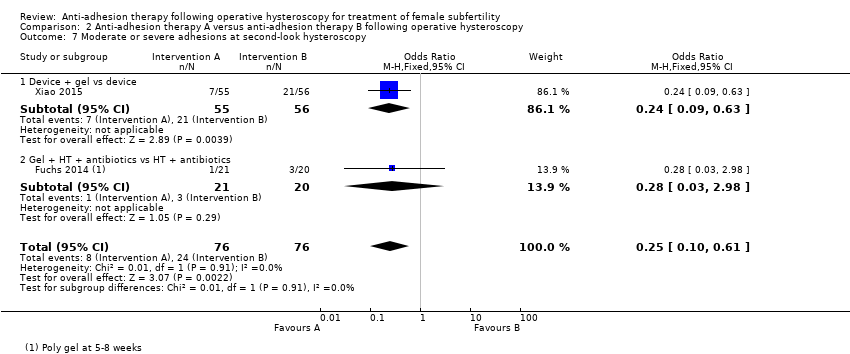
| 8 Moderate or severe adhesions at second‐look hysteroscopy Show forest plot | 6 | 494 | Odds Ratio (M‐H, Fixed, 95% CI) | 0.08 [0.03, 0.24] |
|
| 8.1 Hormonal tx vs placebo/no tx | 1 | 90 | Odds Ratio (M‐H, Fixed, 95% CI) | 0.33 [0.01, 8.22] |
| 8.2 Gel vs placebo/no tx | 5 | 404 | Odds Ratio (M‐H, Fixed, 95% CI) | 0.07 [0.02, 0.23] |