Prevención secundaria de la tromboembolia venosa recurrente después del tratamiento de anticoagulación oral inicial en pacientes con tromboembolia venosa sin causa aparente
Información
- DOI:
- https://doi.org/10.1002/14651858.CD011088.pub2Copiar DOI

- Base de datos:
-
- Cochrane Database of Systematic Reviews
- Versión publicada:
-
- 15 diciembre 2017see what's new
- Tipo:
-
- Intervention
- Etapa:
-
- Review
- Grupo Editorial Cochrane:
-
Grupo Cochrane de Vascular
- Copyright:
-
- Copyright © 2017 The Cochrane Collaboration. Published by John Wiley & Sons, Ltd.
Cifras del artículo
Altmetric:
Citado por:
Autores
Contributions of authors
LR: selected and assessed the quality of trials for inclusion in this update, extracted and entered data for analyses, and wrote the text of the review.
SEY: selected and assessed the quality of trials for inclusion in this update, and extracted and entered data for analyses.
AR: selected and assessed the quality of trials for inclusion in this update.
Sources of support
Internal sources
-
No sources of support supplied
External sources
-
Chief Scientist Office, Scottish Government Health Directorates, The Scottish Government, UK.
The Cochrane Vascular editorial base is supported by the Chief Scientist Office.
-
National Institute for Health Research (NIHR), UK.
This project was supported by the NIHR, via Cochrane Programme Grant funding to Cochrane Vascular (13/89/23). The views and opinions expressed therein are those of the review authors and do not necessarily reflect those of the Systematic Reviews Programme, NIHR, NHS, or the Department of Health.
Declarations of interest
LR: none known.
SEY: none known.
AR: none known.
Acknowledgements
We would like to thank Dorit Blickstein, Noa Eliakim‐Raz, and Anat Gafter‐Gvili, who wrote the protocol.
We would like to thank Dr Patrick Kesteven for assistance and advice provided. We would like to thank Dr K Welch for searching the Cochrane Vascular Specialised Register and the Cochrane Central Register of Controlled Trials (CENTRAL) in the Cochrane Library (www.thecochranelibrary.com). We would also like to thank Dr M Stewart, Managing Editor of Cochrane Vascular, for assistance and advice in completing this review.
Version history
| Published | Title | Stage | Authors | Version |
| 2017 Dec 15 | Secondary prevention of recurrent venous thromboembolism after initial oral anticoagulation therapy in patients with unprovoked venous thromboembolism | Review | Lindsay Robertson, Su Ern Yeoh, Ahmad Ramli | |
| 2014 Apr 28 | Secondary prevention of recurrent venous thromboembolism after initial oral anticoagulation therapy in patients with unprovoked venous thromboembolism | Protocol | Dorit Blickstein, Noa Eliakim‐Raz, Anat Gafter‐Gvili | |
Differences between protocol and review
We have incorporated a 'Summary of findings' table to adhere to current Cochane standards.
We performed a post hoc sensitivity analysis to investigate effects of the type of baseline VTE when we identified heterogeneity.
We amended the bleeding outcome 'all bleeding events' to 'clinically relevant non‐major bleeding' for standardisation of bleeding reporting purposes.
We presented odds ratios rather than risk ratios for consistency with other reviews on this topic.
Keywords
MeSH
Medical Subject Headings (MeSH) Keywords
- *Secondary Prevention;
- Administration, Oral;
- Anticoagulants [*administration & dosage, adverse effects];
- Aspirin [administration & dosage, adverse effects];
- Hemorrhage [chemically induced];
- Myocardial Infarction [epidemiology];
- Randomized Controlled Trials as Topic;
- Recurrence;
- Rivaroxaban [administration & dosage, adverse effects];
- Stroke [epidemiology];
- Venous Thromboembolism [drug therapy, mortality, *prevention & control];
- Warfarin [administration & dosage, adverse effects];
Medical Subject Headings Check Words
Humans;
PICO
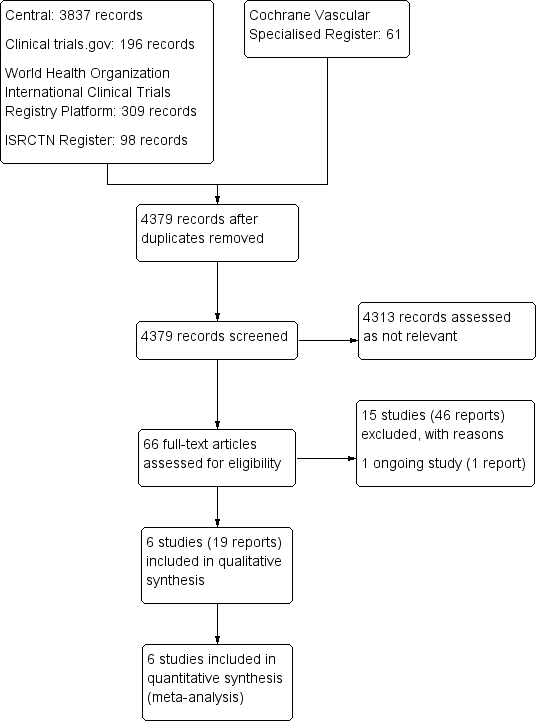
Study flow diagram.

Risk of bias graph: review authors' judgements about each risk of bias item presented as percentages across all included studies.

Risk of bias summary: review authors' judgements about each risk of bias item for each included study.

Comparison 1 Extended VTE prophylaxis versus placebo, Outcome 1 VTE‐related mortality.

Comparison 1 Extended VTE prophylaxis versus placebo, Outcome 2 Recurrent VTE.

Comparison 1 Extended VTE prophylaxis versus placebo, Outcome 3 Major bleeding.

Comparison 1 Extended VTE prophylaxis versus placebo, Outcome 4 All‐cause mortality.

Comparison 1 Extended VTE prophylaxis versus placebo, Outcome 5 Clinically relevant non‐major bleeding.

Comparison 1 Extended VTE prophylaxis versus placebo, Outcome 6 Stroke.
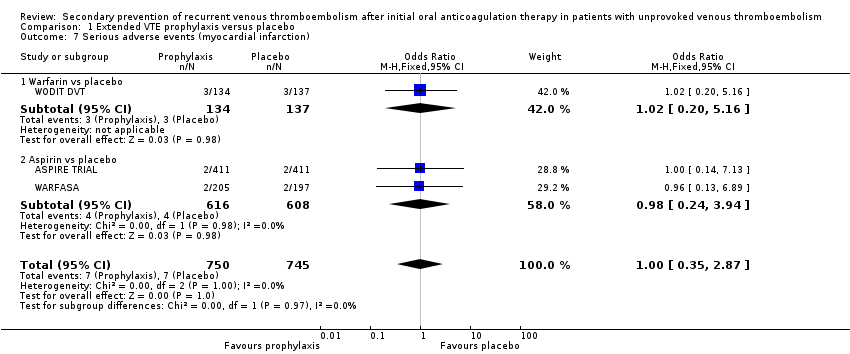
Comparison 1 Extended VTE prophylaxis versus placebo, Outcome 7 Serious adverse events (myocardial infarction).

Comparison 2 Extended VTE prophylaxis versus another extended VTE prophylaxis, Outcome 1 Recurrent VTE.
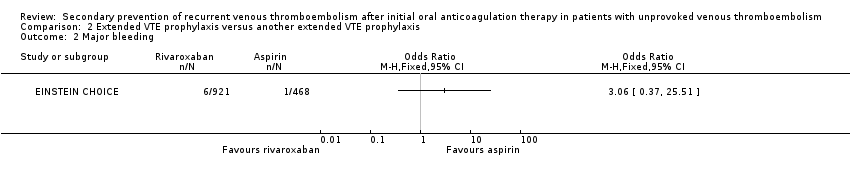
Comparison 2 Extended VTE prophylaxis versus another extended VTE prophylaxis, Outcome 2 Major bleeding.
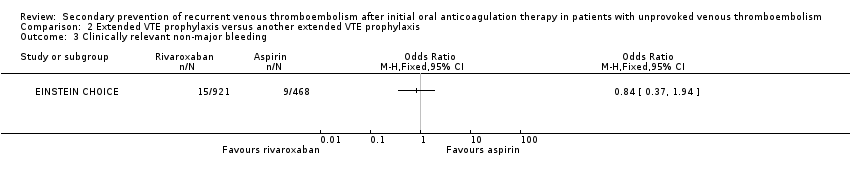
Comparison 2 Extended VTE prophylaxis versus another extended VTE prophylaxis, Outcome 3 Clinically relevant non‐major bleeding.
| Extended prophylaxis compared to placebo in patients with unprovoked venous thromboembolism | ||||||
| Patient or population: patients with unprovoked venous thromboembolism | ||||||
| Outcomes | Anticipated absolute effects* (95% CI) | Relative effect | No. of participants | Quality of the evidence | Comments | |
| Risk with placebo | Risk with extended prophylaxis | |||||
| VTE‐related mortalitya | Study population | OR 0.98 | 1862 | ⊕⊕⊝⊝ | Two of the four studies reported no cases of VTE‐related mortality. | |
| 2 per 1000 | 2 per 1000 | |||||
| Recurrent VTEc | Study population | OR 0.63 | 2043 | ⊕⊕⊕⊝ | ||
| 170 per 1000 | 114 per 1000 | |||||
| Major bleedinge | Study population | OR 1.84 | 2043 | ⊕⊕⊝⊝ | ||
| 11 per 1000 | 20 per 1000 | |||||
| All‐cause mortalityg | Study population | OR 1.00 | 2043 | ⊕⊕⊕⊝ | ||
| 38 per 1000 | 38 per 1000 | |||||
| Clinically relevant non‐major bleedingh | Study population | OR 1.78 | 1672 | ⊕⊕⊝⊝ | Two of the four studies reported no cases of clinically relevant non‐major bleeding. | |
| 6 per 1000 | 11 per 1000 | |||||
| Strokei | Study population | OR 1.15 | 1224 | ⊕⊕⊕⊝ | ||
| 10 per 1000 | 11 per 1000 | |||||
| Myocardial infarction | Study population | OR 1.00 | 1495 | ⊕⊕⊕⊝ | ||
| 9 per 1000 | 9 per 1000 | |||||
| *The risk in the intervention group (and its 95% confidence interval) is based on the assumed risk in the comparison group and the relative effect of the intervention (and its 95% CI). | ||||||
| GRADE Working Group grades of evidence. | ||||||
| aVTE‐related mortality ‐ death due to fatal PE. | ||||||
| VTE extended prophylaxis compared to another VTE extended prophylaxis in patients with unprovoked venous thromboembolism | ||||||
| Patient or population: patients with unprovoked venous thromboembolism | ||||||
| Outcomes | Anticipated absolute effects* (95% CI) | Relative effect | No. of participants | Quality of the evidence | Comments | |
| Risk with aspirin | Risk with rivaroxaban | |||||
| VTE‐related mortalitya | See comments. | See comments. | See comments. | See comments. | Data on VTE‐related mortality are yet available for participants with unprovoked VTE. | |
| Recurrent VTEb | Study population | OR 0.28 | 1389 | ⊕⊕⊕⊝ | ||
| 56 per 1000 | 16 per 1000 | |||||
| Major bleedingd | Study population | OR 3.06 | 1389 | ⊕⊕⊕⊝ | ||
| 2 per 1000 | 7 per 1000 | |||||
| All‐cause mortalitye | See comments. | See comments. | See comments. | See comments. | Data on all‐cause mortality are not yet available for participants with unprovoked VTE. | |
| Clinically relevant non‐major bleedingf | 19 per 1000 | 16 per 1000 (7 to 37) | OR 0.84 (0.37 to 1.94) | 1389 | ⊕⊕⊕⊝ | |
| Strokeg | See comments. | See comments. | See comments. | See comments. | Data on stroke are not yet available for participants with unprovoked VTE. | |
| Myocardial infarction | See comments. | See comments. | See comments. | See comments. | Data on myocardial infarction are not yet available for participants with unprovoked VTE. | |
| *The risk in the intervention group (and its 95% confidence interval) is based on the assumed risk in the comparison group and the relative effect of the intervention (and its 95% CI). | ||||||
| GRADE Working Group grades of evidence. | ||||||
| aVTE‐related mortality ‐ death due to fatal PE. | ||||||
| Outcome or subgroup title | No. of studies | No. of participants | Statistical method | Effect size |
| 1 VTE‐related mortality Show forest plot | 4 | 1862 | Odds Ratio (M‐H, Fixed, 95% CI) | 0.98 [0.14, 6.98] |
| 1.1 Warfarin vs placebo | 2 | 638 | Odds Ratio (M‐H, Fixed, 95% CI) | 0.0 [0.0, 0.0] |
| 1.2 Aspirin vs placebo | 2 | 1224 | Odds Ratio (M‐H, Fixed, 95% CI) | 0.98 [0.14, 6.98] |
| 2 Recurrent VTE Show forest plot | 5 | 2043 | Odds Ratio (M‐H, Random, 95% CI) | 0.63 [0.38, 1.03] |
| 2.1 Warfarin vs placebo | 3 | 819 | Odds Ratio (M‐H, Random, 95% CI) | 0.52 [0.15, 1.80] |
| 2.2 Aspirin vs placebo | 2 | 1224 | Odds Ratio (M‐H, Random, 95% CI) | 0.68 [0.50, 0.92] |
| 3 Major bleeding Show forest plot | 5 | 2043 | Odds Ratio (M‐H, Fixed, 95% CI) | 1.84 [0.87, 3.85] |
| 3.1 Warfarin vs placebo | 3 | 819 | Odds Ratio (M‐H, Fixed, 95% CI) | 2.81 [0.89, 8.92] |
| 3.2 Aspirin vs placebo | 2 | 1224 | Odds Ratio (M‐H, Fixed, 95% CI) | 1.28 [0.47, 3.47] |
| 4 All‐cause mortality Show forest plot | 5 | 2043 | Odds Ratio (M‐H, Fixed, 95% CI) | 1.00 [0.63, 1.57] |
| 4.1 Warfarin vs placebo | 3 | 819 | Odds Ratio (M‐H, Fixed, 95% CI) | 1.07 [0.53, 2.17] |
| 4.2 Aspirin vs placebo | 2 | 1224 | Odds Ratio (M‐H, Fixed, 95% CI) | 0.95 [0.52, 1.72] |
| 5 Clinically relevant non‐major bleeding Show forest plot | 4 | 1672 | Odds Ratio (M‐H, Fixed, 95% CI) | 1.78 [0.59, 5.33] |
| 5.1 Warfarin vs placebo | 2 | 448 | Odds Ratio (M‐H, Fixed, 95% CI) | 0.0 [0.0, 0.0] |
| 5.2 Aspirin vs placebo | 2 | 1224 | Odds Ratio (M‐H, Fixed, 95% CI) | 1.78 [0.59, 5.33] |
| 6 Stroke Show forest plot | 2 | 1224 | Odds Ratio (M‐H, Fixed, 95% CI) | 1.15 [0.39, 3.46] |
| 6.1 Aspirin vs placebo | 2 | 1224 | Odds Ratio (M‐H, Fixed, 95% CI) | 1.15 [0.39, 3.46] |
| 7 Serious adverse events (myocardial infarction) Show forest plot | 3 | 1495 | Odds Ratio (M‐H, Fixed, 95% CI) | 1.00 [0.35, 2.87] |
| 7.1 Warfarin vs placebo | 1 | 271 | Odds Ratio (M‐H, Fixed, 95% CI) | 1.02 [0.20, 5.16] |
| 7.2 Aspirin vs placebo | 2 | 1224 | Odds Ratio (M‐H, Fixed, 95% CI) | 0.98 [0.24, 3.94] |
| Outcome or subgroup title | No. of studies | No. of participants | Statistical method | Effect size |
| 1 Recurrent VTE Show forest plot | 1 | Odds Ratio (M‐H, Fixed, 95% CI) | Totals not selected | |
| 2 Major bleeding Show forest plot | 1 | Odds Ratio (M‐H, Fixed, 95% CI) | Totals not selected | |
| 3 Clinically relevant non‐major bleeding Show forest plot | 1 | Odds Ratio (M‐H, Fixed, 95% CI) | Totals not selected | |