Scolaris Content Display Scolaris Content Display

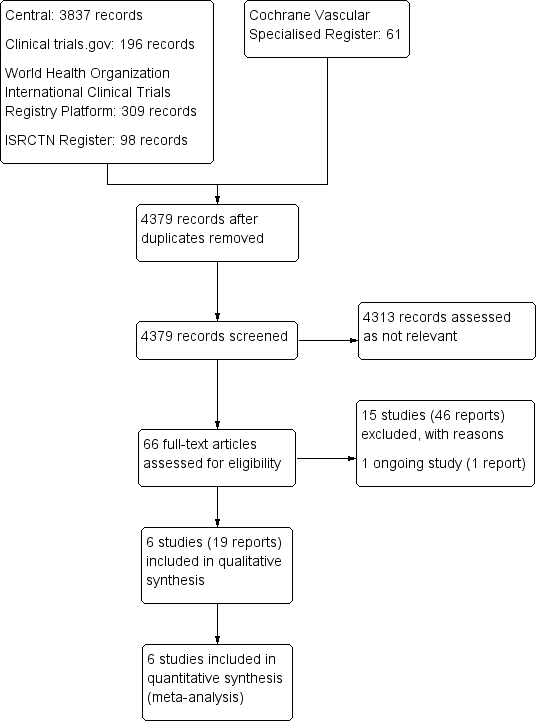
Study flow diagram.
Figuras y tablas -
Figure 1

Study flow diagram.

Risk of bias graph: review authors' judgements about each risk of bias item presented as percentages across all included studies.
Figuras y tablas -
Figure 2

Risk of bias graph: review authors' judgements about each risk of bias item presented as percentages across all included studies.

Risk of bias summary: review authors' judgements about each risk of bias item for each included study.
Figuras y tablas -
Figure 3

Risk of bias summary: review authors' judgements about each risk of bias item for each included study.

Comparison 1 Extended VTE prophylaxis versus placebo, Outcome 1 VTE‐related mortality.
Figuras y tablas -
Analysis 1.1

Comparison 1 Extended VTE prophylaxis versus placebo, Outcome 1 VTE‐related mortality.

Comparison 1 Extended VTE prophylaxis versus placebo, Outcome 2 Recurrent VTE.
Figuras y tablas -
Analysis 1.2

Comparison 1 Extended VTE prophylaxis versus placebo, Outcome 2 Recurrent VTE.

Comparison 1 Extended VTE prophylaxis versus placebo, Outcome 3 Major bleeding.
Figuras y tablas -
Analysis 1.3

Comparison 1 Extended VTE prophylaxis versus placebo, Outcome 3 Major bleeding.

Comparison 1 Extended VTE prophylaxis versus placebo, Outcome 4 All‐cause mortality.
Figuras y tablas -
Analysis 1.4

Comparison 1 Extended VTE prophylaxis versus placebo, Outcome 4 All‐cause mortality.

Comparison 1 Extended VTE prophylaxis versus placebo, Outcome 5 Clinically relevant non‐major bleeding.
Figuras y tablas -
Analysis 1.5

Comparison 1 Extended VTE prophylaxis versus placebo, Outcome 5 Clinically relevant non‐major bleeding.

Comparison 1 Extended VTE prophylaxis versus placebo, Outcome 6 Stroke.
Figuras y tablas -
Analysis 1.6

Comparison 1 Extended VTE prophylaxis versus placebo, Outcome 6 Stroke.

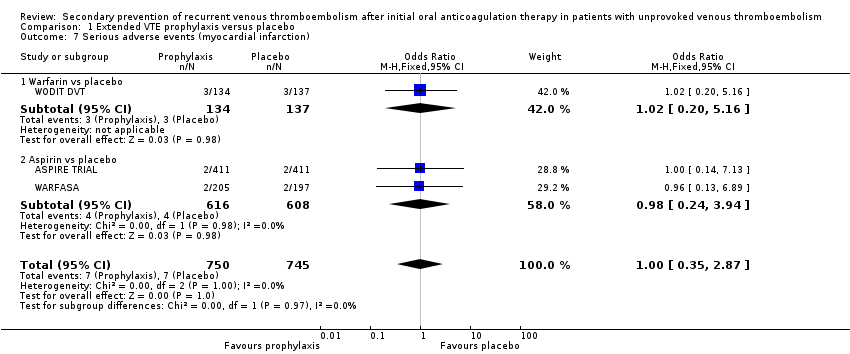
Comparison 1 Extended VTE prophylaxis versus placebo, Outcome 7 Serious adverse events (myocardial infarction).
Figuras y tablas -
Analysis 1.7

Comparison 1 Extended VTE prophylaxis versus placebo, Outcome 7 Serious adverse events (myocardial infarction).

Comparison 2 Extended VTE prophylaxis versus another extended VTE prophylaxis, Outcome 1 Recurrent VTE.
Figuras y tablas -
Analysis 2.1

Comparison 2 Extended VTE prophylaxis versus another extended VTE prophylaxis, Outcome 1 Recurrent VTE.

Comparison 2 Extended VTE prophylaxis versus another extended VTE prophylaxis, Outcome 2 Major bleeding.
Figuras y tablas -
Analysis 2.2

Comparison 2 Extended VTE prophylaxis versus another extended VTE prophylaxis, Outcome 2 Major bleeding.

Comparison 2 Extended VTE prophylaxis versus another extended VTE prophylaxis, Outcome 3 Clinically relevant non‐major bleeding.
Figuras y tablas -
Analysis 2.3

Comparison 2 Extended VTE prophylaxis versus another extended VTE prophylaxis, Outcome 3 Clinically relevant non‐major bleeding.

Summary of findings for the main comparison. Extended prophylaxis compared to placebo in patients with unprovoked venous thromboembolism

Extended prophylaxis compared to placebo in patients with unprovoked venous thromboembolism

Patient or population: patients with unprovoked venous thromboembolism
Setting: hospital
Intervention: extended prophylaxis
Comparison: placebo

Outcomes

Anticipated absolute effects* (95% CI)

Relative effect
(95% CI)

No. of participants
(studies)

Quality of the evidence
(GRADE)

Comments

Risk with placebo

Risk with extended prophylaxis

VTE‐related mortalitya

Study population

OR 0.98
(0.14 to 6.98)

1862
(4 RCTs)

⊕⊕⊝⊝
LOWb

Two of the four studies reported no cases of VTE‐related mortality.

2 per 1000

2 per 1000
(0 to 15)

Recurrent VTEc

Study population

OR 0.63
(0.38 to 1.03)

2043
(5 RCTs)

⊕⊕⊕⊝
MODERATEd

170 per 1000

114 per 1000
(72 to 174)

Major bleedinge

Study population

OR 1.84
(0.87 to 3.85)

2043
(5 RCTs)

⊕⊕⊝⊝
LOWf

11 per 1000

20 per 1000
(9 to 40)

All‐cause mortalityg

Study population

OR 1.00
(0.63 to 1.57)

2043
(5 RCTs)

⊕⊕⊕⊝
MODERATEd

38 per 1000

38 per 1000
(24 to 59)

Clinically relevant non‐major bleedingh

Study population

OR 1.78
(0.59 to 5.33)

1672
(4 RCTs)

⊕⊕⊝⊝
LOWf

Two of the four studies reported no cases of clinically relevant non‐major bleeding.

6 per 1000

11 per 1000
(4 to 31)

Strokei

Study population

OR 1.15
(0.39 to 3.46)

1224
(2 RCTs)

⊕⊕⊕⊝
LOWj

10 per 1000

11 per 1000
(4 to 33)

Myocardial infarction

Study population

OR 1.00
(0.35 to 2.87)

1495
(3 RCTs)

⊕⊕⊕⊝
LOWb

9 per 1000

9 per 1000
(3 to 27)

*The risk in the intervention group (and its 95% confidence interval) is based on the assumed risk in the comparison group and the relative effect of the intervention (and its 95% CI).

CI: confidence interval; OR: odds ratio; RCT: randomised controlled trial; VTE: venous thromboembolism.

GRADE Working Group grades of evidence.
High quality: We are very confident that the true effect lies close to that of the estimate of the effect.
Moderate quality: We are moderately confident in the effect estimate: The true effect is likely to be close to the estimate of the effect, but there is a possibility that it is substantially different.
Low quality: Our confidence in the effect estimate is limited: The true effect may be substantially different from the estimate of the effect.
Very low quality: We have very little confidence in the effect estimate: The true effect is likely to be substantially different from the estimate of effect.

aVTE‐related mortality ‐ death due to fatal PE.
bDowngraded as high risk of selection bias in one study (WARFASA) and high risk of performance bias in another study (WODIT DVT). The evidence was downgraded further owing to imprecision, reflected by the small number of outcome events and wide confidence intervals around the estimate of effect.
cRecurrence rate of symptomatic, objectively confirmed VTE (DVT or PE) during follow‐up.
dDowngraded as high risk of selection bias in one study (WARFASA) and high risk of performance bias in two studies (WODIT DVT; WODIT PE).
eMajor bleeding events: A major bleeding episode is defined as clinically overt bleeding that is associated with at least one of a fall in haemoglobin levels of 20 g/L or more; transfusion of at least 2 units of packed red blood cells; involvement of the intracranial or retroperitoneal space or a body cavity; or death (International Society on Thrombosis and Haemostasis definition) (Schulman 2005); or as defined by the investigators of each trial.
fDowngraded as high risk of selection bias in one study (WARFASA) and high risk of performance bias in two studies (WODIT DVT; WODIT PE). The evidence was downgraded further owing to imprecision, reflected by the small number of outcome events and wide confidence intervals around the estimate of effect.
gAll‐cause mortality ‐ death due to any cause.
hClinically relevant non‐major bleeding as defined in each individual trial.
iStroke (both ischaemic and haemorrhagic).
jDowngraded as high risk of selection bias in one study (WARFASA). The evidence was downgraded further owing to imprecision, reflected by the small number of outcome events and wide confidence intervals around the estimate of effect.

Figuras y tablas -
Summary of findings for the main comparison. Extended prophylaxis compared to placebo in patients with unprovoked venous thromboembolism
Summary of findings 2. VTE extended prophylaxis compared to another VTE extended prophylaxis in patients with unprovoked venous thromboembolism

VTE extended prophylaxis compared to another VTE extended prophylaxis in patients with unprovoked venous thromboembolism

Patient or population: patients with unprovoked venous thromboembolism
Setting: hospital
Intervention: extended prophylaxis (rivaroxaban)
Comparison: extended prophylaxis (aspirin)

Outcomes

Anticipated absolute effects* (95% CI)

Relative effect
(95% CI)

No. of participants
(studies)

Quality of the evidence
(GRADE)

Comments

Risk with aspirin

Risk with rivaroxaban

VTE‐related mortalitya

See comments.

See comments.

See comments.

See comments.

Data on VTE‐related mortality are yet available for participants with unprovoked VTE.

Recurrent VTEb

Study population

OR 0.28
(0.15 to 0.54)

1389
(1 RCT)

⊕⊕⊕⊝
MODERATEc

56 per 1000

16 per 1000
(9 to 31)

Major bleedingd

Study population

OR 3.06
(0.37 to 25.51)

1389
(1 RCT)

⊕⊕⊕⊝
MODERATEc

2 per 1000

7 per 1000
(1 to 52)

All‐cause mortalitye

See comments.

See comments.

See comments.

See comments.

Data on all‐cause mortality are not yet available for participants with unprovoked VTE.

Clinically relevant non‐major bleedingf

19 per 1000

16 per 1000

(7 to 37)

OR 0.84

(0.37 to 1.94)

1389
(1 RCT)

⊕⊕⊕⊝
MODERATEc

Strokeg

See comments.

See comments.

See comments.

See comments.

Data on stroke are not yet available for participants with unprovoked VTE.

Myocardial infarction

See comments.

See comments.

See comments.

See comments.

Data on myocardial infarction are not yet available for participants with unprovoked VTE.

*The risk in the intervention group (and its 95% confidence interval) is based on the assumed risk in the comparison group and the relative effect of the intervention (and its 95% CI).

CI: confidence interval; OR: odds ratio; RCT: randomised controlled trial; VTE: venous thromboembolism.

GRADE Working Group grades of evidence.
High quality: We are very confident that the true effect lies close to that of the estimate of the effect.
Moderate quality: We are moderately confident in the effect estimate: The true effect is likely to be close to the estimate of the effect, but there is a possibility that it is substantially different.
Low quality: Our confidence in the effect estimate is limited: The true effect may be substantially different from the estimate of the effect.
Very low quality: We have very little confidence in the effect estimate: The true effect is likely to be substantially different from the estimate of effect.

aVTE‐related mortality ‐ death due to fatal PE.
bRecurrence rate of symptomatic, objectively confirmed VTE (DVT or PE) during follow‐up.
cThe evidence was downgraded owing to imprecision, reflected by the small number of outcome events and wide confidence intervals around the estimate of effect.
dMajor bleeding events: A major bleeding episode is defined as clinically overt bleeding that is associated with at least one of a fall in haemoglobin levels of 20 g/L or more; transfusion of at least 2 units of packed red blood cells; involvement of the intracranial or retroperitoneal space or a body cavity; or death (International Society on Thrombosis and Haemostasis definition) (Schulman 2005); or as defined by the investigators of each trial.
eAll‐cause mortality ‐ death due to any cause.
fClinically relevant non‐major bleeding as defined in each individual trial.
gStroke (both ischaemic and haemorrhagic).

Figuras y tablas -
Summary of findings 2. VTE extended prophylaxis compared to another VTE extended prophylaxis in patients with unprovoked venous thromboembolism
Comparison 1. Extended VTE prophylaxis versus placebo

Outcome or subgroup title

No. of studies

No. of participants

Statistical method

Effect size

1 VTE‐related mortality Show forest plot

4

1862

Odds Ratio (M‐H, Fixed, 95% CI)

0.98 [0.14, 6.98]

1.1 Warfarin vs placebo

2

638

Odds Ratio (M‐H, Fixed, 95% CI)

0.0 [0.0, 0.0]

1.2 Aspirin vs placebo

2

1224

Odds Ratio (M‐H, Fixed, 95% CI)

0.98 [0.14, 6.98]

2 Recurrent VTE Show forest plot

5

2043

Odds Ratio (M‐H, Random, 95% CI)

0.63 [0.38, 1.03]

2.1 Warfarin vs placebo

3

819

Odds Ratio (M‐H, Random, 95% CI)

0.52 [0.15, 1.80]

2.2 Aspirin vs placebo

2

1224

Odds Ratio (M‐H, Random, 95% CI)

0.68 [0.50, 0.92]

3 Major bleeding Show forest plot

5

2043

Odds Ratio (M‐H, Fixed, 95% CI)

1.84 [0.87, 3.85]

3.1 Warfarin vs placebo

3

819

Odds Ratio (M‐H, Fixed, 95% CI)

2.81 [0.89, 8.92]

3.2 Aspirin vs placebo

2

1224

Odds Ratio (M‐H, Fixed, 95% CI)

1.28 [0.47, 3.47]

4 All‐cause mortality Show forest plot

5

2043

Odds Ratio (M‐H, Fixed, 95% CI)

1.00 [0.63, 1.57]

4.1 Warfarin vs placebo

3

819

Odds Ratio (M‐H, Fixed, 95% CI)

1.07 [0.53, 2.17]

4.2 Aspirin vs placebo

2

1224

Odds Ratio (M‐H, Fixed, 95% CI)

0.95 [0.52, 1.72]

5 Clinically relevant non‐major bleeding Show forest plot

4

1672

Odds Ratio (M‐H, Fixed, 95% CI)

1.78 [0.59, 5.33]

5.1 Warfarin vs placebo

2

448

Odds Ratio (M‐H, Fixed, 95% CI)

0.0 [0.0, 0.0]

5.2 Aspirin vs placebo

2

1224

Odds Ratio (M‐H, Fixed, 95% CI)

1.78 [0.59, 5.33]

6 Stroke Show forest plot

2

1224

Odds Ratio (M‐H, Fixed, 95% CI)

1.15 [0.39, 3.46]

6.1 Aspirin vs placebo

2

1224

Odds Ratio (M‐H, Fixed, 95% CI)

1.15 [0.39, 3.46]

7 Serious adverse events (myocardial infarction) Show forest plot

3

1495

Odds Ratio (M‐H, Fixed, 95% CI)

1.00 [0.35, 2.87]

7.1 Warfarin vs placebo

1

271

Odds Ratio (M‐H, Fixed, 95% CI)

1.02 [0.20, 5.16]

7.2 Aspirin vs placebo

2

1224

Odds Ratio (M‐H, Fixed, 95% CI)

0.98 [0.24, 3.94]

Figuras y tablas -
Comparison 1. Extended VTE prophylaxis versus placebo
Comparison 2. Extended VTE prophylaxis versus another extended VTE prophylaxis

Outcome or subgroup title

No. of studies

No. of participants

Statistical method

Effect size

1 Recurrent VTE Show forest plot

1

Odds Ratio (M‐H, Fixed, 95% CI)

Totals not selected

2 Major bleeding Show forest plot

1

Odds Ratio (M‐H, Fixed, 95% CI)

Totals not selected

3 Clinically relevant non‐major bleeding Show forest plot

1

Odds Ratio (M‐H, Fixed, 95% CI)

Totals not selected

Figuras y tablas -
Comparison 2. Extended VTE prophylaxis versus another extended VTE prophylaxis