| 1 QoL/wellbeing (end scores) Show forest plot | 9 | | Std. Mean Difference (Fixed, 95% CI) | ‐0.04 [‐0.20, 0.13] |
|
| 2 Sensitivity analysis QoL/wellbeing (end scores) Show forest plot | 8 | | Std. Mean Difference (Fixed, 95% CI) | 0.16 [‐0.03, 0.34] |
|
| 3 QoL (subgrouped on Low Libido/HSDD) Show forest plot | 9 | | Std. Mean Difference (Fixed, 95% CI) | Subtotals only |
|
| 3.1 Low Libido/HSDD | 2 | | Std. Mean Difference (Fixed, 95% CI) | 0.10 [‐0.26, 0.46] |
| 3.2 Libido normal/unknown | 7 | | Std. Mean Difference (Fixed, 95% CI) | ‐0.08 [‐0.27, 0.11] |
| 4 QoL (subgrouped on treatment duration) Show forest plot | 9 | | Std. Mean Difference (Fixed, 95% CI) | ‐0.04 [‐0.20, 0.13] |
|
| 4.1 <6 weeks | 3 | | Std. Mean Difference (Fixed, 95% CI) | 0.23 [‐0.11, 0.57] |
| 4.2 6 to 26 weeks | 3 | | Std. Mean Difference (Fixed, 95% CI) | 0.13 [‐0.13, 0.39] |
| 4.3 >26 weeks | 3 | | Std. Mean Difference (Fixed, 95% CI) | ‐0.46 [‐0.75, ‐0.16] |
| 5 QoL/General Wellbeing (change scores) Show forest plot | 2 | | Std. Mean Difference (IV, Fixed, 95% CI) | Totals not selected |
|
| 6 Side‐effects Show forest plot | 5 | | Odds Ratio (M‐H, Fixed, 95% CI) | Subtotals only |
|
| 6.1 Androgenic side‐effects | 1 | 92 | Odds Ratio (M‐H, Fixed, 95% CI) | 6.57 [1.37, 31.59] |
| 6.2 Acne | 4 | 158 | Odds Ratio (M‐H, Fixed, 95% CI) | 2.26 [0.56, 9.02] |
| 6.3 Hirsutism | 1 | 89 | Odds Ratio (M‐H, Fixed, 95% CI) | 4.89 [0.23, 104.76] |
| 7 Acne subgrouped on study duration Show forest plot | 4 | | Odds Ratio (M‐H, Fixed, 95% CI) | Subtotals only |
|
| 7.1 < 6 weeks | 1 | 27 | Odds Ratio (M‐H, Fixed, 95% CI) | 0.29 [0.01, 7.70] |
| 7.2 >6 weeks to 26 weeks | 1 | 22 | Odds Ratio (M‐H, Fixed, 95% CI) | 2.74 [0.10, 74.87] |
| 7.3 >26 weeks | 2 | 109 | Odds Ratio (M‐H, Fixed, 95% CI) | 5.25 [0.58, 47.36] |
| 8 Menopausal symptoms (continuous) Show forest plot | 2 | | Std. Mean Difference (IV, Fixed, 95% CI) | Subtotals only |
|
| 8.1 Endscores | 1 | 17 | Std. Mean Difference (IV, Fixed, 95% CI) | 0.35 [‐0.70, 1.40] |
| 8.2 Change scores | 1 | 66 | Std. Mean Difference (IV, Fixed, 95% CI) | 0.07 [‐0.42, 0.55] |
| 9 Menopausal symptoms (dichotomous) Show forest plot | 2 | | Odds Ratio (M‐H, Fixed, 95% CI) | Totals not selected |
|
| 9.1 Flushes | 1 | | Odds Ratio (M‐H, Fixed, 95% CI) | 0.0 [0.0, 0.0] |
| 9.2 Hot flushes and palpitations | 1 | | Odds Ratio (M‐H, Fixed, 95% CI) | 0.0 [0.0, 0.0] |
| 9.3 Insomnia | 1 | | Odds Ratio (M‐H, Fixed, 95% CI) | 0.0 [0.0, 0.0] |
| 9.4 Night sweats | 1 | | Odds Ratio (M‐H, Fixed, 95% CI) | 0.0 [0.0, 0.0] |
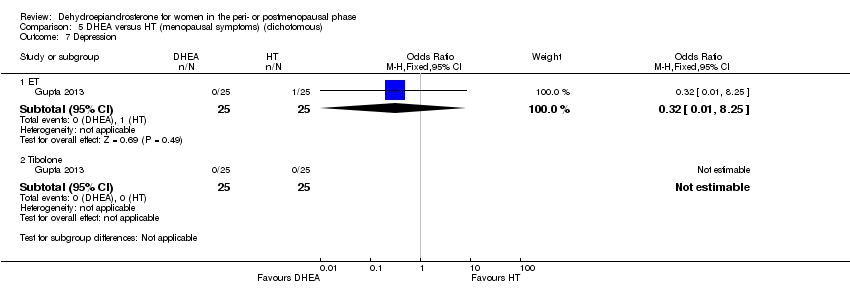
| 9.5 Depression | 1 | | Odds Ratio (M‐H, Fixed, 95% CI) | 0.0 [0.0, 0.0] |
| 9.6 Loss of libido | 1 | | Odds Ratio (M‐H, Fixed, 95% CI) | 0.0 [0.0, 0.0] |
| 9.7 Vaginal dryness | 1 | | Odds Ratio (M‐H, Fixed, 95% CI) | 0.0 [0.0, 0.0] |
| 9.8 Pruritis vulvae | 1 | | Odds Ratio (M‐H, Fixed, 95% CI) | 0.0 [0.0, 0.0] |
| 9.9 Urethral syndrome | 1 | | Odds Ratio (M‐H, Fixed, 95% CI) | 0.0 [0.0, 0.0] |
| 9.10 Tiredness | 1 | | Odds Ratio (M‐H, Fixed, 95% CI) | 0.0 [0.0, 0.0] |
| 10 Sexual Function (end scores) Show forest plot | 6 | | Std. Mean Difference (Fixed, 95% CI) | 0.19 [‐0.01, 0.40] |
|
| 11 Sexual function (end scores) (sensitivity analysis) Show forest plot | 5 | | Std. Mean Difference (Fixed, 95% CI) | 0.31 [0.07, 0.55] |
|