Dehidroepiandrosterona para pacientes en fase peri o posmenopáusica
Resumen
Antecedentes
Durante la menopausia la disminución en la respuesta folicular ovárica generalmente causa la fluctuación y la disminución final en los niveles de estrógeno. Este proceso puede provocar la aparición de diversos síntomas perimenopáusicos y posmenopáusicos (por ejemplo, sofocos, sudores nocturnos, sequedad vaginal). La dehidroepiandrosterona (DHEA) es uno de los precursores principales de los andrógenos, que a la vez se convierten en testosterona y estrógenos. Es posible que la administración de DHEA pueda aumentar los niveles de estrógeno y testosterona en las pacientes en fase peri o posmenopáusica para aliviar los síntomas y mejorar el bienestar general y la función sexual (por ejemplo la libido, la dispareunia, la satisfacción). El tratamiento con DHEA es polémico ya que hay incertidumbre acerca de la efectividad y la seguridad. Esta revisión debe esbozar claramente las pruebas de la DHEA en el tratamiento de los síntomas menopáusicos y evaluar la efectividad y la seguridad al combinar los resultados de ensayos controlados aleatorios.
Objetivos
Evaluar la efectividad y la seguridad de administrar DHEA a pacientes con síntomas en la fase peri o posmenopáusica.
Métodos de búsqueda
Las bases de datos en las que se realizaron búsquedas (3 de junio 2014), sin aplicar restricciones de idiomas, fueron el registro especializado del Grupo Cochrane de Trastornos Menstruales y Subfertilidad (Cochrane Menstrual Disorders and Subfertility Group), Registro Cochrane Central de Ensayos Controlados (Cochrane Central Register of Controlled Trials) (CENTRAL), MEDLINE, EMBASE, PsycINFO,CINAHL y LILACS. También se buscaron resúmenes de conferencias y listas de referencias en el ISI Web of Knowledge. Se buscaron ensayos en curso en registros de ensayos. Se verificaron las listas de referencias de los artículos recuperados.
Criterios de selección
Se incluyeron los ensayos controlados aleatorios que compararon cualquier dosis y forma de DHEA por cualquier vía de administración versus otra intervención activa, placebo o ningún tratamiento con una duración mínima del tratamiento de siete días en pacientes en fase peri o posmenopáusica.
Obtención y análisis de los datos
Dos autores extrajeron los datos de forma independiente después de evaluar la elegibilidad para la inclusión y la calidad de los estudios. Se contactó con los autores para obtener información adicional.
Resultados principales
Se incluyeron en esta revisión 28 ensayos con 1273 mujeres menopáusicas Fue posible extraer datos de 16 ensayos para realizar el metanálisis. La calidad general de los estudios fue de moderada a baja, y la mayoría de los estudios que se incluyeron en el metanálisis presentaban una metodología razonable. En comparación con placebo, la DHEA no mejora la calidad de vida (diferencia de medias estandarizada [DME] 0,16; intervalo de confianza [IC] del 95%: ‐0,03 a 0,34; p = 0,10, ocho estudios, 287 pacientes [132 de ensayos paralelos y 155 de ensayos cruzados (crossover)], I² = 0%, pruebas de calidad moderada; un ensayo de los nueve que informaron este resultado se eliminó del análisis de sensibilidad pues se consideró con alto riesgo de sesgo). Se encontró que la DHEA se asoció con efectos secundarios androgénicos (principalmente acné) (odds ratio [OR] 3,77; IC del 95%: 1,36 a 10,4; p = 0,01, cinco estudios, 376 pacientes, I² = 10%, pruebas de calidad moderada) comparada con placebo. No se encontraron asociaciones con otros efectos adversos. No estuvo claro si la DHEA afectó a los síntomas menopáusicos ya que los resultados de los ensayos no fueron consistentes y no fue posible agruparlos con facilidad para proporcionar un efecto general debido a diferentes tipos de medición (por ejemplo, continua, dicotómica, de cambio y puntuaciones finales). Se encontró que la DHEA mejora la función sexual (DME 0,31; IC del 95%: 0,07 a 0,55; p = 0,01, cinco estudios, 261 pacientes [239 pacientes de ensayos paralelos y 22 pacientes de ensayos cruzados], I² = 0%; un ensayo que se consideró con alto riesgo de sesgo se extrajo durante el análisis de sensibilidad) en comparación con placebo.
No hubo diferencias en el acné asociado con la DHEA al comparar los estudios que administraron la DHEA de forma oral (OR 2,16; IC del 95%: 0,47 a 9,96; p = 0,90, tres estudios, 136 pacientes, I² = 5%, pruebas de calidad muy baja) con un estudio que utilizó la administración cutánea de la DHEA (OR 2,74; IC del 95%: 0,10 a 74,87; p = 0,90, un estudio, 22 pacientes, pruebas de calidad muy baja). Los efectos no difirieron en la función sexual cuando los estudios que administraron la DHEA de forma oral (DME 0,11; IC del 95%: ‐0,13 a 0,35; p = 0,36, cinco estudios, 340 pacientes, I² = 0) se compararon con un estudio que administró la DHEA de forma intravaginal (DME 0,42; IC del 95%: 0,03 a 0,81; un estudio, 218 pacientes). Prueba para las diferencias de subgrupos: ji² = 1,77; gl = 1 (p = 0,18); I² = 43,4%. No hay datos suficientes disponibles para evaluar la calidad de vida y los síntomas menopáusicos de esta comparación.
No hubo datos suficientes disponibles para comparar los efectos de la DHEA con la terapia hormonal (TH) sobre la calidad de vida, los síntomas menopáusicos y los efectos adversos. No se encontraron diferencias grandes en los efectos del tratamiento en la función sexual al comparar la DHEA con la TH (diferencia de medias [DM] 1,26; IC del 95%: ‐0,21 a 2,73; p = 0,09, dos estudios, 41 pacientes, I² = 0%).
Conclusiones de los autores
No existen pruebas de que la DHEA mejore la calidad de vida, pero hay algunas pruebas de que se asocia con efectos secundarios androgénicos. Hay incertidumbre con respecto a si la DHEA reduce los síntomas menopáusicos, pero la DHEA puede mejorar levemente la función sexual en comparación con placebo.
PICO
Resumen en términos sencillos
Dehidroepiandrosterona para pacientes en fase peri o posmenopáusica
Pregunta de la revisión
Los revisores Cochrane investigaron si la administración de suplementos de DHEA (dehidroepiandrosterona) es segura y mejora la calidad de vida, los síntomas menopáusicos y la función sexual en pacientes en fase peri o posmenopáusica.
Antecedentes
Durante la menopausia ocurre una fluctuación y con el tiempo una disminución en los niveles de estrógenos. Estos cambios hormonales pueden causar que las pacientes presenten síntomas peri o posmenopáusicos (por ejemplo, sofocos, sudores nocturnos, sequedad vaginal). La DHEA es una hormona denominada precursora que es convertida por el cuerpo en estrógenos y andrógenos. Es posible que la administración de suplementos de DHEA pueda aumentar los niveles de estrógeno y testosterona en las pacientes en fase peri o posmenopáusica para reducir los síntomas menopáusicos y mejorar el bienestar general y la función sexual.
El objetivo de esta revisión fue evaluar la efectividad y la seguridad de la DHEA en las pacientes menopáusicas al comparar cualquier dosis y forma de DHEA por cualquier vía de administración versus otro tratamiento, placebo o ningún tratamiento con una duración mínima del tratamiento de siete días.
Fecha de la búsqueda
Las pruebas estaban actualizadas hasta el 3 de junio de 2014.
Características de los estudios
Se incluyó un total de 28 ensayos controlados aleatorios, con un total de 1273 mujeres menopáusicas. Más del 95% de las poblaciones de los estudios fueron pacientes posmenopáusicas. La edad de las mujeres varió entre los 36 y los 80 años. La duración del tratamiento varió de una semana a un año. En más del 80% de los ensayos la DHEA se administró por vía oral con dosis diarias que variaron entre 10 mg y 1600 mg.
Resultados clave
No se encontraron pruebas de que la DHEA mejore la calidad de vida. Hubo algunas pruebas de que se asoció con efectos secundarios androgénicos (por ejemplo, acné, crecimiento no deseado de pelo [hirsutismo]). No hubo certeza de que la DHEA redujera los síntomas menopáusicos, pero la DHEA puede haber mejorado levemente la función sexual.
Calidad de la evidencia
La calidad de las pruebas fue moderada, tanto para la calidad de vida como para los efectos secundarios. Se disminuyó la calificación de calidad de las pruebas debido a la falta de datos sobre la asignación al azar, la asignación o el cegamiento; los tamaños pequeños de los estudios en general; y los limitados datos disponibles.
Authors' conclusions
Summary of findings
| DHEA compared to control (placebo or no treatment) | ||||||
| Population: women in the peri‐ or postmenopausal phase | ||||||
| Outcomes | Illustrative comparative risks* (95% CI) | Relative effect | No of participants | Quality of the evidence | Comments | |
| Assumed risk | Corresponding risk | |||||
| control (placebo or no treatment) | DHEA | |||||
| QoL, wellbeing (end scores) (sensitivity analysis) | The mean QoL, wellbeing in the intervention groups was | 287 (132 from parallel and 155 from crossover) | ⊕⊕⊕⊝ | SMD 0.16 (‐0.03 to 0.34) | ||
| Side effects (androgenic overall combined with acne) | 25 per 1000 | 87 per 1000 | OR 3.77 | 250 | ⊕⊕⊕⊝ | |
| Side effects ‐ androgenic side effects | 44 per 1000 | 234 per 1000 | OR 6.57 | 92 | ⊕⊕⊝⊝ | Only 1 study for this outcome |
| Side effects ‐ acne | 13 per 1000 | 29 per 1000 | OR 2.26 | 158 | ⊕⊕⊕⊝ | |
| *The basis for the assumed risk is the median control group risk across studies. The corresponding risk (and its 95% confidence interval) is based on the assumed risk in the comparison group and the relative effect of the intervention (and its 95% CI). | ||||||
| GRADE Working Group grades of evidence | ||||||
| 1 Downgraded for imprecision due to wide confidence intervals | ||||||
| Oral DHEA versus control subgrouped by routes of administration for women in the peri‐ or postmenopausal phase*** | ||||||
| Population: Women in the peri‐ or postmenopausal phase | ||||||
| Outcomes | Illustrative comparative risks* (95% CI) | Relative effect | No of participants | Quality of the evidence | Comments | |
| Assumed risk | Corresponding risk | |||||
| Placebo | DHEA | |||||
| QoL, wellbeing (change scores) ‐ oral administration | The mean QoL, wellbeing in the intervention groups was | 66 | ⊕⊝⊝⊝ | SMD ‐0.05 (‐0.53 to 0.43) | ||
| QoL, wellbeing (change scores) ‐ intravaginal application | The mean QoL/wellbeing in the intervention groups was | 107 | ⊕⊝⊝⊝ | SMD 1.23 (0.82 to 1.65) | ||
| Side effects: acne ‐ skin application | 0 per 1000 | 126per 1000** | OR 2.74 | 22 | ⊕⊝⊝⊝ | |
| Side effects: acne ‐ oral administration | 15 per 1000 | 32 per 1000 | OR 2.16 | 136 | ⊕⊝⊝⊝ | |
| *The basis for the assumed risk is the median control group risk across studies. The corresponding risk (and its 95% confidence interval) is based on the assumed risk in the comparison group and the relative effect of the intervention (and its 95% CI). ** As the assumed risk in the control group for acne is 0 it is impossible to calculate the comparative risk so we have assumed a risk of 0.05 in the placebo group. | ||||||
| GRADE Working Group grades of evidence | ||||||
| ***There were no studies that compared different routes of treatment within the study. We have separated studies based on their route of administration and compared the results from these studies with each other. 1 Downgraded due to no other studies available for comparison of effects | ||||||
| DHEA versus HT for women in the peri‐ or postmenopausal phase | ||||||
| Population: Women in the peri‐ or postmenopausal phase | ||||||
| Outcomes | Illustrative comparative risks* (95% CI) | Relative effect | No of participants | Quality of the evidence | Comments | |
| Assumed risk | Corresponding risk | |||||
| HT | DHEA | |||||
| QoL, general wellbeing DHEA versus ET | The mean QoL in the intervention groups was 1.63 higher (2.25 lower to 5.52 higher) | 17 | ⊕⊝⊝⊝ | |||
| QoL, general wellbeing | No studies available | |||||
| QoL, general wellbeing DHEA versus tibolone | No studies available | |||||
| Acne | 0 per 1000 | 472 per 1000 | OR 17 | 50 | ⊕⊝⊝⊝ | |
| Acne DHEA versus tibolone | 0 per 1000 | 472 per 1000** | OR 17 | 50 | ⊕⊝⊝⊝ | |
| Acne DHEA versus ET + P | No studies available | |||||
| *The basis for the assumed risk is the median control group risk across studies. The corresponding risk (and its 95% confidence interval) is based on the assumed risk in the comparison group and the relative effect of the intervention (and its 95% CI). **As the assumed risk in the control group for acne is 0 it is impossible to calculate the comparative risk so we have assumed a risk of 0.05 in the placebo group. | ||||||
| GRADE Working Group grades of evidence | ||||||
| 1 Downgraded due to no other studies available for comparison of effects | ||||||
Background
Description of the condition
The menopause is said to have occurred once there is permanent cessation of menstruation. Prior to the final menstruation there is usually a gradual reduction in the frequency of menstrual periods, known as the perimenopause. Postmenopause is defined as the period of time following on from 12 months after a woman has experienced her last menstruation. During perimenopause there is a fluctuation in estrogen levels due to decreasing ovarian follicular response (Hoffman 2012; Rosen 2011; Speroff 2005). Most women become menopausal between 45 and 55 years of age, however there are also women who reach menopause at an earlier age for various reasons (for example premature ovarian insufficiency (sometimes due to chemotherapy) or bilateral oophorectomy). Menopausal women can develop a range of symptoms including vasomotor symptoms such as hot flushes and night sweats,and vaginal atrophy leading to vaginal dryness and dyspareunia, which can impact on sexual function (Genazzani 2002; Speroff 2005). Hormone therapy (HT) (estrogen alone or in combination with a progestin) is currently indicated for the treatment of menopausal symptoms. However, HT has been associated with a significant increase in the risk of various conditions including breast cancer, venous thromboembolism and stroke (Cameron 2005; Manson 2013; Marjoribanks 2012; Rossouw 2002; State‐of‐the‐Science‐Panel 2005; Taylor 2011).
Description of the intervention
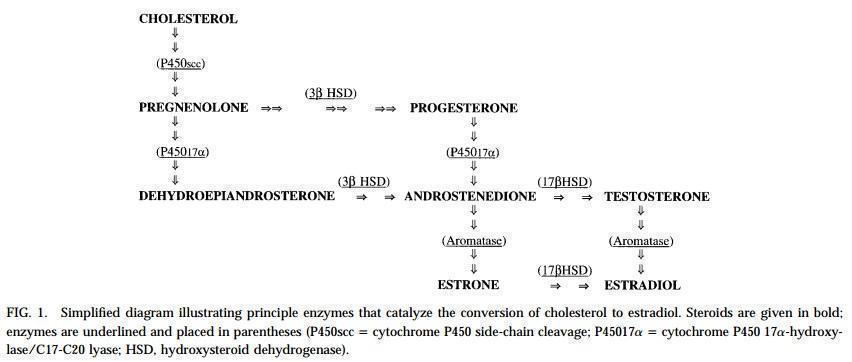
Dehydroepiandrosterone (DHEA) is one of the main precursor sex steroids. DHEA is synthesized from cholesterol in the zone reticularis of the adrenal gland. It is converted to estrogens and testosterone by steroidogenic enzymes expressed in peripheral tissues such as the skeleton, breasts and ovary (Figure 1). DHEA peaks at the age of 25 years and then slowly declines to approximately 30% of the initial levels at postmenopause (Genazzani 2002; Rosen 2011; Speroff 2005). In the United States of America (USA) DHEA can be purchased without prescription but in most countries it is only available by prescription. DHEA may be administered orally, intravaginally or by alternative routes of administration (for example transdermal patches).

Biosynthesis of DHEA and estrogens.
As DHEA and eventually estrogen can be synthesized from cholesterol, levels of circulating estrogen and DHEA may differ in overweight women (body mass index (BMI) > 25 kg/m2) compared to women with a normal weight (BMI 18 to 25 kg/m2) or underweight women (BMI < 18 kg/m2) (Buster 2000; Miller 2002). Therefore, administered DHEA may have differing effects on women who are over‐ or underweight compared to those with a normal BMI.
Some inflammatory diseases (for example systemic lupus erythematosus, Sjögren syndrome) are associated with low circulating DHEA levels (Sawalha 2008). DHEA levels may correlate with disease activity, therefore DHEA supplementation may have a different effect in women with and without inflammatory disease.
How the intervention might work
Due to a fluctuation and eventual decrease in estrogen levels (estradiol in particular), women can develop various perimenopausal and postmenopausal symptoms. While the body is adjusting to these hormonal changes women may experience symptoms such as hot flushes and night sweats. Low estradiol levels can cause vaginal dryness, which may lead to diminished sexual function (Hoffman 2012; Speroff 2005). All of these symptoms may cause a decrease in the general wellbeing of peri‐ and postmenopausal women. It is suggested that testosterone increases sexual desire and sexual function (Davis 2008; Pluchino 2013). As DHEA is one of the main precursors of androgens, which in turn are converted to testosterone and estrogens (Figure 1) (Simpson 2003; Vanson 1996), it is possible that the administration of DHEA may increase estrogen and testosterone levels in peri‐ and postmenopausal women to alleviate their symptoms and improve general wellbeing (Buster 2000; Davis 2008; Mayo 2002; Pluchino 2013; Raven 2007).
The effects of DHEA on menopausal women may differ from HT because of the additional androgenic effect of DHEA (Dobs 2002; Labrie 2005). In postmenopausal women DHEA has been hypothesized to increase the incidence of breast cancer and caution is advised. However, there have been limited studies on this subject and the results of these studies are inconsistent (Morris 2001; Schwartz 2006; Shilkaitis 2005; Stoll 1999). No other serious adverse effects of DHEA have been described in the published literature. Doses of 50 mg and above have shown androgenic side effects (for example acne and increased hair growth) (Kroboth 1999; Panjari 2010).
Different effects of DHEA have been described using different routes of administration (Casson 1996). Intravaginal administration of DHEA has been reported to have a better effect on alleviating the symptom of vaginal atrophy and improving sexual function than oral administration of DHEA (Goel 2011).
Why it is important to do this review
Treatment with DHEA is controversial as there is uncertainty about its effectiveness and safety (Buster 2000; Panjari 2010; Raven 2007). Inconsistent findings have been published on the effects of DHEA in menopausal women and much of the data from clinical trials are limited by small sample sizes and short duration of treatment (Cameron 2005; Panjari 2010). This review should clearly outline the evidence for DHEA in the treatment of menopausal symptoms and evaluate its effectiveness and safety by combining the results of randomised controlled trials.
Objectives
To assess the effectiveness and safety of administering DHEA to women with menopausal symptoms in the peri‐ or postmenopausal phase.
Methods
Criteria for considering studies for this review
Types of studies
Published and unpublished randomised controlled trials (RCTs) were eligible for inclusion. We excluded non‐randomised studies (for example studies with evidence of inadequate sequence generation such as alternate days, patient numbers) as they are associated with a high risk of bias.
Types of participants
Menopausal women: women who are going through the menopausal transition or women who are postmenopausal.
Perimenopause: the period of menopausal transition leading to a natural menopause, which ends 12 months after the final menstrual period. A specific staging can be found in the Stages of Reproductive Aging Workshop (STRAW) + 10 criteria (Harlow 2013).
Postmenopause: after one year with absence of menses and with follicle stimulating hormone (FSH) levels > 40 IU/L; also women following surgical menopause (removal of both ovaries) will be included.
Types of interventions
Trials comparing any dose and form of DHEA by any route of administration versus any other active intervention, placebo or no treatment were eligible for inclusion. Treatment duration was at least one week.
Types of outcome measures
Primary outcomes
Effectiveness
General wellbeing or quality of life (as defined by different scoring scales for example the Psychological General Well‐Being Index (PGWB), the Medical Outcomes Study 36‐item short form survey (SF‐36), Life Satisfaction Index‐Z (LSI‐Z), Satisfaction with Life Scale (SWLS), Health Status Questionnaire (HSQ), Quality of Life scale (QoL), Beck Depression Inventory (BDI), Hamilton Depression Scale (HDRS)).
Any adverse effects
Adverse effects were described as they had been reported in the studies (for example events of breast cancer, cardiovascular events or androgenic side effects).
Secondary outcomes
Menopausal symptoms (for example vaginal dryness, hot flushes, night sweats) defined by different scoring scales including the Menopause Rating Scale (MRS) (Heinemann 2004), Kupperman Index (KI) and Greene Climacteric Scale (GCS).
Sexual function (for example libido, dyspareunia, satisfaction) defined by different scoring scales including the Female Sexual Function Index (FSFI), Brief Index of Sexual Functioning for Women (BISF‐W), Changes in Sexual Functioning Questionnaire (CSFQ), Derogatis Interview for Sexual Functioning (DISF/DISF‐SR), Golombok‐Rust Inventory of Sexual Satisfaction (GRISS).
Search methods for identification of studies
We searched for all published and unpublished randomised controlled trials (RCTs) investigating the effects of DHEA in menopausal women, without language restriction and in consultation with the Menstrual Disorders and Subfertility Group (MDSG) Trials Search Co‐ordinator. We used EndNote for the bibliographic management of references found in the search output.
Electronic searches
(1) We searched the following electronic databases, trial registers and websites from inception to the present: Menstrual Disorders and Subfertility Group (MDSG) Specialised Register of controlled trials (Appendix 1), the Cochrane Central Register of Controlled Trials (CENTRAL) in The Cochrane Library (Appendix 2), MEDLINE (Appendix 3), EMBASE (Appendix 4), PsycINFO (Appendix 5) and CINAHL (Appendix 6). The MEDLINE search has been combined with the Cochrane highly sensitive search strategy for identifying RCTs which appears in the Cochrane Handbook for Systematic Reviews of Interventions (Version 5.0, chapter 6, 6.4.11). The EMBASE, PsycINFO and CINAHL searches were combined with trial filters developed by the Scottish Intercollegiate Guidelines Network (SIGN) (www.sign.ac.uk/methodology/filters.html#random).
(2) Other electronic sources of trials were included (Appendix 7).
• Trial registers for ongoing and registered trials:
o www.clinicaltrials.gov (a service of the US National Institutes of Health),
o www.who.int/trialsearch/Default.aspx (World Health Organization International Clinical Trials Registry Platform search portal).
• DARE (Database of Abstracts of Reviews of Effects) in The Cochrane Library at http://onlinelibrary.wiley.com/o/cochrane/cochrane_cldare_articles_fs.html (for reference lists from relevant non‐Cochrane reviews).
• Web of Knowledge at http://wokinfo.com/ (another source of trials and conference abstracts).
• OpenGrey at www.opengrey.eu/ for unpublished literature from Europe.
• LILACS database at http://regional.bvsalud.org/php/index.php?lang=en (for trials from the Portuguese and Spanish speaking world).
• PubMed and Google (for recent trials not yet indexed in MEDLINE).
Searching other resources
3. We handsearched reference lists of articles retrieved by the search and contacted experts in the field to obtain additional data. We also handsearched relevant journals and conference abstracts that are not covered in the MDSG Specialised Register, in liaison with the Trials Search Co‐ordinator.
Data collection and analysis
Selection of studies
Only RCTs studying the effectiveness and safety of DHEA administration to menopausal women were included. Data from crossover trials was included and analysed using the generic inverse variance method. The authors independently scanned the titles and abstracts of the articles retrieved by the search. Full texts of potentially eligible studies were retrieved and examined independently by the authors. The full text articles were selected according to the inclusion criteria. In the case of doubts or disagreement between the two authors, a third author was consulted to gain consensus on whether to include the trial or not. The selection process was documented with a Preferred Reporting Items for Systematic Reviews and Meta‐Analyses (PRISMA) flow chart.
Data extraction and management
The data obtained were extracted by two review authors. In the case of a disagreement between the two authors, a third author was consulted to achieve consensus. Data were extracted by using a data extraction form designed and pilot tested by the authors. If studies were reported in multiple publications, the data were extracted from the different publications and were combined into a single data extraction form so no data went missing. The following characteristics of included studies were included in the extraction form: methods, participants, interventions and outcomes.
Assessment of risk of bias in included studies
To assess the risk of bias in the included studies the Cochrane Collaboration's recommended tool is a domain based evaluation. We used this tool to assess the following domains and divide the assessments into high, unclear or low risk of bias.
-
Selection bias (random sequence generation, allocation concealment).
-
Performance bias (blinding of participants and personnel).
-
Detection bias (blinding of outcome assessment).
-
Attrition bias (incomplete outcome data).
-
Reporting bias (selective reporting).
-
Other bias (other sources of bias).
Disagreements were resolved by discussion or by a third review author. We described all judgements fully and presented the conclusions in the risk of bias table, which was incorporated into the interpretation of review findings by means of sensitivity analyses (see below). We took care to search for within‐trial selective reporting, such as trials failing to report obvious outcomes, or reporting them in insufficient detail to allow inclusion. We sought published protocols and compared the outcomes between the protocol and the final published study.
Measures of treatment effect
For dichotomous data we used the numbers of events in the control and intervention groups of each study to calculate the Mantel‐Haenszel odds ratios (ORs). For continuous data, if all studies reported the same outcomes we calculated mean differences (MDs) between treatment groups. If similar outcomes were reported on different scales, we calculated the standardised mean difference (SMD). We treated ordinal data as continuous data. We calculated 95% confidence intervals (CIs) for all outcomes. Where data for the calculation of ORs or MDs were not available we used the most detailed numeric data available that facilitated similar analyses of included studies.
Unit of analysis issues
The primary analysis was done per woman randomised. Data that did not allow valid analysis were briefly summarized in an additional table and were not included in the meta‐analysis. Statistical advice was sought regarding the analysis of crossover trials to facilitate the appropriate inclusion of crossover data in the meta‐analysis.
Dealing with missing data
If relevant data were missing from an included study the original investigators of the trial were contacted to request the missing data from them. If the original investigator could not be contacted or did not reply, we determined whether to include or exclude the trial or only include the data that were fully available. If variance data for the primary outcome were missing (for example SD) then these were imputed from the range where possible.
Assessment of heterogeneity
We considered whether the clinical and methodological characteristics of the included studies were sufficiently similar for meta‐analysis to provide a clinically meaningful summary. Statistical heterogeneity was assessed by determining the I² statistic. We assumed that there was substantial heterogeneity when I² was calculated to be greater than 50% (Higgins 2003; Higgins 2011).
Assessment of reporting biases
In view of the difficulty of detecting and correcting for publication bias and other reporting biases, the authors aimed to minimise their potential impact by ensuring a comprehensive search for eligible studies and by being alert to duplication of data. If there were 10 or more studies in an analysis, we planned to use a funnel plot to explore the possibility of small study effects (a tendency for estimates of the intervention effect to be more beneficial in smaller studies); this however was not performed.
Data synthesis
Where sufficient data were available, data were combined for the primary outcomes by using a fixed‐effect model. The following comparisons were made:
1. DHEA versus control (placebo or no intervention);
2. Oral versus other routes of administration (e.g. intravaginal DHEA, transdermal patches);
3. DHEA versus HT (estrogen and progesterone in combination (ET + P) and separately (ET or P), androgen therapy or tibolone);
4. DHEA versus any other medical treatment (e.g. antidepressants or clonidine);
5. DHEA versus any other non‐medical treatment (e.g. non‐medical therapies such as acupuncture or complementary therapies).
Subgroup analysis and investigation of heterogeneity
Where sufficient data were available, we conducted subgroup analyses for the primary outcomes to determine the separate evidence within the following subgroups:
1. BMI (< 18 kg/m2, 18 to 25 kg/m2, > 25 kg/m2);
2. menopausal status (peri‐ or postmenopausal);
3. duration of the intervention (≤ 6 weeks, > 6 to 26 weeks, > 26 weeks);
4. younger female (< 40 years, after bilateral oophorectomy or premature ovarian insufficiency);
5. hyposexual desire disorder or low libido;
6. inflammatory disease (e.g. systemic lupus erythematosus (SLE), Sjögren syndrome);
7. breast cancer.
In addition to the above we conducted a post hoc subgroup analysis by route of administration. Initially we had planned to look at studies comparing different routes but as there were no studies with this comparison we have opted to do a subgroup analysis to look at this evidence.
If we detected substantial heterogeneity we explored possible explanations in sensitivity analyses. We took any statistical heterogeneity into account when interpreting the results, especially if there was any variation in the direction of effect.
Sensitivity analysis
We conducted sensitivity analyses for the primary outcomes to determine whether the conclusions were robust to arbitrary decisions made regarding the eligibility and analysis of studies. These analyses were included and considered whether the review conclusions would have differed if:
1. eligibility was restricted to studies without high risk of bias;
2. a random‐effects model had been adopted;
3. alternative imputation strategies had been implemented;
4. the summary effect measure was relative risk (RR) rather than odds ratio (OR).
We also conducted a post hoc sensitivity analysis by removing a study at high risk of bias from the sexual function secondary outcome.
Overall quality of the body of evidence: summary of findings table
We prepared a summary of findings table using GRADEpro or Guideline Development Tool software. This table evaluated the overall quality of the body of evidence for the primary review outcomes (general wellbeing or quality of life and adverse effects) using the GRADE criteria (study limitations, consistency of effect, imprecision, indirectness and publication bias). Judgements about the quality of evidence (high, moderate or low) have been justified, documented and incorporated into the reporting of results for each outcome.
Results
Description of studies
Results of the search
The search retrieved a total of 2277 titles with abstracts. These were screened to identify whether the intervention and study populations met the inclusion criteria. After this initial screening we retrieved the full text of 76 trials for assessment of eligibility and inclusion in the meta‐analyses of this review. This process is reflected in the PRISMA flow chart (Figure 2). Of the 76 publications assessed, 17 were duplicate publications, resulting in a total of 59 individual trials. Of the 59 studies assessed, 28 were included, 25 excluded, 4 are awaiting classification and 2 trials were ongoing.

Study flow diagram.
Included studies
A total of 28 trials met the criteria for inclusion. Twelve studies were conducted in the USA (Amin 2005; Barnhart 1999; Casson 1998; Dayal 2005; Hirshman 2003; Hirshman 2004; Kratz 2000; Kritz‐Silverstein 2008; Merritt 2012; Mortola 1990; Stanczyk 2009; Stangl 2010), five in Italy (Genazzani 2011; Lasco 2001; Pluchino 2008; Silvestri 2005; Stomati 1999), four in Canada (El‐Alfy 2010; Labrie 1997; Labrie 2008; Labrie 2009a), one each in Australia (Panjari 2009), France (Nouveau 2008), India (Gupta 2013), Israel (Bloch 2013), Spain (Gomez‐Santos 2011), Sweden (Forsblad‐d'Elia 2009) and Switzerland (Finckh 2005). We were unable to retrieve the full text of one study (Amin 2005). Attempts were made to contact all authors of the included studies to obtain additional data and for clarification.
Participants
A total of 1273 women were randomised in the 28 included studies. The total study population was 1207 postmenopausal women and 66 perimenopausal women. All studies but one (Barnhart 1999) included postmenopausal women only. One study included 100 menopausal women after surgery only (Gupta 2013). Overall, the age ranged from 36 to 80 years. Women from different ethnicities were included, but not all studies reported on this. The most reported group was Caucasian women. A total of 33% of the studies included healthy menopausal women (for example without serious comorbidity, not using medication). Two studies only included women with specific comorbidities: Sjögren syndrome (Forsblad‐d'Elia 2009) and fibromyalgia (Finckh 2005). Two studies included menopausal women with complaints of vaginal dryness, irritation or itching, or dyspareunia (Labrie 2008; Labrie 2009a). Two studies included women with hypoactive sexual desire disorder or low libido (Bloch 2013; Panjari 2009). One study included women with an increased cardiovascular risk (Silvestri 2005). The remaining studies did not report health status or comorbidities of the women who were included.
Study design
Nineteen parallel‐designed RCTs and nine crossover‐designed trials (Finckh 2005; Forsblad‐d'Elia 2009; Hirshman 2003; Hirshman 2004; Labrie 1997; Merritt 2012; Mortola 1990; Silvestri 2005; Stangl 2010) were included in the review. Fifteen studies were included for (quantitative) meta‐analysis.
Interventions
The following comparisons were made in the included studies: DHEA versus placebo, head‐to‐head (DHEA versus other active treatment) comparisons, and DHEA versus no treatment. There were a total of:
-
23 included trials comparing DHEA versus placebo (Amin 2005; Barnhart 1999; Bloch 2013; Casson 1998; Dayal 2005; El‐Alfy 2010; Finckh 2005; Forsblad‐d'Elia 2009; Gomez‐Santos 2011; Hirshman 2003; Hirshman 2004; Kratz 2000; Kritz‐Silverstein 2008; Labrie 1997; Labrie 2008; Labrie 2009a; Lasco 2001; Merritt 2012; Mortola 1990; Nouveau 2008; Panjari 2009; Stanczyk 2009; Stangl 2010);
-
six included trials comparing DHEA versus HT (Dayal 2005; Genazzani 2011; Gupta 2013; Pluchino 2008; Silvestri 2005; Stomati 1999). HT included estrogen therapy (ET); conjugated equine estrogen (Dayal 2005; Gupta 2013); transdermal estradiol alone (Stomati 1999); transdermal estradiol plus oral progesterone (ET + P) (Pluchino 2008) or oral estradiol plus dihydrogesterone (ET + P) (Genazzani 2011);
-
three trials compared DHEA versus tibolone (a synthetic steroid hormone with estrogen and androgens as metabolites) (Genazzani 2011; Gupta 2013; Silvestri 2005);
-
one trial compared DHEA versus no treatment (Gupta 2013).
Routes of administration
-
A total of 24 trials used oral administration of DHEA (Amin 2005; Barnhart 1999; Bloch 2013; Casson 1998; Dayal 2005; Finckh 2005; Forsblad‐d'Elia 2009; Genazzani 2011; Gomez‐Santos 2011; Gupta 2013; Hirshman 2003; Hirshman 2004; Kratz 2000; Kritz‐Silverstein 2008; Lasco 2001; Merritt 2012; Mortola 1990; Panjari 2009; Pluchino 2008; Silvestri 2005; Stanczyk 2009; Stangl 2010; Stomati 1999).
Daily doses for oral administration of DHEA varied between 10 mg and 1600 mg. One trial used a daily dose of 1600 mg; 2 trials 100 mg/day; 12 trials 50 mg/day; 1 trial 40 mg/day; 5 trials 25 mg/day; 2 trials 10 mg/day.
-
A total of three trials used skin application for DHEA (creams) (El‐Alfy 2010; Labrie 1997; Nouveau 2008).
-
Two trials used intravaginal administration of DHEA (Labrie 2008; Labrie 2009a).
Outcomes
Primary outcome: effectiveness (quality of life, general wellbeing)
Fourteen studies reported quality of life or wellbeing. The results from 11 of these trials could be included in a meta‐analysis (Barnhart 1999; Bloch 2013; Dayal 2005; Finckh 2005; Hirshman 2003; Hirshman 2004; Kritz‐Silverstein 2008; Labrie 1997; Labrie 2009a; Merritt 2012; Panjari 2009; Stangl 2010); nine trials reported end scores for quality of life scales after treatment (Bloch 2013; Dayal 2005; Finckh 2005; Hirshman 2003; Hirshman 2004; Kritz‐Silverstein 2008; Merritt 2012; Panjari 2009; Stangl 2010) whereas two studies reported change scores (difference between baseline and end scores) (Barnhart 1999; Labrie 2009a). Three trials (Amin 2005; Kratz 2000; Labrie 1997) investigated quality of life or wellbeing but required additional data for inclusion in the meta‐analysis.
Different questionnaires were used to assess quality of life including: Beck Depression Inventory (BDI) (Hirshman 2003; Hirshman 2004; Kritz‐Silverstein 2008; Merritt 2012; Stangl 2010), Symptom Checklist‐90 (SCL‐90) (Merritt 2012; Stangl 2010), Women's Health Questionnaire (WHQ) (Dayal 2005), Psychological General Well‐Being Index (PGWBI) (Finckh 2005; Labrie 2009a; Panjari 2009), Hamilton Depression Rating Score (HAM‐D) (Barnhart 1999), SmithKline Beecham Quality of Life Self Report Questionnaire (SKQOL) (Barnhart 1999), Life Satisfaction Inventory‐Z (LSI‐Z) (Kritz‐Silverstein 2008), Short Form Health Survey (SF‐36) (Kritz‐Silverstein 2008), Satisfaction With Life Scale (SWLS) (Kritz‐Silverstein 2008), Mental Health Inventory (MHI) (Bloch 2013) and Menopause‐specific Quality of Life Questionnaire (MENQOL) (Labrie 2009a; Panjari 2009). If studies used multiple questionnaires to assess quality of life we included scores from questionnaires that were validated and used in most publications (BDI, PGWBI and SCL‐90). Where these questionnaires were not used, we included the scales we judged as most representative for quality of life.
Primary outcome: adverse effects
A total of 23 studies reported on side effects. Five trials could be included for meta‐analysis; four trials that used oral administration (Bloch 2013; Finckh 2005; Lasco 2001; Panjari 2009) and one trial that used intravaginal administration (Nouveau 2008). Other studies could not be included for meta‐analysis for the following reasons: 10 studies reported that there were no side effects (Casson 1998; Genazzani 2011; Gomez‐Santos 2011; Hirshman 2003; Hirshman 2004; Pluchino 2008; Silvestri 2005; Stanczyk 2009; Stomati 1999); one study reported there were no significant side effects (Labrie 2008), and for one study the author confirmed that there were no significant side effects found (Labrie 2009a); two studies only reported adverse effects for women discontinuing the study (Barnhart 1999; El‐Alfy 2010), it was unclear whether there were any (non‐significant) side effects reported for these studies; one study, which had male and female participants, did not separate side effects by sex and could therefore not be included (Kritz‐Silverstein 2008); only one trial reported adverse effects for DHEA versus HT and tibolone (Gupta 2013); results from most crossover trials (Forsblad‐d'Elia 2009; Labrie 1997; Mortola 1990) could not be included due to lack of data (no combined statistical tests were done for adverse effects). Attempts were made to contact all authors to request additional data.
Adverse effects that were reported for DHEA treatment but could not be included for meta‐analysis due to lack of information, as described above, were as follows:
acne (Labrie 1997), hirsutism (Forsblad‐d'Elia 2009; Labrie 1997; Mortola 1990), contact dermatitis (El‐Alfy 2010), parasthesia and numbness of upper extremity (Barnhart 1999), depressiveness (Forsblad‐d'Elia 2009), calf cramps (Forsblad‐d'Elia 2009), increase in nightly dreams (Forsblad‐d'Elia 2009) and dizziness (Forsblad‐d'Elia 2009).
Secondary outcome: menopausal symptoms
Five studies investigated the effect of the intervention on menopausal symptoms (Barnhart 1999; Dayal 2005; Genazzani 2011; Gupta 2013; Stomati 1999). Five studies reported continuous outcomes using scales to assess menopausal symptoms, three studies reported end scores after treatment and could be combined for meta‐analysis. Scales used were: Green Climacteric Scale (Genazzani 2011), Kupperman Index (Stomati 1999) and an element of the Woman's Health Questionnaire (Dayal 2005). Two studies could not be included for meta‐analysis because one study reported change scores (Barnhart 1999) and the other study reported dichotomous outcomes (Gupta 2013).
Secondary outcome: sexual function
A total of eight studies investigated sexual function as an outcome (Bloch 2013; Dayal 2005; Finckh 2005; Genazzani 2011; Kritz‐Silverstein 2008; Labrie 2009a; Mortola 1990; Panjari 2009). Six studies reported end scores after treatment whereas one study reported change scores (Barnhart 1999) and could therefore not be included in this meta‐analysis. Different parameters were used to assess sexual function including: the McCoy Female Sexuality Score (MFSQ), Female Sexual Function Index (FSFI), Derogatis Interview for Sexual Functioning (DISF), Sabbatsberg Sexual Self‐rating Scoring (SSS) and Abbreviated Sexual Function Questionnaire (ASFQ). The most used questionnaires were the MFSQ and FSFI. One study stated that no changes in sexual drive had been reported but did not use a tool to quantify sexual drive (Mortola 1990). Most studies utilised questionnaires with a total score to represent sexual function as a whole as opposed to splitting up the various elements such as libido, dyspareunia etc. Where studies did provide scores for the separate elements of sexual function, libido was chosen as the function to represent sexual function. There were not enough data from the studies to undertake meaningful subanalyses of the various elements of sexual function.
Excluded studies
We excluded 25 studies: 8 studies were excluded because they were non‐randomised controlled trials (Buster 2009; Chassany 2000; Labrie 2013; Ott 2014; Rodrigo Pegado 2012; Stoll 1999; Yasui 2012; Zouboulis 2012); 1 study was quasi‐randomised (Carranza‐Lira 2002); 7 studies were excluded because the study population did not meet the criteria for inclusion in this review (women were premenopausal) (Barton 2006; Hartkamp 2004; Kamath 1998; Lovas 2003; Sanchez‐Guerrero 2008; Stein 2011; Virkki 2010); 1 study because the treatment duration was less than a week (Hackbert 2002); 8 studies because of different study purposes, 7 of these studies were aimed at pharmacokinetics (Bates 1995; Buster 1992; Calvo 2008; Casson 1993; Casson 1995; Caufriez 2013; Pisarska 1998) and 1 was aimed at exercise tolerance (Burger 2003) and they were unlikely to have investigated our outcomes. We attempted contacting all authors to request additional data. Unfortunately no additional data became available.
Risk of bias in included studies
See Figure 3 for a summary of the risk of bias for each individual trial and Figure 4 for a summary of each risk of bias item across all included trials.

Risk of bias summary: review authors' judgements about each risk of bias item for each included study.

Risk of bias graph: review authors' judgements about each risk of bias item presented as percentages across all included studies.
Allocation
Sequence generation
Of all 28 included trials, 19 were randomised with a parallel design and 9 were randomised with a crossover design. Seventeen trials described their methods of sequence generation, which were usually computer‐generated, randomised block schemes or random number tables (Barnhart 1999; Bloch 2013; Casson 1998; Dayal 2005; Finckh 2005; Forsblad‐d'Elia 2009; Genazzani 2011; Hirshman 2003; Hirshman 2004; Lasco 2001; Merritt 2012; Nouveau 2008; Panjari 2009; Pluchino 2008; Silvestri 2005; Stanczyk 2009; Stangl 2010). Eleven trials simply reported the trial as randomised without a description of the randomisation method (Amin 2005; El‐Alfy 2010; Gomez‐Santos 2011; Gupta 2013; Kratz 2000; Kritz‐Silverstein 2008; Labrie 1997; Labrie 2008; Labrie 2009a; Mortola 1990; Stomati 1999).
Allocation concealment
Nine trials described their allocation concealment as a sequentially numbered list kept by the pharmacy, a non‐investigator or using sealed envelopes (Barnhart 1999; Bloch 2013; Dayal 2005; Finckh 2005; Forsblad‐d'Elia 2009; Lasco 2001; Panjari 2009; Silvestri 2005; Stanczyk 2009). Nineteen trials did not describe allocation concealment. Attempts were made to contact these authors to clarify allocation concealment techniques, unfortunately we were unable to retrieve the information needed.
Blinding
Blinding of participants and personnel
Fourteen studies (Barnhart 1999; Bloch 2013; Dayal 2005; Finckh 2005; Forsblad‐d'Elia 2009; Genazzani 2011; Hirshman 2003; Hirshman 2004; Lasco 2001; Merritt 2012; Nouveau 2008; Panjari 2009; Stanczyk 2009; Stangl 2010) described blinding methods that we graded as low risk. Blinding in these trials was done by using treatments looking identical in appearance (for example identical looking DHEA and placebo capsules or creams). In some trials personnel were described as blinded as well, but the majority of the studies did not report on blinding personnel. Five studies (Genazzani 2011; Gupta 2013; Labrie 1997; Pluchino 2008; Stomati 1999) were graded as high risk for bias as they were not blinded. These trials compared different active treatments that were applied differently (for example transdermal patches versus oral capsules) or had different appearances. Nine studies (Amin 2005; El‐Alfy 2010; Gomez‐Santos 2011; Kratz 2000; Kritz‐Silverstein 2008; Labrie 2008; Labrie 2009a; Mortola 1990; Silvestri 2005) did not describe their blinding process and were therefore graded as at unclear risk of bias.
Blinding of outcome assessments
If blinding was unlikely to have been broken for participants it was unlikely that the outcomes were influenced as the outcomes were generally done by self‐assessment, for all outcomes. If a trial was not blinded it was likely that this may have influenced the outcomes. Therefore trials that did not use blinding were graded as high risk of bias for blinding. We judged the remaining trials as unclear as it was unclear whether blinding was done or was likely to have been broken.
Incomplete outcome data
Ten studies analysed all or most women who were randomised (> 95%) and we judged them to be at low risk of bias (Barnhart 1999; Bloch 2013; Finckh 2005; Forsblad‐d'Elia 2009; Genazzani 2011; Hirshman 2004; Labrie 2009a; Lasco 2001; Panjari 2009; Pluchino 2008). Eighteen studies did not provide data on how many women completed the trial and were included for analysis and they were therefore graded as unclear.
Selective reporting
An official protocol was only available for one study, which reported all outcomes described as in the protocol (Bloch 2013). Two studies (Dayal 2005; Stangl 2010) did not report on one outcome each (daily symptom rates, SCL‐90 scores) that were mentioned in their methods sections, but there was availability for other outcomes that were included and therefore overall bias was graded as unclear. For the remaining studies the official protocols were not found or retrieved but no missing data were found comparing outcomes measured in the methods sections and the results sections, we judged these studies as unclear. One study did not report the outcomes described in their study methods and had no other data available for meta‐analysis and was therefore graded as high risk of bias (Gomez‐Santos 2011).
Other potential sources of bias
In one study no descriptions of randomisation, allocation, blinding and attrition were reported and due to a difference in baseline scores the end scores were not reliable for both quality of life and sexual function. Due to this combination of factors the risk of bias was deemed high (Kritz‐Silverstein 2008). We found no potential sources of within‐study bias in the remaining studies.
Effects of interventions
See: Summary of findings for the main comparison DHEA compared to control (placebo or no treatment) for women in the peri‐ or postmenopausal phase; Summary of findings 2 Oral DHEA versus control subgrouped by differing routes of administration for women in the peri‐ or postmenopausal phase; Summary of findings 3 DHEA versus HT for women in the peri‐ or postmenopausal phase
1. DHEA versus control
1.1 Quality of life (QoL): DHEA versus control (placebo or no treatment) (end scores)
DHEA did not significantly improve quality of life or wellbeing end scores compared to placebo (SMD ‐0.04, 95% CI ‐0.20 to 0.13, P = 0.67, 9 studies, 402 women (247 from parallel and 155 from crossover trials), I² = 67%) (Analysis 1.1). There were no studies that compared DHEA to no treatment for quality of life or wellbeing.
1.2 Quality of life (QoL): DHEA versus control (placebo or no treatment) (end scores) sensitivity analysis
As the I² value was greater than 50%, we repeated the analysis but this time we restricted eligibility to studies without a high risk of bias (SMD 0.16, 95% CI ‐0.03 to 0.34, P = 0.10, 8 studies, 287 women (132 from parallel and 155 from crossover trials), I² = 0%, moderate quality evidence) (Analysis 1.2; Figure 5). No large differences in treatment effect were found after conducting the sensitivity analysis. The heterogeneity observed in 1.1 was found to be caused by one study (Kritz‐Silverstein 2008). This study showed imbalanced baseline scores and did not report information on the randomisation technique, allocation, blinding and attrition and was therefore graded as high risk of bias. We judged the end scores of this study to be unreliable as they did not represent the effect of the treatment due to the imbalanced baseline scores for quality of life. Therefore, we chose to present the result of the sensitivity analysis as the main result.
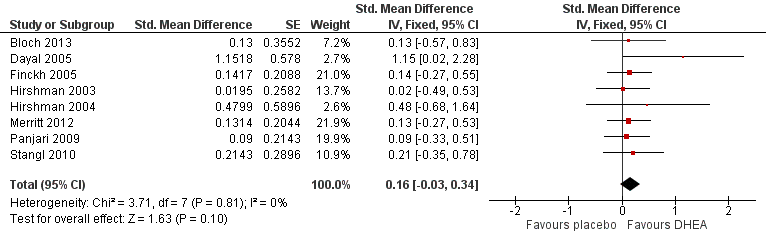
Forest plot of comparison: 1 DHEA versus control (placebo or no treatment), outcome: 1.2 Sensitivity analysis QoL and wellbeing (end scores).
The findings from two studies that could not be included for meta‐analysis due to lack of data (no scores available) agreed with the results above (Kratz 2000; Labrie 1997). One other study that lacked data for inclusion and only had an abstract available (Amin 2005) reported a slight decrease of quality of life in the placebo group compared to DHEA treatment.
1.3 and 1.4 Quality of life (QoL): DHEA versus control ‐ subgrouped based on low libido or hypoactive sexual desire disorder (HSDD) and treatment duration
See 'overall subgroups'.
1.5 Quality of life (QoL): DHEA versus control (placebo or no treatment) (change scores)
Two studies reported change scores (difference between baseline and end scores) (Barnhart 1999; Labrie 2009a). These could not be pooled due to a high level of heterogeneity (I² = 94%). Sensitivity analysis did not change this. Heterogeneity may be explained by route of administration. One study administered DHEA orally (Labrie 2009a) whereas the other study used intravaginal application (see Analysis 2.1).
1.6 Adverse effects: DHEA versus control (placebo or no treatment)
Nine studies reported there were no side effects found at all (Casson 1998; Genazzani 2011; Gomez‐Santos 2011; Hirshman 2003; Hirshman 2004; Pluchino 2008; Silvestri 2005; Stanczyk 2009; Stomati 1999). For one study comparing DHEA with placebo (Labrie 2008) the author confirmed there were no significant side effects found, but it was unclear whether there were any minor adverse effects. There were no studies that compared DHEA to no treatment.
The results for androgenic side effects could only be pooled for acne and androgenic side effects (Bloch 2013; Finckh 2005; Lasco 2001; Nouveau 2008; Panjari 2009). The results showed evidence of an association with androgenic side effects (mainly acne) in 15% of the women on DHEA versus < 3% of women on placebo (OR 3.77, 95% CI 1.36 to 10.40, P = 0.01, 5 studies, 376 women, I² = 10%, moderate quality evidence). One study (Panjari 2009) reported on hirsutism as an androgenic side effect but was included for acne already. Therefore, this study could not be pooled for hirsutism as well due to risk of double counting participants.
1.6.1. Androgenic side effects: DHEA versus control (placebo or no treatment)
Due to lack of data we could not combine hirsutism, acne and a greasy skin into overall 'androgenic side effects' for meta‐analysis. Only one study (Finckh 2005) reported androgenic side effects as a total (including acne, greasy skin and hirsutism). Therefore a meta‐analysis could not be conducted. This study showed an association between androgenic side effects and DHEA treatment.
1.6.2. Acne: DHEA versus control (placebo or no treatment)
There were no significant differences found in the frequency of acne between DHEA and placebo (OR 2.26, 95% CI 0.56 to 9.02, P = 0.25, 4 studies, 158 women, I² = 0%, moderate quality evidence) (Analysis 1.6; Figure 6). Two studies (Forsblad‐d'Elia 2009; Labrie 1997) reported on acne as a side effect of DHEA treatment. For one study it was unclear whether this adverse effect was investigated for placebo as well (Labrie 1997) and the other study was a crossover trial which had no data available for paired tests on adverse effects (Forsblad‐d'Elia 2009).

Forest plot of comparison: 1 DHEA versus control (placebo or no treatment), outcome: 1.6 Side effects.
1.6.3. Flushes: DHEA versus control (placebo or no treatment)
A meta‐analysis could not be conducted as only one study reported sufficient data for flushes as a side effect (Bloch 2013). This study did not show an association between flushes and DHEA treatment. Data could not be pooled with other adverse effects due to the risk of double counting participants.
1.6.4. Hirsutism: DHEA versus control (placebo or no treatment)
A meta‐analysis could not be conducted because only one study reported sufficient data for hirsutism as a side effect (Panjari 2009). This study did not show an association between hirsutism and DHEA treatment (OR 4.89, 95% CI 0.23 to 104.76). Data could not be pooled with other adverse effects due to the risk of double counting participants.
1.7 Adverse effects: DHEA versus control ‐ acne subgrouped based on study duration
See 'subgroups overall'.
1.8 Menopausal symptoms: DHEA versus control (placebo or no treatment) (continuous)
Insufficient data were available to conduct a meta‐analysis for DHEA versus placebo (Analysis 1.8). Two studies reported menopausal symptoms as a continuous outcome, one study (including 17 postmenopausal women) reported end scores (Dayal 2005) whereas the other study (including 66 perimenopausal women) reported change scores (Barnhart 1999). Both studies showed no decrease in menopausal symptoms for DHEA.
1.9 Menopausal symptoms: DHEA versus control (placebo or no treatment) (dichotomous)
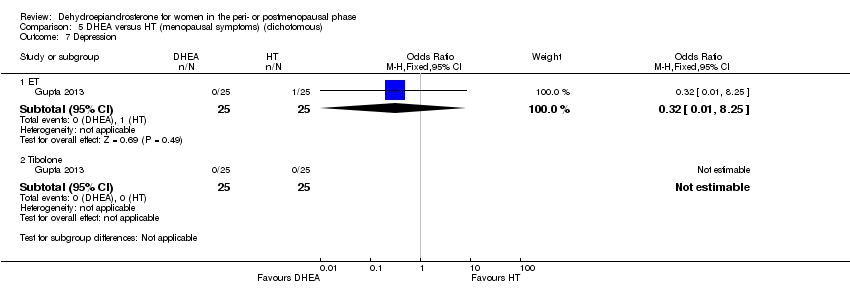
Only one study (Gupta 2013) compared DHEA versus no treatment in 50 menopausal women after surgery, therefore a meta‐analysis could not be conducted. This trial showed a decrease in menopausal symptoms, for tiredness, night sweats and loss of libido. Other menopausal symptoms reported (hot flushes, insomnia, depression, vaginal dryness and pruritis vulvae) did not differ for the DHEA treatment and no treatment groups. This study was not blinded and this may have influenced the outcome.
1.10 Sexual function: DHEA versus control (placebo or no treatment)
DHEA may have improved sexual function (SMD 0.19, 95% CI ‐0.01 to 0.40, P = 0.06, 6 studies, 376 women (354 women from parallel trials and 22 women from crossover trials), I² = 10%) (Figure 7). However, one trial including 115 postmenopausal women (Kritz‐Silverstein 2008) showed imbalanced baseline scores and did not report information on the randomisation technique, allocation, blinding and attrition and was therefore graded as at high risk of bias. Therefore, we chose to conduct a sensitivity analysis.

Forest plot of comparison: 1 DHEA versus control (placebo or no treatment), outcome: 1.11 Sexual function (end scores).
1.11 Sexual function: DHEA versus control (placebo or no treatment) sensitivity analysis
After conducting a post hoc sensitivity analysis excluding one study with a high risk of bias, DHEA was shown to be significantly more effective on sexual function compared to placebo (SMD 0.31, 95% CI 0.07 to 0.55, P = 0.01, 5 studies, 261 women (239 women from parallel trials and 22 women from crossover trials), I² = 0%, moderate quality of evidence) (Figure 8). We judged the end scores of the excluded study to be unreliable as it did not represent the effect of the treatment found in this study due to imbalanced baseline scores for sexual function. Therefore, we choose to present the results of the sensitivity analysis as the main results. The reported improvement in sexual function was minimal although significant and may not be clinically significant as, for example, an SMD of 0.31 would translate to a change of only 2.3 points on the Sabbatsberg‐Sexual Self rating (SSS) scale, which ranges from 0 to 84. No studies investigated DHEA versus no treatment.

Forest plot of comparison: 1 DHEA versus control (placebo or no treatment), outcome: 1.11 Sexual function (end scores) (sensitivity analysis).
2. Oral versus other routes of administration (e.g. intravaginal, transdermal patches)
No studies directly compared oral DHEA versus other routes of administration. Therefore, we chose to compare studies using oral DHEA versus studies that used different routes of administration of DHEA.
2.1 Quality of life (QoL): oral DHEA versus control subgrouped by route of administration (e.g. intravaginal, transdermal patches)
There were insufficient data available to conduct a meta‐analysis for effectiveness based on route of administration (Analysis 2.1). Only one trial (including 107 postmenopausal women) that investigated a different route of administration than oral administration (intravaginal application) reported QoL change scores (Labrie 2009a); and only one trial studied oral DHEA and reported change scores for QoL (Barnhart 1999). The I² value was greater than 50% (94%) therefore these studies could not be pooled for meta‐analysis. Intravaginal administration showed a beneficial effect for DHEA on QoL, whereas the other study did not show any differences in treatment effect.
2.2 Adverse effects: oral DHEA versus control subgrouped by route of administration (e.g. intravaginal DHEA, transdermal patches)
No evidence was found that acne was associated more with oral application of DHEA (OR 2.16, 95% CI 0.47 to 9.96, P = 0,90, 3 studies, 136 women, I² = 5%, very low quality of evidence) than with skin application of DHEA (OR 2.74, 95% CI 0.10 to 74.87, P = 0,90, 1 study, 22 women, very low quality evidence), with the test for subgroup differences showing Chi² = 0.02 (df = 1, P = 0.90, I² = 0%) (Analysis 2.2). The studies that investigated intravaginal administration did not report on acne whereas acne (or other skin effects) was reported in all trials investigating skin application (El‐Alfy 2010; Labrie 1997; Nouveau 2008) and acne was reported in five more trials investigating oral administration (Bloch 2013; Finckh 2005; Forsblad‐d'Elia 2009; Lasco 2001; Panjari 2009). Data for different side effects could not be matched for an overall analysis because it was unclear if these side effects were reported in the same or different participants. This information was needed to create a proper analysis.
2.3 Menopausal symptoms: oral DHEA versus control subgrouped by route of administration (e.g. intravaginal DHEA, transdermal patches)
There were no trials using other routes of administration that investigated menopausal symptoms as an outcome.
2.4 Sexual function: oral DHEA versus control subgrouped by route of administration (e.g. intravaginal DHEA, transdermal patches)
No significant differences were found between studies looking at oral administration (SMD 0.11, 95% CI ‐0.13 to 0.35, P = 0.36, 5 studies, 340 women, I² = 0) and a study using intravaginal DHEA (SMD 0.42, 95% CI 0.03 to 0.81, 1 study, 218 women) with the test for subgroup differences showing Chi² = 1.77 (df = 1, P = 0.18, I² = 43.4%) (Analysis 2.4). One trial including 115 postmenopausal women (Kritz‐Silverstein 2008) reported imbalanced baseline scores and was therefore graded as high risk of bias. Therefore, we repeated the analysis but this time without studies with a high risk of bias. The results from the sensitivity analysis also revealed no evidence for differences between oral administration and intravaginal application of DHEA on sexual function (SMD 0.31, 95% CI 0.07 to 0.55, P = 0.88, 5 studies, 261 women (of which 107 received intravaginal DHEA or placebo capsules, 239 women were from parallel trials and 22 women from crossover trials), I² = 0%).
3. DHEA versus hormone therapy (HT) (estrogen and progesterone in combination and separately, androgen therapy or tibolone)
3.1 Quality of life (QoL): DHEA versus hormone therapy (HT) (estrogen and progesterone in combination and separately, androgen therapy or tibolone)
Only one study reported results of DHEA versus estrogen (Dayal 2005). Therefore a meta‐analysis could not be conducted. This study found no significant difference between treatment effects of DHEA compared to HT on QoL.
There were no trials that compared DHEA to a different form of HT for QoL or wellbeing.
3.2 Adverse effects: DHEA versus hormone therapy (HT) (dichotomous)
See 3.4.
3.3 Menopausal symptoms: DHEA versus hormone therapy (HT)
It was unclear whether DHEA differed from HT in effects on menopausal symptoms. Two studies were included for the meta‐analysis of estrogen therapy (ET) (Genazzani 2011; Stomati 1999). The I² value was greater than 50% (74%) therefore these studies could not be pooled for meta‐analysis (Analysis 3.3). One study showed a small beneficial effect on menopausal symptoms for HT (Stomati 1999) whereas the other showed a more beneficial effect for DHEA (Genazzani 2011).
One study that investigated dichotomous outcomes (type and frequency of menopausal symptoms) and could therefore not be included in the meta‐analysis showed no significant differences in frequency of various menopausal symptoms between treatments (Gupta 2013). One trial showed no difference in frequency of menopausal symptoms between treatments (Gupta 2013). One study (Genazzani 2011) including 24 postmenopausal women investigated continuous outcomes and showed a slightly beneficial effect for DHEA.
3.4 Sexual function: DHEA versus HT
DHEA did not significantly improve sexual function compared to HT. Two trials (Dayal 2005; Genazzani 2011) compared the effects of DHEA and HT on sexual function. There was no significant difference found between these treatments in these two trials (MD 1.26, 95% CI ‐0.21 to 2.73, P = 0.09, 2 studies, 41 women, I² = 0%) (Analysis 3.4).
Only one trial investigated DHEA versus tibolone (Genazzani 2011). This trial included 24 postmenopausal women and reported a beneficial effect for DHEA compared to tibolone for improvement of sexual function.
4. Adverse effects: DHEA versus HT (dichotomous)
Only one study (Gupta 2013) that included menopausal women after surgery (n = 25 received DHEA, n = 25 received conjugated equine estrogen (CEE) as ET, n = 25 received tibolone) investigated this outcome and therefore a meta‐analysis could not be conducted. This study showed an increase in reported acne and hair loss with DHEA compared to ET.
The same study (Gupta 2013) investigated DHEA versus tibolone, but other studies had investigated this comparison for adverse effects only and a meta‐analysis could not be conducted. This study showed little evidence on adverse effects associated with any of the treatments. The study reported more acne and hair loss with DHEA compared to tibolone treatment.
5. DHEA versus any other medical treatment (e.g. antidepressants or clonidine)
No trials were found for this comparison on any of following outcomes: QoL or wellbeing, adverse effects, menopausal symptoms or sexual function.
6. DHEA versus any other non‐medical treatment (e.g. non‐medical therapies such as acupuncture or complementary therapies)
No trials were found for this comparison on any of following outcomes: QoL or wellbeing, adverse effects, menopausal symptoms or sexual function.
Overall subgroups
There were no or insufficient data available to create subgroups for BMI, menopausal status, younger females, inflammatory disease and breast cancer patients. Trials that were conducted measuring low libido or HSDD could not be pooled due to high heterogeneity (I² = 67%). The heterogeneity was caused by one study with imbalanced baseline scores and a high risk of bias overall (Kritz‐Silverstein 2008). Therefore, we repeated the analysis but this time without such studies with high risk of bias. This analysis showed no differences in outcomes for any comparison. Subgroup analyses that were conducted for treatment duration did not show any differences in the outcomes for any comparison.
Discussion
Summary of main results
In this review there is no evidence from the pooled sensitivity analysis of eight studies that DHEA is associated with an improvement in quality of life or wellbeing compared to placebo, hormone therapy (HT) or no treatment. The quality of the studies in this analysis that reported quality of life was considered to be moderate (see summary of findings for the main comparison). DHEA treatment was associated with more androgenic side effects, in 15% of women (predominantly acne) compared to less than 3% in the control group. The quality of this evidence was deemed to be moderate. Nine studies reported that no side effects were found.
Limited data were available on the use of DHEA for menopausal symptoms. The results of studies that reported on menopausal symptoms were difficult to pool as their outcomes were inconsistently reported (for example as dichotomous or continuous outcomes, change and end scores) and this may explain the inconsistent results. Two studies reported beneficial effects on menopausal symptoms for DHEA (versus no treatment and HT), however one study was unblinded and may therefore have been biased. More research is needed to see whether DHEA effectively decreases menopausal symptoms.
The pooled studies reported that sexual function was potentially improved with DHEA compared to placebo. After conducting a sensitivity analysis, excluding one trial with a high risk of bias, this result changed to evidence of slightly improved sexual function with DHEA compared to placebo. However, treatment to obtain this slight improvement would not be clinically justified in light of the possible side effects with this treatment. Even though DHEA might slightly improve sexual function compared to placebo there was no evidence that DHEA improved sexual function more than HT. However, the results for DHEA versus HT were based on just two trials with small sample sizes and large confidence intervals and therefore the quality of the evidence was low.
Overall completeness and applicability of evidence
Of the 28 trials included in this review, 24 trials investigated DHEA versus control (placebo or no treatment) and 14 provided data on quality of life or wellbeing. All trials included postmenopausal women except for one trial that included perimenopausal women. The majority found evidence that DHEA does not improve quality of life. This level of evidence was judged to be moderate. No clear associations were found for any side effects, however the data for side effects were limited. In order to investigate the effects of DHEA and the risk of developing breast cancer, follow‐up should be for at least five years after the time of daily intake of DHEA.
The evidence from this review showed that DHEA did improve sexual function. However the trials were small or moderate in size and therefore more research is needed to investigate this outcome as the evidence might change. Different questionnaires were used to assess quality of life, menopausal symptoms and sexual function; in some cases these were assessed as part of a wider evaluation. Where studies did provide scores for the separate elements of sexual function, libido was chosen as the function to represent this outcome.
Three different routes of administration were reported, oral administration, intravaginal and skin application. The majority of the trials used oral administration of DHEA. There were not enough data available to investigate any differences in treatment effects for quality of life and menopausal symptoms. There were no studies that directly compared the different routes of administration of DHEA. Therefore we have separated the studies based on the route of administration and pooled these results to see if there were any differences between the different routes. No differences were found between oral administration and intravaginal application for sexual function. However only one study reported this outcome using intravaginal application, therefore the quality of the evidence is low. No differences were found for acne as an adverse effect. Again, the data were limited and the evidence is graded low.
Five out of 28 trials investigated DHEA versus HT. Not enough data were available to assess the comparative effect on quality of life. No evidence was found that DHEA improves sexual function compared to HT. Only two small trials were included and the quality of the evidence was low. Further research is needed to investigate this outcome. For menopausal symptoms, we could not pool any data and further research is needed. There were no studies for inclusion that compared DHEA to any other medical treatments or non‐medical treatments.
Quality of the evidence
The overall quality of the evidence for most outcomes was moderate or low. We downgraded the quality of the evidence to moderate for the main outcomes, mainly due to risk of bias and imprecision (summary of findings Table for the main comparison; summary of findings Table 2; summary of findings Table 3). Not all trials described their randomisation technique or methods used to conceal allocation. Overall, study sizes were small and confidence intervals varied from medium to wide. We were unable to quantify the effect of publication bias due to the small numbers of studies for any one outcome. It is possible that studies investigated our outcomes but found no treatment effect and therefore did not publish their findings.
Potential biases in the review process
If studies had a pharmacological intervention and did not report our outcomes we attempted to contact the authors for additional information. In cases where these attempts were unsuccessful, we judged these studies as either likely or unlikely to have investigated our outcomes and excluded them if they were judged to be unlikely to have investigated the outcomes. This might have introduced a slight bias in the study selection. Changes to the protocol have been made (please see Differences between protocol and review). None of the changes were made as a result of the findings of the included studies but were made to improve the structure of the review.
Agreements and disagreements with other studies or reviews
No evidence was found for improvement of quality of life in menopausal women. These findings are in agreement with findings from one other systematic review (Grimley Evans 2006) and one literature review (Panjari 2010). We found that androgenic side effects (mainly acne) were associated with DHEA. DHEA was reported to be associated with androgenic side effects in other descriptive reviews as well (Cameron 2005; Kroboth 1999; Panjari 2010). The effects of DHEA on menopausal symptoms were conflicting, and little literature is available on DHEA treatment for menopausal symptoms. One literature review stated that DHEA did not affect perimenopausal symptoms (Cameron 2005). Thus far it is still unclear whether DHEA may have a beneficial effect on menopausal symptoms. Evidence for a slight beneficial effect of DHEA on sexual function was found in menopausal women, whereas other descriptive reviews reported little or no evidence of this (Buvat 2003; Cameron 2005; Panjari 2010; Sparke 2002). The studies included in our review were consistent overall in their findings, however the studies were small and more research is needed to investigate whether DHEA does truly improve sexual function. Publication bias may have played a part in causing these results as there may be studies that did not find an improvement in sexual function and have not published their findings.
Biosynthesis of DHEA and estrogens.

Study flow diagram.

Risk of bias summary: review authors' judgements about each risk of bias item for each included study.

Risk of bias graph: review authors' judgements about each risk of bias item presented as percentages across all included studies.

Forest plot of comparison: 1 DHEA versus control (placebo or no treatment), outcome: 1.2 Sensitivity analysis QoL and wellbeing (end scores).

Forest plot of comparison: 1 DHEA versus control (placebo or no treatment), outcome: 1.6 Side effects.

Forest plot of comparison: 1 DHEA versus control (placebo or no treatment), outcome: 1.11 Sexual function (end scores).

Forest plot of comparison: 1 DHEA versus control (placebo or no treatment), outcome: 1.11 Sexual function (end scores) (sensitivity analysis).

Comparison 1 DHEA versus control (placebo or no treatment), Outcome 1 QoL/wellbeing (end scores).

Comparison 1 DHEA versus control (placebo or no treatment), Outcome 2 Sensitivity analysis QoL/wellbeing (end scores).

Comparison 1 DHEA versus control (placebo or no treatment), Outcome 3 QoL (subgrouped on Low Libido/HSDD).

Comparison 1 DHEA versus control (placebo or no treatment), Outcome 4 QoL (subgrouped on treatment duration).

Comparison 1 DHEA versus control (placebo or no treatment), Outcome 5 QoL/General Wellbeing (change scores).

Comparison 1 DHEA versus control (placebo or no treatment), Outcome 6 Side‐effects.

Comparison 1 DHEA versus control (placebo or no treatment), Outcome 7 Acne subgrouped on study duration.

Comparison 1 DHEA versus control (placebo or no treatment), Outcome 8 Menopausal symptoms (continuous).

Comparison 1 DHEA versus control (placebo or no treatment), Outcome 9 Menopausal symptoms (dichotomous).

Comparison 1 DHEA versus control (placebo or no treatment), Outcome 10 Sexual Function (end scores).

Comparison 1 DHEA versus control (placebo or no treatment), Outcome 11 Sexual function (end scores) (sensitivity analysis).

Comparison 2 Oral DHEA versus control subgrouped by route of administration, Outcome 1 QoL/wellbeing (change scores).

Comparison 2 Oral DHEA versus control subgrouped by route of administration, Outcome 2 Side‐effects: acne.

Comparison 2 Oral DHEA versus control subgrouped by route of administration, Outcome 4 Sexual Function (end scores).

Comparison 3 DHEA versus HT, Outcome 1 QoL/General Wellbeing.

Comparison 3 DHEA versus HT, Outcome 3 Menopausal symptoms (continuous).

Comparison 3 DHEA versus HT, Outcome 4 Sexual Function.

Comparison 4 DHEA versus HT (side effects) (dichotomous), Outcome 1 Acne.

Comparison 4 DHEA versus HT (side effects) (dichotomous), Outcome 2 Hair loss.

Comparison 4 DHEA versus HT (side effects) (dichotomous), Outcome 3 Headache.

Comparison 4 DHEA versus HT (side effects) (dichotomous), Outcome 4 Nausea.

Comparison 4 DHEA versus HT (side effects) (dichotomous), Outcome 5 Leg cramps.

Comparison 4 DHEA versus HT (side effects) (dichotomous), Outcome 6 Breast Tenderness.

Comparison 4 DHEA versus HT (side effects) (dichotomous), Outcome 7 Bloating.

Comparison 4 DHEA versus HT (side effects) (dichotomous), Outcome 8 Weight gain.

Comparison 5 DHEA versus HT (menopausal symptoms) (dichotomous), Outcome 1 Tiredness.

Comparison 5 DHEA versus HT (menopausal symptoms) (dichotomous), Outcome 2 Hot flushes and palpitations.

Comparison 5 DHEA versus HT (menopausal symptoms) (dichotomous), Outcome 3 Night sweats.

Comparison 5 DHEA versus HT (menopausal symptoms) (dichotomous), Outcome 4 Vaginal Dryness.

Comparison 5 DHEA versus HT (menopausal symptoms) (dichotomous), Outcome 5 Pruritis Vulvae.

Comparison 5 DHEA versus HT (menopausal symptoms) (dichotomous), Outcome 6 Urethral Syndrome.
Comparison 5 DHEA versus HT (menopausal symptoms) (dichotomous), Outcome 7 Depression.

Comparison 5 DHEA versus HT (menopausal symptoms) (dichotomous), Outcome 8 Loss of libido.
| DHEA compared to control (placebo or no treatment) | ||||||
| Population: women in the peri‐ or postmenopausal phase | ||||||
| Outcomes | Illustrative comparative risks* (95% CI) | Relative effect | No of participants | Quality of the evidence | Comments | |
| Assumed risk | Corresponding risk | |||||
| control (placebo or no treatment) | DHEA | |||||
| QoL, wellbeing (end scores) (sensitivity analysis) | The mean QoL, wellbeing in the intervention groups was | 287 (132 from parallel and 155 from crossover) | ⊕⊕⊕⊝ | SMD 0.16 (‐0.03 to 0.34) | ||
| Side effects (androgenic overall combined with acne) | 25 per 1000 | 87 per 1000 | OR 3.77 | 250 | ⊕⊕⊕⊝ | |
| Side effects ‐ androgenic side effects | 44 per 1000 | 234 per 1000 | OR 6.57 | 92 | ⊕⊕⊝⊝ | Only 1 study for this outcome |
| Side effects ‐ acne | 13 per 1000 | 29 per 1000 | OR 2.26 | 158 | ⊕⊕⊕⊝ | |
| *The basis for the assumed risk is the median control group risk across studies. The corresponding risk (and its 95% confidence interval) is based on the assumed risk in the comparison group and the relative effect of the intervention (and its 95% CI). | ||||||
| GRADE Working Group grades of evidence | ||||||
| 1 Downgraded for imprecision due to wide confidence intervals | ||||||
| Oral DHEA versus control subgrouped by routes of administration for women in the peri‐ or postmenopausal phase*** | ||||||
| Population: Women in the peri‐ or postmenopausal phase | ||||||
| Outcomes | Illustrative comparative risks* (95% CI) | Relative effect | No of participants | Quality of the evidence | Comments | |
| Assumed risk | Corresponding risk | |||||
| Placebo | DHEA | |||||
| QoL, wellbeing (change scores) ‐ oral administration | The mean QoL, wellbeing in the intervention groups was | 66 | ⊕⊝⊝⊝ | SMD ‐0.05 (‐0.53 to 0.43) | ||
| QoL, wellbeing (change scores) ‐ intravaginal application | The mean QoL/wellbeing in the intervention groups was | 107 | ⊕⊝⊝⊝ | SMD 1.23 (0.82 to 1.65) | ||
| Side effects: acne ‐ skin application | 0 per 1000 | 126per 1000** | OR 2.74 | 22 | ⊕⊝⊝⊝ | |
| Side effects: acne ‐ oral administration | 15 per 1000 | 32 per 1000 | OR 2.16 | 136 | ⊕⊝⊝⊝ | |
| *The basis for the assumed risk is the median control group risk across studies. The corresponding risk (and its 95% confidence interval) is based on the assumed risk in the comparison group and the relative effect of the intervention (and its 95% CI). ** As the assumed risk in the control group for acne is 0 it is impossible to calculate the comparative risk so we have assumed a risk of 0.05 in the placebo group. | ||||||
| GRADE Working Group grades of evidence | ||||||
| ***There were no studies that compared different routes of treatment within the study. We have separated studies based on their route of administration and compared the results from these studies with each other. 1 Downgraded due to no other studies available for comparison of effects | ||||||
| DHEA versus HT for women in the peri‐ or postmenopausal phase | ||||||
| Population: Women in the peri‐ or postmenopausal phase | ||||||
| Outcomes | Illustrative comparative risks* (95% CI) | Relative effect | No of participants | Quality of the evidence | Comments | |
| Assumed risk | Corresponding risk | |||||
| HT | DHEA | |||||
| QoL, general wellbeing DHEA versus ET | The mean QoL in the intervention groups was 1.63 higher (2.25 lower to 5.52 higher) | 17 | ⊕⊝⊝⊝ | |||
| QoL, general wellbeing | No studies available | |||||
| QoL, general wellbeing DHEA versus tibolone | No studies available | |||||
| Acne | 0 per 1000 | 472 per 1000 | OR 17 | 50 | ⊕⊝⊝⊝ | |
| Acne DHEA versus tibolone | 0 per 1000 | 472 per 1000** | OR 17 | 50 | ⊕⊝⊝⊝ | |
| Acne DHEA versus ET + P | No studies available | |||||
| *The basis for the assumed risk is the median control group risk across studies. The corresponding risk (and its 95% confidence interval) is based on the assumed risk in the comparison group and the relative effect of the intervention (and its 95% CI). **As the assumed risk in the control group for acne is 0 it is impossible to calculate the comparative risk so we have assumed a risk of 0.05 in the placebo group. | ||||||
| GRADE Working Group grades of evidence | ||||||
| 1 Downgraded due to no other studies available for comparison of effects | ||||||
| Outcome or subgroup title | No. of studies | No. of participants | Statistical method | Effect size |
| 1 QoL/wellbeing (end scores) Show forest plot | 9 | Std. Mean Difference (Fixed, 95% CI) | ‐0.04 [‐0.20, 0.13] | |
| 2 Sensitivity analysis QoL/wellbeing (end scores) Show forest plot | 8 | Std. Mean Difference (Fixed, 95% CI) | 0.16 [‐0.03, 0.34] | |
| 3 QoL (subgrouped on Low Libido/HSDD) Show forest plot | 9 | Std. Mean Difference (Fixed, 95% CI) | Subtotals only | |
| 3.1 Low Libido/HSDD | 2 | Std. Mean Difference (Fixed, 95% CI) | 0.10 [‐0.26, 0.46] | |
| 3.2 Libido normal/unknown | 7 | Std. Mean Difference (Fixed, 95% CI) | ‐0.08 [‐0.27, 0.11] | |
| 4 QoL (subgrouped on treatment duration) Show forest plot | 9 | Std. Mean Difference (Fixed, 95% CI) | ‐0.04 [‐0.20, 0.13] | |
| 4.1 <6 weeks | 3 | Std. Mean Difference (Fixed, 95% CI) | 0.23 [‐0.11, 0.57] | |
| 4.2 6 to 26 weeks | 3 | Std. Mean Difference (Fixed, 95% CI) | 0.13 [‐0.13, 0.39] | |
| 4.3 >26 weeks | 3 | Std. Mean Difference (Fixed, 95% CI) | ‐0.46 [‐0.75, ‐0.16] | |
| 5 QoL/General Wellbeing (change scores) Show forest plot | 2 | Std. Mean Difference (IV, Fixed, 95% CI) | Totals not selected | |
| 6 Side‐effects Show forest plot | 5 | Odds Ratio (M‐H, Fixed, 95% CI) | Subtotals only | |
| 6.1 Androgenic side‐effects | 1 | 92 | Odds Ratio (M‐H, Fixed, 95% CI) | 6.57 [1.37, 31.59] |
| 6.2 Acne | 4 | 158 | Odds Ratio (M‐H, Fixed, 95% CI) | 2.26 [0.56, 9.02] |
| 6.3 Hirsutism | 1 | 89 | Odds Ratio (M‐H, Fixed, 95% CI) | 4.89 [0.23, 104.76] |
| 7 Acne subgrouped on study duration Show forest plot | 4 | Odds Ratio (M‐H, Fixed, 95% CI) | Subtotals only | |
| 7.1 < 6 weeks | 1 | 27 | Odds Ratio (M‐H, Fixed, 95% CI) | 0.29 [0.01, 7.70] |
| 7.2 >6 weeks to 26 weeks | 1 | 22 | Odds Ratio (M‐H, Fixed, 95% CI) | 2.74 [0.10, 74.87] |
| 7.3 >26 weeks | 2 | 109 | Odds Ratio (M‐H, Fixed, 95% CI) | 5.25 [0.58, 47.36] |
| 8 Menopausal symptoms (continuous) Show forest plot | 2 | Std. Mean Difference (IV, Fixed, 95% CI) | Subtotals only | |
| 8.1 Endscores | 1 | 17 | Std. Mean Difference (IV, Fixed, 95% CI) | 0.35 [‐0.70, 1.40] |
| 8.2 Change scores | 1 | 66 | Std. Mean Difference (IV, Fixed, 95% CI) | 0.07 [‐0.42, 0.55] |
| 9 Menopausal symptoms (dichotomous) Show forest plot | 2 | Odds Ratio (M‐H, Fixed, 95% CI) | Totals not selected | |
| 9.1 Flushes | 1 | Odds Ratio (M‐H, Fixed, 95% CI) | 0.0 [0.0, 0.0] | |
| 9.2 Hot flushes and palpitations | 1 | Odds Ratio (M‐H, Fixed, 95% CI) | 0.0 [0.0, 0.0] | |
| 9.3 Insomnia | 1 | Odds Ratio (M‐H, Fixed, 95% CI) | 0.0 [0.0, 0.0] | |
| 9.4 Night sweats | 1 | Odds Ratio (M‐H, Fixed, 95% CI) | 0.0 [0.0, 0.0] | |
| 9.5 Depression | 1 | Odds Ratio (M‐H, Fixed, 95% CI) | 0.0 [0.0, 0.0] | |
| 9.6 Loss of libido | 1 | Odds Ratio (M‐H, Fixed, 95% CI) | 0.0 [0.0, 0.0] | |
| 9.7 Vaginal dryness | 1 | Odds Ratio (M‐H, Fixed, 95% CI) | 0.0 [0.0, 0.0] | |
| 9.8 Pruritis vulvae | 1 | Odds Ratio (M‐H, Fixed, 95% CI) | 0.0 [0.0, 0.0] | |
| 9.9 Urethral syndrome | 1 | Odds Ratio (M‐H, Fixed, 95% CI) | 0.0 [0.0, 0.0] | |
| 9.10 Tiredness | 1 | Odds Ratio (M‐H, Fixed, 95% CI) | 0.0 [0.0, 0.0] | |
| 10 Sexual Function (end scores) Show forest plot | 6 | Std. Mean Difference (Fixed, 95% CI) | 0.19 [‐0.01, 0.40] | |
| 11 Sexual function (end scores) (sensitivity analysis) Show forest plot | 5 | Std. Mean Difference (Fixed, 95% CI) | 0.31 [0.07, 0.55] | |
| Outcome or subgroup title | No. of studies | No. of participants | Statistical method | Effect size |
| 1 QoL/wellbeing (change scores) Show forest plot | 2 | Std. Mean Difference (IV, Fixed, 95% CI) | Subtotals only | |
| 1.1 Oral administration | 1 | 66 | Std. Mean Difference (IV, Fixed, 95% CI) | ‐0.05 [‐0.53, 0.43] |
| 1.2 Intravaginal application | 1 | 107 | Std. Mean Difference (IV, Fixed, 95% CI) | 1.23 [0.82, 1.65] |
| 2 Side‐effects: acne Show forest plot | 4 | 158 | Odds Ratio (M‐H, Fixed, 95% CI) | 2.26 [0.56, 9.02] |
| 2.1 Skin application | 1 | 22 | Odds Ratio (M‐H, Fixed, 95% CI) | 2.74 [0.10, 74.87] |
| 2.2 Oral administration | 3 | 136 | Odds Ratio (M‐H, Fixed, 95% CI) | 2.16 [0.47, 9.96] |
| 4 Sexual Function (end scores) Show forest plot | 6 | Std. Mean Difference (Fixed, 95% CI) | 0.19 [‐0.01, 0.40] | |
| 4.1 Oral administration | 5 | Std. Mean Difference (Fixed, 95% CI) | 0.11 [‐0.13, 0.35] | |
| 4.2 Intravaginal application | 1 | Std. Mean Difference (Fixed, 95% CI) | 0.42 [0.03, 0.81] | |
| Outcome or subgroup title | No. of studies | No. of participants | Statistical method | Effect size |
| 1 QoL/General Wellbeing Show forest plot | 1 | Mean Difference (IV, Fixed, 95% CI) | Totals not selected | |
| 1.1 ET | 1 | Mean Difference (IV, Fixed, 95% CI) | 0.0 [0.0, 0.0] | |
| 1.2 Combined | 0 | Mean Difference (IV, Fixed, 95% CI) | 0.0 [0.0, 0.0] | |
| 1.3 Tibolone | 0 | Mean Difference (IV, Fixed, 95% CI) | 0.0 [0.0, 0.0] | |
| 3 Menopausal symptoms (continuous) Show forest plot | 2 | Std. Mean Difference (IV, Fixed, 95% CI) | Totals not selected | |
| 3.1 ET | 1 | Std. Mean Difference (IV, Fixed, 95% CI) | 0.0 [0.0, 0.0] | |
| 3.2 Combined | 1 | Std. Mean Difference (IV, Fixed, 95% CI) | 0.0 [0.0, 0.0] | |
| 3.3 Tibolone | 1 | Std. Mean Difference (IV, Fixed, 95% CI) | 0.0 [0.0, 0.0] | |
| 4 Sexual Function Show forest plot | 2 | Mean Difference (IV, Fixed, 95% CI) | Subtotals only | |
| 4.1 ET/ET+P | 2 | 41 | Mean Difference (IV, Fixed, 95% CI) | 1.26 [‐0.21, 2.73] |
| 4.2 Tibolone | 1 | 24 | Mean Difference (IV, Fixed, 95% CI) | 4.60 [0.92, 8.28] |
| Outcome or subgroup title | No. of studies | No. of participants | Statistical method | Effect size |
| 1 Acne Show forest plot | 1 | Odds Ratio (M‐H, Fixed, 95% CI) | Subtotals only | |
| 1.1 ET | 1 | 50 | Odds Ratio (M‐H, Fixed, 95% CI) | 17.0 [0.90, 320.37] |
| 1.2 Tibolone | 1 | 50 | Odds Ratio (M‐H, Fixed, 95% CI) | 17.0 [0.90, 320.37] |
| 2 Hair loss Show forest plot | 1 | Odds Ratio (M‐H, Fixed, 95% CI) | Subtotals only | |
| 2.1 ET | 1 | 50 | Odds Ratio (M‐H, Fixed, 95% CI) | 10.67 [0.54, 209.64] |
| 2.2 Tibolone | 1 | 50 | Odds Ratio (M‐H, Fixed, 95% CI) | 10.67 [0.54, 209.64] |
| 3 Headache Show forest plot | 1 | Odds Ratio (M‐H, Fixed, 95% CI) | Subtotals only | |
| 3.1 ET | 1 | 50 | Odds Ratio (M‐H, Fixed, 95% CI) | 0.03 [0.00, 0.53] |
| 3.2 Tibolone | 1 | 50 | Odds Ratio (M‐H, Fixed, 95% CI) | 0.18 [0.01, 4.04] |
| 4 Nausea Show forest plot | 1 | Odds Ratio (M‐H, Fixed, 95% CI) | Subtotals only | |
| 4.1 ET | 1 | 50 | Odds Ratio (M‐H, Fixed, 95% CI) | 0.22 [0.04, 1.21] |
| 4.2 Tibolone | 1 | 50 | Odds Ratio (M‐H, Fixed, 95% CI) | 1.0 [0.13, 7.72] |
| 5 Leg cramps Show forest plot | 1 | Odds Ratio (M‐H, Fixed, 95% CI) | Subtotals only | |
| 5.1 ET | 1 | 50 | Odds Ratio (M‐H, Fixed, 95% CI) | 0.0 [0.0, 0.0] |
| 5.2 Tibolone | 1 | 50 | Odds Ratio (M‐H, Fixed, 95% CI) | 0.0 [0.0, 0.0] |
| 6 Breast Tenderness Show forest plot | 1 | Odds Ratio (M‐H, Fixed, 95% CI) | Subtotals only | |
| 6.1 ET | 1 | 50 | Odds Ratio (M‐H, Fixed, 95% CI) | 0.07 [0.00, 1.40] |
| 6.2 Tibolone | 1 | 50 | Odds Ratio (M‐H, Fixed, 95% CI) | 0.32 [0.01, 8.25] |
| 7 Bloating Show forest plot | 1 | Odds Ratio (M‐H, Fixed, 95% CI) | Subtotals only | |
| 7.1 ET | 1 | 50 | Odds Ratio (M‐H, Fixed, 95% CI) | 0.09 [0.00, 1.84] |
| 7.2 Tibolone | 1 | 50 | Odds Ratio (M‐H, Fixed, 95% CI) | 0.18 [0.01, 4.04] |
| 8 Weight gain Show forest plot | 1 | Odds Ratio (M‐H, Fixed, 95% CI) | Subtotals only | |
| 8.1 ET | 1 | 50 | Odds Ratio (M‐H, Fixed, 95% CI) | 0.09 [0.00, 1.84] |
| 8.2 Tibolone | 1 | 50 | Odds Ratio (M‐H, Fixed, 95% CI) | 0.18 [0.01, 4.04] |
| Outcome or subgroup title | No. of studies | No. of participants | Statistical method | Effect size |
| 1 Tiredness Show forest plot | 1 | 100 | Odds Ratio (M‐H, Fixed, 95% CI) | 1.26 [0.49, 3.26] |
| 1.1 ET | 1 | 50 | Odds Ratio (M‐H, Fixed, 95% CI) | 1.26 [0.33, 4.84] |
| 1.2 Tibolone | 1 | 50 | Odds Ratio (M‐H, Fixed, 95% CI) | 1.26 [0.33, 4.84] |
| 2 Hot flushes and palpitations Show forest plot | 1 | Odds Ratio (M‐H, Fixed, 95% CI) | Subtotals only | |
| 2.1 ET | 1 | 50 | Odds Ratio (M‐H, Fixed, 95% CI) | 1.40 [0.28, 7.00] |
| 2.2 Tibolone | 1 | 50 | Odds Ratio (M‐H, Fixed, 95% CI) | 1.40 [0.28, 7.00] |
| 3 Night sweats Show forest plot | 1 | Odds Ratio (M‐H, Fixed, 95% CI) | Subtotals only | |
| 3.1 ET | 1 | 50 | Odds Ratio (M‐H, Fixed, 95% CI) | 1.0 [0.18, 5.51] |
| 3.2 Tibolone | 1 | 50 | Odds Ratio (M‐H, Fixed, 95% CI) | 0.72 [0.14, 3.59] |
| 4 Vaginal Dryness Show forest plot | 1 | Odds Ratio (M‐H, Fixed, 95% CI) | Subtotals only | |
| 4.1 ET | 1 | 50 | Odds Ratio (M‐H, Fixed, 95% CI) | 1.0 [0.06, 16.93] |
| 4.2 Tibolone | 1 | 50 | Odds Ratio (M‐H, Fixed, 95% CI) | 3.12 [0.12, 80.39] |
| 5 Pruritis Vulvae Show forest plot | 1 | Odds Ratio (M‐H, Fixed, 95% CI) | Subtotals only | |
| 5.1 ET | 1 | 50 | Odds Ratio (M‐H, Fixed, 95% CI) | 1.0 [0.06, 16.93] |
| 5.2 Tibolone | 1 | 50 | Odds Ratio (M‐H, Fixed, 95% CI) | 3.12 [0.12, 80.39] |
| 6 Urethral Syndrome Show forest plot | 1 | Odds Ratio (M‐H, Fixed, 95% CI) | Subtotals only | |
| 6.1 ET | 1 | 50 | Odds Ratio (M‐H, Fixed, 95% CI) | 0.48 [0.04, 5.65] |
| 6.2 Tibolone | 1 | 50 | Odds Ratio (M‐H, Fixed, 95% CI) | 1.0 [0.06, 16.93] |
| 7 Depression Show forest plot | 1 | Odds Ratio (M‐H, Fixed, 95% CI) | Subtotals only | |
| 7.1 ET | 1 | 50 | Odds Ratio (M‐H, Fixed, 95% CI) | 0.32 [0.01, 8.25] |
| 7.2 Tibolone | 1 | 50 | Odds Ratio (M‐H, Fixed, 95% CI) | 0.0 [0.0, 0.0] |
| 8 Loss of libido Show forest plot | 1 | Odds Ratio (M‐H, Fixed, 95% CI) | Subtotals only | |
| 8.1 ET | 1 | 50 | Odds Ratio (M‐H, Fixed, 95% CI) | 0.32 [0.01, 8.25] |
| 8.2 Tibolone | 1 | 50 | Odds Ratio (M‐H, Fixed, 95% CI) | 0.0 [0.0, 0.0] |