Antidepresivos para el tratamiento de la depresión en pacientes con cáncer
Appendices
Appendix 1. CENTRAL search strategy
#1 MeSH descriptor: [Neoplasms] explode all trees
#2 (cancer* or tumor* or tumour* or neoplas* or malignan* or carcinoma* or adenocarcinoma* or choriocrcinoma* or leukemia* or leukaemia* or metastat* or sarcoma* or teratoma* )
#3 #1 or #2
#4 MeSH descriptor: [Depression] explode all trees
#5 MeSH descriptor: [Depressive Disorder] explode all trees
#6 MeSH descriptor: [Adjustment Disorders] explode all trees
#7 (depress* or melanchol* or ((adjustment or reactive or dysthymic) near/5 disorder*))
#8 #4 or #5 or #6 or #7
#9 Any MeSH descriptor with qualifier(s): [Drug therapy ‐ DT]
#10 MeSH descriptor: [Antidepressive Agents] explode all trees
#11 MeSH descriptor: [Heterocyclic Compounds] explode all trees
#12 MeSH descriptor: [Serotonin Uptake Inhibitors] explode all trees
#13 MeSH descriptor: [Adrenergic Uptake Inhibitors] explode all trees
#14 MeSH descriptor: [Monoamine Oxidase Inhibitors] explode all trees
#15 (desipramine or imipramine or clomipramine or opipramol or trimipramine or lofepramine or dibenzepin or amitriptyline or nortriptyline or protriptyline or doxepin or iprindole or melitracen or butriptyline or dosulepin or amoxapine or dimetacrine or amineptine or maprotiline or quinupramine or zimeldine or fluoxetine or citalopram or paroxetine or sertraline or alaproclate or fluvoxamine or etoperidone or escitalopram or isocarboxazid or nialamide or phenelzine or tranylcypromine or iproniazide or iproclozide or moclobemide or toloxatone or oxitriptan or tryptophan or mianserin or nomifensine or trazodone or nefazodone or minaprine or bifemelane or viloxazine or oxaflozane or mirtazapine or bupropion or medifoxamine or tianeptine or pivagabine or venlafaxine or milnacipran or reboxetine or gepirone or duloxetine or agomelatine or desvenlafaxine or vilazodone or hyperici herba or hypericum perforatum or st john* wort* or saint john* wort*)
#16 (anti‐depress* or antidepress* or drug therap* or pharmacotherap* or trycyclic* or TCA* or heterocyclic* or serotonin uptake or SSRI* or SNRI* or monoamine oxidase inhibitor* or MAOI*)
#17 #9 or #10 or #11 or #12 or #13 or #14 or #15 or #16
#18 #3 and #8 and #17
Appendix 2. MEDLINE (Ovid) search strategy
1 exp Neoplasms/
2 (cancer* or tumor* or tumour* or neoplas* or malignan* or carcinoma* or adenocarcinoma* or choriocarcinoma* or lymphoma* or leukemia* or leukaemia* or metastat* or sarcoma* or teratoma*).mp.
3 1 or 2
4 Depression/
5 exp Depressive Disorder/
6 Adjustment Disorders/
7 (depress* or melanchol* or ((adjustment or reactive or dysthymic) adj5 disorder*)).mp.
8 4 or 5 or 6 or 7
9 drug therapy.fs.
10 exp Antidepressive Agents/
11 exp Heterocyclic Compounds/
12 exp Serotonin Uptake Inhibitors/
13 exp Adrenergic Uptake Inhibitors/
14 exp Monoamine Oxidase Inhibitors/
15 (anti‐depress* or antidepress* or drug therap* or pharmacotherap* or trycyclic* or TCA* or heterocyclic* or serotonin uptake or SSRI* or SNRI* or monoamine oxidase inhibitor* or MAOI*).mp.
16 (desipramine or imipramine or clomipramine or opipramol or trimipramine or lofepramine or dibenzepin or amitriptyline or nortriptyline or protriptyline or doxepin or iprindole or melitracen or butriptyline or dosulepin or amoxapine or dimetacrine or amineptine or maprotiline or quinupramine or zimeldine or fluoxetine or citalopram or paroxetine or sertraline or alaproclate or fluvoxamine or etoperidone or escitalopram or isocarboxazid or nialamide or phenelzine or tranylcypromine or iproniazide or iproclozide or moclobemide or toloxatone or oxitriptan or tryptophan or mianserin or nomifensine or trazodone or nefazodone or minaprine or bifemelane or viloxazine or oxaflozane or mirtazapine or bupropion or medifoxamine or tianeptine or pivagabine or venlafaxine or milnacipran or reboxetine or gepirone or duloxetine or agomelatine or desvenlafaxine or vilazodone or hyperici herba or hypericum perforatum or st john* wort* or saint john* wort*).mp.
17 9 or 10 or 11 or 12 or 13 or 14 or 15 or 16
18 3 and 8 and 17
19 randomized controlled trial.pt.
20 controlled clinical trial.pt.
21 randomized.ab.
22 placebo.ab.
23 clinical trials as topic.sh.
24 randomly.ab.
25 trial.ti.
26 19 or 20 or 21 or 22 or 23 or 24 or 25
27 18 and 26
28 exp animals/ not humans.sh.
29 27 not 28
key:
mp = title, abstract, original title, name of substance word, subject heading word, keyword heading word, protocol supplementary concept, rare disease supplementary concept, unique identifier
pt = publication type
ab = abstract
sh = subject heading
ti = title
Appendix 3. Embase (Ovid) search strategy
1 exp neoplasm/
2 (cancer* or tumor* or tumour* or neoplas* or malignan* or carcinoma* or adenocarcinoma* or choriocrcinoma* or leukemia* or leukaemia* or metastat* or sarcoma* or teratoma*).ti,ab.
3 1 or 2
4 exp depression/
5 adjustment disorder/
6 (depress* or melanchol* or ((adjustment or reactive or dysthymic) adj3 disorder*)).ti,ab.
7 4 or 5 or 6
8 exp antidepressant agent/
9 exp heterocyclic compound/
10 exp serotonin uptake inhibitor/
11 exp adrenergic receptor affecting agent/
12 exp monoamine oxidase inhibitor/
13 (anti‐depress* or antidepress* or drug therap* or pharmacotherap* or trycyclic* or TCA* or heterocyclic* or serotonin uptake or SSRI* or SNRI* or monoamine oxidase inhibitor* or MAOI*).ti,ab.
14 (desipramine or imipramine or clomipramine or opipramol or trimipramine or lofepramine or dibenzepin or amitriptyline or nortriptyline or protriptyline or doxepin or iprindole or melitracen or butriptyline or dosulepin or amoxapine or dimetacrine or amineptine or maprotiline or quinupramine or zimeldine or fluoxetine or citalopram or paroxetine or sertraline or alaproclate or fluvoxamine or etoperidone or escitalopram or isocarboxazid or nialamide or phenelzine or tranylcypromine or iproniazide or iproclozide or moclobemide or toloxatone or oxitriptan or tryptophan or mianserin or nomifensine or trazodone or nefazodone or minaprine or bifemelane or viloxazine or oxaflozane or mirtazapine or bupropion or medifoxamine or tianeptine or pivagabine or venlafaxine or milnacipran or reboxetine or gepirone or duloxetine or agomelatine or desvenlafaxine or vilazodone or hyperici herba or hypericum perforatum or st john* wort* or saint john* wort*).ti,ab.
15 8 or 9 or 10 or 11 or 12 or 13 or 14
16 3 and 7 and 15
17 crossover procedure/
18 double‐blind procedure/
19 randomized controlled trial/
20 single‐blind procedure/
21 random*.mp.
22 factorial*.mp.
23 (crossover* or cross over* or cross‐over*).mp.
24 placebo*.mp.
25 (double* adj blind*).mp.
26 (singl* adj blind*).mp.
27 assign*.mp.
28 allocat*.mp.
29 volunteer*.mp.
30 17 or 18 or 19 or 20 or 21 or 22 or 23 or 24 or 25 or 26 or 27 or 28 or 29
31 16 and 30
32 (exp animal/ or nonhuman/ or exp animal experiment/) not human/
33 31 not 32
key: [mp = title, abstract, subject headings, heading word, drug trade name, original title, device manufacturer, drug manufacturer, device trade name, keyword]
Appendix 4. PsycINFO search strategy
1 exp Neoplasms/
2 (cancer* or tumor* or tumour* or neoplas* or malignan* or carcinoma* or adenocarcinoma* or choriocrcinoma* or leukemia* or leukaemia* or metastat* or sarcoma* or teratoma*).ti,ab.
3 1 or 2
4 "depression (emotion)"/
5 exp major depression/
6 (depress* or melanchol* or ((adjustment or reactive or dysthymic) adj3 disorder*)).ti,ab.
7 4 or 5 or 6
8 exp antidepressant drugs/
9 exp neurotransmitter uptake inhibitors/
10 exp monoamine oxidase inhibitors/
11 exp Drug Therapy/
12 (anti‐depress* or antidepress* or drug therap* or pharmacotherap* or trycyclic* or TCA* or heterocyclic* or serotonin uptake or SSRI* or SNRI* or monoamine oxidase inhibitor* or MAOI*).ti,ab.
13 (desipramine or imipramine or clomipramine or opipramol or trimipramine or lofepramine or dibenzepin or amitriptyline or nortriptyline or protriptyline or doxepin or iprindole or melitracen or butriptyline or dosulepin or amoxapine or dimetacrine or amineptine or maprotiline or quinupramine or zimeldine or fluoxetine or citalopram or paroxetine or sertraline or alaproclate or fluvoxamine or etoperidone or escitalopram or isocarboxazid or nialamide or phenelzine or tranylcypromine or iproniazide or iproclozide or moclobemide or toloxatone or oxitriptan or tryptophan or mianserin or nomifensine or trazodone or nefazodone or minaprine or bifemelane or viloxazine or oxaflozane or mirtazapine or bupropion or medifoxamine or tianeptine or pivagabine or venlafaxine or milnacipran or reboxetine or gepirone or duloxetine or agomelatine or desvenlafaxine or vilazodone or hyperici herba or hypericum perforatum or st john* wort* or saint john* wort*).ti,ab.
14 8 or 9 or 10 or 11 or 12 or 13
15 3 and 7 and 14
16 clinical trials/
17 (random* or trial* or group* or placebo*).ti,ab.
18 16 or 17
19 15 and 18
Appendix 5. Data collection sheet
Review author name (GO; FM; CB)
1. First author, Year and Journal ___________
2. Comparisons:
AD1 __________________________________
AD2 __________________________________
AD3 __________________________________
PLB yes [ ] no [ ]
3. Weeks of follow‐up |___||___| (insert the longest duration of randomised follow‐up)
4. Randomisation |___| 0 = unclear
1 = clearly reported
authors’ statement____________
(If it is unclear please report the authors’ statement)
5. Double blinding |___| 0 = unclear
1 = yes
2 = no
6. Concealment allocation |___|
0 = unclear
1 = yes (clearly mentioned according to the Cochrane Handbook)
7. AD1 sample |___||___||___| AD2 sample |___||___||___| AD3 sample |___||___||___| PLB sample |___||___||___|
(Please insert the number of patients randomised to receive each AD drug)
8. Setting |___|
0 = unclear 2 = outpatients 1 = inpatients 3 = in and outpatients
9. Type of participants |___|
0 = unclear 1 = major depressive disorder 3 = dysthymic disorder
2 = adjustment disorders 4 = depressive symptoms (rating scales)
‘depression’ definition (authors’ statement)____________
(If it is unclear please report the authors’ statement)
10. Diagnostic criteria for 'depression' or depressive symptoms |___|
0 = unclear 3 = ICD‐10, DSM‐IV
1 = DSM‐III 4 = rating scales (HRSD, BDI, etc.)
2 = DSM III‐R 5 = implicit criteria (e.g. ICD‐9)
diagnostic criteria (authors’ statement)_______________
(If it is unclear please report the authors’ statement)
11. Depressive symptoms employed as |___|
0 = primary trial outcome
1 = secondary trial outcome
12. Previous history of depression |___|
0 = exclusion criteria
1 = patients included N |_________| % |_________|
13. Elderly patients |___|
0 = unclear 2 = yes, some elderly (> 65 year old) patients
1 = no 3 = yes, all are 65 years old or older
14. Gender of patients
male |________________________| N |_________| % |_________|
female |________________________| N |_________| % |_________|
15. Cancer site
(If the study includes a population with mixed cancer diagnosis, please insert the number and/or the percentage of patients for each site. If it is unclear please report the authors’ statement)
site 1 |________________________| N |_________| % |_________|
site 2 |________________________| N |_________| % |_________|
site 3 |________________________| N |_________| % |_________|
site 4 |________________________| N |_________| % |_________|
site 5 |________________________| N |_________| % |_________|
cancer site (authors’ statement)____________
16. Cancer stage |______________________________|
(If the study includes a population with mixed cancer diagnosis, please insert the number and/or the percentage of patients for each stage. If it is unclear please report the authors’ statement)
0 = unclear
1 = Stage 0 (carcinoma in situ; early form) N |_________| % |_________|
2 = Stage I (localised) N |_________| % |_________|
3 = Stage II (early locally advanced) N |_________| % |_________|
4 = Stage III (late locally advanced) N |_________| % |_________|
5 = Stage IV (metastasised) N |_________| % |_________|
cancer stage (authors’ statement)______________________________________
17. Cancer treatment |___|
(If the study includes a population with mixed cancer diagnosis, please insert the number and/or the percentage of patients for each treatment. If it is unclear please report the authors’ statement)
0 = unclear
1 = chemotherapy N |_________| % |_________| 2 = radiotherapy N |_________| % |_________|
2 = surgery N |_________| % |_________|
3 = other treatment |__________________________| N |_________| % |_________|
cancer stage (authors’ statement)_____________
18. Severe adverse events
(if the type or the number of adverse events are not reported or are unclearly reported, please report the authors’ statement)
1. ______________________ N |_________| % |_________|
2. ______________________ N |_________| % |_________|
3. ______________________ N |_________| % |_________|
4. ______________________ N |_________| % |_________|
adverse events (authors’ statement)______________________________________
19. Antidepressant (AD) doses
AD1 dose *METHODS |___||___||___| ‐ |___||___||___| r = unclear
N.B. Is this a fixed or flexible dosing schedule? Fixed Flexible
* (Please consider the range of ID dose reported in the method section of the study report)
**RESULTS |___||___||___| . |___||___| SD |___||___|.|___| r = unclear
N.B. Is this a mean dose? Yes No
** (Please consider the average ID dose administered during the study period or, if this figure is not available, consider the average ID dose received by the majority of patients)
D2 dose *METHODS |___||___||___| ‐ |___||___||___| r = unclear
N.B. Is this a fixed or flexible dosing schedule? Fixed Flexible
**RESULTS |___||___||___| . |___||___| SD |___||___|.|___| r = unclear
N.B. Is this a mean dose? Yes No
AD3 dose *METHODS |___||___||___| ‐ |___||___||___| r = unclear
N.B. Is this a fixed or flexible dosing schedule? Fixed Flexible
**RESULTS |___||___||___| . |___||___| SD |___||___|.|___| r = unclear
N.B. Is this a mean dose? Yes No
20. Mean score AT BASELINE: r = unclear/no data available
AD1
N |___||___||___| HDRS |___||___||___|.|___||___| SD |___|.|___||___| (SE |___|.|___||___|) * Specify the N. of items in HDRS |___||___|
N |___||___||___| MADRS |___||___||___|.|___||___| SD |___|.|___||___| (SE |___|.|___||___|)
N |___||___||___| CGI |___||___||___|.|___||___| SD |___|.|___||___| (SE |___|.|___||___|)
N |___||___||___| _____ |___||___||___|.|___||___| SD |___|.|___||___| (SE |___|.|___||___|)
N |___||___||___| _____ |___||___||___|.|___||___| SD |___|.|___||___| (SE |___|.|___||___|) (quality of life)
N |___||___||___| _____ |___||___||___|.|___||___| SD |___|.|___||___| (SE |___|.|___||___|) (social adjustment)
AD2
N |___||___||___| HDRS |___||___||___|.|___||___| SD |___|.|___||___| (SE |___|.|___||___|)
N |___||___||___| MADRS |___||___||___|.|___||___| SD |___|.|___||___| (SE |___|.|___||___|)
N |___||___||___| CGI |___||___||___|.|___||___| SD |___|.|___||___| (SE |___|.|___||___|)
N |___||___||___| _____ |___||___||___|.|___||___| SD |___|.|___||___| (SE |___|.|___||___|)
N |___||___||___| _____ |___||___||___|.|___||___| SD |___|.|___||___| (SE |___|.|___||___|) (quality of life)
N |___||___||___| _____ |___||___||___|.|___||___| SD |___|.|___||___| (SE |___|.|___||___|) (social adjustment)
AD3
N |___||___||___| HDRS |___||___||___|.|___||___| SD |___|.|___||___| (SE |___|.|___||___|)
N |___||___||___| MADRS |___||___||___|.|___||___| SD |___|.|___||___| (SE |___|.|___||___|)
N |___||___||___| CGI |___||___||___|.|___||___| SD |___|.|___||___| (SE |___|.|___||___|)
N |___||___||___| _____ |___||___||___|.|___||___| SD |___|.|___||___| (SE |___|.|___||___|)
N |___||___||___| _____ |___||___||___|.|___||___| SD |___|.|___||___| (SE |___|.|___||___|) (quality of life)
N |___||___||___| _____ |___||___||___|.|___||___| SD |___|.|___||___| (SE |___|.|___||___|) (social adjustment)
PLACEBO
N |___||___||___| HDRS |___||___||___|.|___||___| SD |___|.|___||___| (SE |___|.|___||___|)
N |___||___||___| MADRS |___||___||___|.|___||___| SD |___|.|___||___| (SE |___|.|___||___|)
N |___||___||___| CGI |___||___||___|.|___||___| SD |___|.|___||___| (SE |___|.|___||___|)
N |___||___||___| _____ |___||___||___|.|___||___| SD |___|.|___||___| (SE |___|.|___||___|)
N |___||___||___| _____ |___||___||___|.|___||___| SD |___|.|___||___| (SE |___|.|___||___|) (quality of life)
N |___||___||___| _____ |___||___||___|.|___||___| SD |___|.|___||___| (SE |___|.|___||___|) (social adjustment)
EFFICACY AS A CONTINUOUS OUTCOME
21. ENDPOINT RESPONSE WEEK …..……(choose the time point given in the original study as the study endpoint)
Mean score: r = unclear
Rating scale:______________________________
AD1 N |___||___||___| score |___||___||___|.|___||___| SD |___|.|___||___| (SE |___|.|___||___|)
AD2 N |___||___||___| score |___||___||___|.|___||___| SD |___|.|___||___| (SE |___|.|___||___|)
AD3 N |___||___||___| score |___||___||___|.|___||___| SD |___|.|___||___| (SE |___|.|___||___|)
Placebo N |___||___||___| score |___||___||___|.|___||___| SD |___|.|___||___| (SE |___|.|___||___|)
(Please insert the number of evaluable subjects at follow‐up, the mean score at follow‐up at the HDRS or MADRS or CGI or any other rating scale. If the study used the LOCF, record the values based on the LOCF. If the SD is not available extract the standard error)
22. 1 to 4 weeks RESPONSE RATE WEEK ………(choose the time point closest to week 2)
Mean score: r = unclear
Rating scale:______________________________
AD1 N |___||___||___| score |___||___||___|.|___||___| SD |___|.|___||___| (SE |___|.|___||___|)
AD2 N |___||___||___| score |___||___||___|.|___||___| SD |___|.|___||___| (SE |___|.|___||___|)
AD3 N |___||___||___| score |___||___||___|.|___||___| SD |___|.|___||___| (SE |___|.|___||___|)
Placebo N |___||___||___| score |___||___||___|.|___||___| SD |___|.|___||___| (SE |___|.|___||___|)
Rating scale:______________________________
AD1 N |___||___||___| score |___||___||___|.|___||___| SD |___|.|___||___| (SE |___|.|___||___|)
AD2 N |___||___||___| score |___||___||___|.|___||___| SD |___|.|___||___| (SE |___|.|___||___|)
AD3 N |___||___||___| score |___||___||___|.|___||___| SD |___|.|___||___| (SE |___|.|___||___|)
Placebo N |___||___||___| score |___||___||___|.|___||___| SD |___|.|___||___| (SE |___|.|___||___|)
Rating scale:______________________________
AD1 N |___||___||___| score |___||___||___|.|___||___| SD |___|.|___||___| (SE |___|.|___||___|)
AD2 N |___||___||___| score |___||___||___|.|___||___| SD |___|.|___||___| (SE |___|.|___||___|)
AD3 N |___||___||___| score |___||___||___|.|___||___| SD |___|.|___||___| (SE |___|.|___||___|)
Placebo N |___||___||___| score |___||___||___|.|___||___| SD |___|.|___||___| (SE |___|.|___||___|)
(Please insert the number of evaluable subjects at follow‐up, the mean score at follow‐up at the HDRS or MADRS or CGI or any other rating scale. If the study used the LOCF, record the values based on the LOCF. If the SD is not available extract the standard error)
23. 6 to 12 weeks RESPONSE RATE WEEK ………(choose the time point closest to the original study endpoint)
Mean score: r = unclear
Rating scale:______________________________
AD1 N |___||___||___| score |___||___||___|.|___||___| SD |___|.|___||___| (SE |___|.|___||___|)
AD2 N |___||___||___| score |___||___||___|.|___||___| SD |___|.|___||___| (SE |___|.|___||___|)
AD3 N |___||___||___| score |___||___||___|.|___||___| SD |___|.|___||___| (SE |___|.|___||___|)
Placebo N |___||___||___| score |___||___||___|.|___||___| SD |___|.|___||___| (SE |___|.|___||___|)
Rating scale:______________________________
AD1 N |___||___||___| score |___||___||___|.|___||___| SD |___|.|___||___| (SE |___|.|___||___|)
AD2 N |___||___||___| score |___||___||___|.|___||___| SD |___|.|___||___| (SE |___|.|___||___|)
AD3 N |___||___||___| score |___||___||___|.|___||___| SD |___|.|___||___| (SE |___|.|___||___|)
Placebo N |___||___||___| score |___||___||___|.|___||___| SD |___|.|___||___| (SE |___|.|___||___|)
Rating scale:______________________________
AD1 N |___||___||___| score |___||___||___|.|___||___| SD |___|.|___||___| (SE |___|.|___||___|)
AD2 N |___||___||___| score |___||___||___|.|___||___| SD |___|.|___||___| (SE |___|.|___||___|)
AD3 N |___||___||___| score |___||___||___|.|___||___| SD |___|.|___||___| (SE |___|.|___||___|)
Placebo N |___||___||___| score |___||___||___|.|___||___| SD |___|.|___||___| (SE |___|.|___||___|)
(Please insert the number of evaluable subjects at follow‐up, the mean score at follow‐up at the HDRS or MADRS or CGI or any other rating scale. If the study used the LOCF, record the values based on the LOCF. If the SD is not available extract the standard error)
24. 14 to 24 weeks RESPONSE RATE WEEK ………(choose the time point closest to week 24)
Mean score: r = unclear
Rating scale:______________________________
AD1 N |___||___||___| score |___||___||___|.|___||___| SD |___|.|___||___| (SE |___|.|___||___|)
AD2 N |___||___||___| score |___||___||___|.|___||___| SD |___|.|___||___| (SE |___|.|___||___|)
AD3 N |___||___||___| score |___||___||___|.|___||___| SD |___|.|___||___| (SE |___|.|___||___|)
Placebo N |___||___||___| score |___||___||___|.|___||___| SD |___|.|___||___| (SE |___|.|___||___|)
Rating scale:______________________________
AD1 N |___||___||___| score |___||___||___|.|___||___| SD |___|.|___||___| (SE |___|.|___||___|)
AD2 N |___||___||___| score |___||___||___|.|___||___| SD |___|.|___||___| (SE |___|.|___||___|)
AD3 N |___||___||___| score |___||___||___|.|___||___| SD |___|.|___||___| (SE |___|.|___||___|)
Placebo N |___||___||___| score |___||___||___|.|___||___| SD |___|.|___||___| (SE |___|.|___||___|)
Rating scale:______________________________
AD1 N |___||___||___| score |___||___||___|.|___||___| SD |___|.|___||___| (SE |___|.|___||___|)
AD2 N |___||___||___| score |___||___||___|.|___||___| SD |___|.|___||___| (SE |___|.|___||___|)
AD3 N |___||___||___| score |___||___||___|.|___||___| SD |___|.|___||___| (SE |___|.|___||___|)
Placebo N |___||___||___| score |___||___||___|.|___||___| SD |___|.|___||___| (SE |___|.|___||___|)
(Please insert the number of evaluable subjects at follow‐up, the mean score at follow‐up at the HDRS or MADRS or CGI or any other rating scale. If the study used the LOCF, record the values based on the LOCF. If the SD is not available extract the standard error)
EFFICACY AS A DICHOTOMOUS OUTCOME
25.ENDPOINT RESPONSE RATE (6 to 12 weeks) WEEK …..……(choose the time point closest to the original study endpoint)
50% or greater reduction on ___________________
AD1 50% reduction RESPONDERS |___||___||___| out of |___||___||___| r = unclear
AD2 50% reduction RESPONDERS |___||___||___| out of |___||___||___|
AD3 50% reduction RESPONDERS |___||___||___| out of |___||___||___|
Placebo 50% reduction RESPONDERS |___||___||___| out of |___||___||___|
(Please insert which rating scale has been used, the number of patients with a 50% or more improvement ‐ at the HAM‐D, MADRS, or any other depression scale ‐, and the number of included patients at that time point. Typically, a trial would include N patients, but include N – p – q patients in the assessment, as these p patients have never returned and are hence excluded even from the LOCF analyses and q patients drop out in the course of the treatment and their last observed values are carried forward; in this instance, if q patients are somehow accounted for at the time point in question, then, N – p would be the denominator here. In some instances, only responders among N – p – q patients are reported.)
AD1 CGI‐I RESPONDERS |___||___||___| out of |___||___||___| r = unclear
AD2 CGI‐I RESPONDERS |___||___||___| out of |___||___||___|
AD3 CGI‐I RESPONDERS |___||___||___| out of |___||___||___|
Placebo CGI‐I RESPONDERS |___||___||___| out of |___||___||___|
(Please insert the number of patients 'much or very much improved' on CGI‐Improvement, and the number of included patients at that time point.)
26. SOCIAL ADJUSTMENT (GAF and others) (6 to 12 weeks) WEEK …..…… (choose the time point closest to the original study endpoint)
Rating scale:______________________________
AD1 N |___||___||___| score |___||___||___|.|___||___| SD |___|.|___||___| (SE |___|.|___||___|)
AD2 N |___||___||___| score |___||___||___|.|___||___| SD |___|.|___||___| (SE |___|.|___||___|)
AD3 N |___||___||___| score |___||___||___|.|___||___| SD |___|.|___||___| (SE |___|.|___||___|)
Placebo N |___||___||___| score |___||___||___|.|___||___| SD |___|.|___||___| (SE |___|.|___||___|)
27. HEALTH‐RELATED QUALITY OF LIFE (6 to 12 weeks) WEEK …..…… (choose the time point closest to the original study endpoint)
(give preference to EORTC QLQ‐30, FACT, SF‐36 and other to illness‐specific QoL scales, where available)
Rating scale:______________________________
AD1 N |___||___||___| score |___||___||___|.|___||___| SD |___|.|___||___| (SE |___|.|___||___|)
AD2 N |___||___||___| score |___||___||___|.|___||___| SD |___|.|___||___| (SE |___|.|___||___|)
AD3 N |___||___||___| score |___||___||___|.|___||___| SD |___|.|___||___| (SE |___|.|___||___|)
Placebo N |___||___||___| score |___||___||___|.|___||___| SD |___|.|___||___| (SE |___|.|___||___|)
DROPOUT RATE
28. DROPOUTS = patient discontinuing the study before the end of follow‐up r = unclear
| Dropouts due to: | AD1 number | AD2 number | AD3 number | PLACEBO number |
| A ‐ Inefficacy B ‐ Side effects C ‐ TOTAL* | ||||
* The total number of dropout patients might not be the sum of dropouts for inefficacy and side effects, because in some studies patients drop out from the study for other/unknown reasons
29. Cost analysis |___|
0 = unclear
1 = yes
2 = no
30. Drug company sponsored trial |___|
0 = unclear
1 = yes, sponsored by a drug company
2 = no
(A trial is judged 'drug company sponsored' if it is so declared in the conflict of interest or in the acknowledgment or if some of the authors are company employees. There may be other instances, and use your common sense)
31. NOTES


'Risk of bias' graph: review authors' judgements about each risk of bias item presented as percentages across all included studies.
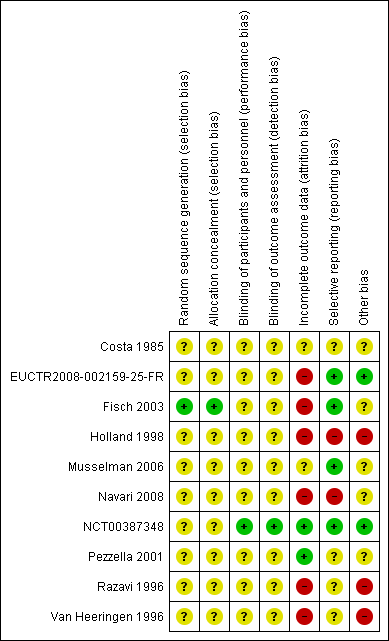
'Risk of bias' summary: review authors' judgements about each risk of bias item for each included study.
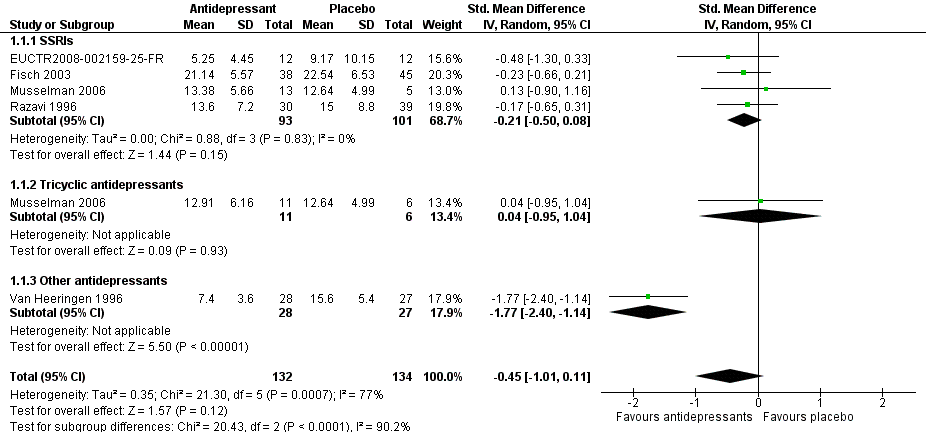
Forest plot of comparison: 1 Depression: efficacy at 6‐12 weeks (continuous outcome), outcome: 1.1 Antidepressants versus placebo.
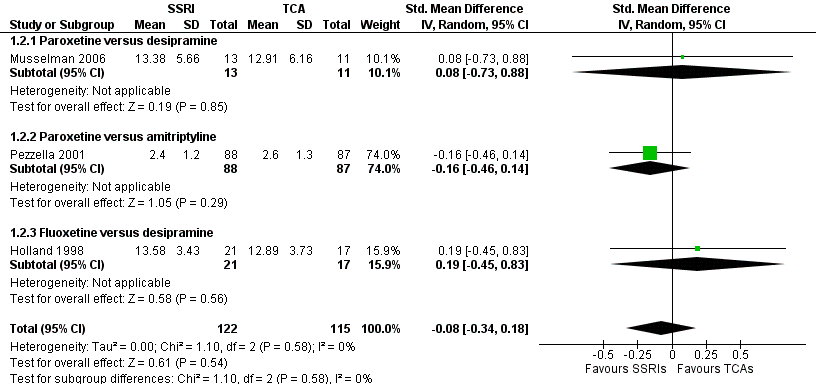
Forest plot of comparison: 1 Depression: efficacy at 6‐12 weeks (continuous outcome), outcome: 1.2 Antidepressants versus Antidepressants.

Comparison 1 Depression: efficacy as a continuous outcome at 6 to 12 weeks, Outcome 1 Antidepressants versus placebo.

Comparison 1 Depression: efficacy as a continuous outcome at 6 to 12 weeks, Outcome 2 Antidepressants versus antidepressants.

Comparison 2 Depression: efficacy as a continuous outcome at 1 to 4 weeks, Outcome 1 Antidepressants versus placebo.
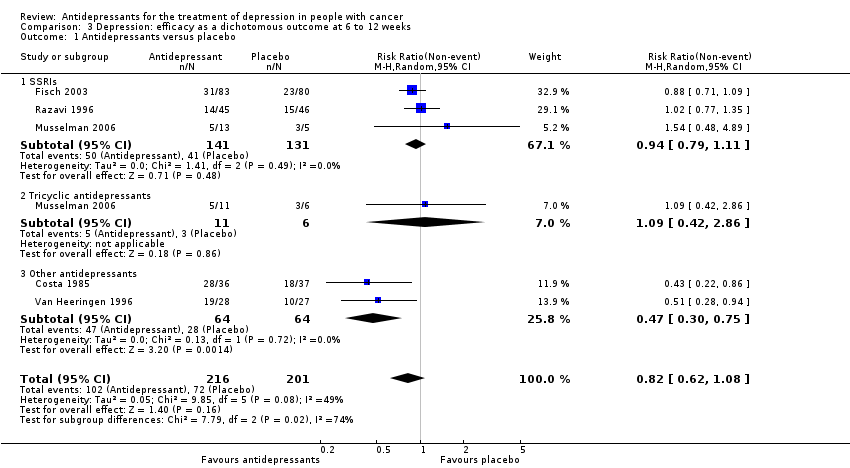
Comparison 3 Depression: efficacy as a dichotomous outcome at 6 to 12 weeks, Outcome 1 Antidepressants versus placebo.

Comparison 3 Depression: efficacy as a dichotomous outcome at 6 to 12 weeks, Outcome 2 Antidepressants versus antidepressants.

Comparison 4 Social adjustment at 6 to 12 weeks, Outcome 1 Antidepressants versus antidepressants.

Comparison 5 Quality of life at 6 to 12 weeks, Outcome 1 Antidepressants versus placebo.

Comparison 5 Quality of life at 6 to 12 weeks, Outcome 2 Antidepressants versus antidepressants.

Comparison 6 Dropouts due to inefficacy, Outcome 1 Antidepressants versus placebo.

Comparison 6 Dropouts due to inefficacy, Outcome 2 Antidepressants versus antidepressants.

Comparison 7 Dropouts due to side effects (tolerability), Outcome 1 Antidepressants versus placebo.

Comparison 7 Dropouts due to side effects (tolerability), Outcome 2 Antidepressants versus antidepressants.

Comparison 8 Dropouts due to any cause (acceptability), Outcome 1 Antidepressants versus placebo.
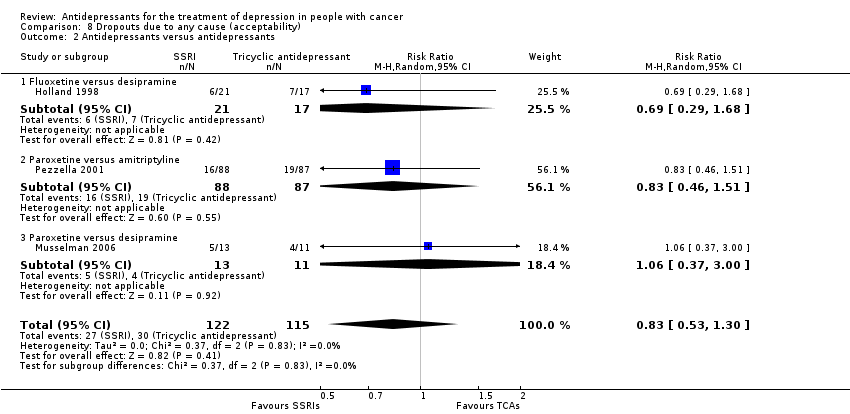
Comparison 8 Dropouts due to any cause (acceptability), Outcome 2 Antidepressants versus antidepressants.

Comparison 9 Subgroup analysis: psychiatric diagnosis, Outcome 1 Antidepressants versus placebo.
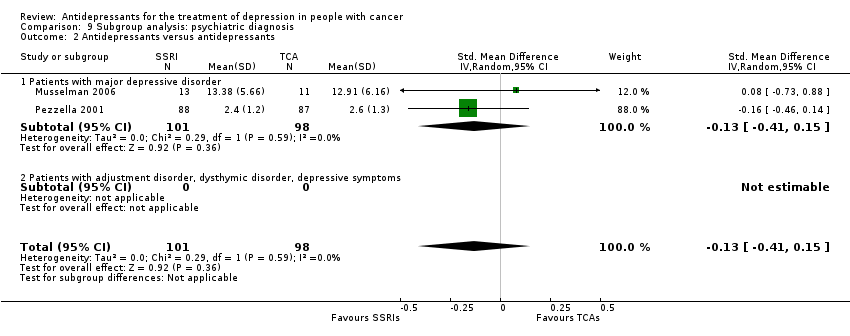
Comparison 9 Subgroup analysis: psychiatric diagnosis, Outcome 2 Antidepressants versus antidepressants.

Comparison 10 Subgroup analysis: cancer site, Outcome 1 Antidepressants versus placebo.

Comparison 10 Subgroup analysis: cancer site, Outcome 2 Antidepressants versus antidepressants.

Comparison 11 Subgroup analysis: cancer stage, Outcome 1 Antidepressants versus placebo.

Comparison 11 Subgroup analysis: cancer stage, Outcome 2 Antidepressants versus antidepressants.

Comparison 12 Sensitivity analysis: excluding trials that did not employ depressive symptoms as their primary outcome, Outcome 1 Antidepressants versus placebo.

Comparison 13 Sensitivity analysis: excluding trials with imputed data, Outcome 1 Antidepressants versus placebo.
| Antidepressants compared to placebo for patients with cancer and depression | ||||||
| Patient or population: adults with cancer and depression | ||||||
| Outcomes | Illustrative comparative risks* (95% CI) | Relative effect | No of participants | Certainity (quality) of the evidence | Comments | |
| Assumed risk | Corresponding risk | |||||
| Placebo | Antidepressants | |||||
| Efficacy as a continuous outcome | The mean efficacy as a continuous outcome (SMD) in the intervention groups was | 266 | ⊕⊝⊝⊝ | |||
| Efficacy as a dichotomous outcome | 358 per 1000 | 294 per 1000 | RR 0.82 | 417 | ⊕⊝⊝⊝ | |
| Dropouts due to any cause (acceptability) | 215 per 1000 | 187 per 1000 | RR 0.85 | 479 | ⊕⊝⊝⊝ | |
| *The basis for the assumed risk (e.g. the median control group risk across studies) is provided in footnotes. The corresponding risk (and its 95% confidence interval) is based on the assumed risk in the comparison group and the relative effect of the intervention (and its 95% CI). | ||||||
| GRADE Working Group grades of evidence | ||||||
| 1 Downgraded as no studies described the outcome assessment as masked. This should be considered a major limitation, which is likely to result in a biased assessment of the intervention effect. | ||||||
| SSRIs compared to TCAs for patients with cancer and depression | ||||||
| Patient or population: patients with cancer and depression | ||||||
| Outcomes | Illustrative comparative risks* (95% CI) | Relative effect | No of participants | Certainty (Quality) of the evidence | Comments | |
| Assumed risk | Corresponding risk | |||||
| TCAs | SSRIs | |||||
| Efficacy as a continuous outcome | The mean efficacy as a continuous outcome (SMD) in the intervention groups was | 237 | ⊕⊝⊝⊝ | |||
| Efficacy as a dichotomous outcome | Study population | RR 1.10 (0.78 to 1.53 | 199 | ⊕⊝⊝⊝ | ||
| 388 per 1000 | 454 per 1000 | |||||
| Dropouts due to any cause (acceptability) | Study population | RR 0.83 | 237 | ⊕⊝⊝⊝ | ||
| 261 per 1000 | 217 per 1000 | |||||
| *The basis for the assumed risk (e.g. the median control group risk across studies) is provided in footnotes. The corresponding risk (and its 95% confidence interval) is based on the assumed risk in the comparison group and the relative effect of the intervention (and its 95% CI). | ||||||
| GRADE Working Group grades of evidence | ||||||
| 1 Downgraded as no studies described the outcome assessment as masked. This should be considered a major limitation, which is likely to result in a biased assessment of the intervention effect. | ||||||
| Outcome or subgroup title | No. of studies | No. of participants | Statistical method | Effect size |
| 1 Antidepressants versus placebo Show forest plot | 5 | 266 | Std. Mean Difference (IV, Random, 95% CI) | ‐0.45 [‐1.01, 0.11] |
| 1.1 SSRIs | 4 | 194 | Std. Mean Difference (IV, Random, 95% CI) | ‐0.21 [‐0.50, 0.08] |
| 1.2 Tricyclic antidepressants | 1 | 17 | Std. Mean Difference (IV, Random, 95% CI) | 0.04 [‐0.95, 1.04] |
| 1.3 Other antidepressants | 1 | 55 | Std. Mean Difference (IV, Random, 95% CI) | ‐1.77 [‐2.40, ‐1.14] |
| 2 Antidepressants versus antidepressants Show forest plot | 3 | 237 | Std. Mean Difference (IV, Random, 95% CI) | ‐0.08 [‐0.34, 0.18] |
| 2.1 Paroxetine versus desipramine | 1 | 24 | Std. Mean Difference (IV, Random, 95% CI) | 0.08 [‐0.73, 0.88] |
| 2.2 Paroxetine versus amitriptyline | 1 | 175 | Std. Mean Difference (IV, Random, 95% CI) | ‐0.16 [‐0.46, 0.14] |
| 2.3 Fluoxetine versus desipramine | 1 | 38 | Std. Mean Difference (IV, Random, 95% CI) | 0.19 [‐0.45, 0.83] |
| Outcome or subgroup title | No. of studies | No. of participants | Statistical method | Effect size |
| 1 Antidepressants versus placebo Show forest plot | 5 | 310 | Std. Mean Difference (IV, Random, 95% CI) | ‐0.29 [‐0.72, 0.13] |
| 1.1 SSRIs | 3 | 182 | Std. Mean Difference (IV, Random, 95% CI) | 0.02 [‐0.27, 0.32] |
| 1.2 Other antidepressants | 2 | 128 | Std. Mean Difference (IV, Random, 95% CI) | ‐0.71 [‐1.26, ‐0.16] |
| Outcome or subgroup title | No. of studies | No. of participants | Statistical method | Effect size |
| 1 Antidepressants versus placebo Show forest plot | 5 | 417 | Risk Ratio (M‐H, Random, 95% CI) | 0.82 [0.62, 1.08] |
| 1.1 SSRIs | 3 | 272 | Risk Ratio (M‐H, Random, 95% CI) | 0.94 [0.79, 1.11] |
| 1.2 Tricyclic antidepressants | 1 | 17 | Risk Ratio (M‐H, Random, 95% CI) | 1.09 [0.42, 2.86] |
| 1.3 Other antidepressants | 2 | 128 | Risk Ratio (M‐H, Random, 95% CI) | 0.47 [0.30, 0.75] |
| 2 Antidepressants versus antidepressants Show forest plot | 2 | 199 | Risk Ratio (M‐H, Random, 95% CI) | 1.10 [0.78, 1.53] |
| 2.1 Paroxetine versus amitriptyline | 1 | 175 | Risk Ratio (M‐H, Random, 95% CI) | 1.14 [0.79, 1.63] |
| 2.2 Paroxetine versus desipramine | 1 | 24 | Risk Ratio (M‐H, Random, 95% CI) | 0.85 [0.33, 2.18] |
| Outcome or subgroup title | No. of studies | No. of participants | Statistical method | Effect size |
| 1 Antidepressants versus antidepressants Show forest plot | 1 | 175 | Mean Difference (IV, Random, 95% CI) | 0.10 [‐0.38, 0.58] |
| 1.1 Paroxetine versus amitriptyline | 1 | 175 | Mean Difference (IV, Random, 95% CI) | 0.10 [‐0.38, 0.58] |
| Outcome or subgroup title | No. of studies | No. of participants | Statistical method | Effect size |
| 1 Antidepressants versus placebo Show forest plot | 2 | 152 | Std. Mean Difference (IV, Random, 95% CI) | 0.05 [‐0.27, 0.37] |
| 1.1 SSRIs | 2 | 152 | Std. Mean Difference (IV, Random, 95% CI) | 0.05 [‐0.27, 0.37] |
| 2 Antidepressants versus antidepressants Show forest plot | 1 | 153 | Mean Difference (IV, Random, 95% CI) | 6.5 [0.21, 12.79] |
| 2.1 Paroxetine versus amitriptyline | 1 | 153 | Mean Difference (IV, Random, 95% CI) | 6.5 [0.21, 12.79] |
| Outcome or subgroup title | No. of studies | No. of participants | Statistical method | Effect size |
| 1 Antidepressants versus placebo Show forest plot | 6 | 455 | Risk Ratio (M‐H, Random, 95% CI) | 0.41 [0.13, 1.32] |
| 1.1 SSRIs | 4 | 310 | Risk Ratio (M‐H, Random, 95% CI) | 0.87 [0.10, 7.31] |
| 1.2 Tricyclic antidepressants | 1 | 17 | Risk Ratio (M‐H, Random, 95% CI) | 2.92 [0.16, 52.47] |
| 1.3 Other antidepressants | 2 | 128 | Risk Ratio (M‐H, Random, 95% CI) | 0.18 [0.05, 0.65] |
| 2 Antidepressants versus antidepressants Show forest plot | 3 | 237 | Risk Ratio (M‐H, Random, 95% CI) | 0.85 [0.14, 5.06] |
| 2.1 Fluoxetine versus desipramine | 1 | 38 | Risk Ratio (M‐H, Random, 95% CI) | 0.0 [0.0, 0.0] |
| 2.2 Paroxetine versus amitriptyline | 1 | 175 | Risk Ratio (M‐H, Random, 95% CI) | 0.0 [0.0, 0.0] |
| 2.3 Paroxetine versus desipramine | 1 | 24 | Risk Ratio (M‐H, Random, 95% CI) | 0.85 [0.14, 5.06] |
| Outcome or subgroup title | No. of studies | No. of participants | Statistical method | Effect size |
| 1 Antidepressants versus placebo Show forest plot | 7 | 479 | Risk Ratio (M‐H, Random, 95% CI) | 1.19 [0.54, 2.62] |
| 1.1 SSRIs | 5 | 334 | Risk Ratio (M‐H, Random, 95% CI) | 1.99 [0.71, 5.57] |
| 1.2 Tricyclic antidepressants | 1 | 17 | Risk Ratio (M‐H, Random, 95% CI) | 0.55 [0.04, 7.25] |
| 1.3 Other antidepressants | 2 | 128 | Risk Ratio (M‐H, Random, 95% CI) | 0.59 [0.15, 2.35] |
| 2 Antidepressants versus antidepressants Show forest plot | 3 | 237 | Risk Ratio (M‐H, Random, 95% CI) | 1.04 [0.55, 1.99] |
| 2.1 Fluoxetine versus desipramine | 1 | 38 | Risk Ratio (M‐H, Random, 95% CI) | 1.21 [0.41, 3.62] |
| 2.2 Paroxetine versus amitriptyline | 1 | 175 | Risk Ratio (M‐H, Random, 95% CI) | 0.89 [0.38, 2.08] |
| 2.3 Paroxetine versus desipramine | 1 | 24 | Risk Ratio (M‐H, Random, 95% CI) | 1.69 [0.18, 16.25] |
| Outcome or subgroup title | No. of studies | No. of participants | Statistical method | Effect size |
| 1 Antidepressants versus placebo Show forest plot | 7 | 479 | Risk Ratio (M‐H, Random, 95% CI) | 0.85 [0.52, 1.38] |
| 1.1 SSRIs | 5 | 334 | Risk Ratio (M‐H, Random, 95% CI) | 1.37 [0.84, 2.24] |
| 1.2 Tricyclic antidepressants | 1 | 17 | Risk Ratio (M‐H, Random, 95% CI) | 0.73 [0.24, 2.23] |
| 1.3 Other antidepressants | 2 | 128 | Risk Ratio (M‐H, Random, 95% CI) | 0.43 [0.25, 0.75] |
| 2 Antidepressants versus antidepressants Show forest plot | 3 | 237 | Risk Ratio (M‐H, Random, 95% CI) | 0.83 [0.53, 1.30] |
| 2.1 Fluoxetine versus desipramine | 1 | 38 | Risk Ratio (M‐H, Random, 95% CI) | 0.69 [0.29, 1.68] |
| 2.2 Paroxetine versus amitriptyline | 1 | 175 | Risk Ratio (M‐H, Random, 95% CI) | 0.83 [0.46, 1.51] |
| 2.3 Paroxetine versus desipramine | 1 | 24 | Risk Ratio (M‐H, Random, 95% CI) | 1.06 [0.37, 3.00] |
| Outcome or subgroup title | No. of studies | No. of participants | Statistical method | Effect size |
| 1 Antidepressants versus placebo Show forest plot | 4 | 197 | Std. Mean Difference (IV, Random, 95% CI) | ‐0.51 [‐1.23, 0.21] |
| 1.1 Patients with major depressive disorder | 2 | 90 | Std. Mean Difference (IV, Random, 95% CI) | ‐0.58 [‐1.94, 0.78] |
| 1.2 Patients with adjustment disorder, dysthymic disorder, depressive symptoms | 2 | 107 | Std. Mean Difference (IV, Random, 95% CI) | ‐0.28 [‐0.67, 0.10] |
| 2 Antidepressants versus antidepressants Show forest plot | 2 | 199 | Std. Mean Difference (IV, Random, 95% CI) | ‐0.13 [‐0.41, 0.15] |
| 2.1 Patients with major depressive disorder | 2 | 199 | Std. Mean Difference (IV, Random, 95% CI) | ‐0.13 [‐0.41, 0.15] |
| 2.2 Patients with adjustment disorder, dysthymic disorder, depressive symptoms | 0 | 0 | Std. Mean Difference (IV, Random, 95% CI) | 0.0 [0.0, 0.0] |
| Outcome or subgroup title | No. of studies | No. of participants | Statistical method | Effect size |
| 1 Antidepressants versus placebo Show forest plot | 5 | 266 | Std. Mean Difference (IV, Random, 95% CI) | ‐0.45 [‐1.01, 0.11] |
| 1.1 Patients with breast cancer | 2 | 90 | Std. Mean Difference (IV, Random, 95% CI) | ‐0.58 [‐1.94, 0.78] |
| 1.2 Patients with other cancer types | 3 | 176 | Std. Mean Difference (IV, Random, 95% CI) | ‐0.24 [‐0.54, 0.06] |
| 2 Antidepressants versus antidepressants Show forest plot | 3 | 237 | Std. Mean Difference (IV, Random, 95% CI) | ‐0.08 [‐0.34, 0.18] |
| 2.1 Patients with breast cancer | 2 | 199 | Std. Mean Difference (IV, Random, 95% CI) | ‐0.13 [‐0.41, 0.15] |
| 2.2 Patients with other cancer types | 1 | 38 | Std. Mean Difference (IV, Random, 95% CI) | 0.19 [‐0.45, 0.83] |
| Outcome or subgroup title | No. of studies | No. of participants | Statistical method | Effect size |
| 1 Antidepressants versus placebo Show forest plot | 2 | 93 | Std. Mean Difference (IV, Random, 95% CI) | ‐0.25 [‐0.66, 0.16] |
| 1.1 Patients with an early stage cancer | 1 | 69 | Std. Mean Difference (IV, Random, 95% CI) | ‐0.17 [‐0.65, 0.31] |
| 1.2 Patients with a late stage cancer | 1 | 24 | Std. Mean Difference (IV, Random, 95% CI) | ‐0.48 [‐1.30, 0.33] |
| 2 Antidepressants versus antidepressants Show forest plot | 1 | 38 | Mean Difference (IV, Random, 95% CI) | 0.69 [‐1.61, 2.99] |
| 2.1 Patients with an early stage cancer | 1 | 38 | Mean Difference (IV, Random, 95% CI) | 0.69 [‐1.61, 2.99] |
| 2.2 Patients with a late stage cancer | 0 | 0 | Mean Difference (IV, Random, 95% CI) | 0.0 [0.0, 0.0] |
| Outcome or subgroup title | No. of studies | No. of participants | Statistical method | Effect size |
| 1 Antidepressants versus placebo Show forest plot | 4 | 183 | Std. Mean Difference (IV, Random, 95% CI) | ‐0.49 [‐1.23, 0.25] |
| 1.1 SSRIs | 3 | 111 | Std. Mean Difference (IV, Random, 95% CI) | ‐0.20 [‐0.58, 0.18] |
| 1.2 Tricyclic antidepressants | 1 | 17 | Std. Mean Difference (IV, Random, 95% CI) | 0.04 [‐0.95, 1.04] |
| 1.3 Other antidepressants | 1 | 55 | Std. Mean Difference (IV, Random, 95% CI) | ‐1.77 [‐2.40, ‐1.14] |
| Outcome or subgroup title | No. of studies | No. of participants | Statistical method | Effect size |
| 1 Antidepressants versus placebo Show forest plot | 4 | 231 | Std. Mean Difference (IV, Random, 95% CI) | ‐0.64 [‐1.35, 0.06] |
| 1.1 SSRIs | 3 | 176 | Std. Mean Difference (IV, Random, 95% CI) | ‐0.24 [‐0.54, 0.06] |
| 1.2 Tricyclic antidepressants | 0 | 0 | Std. Mean Difference (IV, Random, 95% CI) | 0.0 [0.0, 0.0] |
| 1.3 Other antidepressants | 1 | 55 | Std. Mean Difference (IV, Random, 95% CI) | ‐1.77 [‐2.40, ‐1.14] |