Scolaris Content Display Scolaris Content Display

PRISMA Flow Diagram
Figuras y tablas -
Figure 1

PRISMA Flow Diagram

Risk of bias summary: review authors' judgements about each risk of bias item for each included study.
Figuras y tablas -
Figure 2

Risk of bias summary: review authors' judgements about each risk of bias item for each included study.

Risk of bias graph: review authors' judgements about each risk of bias item presented as percentages across all included studies.
Figuras y tablas -
Figure 3

Risk of bias graph: review authors' judgements about each risk of bias item presented as percentages across all included studies.

Forest plot of comparison: 2 Exposure to any drug; comparison group: subfertile; any, outcome: 2.1 Endometrial cancer; subgroup by effect estimate.
Figuras y tablas -
Figure 4

Forest plot of comparison: 2 Exposure to any drug; comparison group: subfertile; any, outcome: 2.1 Endometrial cancer; subgroup by effect estimate.

Forest plot of comparison: 6 Exposure to any drug; comparison group: general population; any, outcome: 6.1 Endometrial cancer; subgroup by effect estimate.
Figuras y tablas -
Figure 5

Forest plot of comparison: 6 Exposure to any drug; comparison group: general population; any, outcome: 6.1 Endometrial cancer; subgroup by effect estimate.

Funnel plot of comparison: 6 Exposure to any drug; comparison group: general population; any, outcome: 6.1 Endometrial cancer; subgroup by effect estimate.
Figuras y tablas -
Figure 6

Funnel plot of comparison: 6 Exposure to any drug; comparison group: general population; any, outcome: 6.1 Endometrial cancer; subgroup by effect estimate.

Comparison 1 Exposure to any drug; comparison group: subfertile; any, Outcome 1 Endometrial cancer; subgroup by effect estimate.
Figuras y tablas -
Analysis 1.1

Comparison 1 Exposure to any drug; comparison group: subfertile; any, Outcome 1 Endometrial cancer; subgroup by effect estimate.

Comparison 2 Exposure to any drug; comparison group: subfertile; parous women, Outcome 1 Endometrial cancer; subgroup by effect estimate.
Figuras y tablas -
Analysis 2.1

Comparison 2 Exposure to any drug; comparison group: subfertile; parous women, Outcome 1 Endometrial cancer; subgroup by effect estimate.

Comparison 3 Exposure to any drug; comparison group: subfertile; nulliparous women, Outcome 1 Endometrial cancer.
Figuras y tablas -
Analysis 3.1

Comparison 3 Exposure to any drug; comparison group: subfertile; nulliparous women, Outcome 1 Endometrial cancer.

Comparison 4 Exposure to any drug; comparison group: subfertile; low number of cycles, Outcome 1 Endometrial cancer.
Figuras y tablas -
Analysis 4.1

Comparison 4 Exposure to any drug; comparison group: subfertile; low number of cycles, Outcome 1 Endometrial cancer.

Comparison 5 Exposure to any drug; comparison group: subfertile; medium number of cycles, Outcome 1 Endometrial cancer.
Figuras y tablas -
Analysis 5.1

Comparison 5 Exposure to any drug; comparison group: subfertile; medium number of cycles, Outcome 1 Endometrial cancer.

Comparison 6 Exposure to any drug; comparison group: general population; any, Outcome 1 Endometrial cancer; subgroup by effect estimate.
Figuras y tablas -
Analysis 6.1

Comparison 6 Exposure to any drug; comparison group: general population; any, Outcome 1 Endometrial cancer; subgroup by effect estimate.

Comparison 7 Exposure to any drug; comparison group: general population; low number of cycles, Outcome 1 Endometrial cancer.
Figuras y tablas -
Analysis 7.1

Comparison 7 Exposure to any drug; comparison group: general population; low number of cycles, Outcome 1 Endometrial cancer.

Comparison 8 Exposure to any drug; comparison group: general population; medium number of cycles, Outcome 1 Endometrial cancer.
Figuras y tablas -
Analysis 8.1

Comparison 8 Exposure to any drug; comparison group: general population; medium number of cycles, Outcome 1 Endometrial cancer.

Comparison 9 Exposure to any drug; comparison group: general population; 0‐3 number of oocytes retrieved, Outcome 1 Endometrial cancer.
Figuras y tablas -
Analysis 9.1

Comparison 9 Exposure to any drug; comparison group: general population; 0‐3 number of oocytes retrieved, Outcome 1 Endometrial cancer.

Comparison 10 Exposure to any drug; comparison group: general population; >10 number of oocytes retrieved, Outcome 1 Endometrial cancer.
Figuras y tablas -
Analysis 10.1

Comparison 10 Exposure to any drug; comparison group: general population; >10 number of oocytes retrieved, Outcome 1 Endometrial cancer.

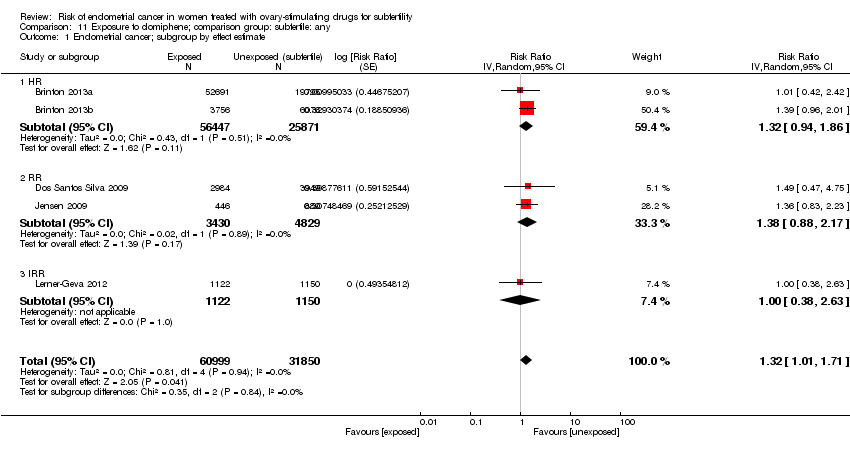
Comparison 11 Exposure to clomiphene; comparison group: subfertile: any, Outcome 1 Endometrial cancer; subgroup by effect estimate.
Figuras y tablas -
Analysis 11.1

Comparison 11 Exposure to clomiphene; comparison group: subfertile: any, Outcome 1 Endometrial cancer; subgroup by effect estimate.

Comparison 12 Exposure to clomiphene; comparison group: subfertile; low dosage, Outcome 1 Endometrial cancer.
Figuras y tablas -
Analysis 12.1

Comparison 12 Exposure to clomiphene; comparison group: subfertile; low dosage, Outcome 1 Endometrial cancer.

Comparison 13 Exposure to clomiphene; comparison group: subfertile; medium dosage, Outcome 1 Endometrial cancer.
Figuras y tablas -
Analysis 13.1

Comparison 13 Exposure to clomiphene; comparison group: subfertile; medium dosage, Outcome 1 Endometrial cancer.

Comparison 14 Exposure to clomiphene; comparison group: subfertile; high dosage, Outcome 1 Endometrial cancer.
Figuras y tablas -
Analysis 14.1

Comparison 14 Exposure to clomiphene; comparison group: subfertile; high dosage, Outcome 1 Endometrial cancer.

Comparison 15 Exposure to clomiphene; comparison group: subfertile; medium number of cycles, Outcome 1 Endometrial cancer; subgroup by effect estimate.
Figuras y tablas -
Analysis 15.1

Comparison 15 Exposure to clomiphene; comparison group: subfertile; medium number of cycles, Outcome 1 Endometrial cancer; subgroup by effect estimate.

Comparison 16 Exposure to clomiphene; comparison group: subfertile; high number of cycles, Outcome 1 Endometrial cancer; subgroup by effect estimate.
Figuras y tablas -
Analysis 16.1

Comparison 16 Exposure to clomiphene; comparison group: subfertile; high number of cycles, Outcome 1 Endometrial cancer; subgroup by effect estimate.

Comparison 17 Exposure to clomiphene; comparison group: subfertile: parous women, Outcome 1 Endometrial cancer; subgroup by effect estimate.
Figuras y tablas -
Analysis 17.1

Comparison 17 Exposure to clomiphene; comparison group: subfertile: parous women, Outcome 1 Endometrial cancer; subgroup by effect estimate.

Comparison 18 Exposure to clomiphene; comparison group: subfertile; nulliparous women, Outcome 1 Endometrial cancer.
Figuras y tablas -
Analysis 18.1

Comparison 18 Exposure to clomiphene; comparison group: subfertile; nulliparous women, Outcome 1 Endometrial cancer.

Comparison 19 Exposure to clomiphene; comparison group: general population; any, Outcome 1 Endometrial cancer; subgroup by effect estimate.
Figuras y tablas -
Analysis 19.1

Comparison 19 Exposure to clomiphene; comparison group: general population; any, Outcome 1 Endometrial cancer; subgroup by effect estimate.

Comparison 20 Exposure to clomiphene; comparison group: general population; low dosage, Outcome 1 Endometrial cancer.
Figuras y tablas -
Analysis 20.1

Comparison 20 Exposure to clomiphene; comparison group: general population; low dosage, Outcome 1 Endometrial cancer.

Comparison 21 Exposure to clomiphene; comparison group: general population; high dosage, Outcome 1 Endometrial cancer.
Figuras y tablas -
Analysis 21.1

Comparison 21 Exposure to clomiphene; comparison group: general population; high dosage, Outcome 1 Endometrial cancer.

Comparison 22 Exposure to clomiphene; comparison group: general population; low number of cycles, Outcome 1 Endometrial cancer.
Figuras y tablas -
Analysis 22.1

Comparison 22 Exposure to clomiphene; comparison group: general population; low number of cycles, Outcome 1 Endometrial cancer.

Comparison 23 Exposure to clomiphene; comparison group: general population; high number of cycles, Outcome 1 Endometrial cancer.
Figuras y tablas -
Analysis 23.1

Comparison 23 Exposure to clomiphene; comparison group: general population; high number of cycles, Outcome 1 Endometrial cancer.

Comparison 24 Exposure to gonadotropins; comparison group: subfertile; any, Outcome 1 Endometrial cancer; subgroup by effect estimate.
Figuras y tablas -
Analysis 24.1

Comparison 24 Exposure to gonadotropins; comparison group: subfertile; any, Outcome 1 Endometrial cancer; subgroup by effect estimate.

Comparison 25 Exposure to gonadotropins; comparison group: subfertile; medium number of cycles, Outcome 1 Endometrial cancer.
Figuras y tablas -
Analysis 25.1

Comparison 25 Exposure to gonadotropins; comparison group: subfertile; medium number of cycles, Outcome 1 Endometrial cancer.

Comparison 26 Exposure to gonadotropins; comparison group: subfertile; high number of cycles, Outcome 1 Endometrial cancer.
Figuras y tablas -
Analysis 26.1

Comparison 26 Exposure to gonadotropins; comparison group: subfertile; high number of cycles, Outcome 1 Endometrial cancer.

Comparison 27 Exposure to gonadotropins; comparison group: general population; any, Outcome 1 Endometrial cancer.
Figuras y tablas -
Analysis 27.1

Comparison 27 Exposure to gonadotropins; comparison group: general population; any, Outcome 1 Endometrial cancer.

Comparison 28 Exposure to clomiphene + gonadotropins; comparison group: subfertile; any, Outcome 1 Endometrial cancer.
Figuras y tablas -
Analysis 28.1

Comparison 28 Exposure to clomiphene + gonadotropins; comparison group: subfertile; any, Outcome 1 Endometrial cancer.

Comparison 29 Exposure to clomiphene + gonadotropins; comparison group: general population; any, Outcome 1 Endometrial cancer.
Figuras y tablas -
Analysis 29.1

Comparison 29 Exposure to clomiphene + gonadotropins; comparison group: general population; any, Outcome 1 Endometrial cancer.

Comparison 30 Exposure to GnRH; comparison group: subfertile; any, Outcome 1 Endometrial cancer.
Figuras y tablas -
Analysis 30.1

Comparison 30 Exposure to GnRH; comparison group: subfertile; any, Outcome 1 Endometrial cancer.

Comparison 31 Exposure to GnRH; comparison group: subfertile; parous women, Outcome 1 Endometrial cancer.
Figuras y tablas -
Analysis 31.1

Comparison 31 Exposure to GnRH; comparison group: subfertile; parous women, Outcome 1 Endometrial cancer.

Comparison 32 Exposure to GnRH; comparison group: subfertile; nulliparous women, Outcome 1 Endometrial cancer.
Figuras y tablas -
Analysis 32.1

Comparison 32 Exposure to GnRH; comparison group: subfertile; nulliparous women, Outcome 1 Endometrial cancer.

Comparison 33 Exposure to any drug; comparison group: subfertile; any; follow‐up >10 years, Outcome 1 Endometrial cancer; subgroup by effect estimate.
Figuras y tablas -
Analysis 33.1

Comparison 33 Exposure to any drug; comparison group: subfertile; any; follow‐up >10 years, Outcome 1 Endometrial cancer; subgroup by effect estimate.

Comparison 34 Exposure to any drug; comparison group: general population; any; follow‐up>10 years, Outcome 1 Endometrial cancer; subgroup by effect estimate.
Figuras y tablas -
Analysis 34.1

Comparison 34 Exposure to any drug; comparison group: general population; any; follow‐up>10 years, Outcome 1 Endometrial cancer; subgroup by effect estimate.

Comparison 35 Exposure to clomiphene; comparison group: subfertile; any; follow‐up>10 years, Outcome 1 Endometrial cancer; subgroup by effect estimate.
Figuras y tablas -
Analysis 35.1

Comparison 35 Exposure to clomiphene; comparison group: subfertile; any; follow‐up>10 years, Outcome 1 Endometrial cancer; subgroup by effect estimate.

Comparison 36 Exposure to clomiphene; comparison group: general population; any; follow‐up>10 years, Outcome 1 Endometrial cancer; subgroup by effect estimate.
Figuras y tablas -
Analysis 36.1

Comparison 36 Exposure to clomiphene; comparison group: general population; any; follow‐up>10 years, Outcome 1 Endometrial cancer; subgroup by effect estimate.

Comparison 37 Exposure to gonadotropins; comparison group: subfertile; any; follow‐up>10 years, Outcome 1 Endometrial cancer; subgroup by effect estimate.
Figuras y tablas -
Analysis 37.1

Comparison 37 Exposure to gonadotropins; comparison group: subfertile; any; follow‐up>10 years, Outcome 1 Endometrial cancer; subgroup by effect estimate.

Comparison 38 Exposure to clomiphene + gonadotropins; comparison group: general population; any; follow‐up>10 years, Outcome 1 Endometrial cancer.
Figuras y tablas -
Analysis 38.1

Comparison 38 Exposure to clomiphene + gonadotropins; comparison group: general population; any; follow‐up>10 years, Outcome 1 Endometrial cancer.

Summary of findings for the main comparison. Exposure to any ovary‐stimulating drugs for subfertility compared to untreated subfertile women and endometrial cancer risk

Patient or population: Women treated with ovary‐stimulating drugs for subfertility
Intervention: Exposure to any ovary‐stimulating drug for subfertility
Comparison: Untreated subfertile women

Outcomes

Anticipated absolute effects* (95% CI)

Relative effect
(95% CI)

№ of participants
(studies)

Quality of the evidence
(GRADE)

Comments

Risk with no treatment

Risk with exposure to any ovary‐stimulating drug for subfertility

Endometrial cancer

Study population

RR 0.96
(0.67 to 1.37)

156,774
(6 observational studies)

⊕⊝⊝⊝
Very low 1,2,3

111 per 100,000

109 per 100,000
(74 to 163)

*The risk in the intervention group (and its 95% confidence interval) is based on the assumed risk in the comparison group and the relative effect of the intervention (and its 95% CI).

CI: Confidence interval; RR: Risk ratio

GRADE Working Group grades of evidence
High quality: We are very confident that the true effect lies close to that of the estimate of the effect
Moderate quality: We are moderately confident in the effect estimate: The true effect is likely to be close to the estimate of the effect, but there is a possibility that it is substantially different
Low quality: Our confidence in the effect estimate is limited: The true effect may be substantially different from the estimate of the effect
Very low quality: We have very little confidence in the effect estimate: The true effect is likely to be substantially different from the estimate of effect

1 Initial level of evidence was 'low' because of the study design (observational studies).
2 Downgraded because of high risk of bias.
3Optimal information size (OIS) criterion not met (OIS = 499,938); however, the sample size was large.

Figuras y tablas -
Summary of findings for the main comparison. Exposure to any ovary‐stimulating drugs for subfertility compared to untreated subfertile women and endometrial cancer risk
Summary of findings 2. Exposure to any ovary‐stimulating drugs for subfertility compared to general population and endometrial cancer risk

Patient or population: Women treated with ovary‐stimulating drugs for subfertility
Intervention: Exposure to any ovary‐stimulating drug for subfertility
Comparison: General population

Outcomes

Anticipated absolute effects* (95% CI)

Relative effect
(95% CI)

№ of participants
(studies)

Quality of the evidence
(GRADE)

Comments

Risk with no treatment

Risk with exposure to any ovary‐stimulating drug for subfertility

Endometrial cancer

Study population

RR 1.75
(1.18 to 2.61)

1,762,829
(15 observational studies)

⊕⊝⊝⊝
Very low 1,2,3

53 per 100,000

92 per 100,000
(62 to 138)

*The risk in the intervention group (and its 95% confidence interval) is based on the assumed risk in the comparison group and the relative effect of the intervention (and its 95% CI).

CI: Confidence interval; RR: Risk ratio

GRADE Working Group grades of evidence
High quality: We are very confident that the true effect lies close to that of the estimate of the effect
Moderate quality: We are moderately confident in the effect estimate: The true effect is likely to be close to the estimate of the effect, but there is a possibility that it is substantially different
Low quality: Our confidence in the effect estimate is limited: The true effect may be substantially different from the estimate of the effect
Very low quality: We have very little confidence in the effect estimate: The true effect is likely to be substantially different from the estimate of effect

1 Initial level of evidence was 'low' because of the study design (observational studies).
2 Downgraded because of high risk of bias.
3 Downgraded due to inconsistency of results (significant heterogeneity) and imprecision.

Figuras y tablas -
Summary of findings 2. Exposure to any ovary‐stimulating drugs for subfertility compared to general population and endometrial cancer risk
Summary of findings 3. Exposure to clomiphene citrate for subfertility compared to untreated subfertile women and endometrial cancer risk

Patient or population: Women treated with ovary‐stimulating drugs for subfertility
Intervention: Exposure to clomiphene citrate for subfertility
Comparison: Untreated subfertile women

Outcomes

Anticipated absolute effects* (95% CI)

Relative effect
(95% CI)

№ of participants
(studies)

Quality of the evidence
(GRADE)

Comments

Risk with no treatment

Risk with exposure to clomiphene citrate for subfertility

Endometrial cancer

Study population

RR 1.32
(1.01 to 1.71)

92,849
(5 observational studies)

⊕⊝⊝⊝
Very low 1,2,3

524 per 100,000

691 per 100,000
(530 to 894)

*The risk in the intervention group (and its 95% confidence interval) is based on the assumed risk in the comparison group and the relative effect of the intervention (and its 95% CI).

CI: Confidence interval; RR: Risk ratio

GRADE Working Group grades of evidence
High quality: We are very confident that the true effect lies close to that of the estimate of the effect
Moderate quality: We are moderately confident in the effect estimate: The true effect is likely to be close to the estimate of the effect, but there is a possibility that it is substantially different
Low quality: Our confidence in the effect estimate is limited: The true effect may be substantially different from the estimate of the effect
Very low quality: We have very little confidence in the effect estimate: The true effect is likely to be substantially different from the estimate of effect

1 Initial level of evidence was 'low' because of the study design (observational studies).
2 Downgraded because of risk of bias.
3 Optimal information size (OIS) criterion not met; however, the sample size was large.

Figuras y tablas -
Summary of findings 3. Exposure to clomiphene citrate for subfertility compared to untreated subfertile women and endometrial cancer risk
Summary of findings 4. Exposure to clomiphene citrate for subfertility compared to general population and endometrial cancer risk

Patient or population: Women treated with ovary‐stimulating drugs for subfertility
Intervention: Exposure to clomiphene citrate for subfertility
Comparison: General population

Outcomes

Anticipated absolute effects* (95% CI)

Relative effect
(95% CI)

№ of participants
(studies)

Quality of the evidence
(GRADE)

Comments

Risk with no treatment

Risk with exposure to clomiphene citrate for subfertility

Endometrial cancer

Study population

RR 1.87
(1.00 to 3.48)

19,614
(4 observational studies)

⊕⊝⊝⊝
Very low 1,2,3

284 per 100,000

529 per 100,000
(284 to 980)

*The risk in the intervention group (and its 95% confidence interval) is based on the assumed risk in the comparison group and the relative effect of the intervention (and its 95% CI).

CI: Confidence interval; RR: Risk ratio

GRADE Working Group grades of evidence
High quality: We are very confident that the true effect lies close to that of the estimate of the effect
Moderate quality: We are moderately confident in the effect estimate: The true effect is likely to be close to the estimate of the effect, but there is a possibility that it is substantially different
Low quality: Our confidence in the effect estimate is limited: The true effect may be substantially different from the estimate of the effect
Very low quality: We have very little confidence in the effect estimate: The true effect is likely to be substantially different from the estimate of effect

1 Initial level of evidence was 'low' because of the study design (observational studies).
2 Downgraded because of risk of bias.
3Optimal information size (OIS) criterion not met.

Figuras y tablas -
Summary of findings 4. Exposure to clomiphene citrate for subfertility compared to general population and endometrial cancer risk
Summary of findings 5. Exposure to gonadotropins for subfertility compared to untreated subfertile women and endometrial cancer risk

undefined

Patient or population: Women treated with ovary‐stimulating drugs for subfertility
Intervention: Exposure to gonadotropins for subfertility
Comparison: Untreated subfertile women

Outcomes

Anticipated absolute effects* (95% CI)

Relative effect
(95% CI)

№ of participants
(studies)

Quality of the evidence
(GRADE)

Comments

Risk with no treatment

Risk with exposure to gonadotropins for subfertility

Endometrial cancer

Study population

RR 1.55
(1.03 to 2.34)

17,769
(4 observational studies)

⊕⊝⊝⊝

Very low 1,2,3

1291 per 100,000

1987 per 100,000
(1329 to 2970)

*The risk in the intervention group (and its 95% confidence interval) is based on the assumed risk in the comparison group and the relative effect of the intervention (and its 95% CI).

CI: Confidence interval; RR: Risk ratio

GRADE Working Group grades of evidence
High quality: We are very confident that the true effect lies close to that of the estimate of the effect
Moderate quality: We are moderately confident in the effect estimate: The true effect is likely to be close to the estimate of the effect, but there is a possibility that it is substantially different
Low quality: Our confidence in the effect estimate is limited: The true effect may be substantially different from the estimate of the effect
Very low quality: We have very little confidence in the effect estimate: The true effect is likely to be substantially different from the estimate of effect

1 Initial level of evidence was 'low' because of the study design (observational studies).
2 Downgraded because of risk of bias in most studies and imprecise estimates in one study.
3 Optimal information size (OIS) not met.

Figuras y tablas -
Summary of findings 5. Exposure to gonadotropins for subfertility compared to untreated subfertile women and endometrial cancer risk
Summary of findings 6. Exposure to gonadotropins for subfertility compared to general population and endometrial cancer risk

Patient or population: Women treated with ovary‐stimulating drugs for subfertility
Intervention: Exposure to gonadotropins for subfertility
Comparison: General population

Outcomes

Anticipated absolute effects* (95% CI)

Relative effect
(95% CI)

№ of participants
(studies)

Quality of the evidence
(GRADE)

Comments

Risk with no treatment

Risk with exposure to gonadotropins for subfertility

Endometrial cancer

Study population

RR 2.12
(0.79 to 5.64)

1595
(2 observational studies)

⊕⊝⊝⊝
Very low 1,2,3

542 per 100,000

1148 per 100,000
(428 to 3054)

*The risk in the intervention group (and its 95% confidence interval) is based on the assumed risk in the comparison group and the relative effect of the intervention (and its 95% CI).

CI: Confidence interval; RR: Risk ratio

GRADE Working Group grades of evidence
High quality: We are very confident that the true effect lies close to that of the estimate of the effect
Moderate quality: We are moderately confident in the effect estimate: The true effect is likely to be close to the estimate of the effect, but there is a possibility that it is substantially different
Low quality: Our confidence in the effect estimate is limited: The true effect may be substantially different from the estimate of the effect
Very low quality: We have very little confidence in the effect estimate: The true effect is likely to be substantially different from the estimate of effect

1 Initial level of evidence was 'low' because of the study design (observational studies).
2Downgraded because of risk of bias and imprecision.
3 Optimal information size (OIS) not met.

Figuras y tablas -
Summary of findings 6. Exposure to gonadotropins for subfertility compared to general population and endometrial cancer risk
Summary of findings 7. Exposure to clomiphene citrate and gonadotropins for subfertility compared to untreated subfertile women and endometrial cancer risk

Patient or population: Women treated with ovary‐stimulating drugs for subfertility
Intervention: Exposure to clomiphene citrate and gonadotropins for subfertility
Comparison: Untreated subfertile women

Outcomes

Anticipated absolute effects* (95% CI)

Relative effect
(95% CI)

№ of participants
(studies)

Quality of the evidence
(GRADE)

Comments

Risk with no treatment

Risk with exposure to clomiphene citrate and gonadotropins for subfertility

Endometrial cancer

Study population

RR 1.18
(0.57 to 2.44)

6345
(2 observational studies)

⊕⊝⊝⊝
Very low 1,2,3

490 per 100,000

579 per 100,000
(279 to 1196)

*The risk in the intervention group (and its 95% confidence interval) is based on the assumed risk in the comparison group and the relative effect of the intervention (and its 95% CI).

CI: Confidence interval; RR: Risk ratio

GRADE Working Group grades of evidence
High quality: We are very confident that the true effect lies close to that of the estimate of the effect
Moderate quality: We are moderately confident in the effect estimate: The true effect is likely to be close to the estimate of the effect, but there is a possibility that it is substantially different
Low quality: Our confidence in the effect estimate is limited: The true effect may be substantially different from the estimate of the effect
Very low quality: We have very little confidence in the effect estimate: The true effect is likely to be substantially different from the estimate of effect

1 Initial level of evidence was 'low' because of the study design (observational studies).
2 Downgraded because of risk of bias.
3 Optimal information size (OIS) criterion not met.

Figuras y tablas -
Summary of findings 7. Exposure to clomiphene citrate and gonadotropins for subfertility compared to untreated subfertile women and endometrial cancer risk
Summary of findings 8. Exposure to clomiphene citrate and gonadotropins for subfertility compared to general population and endometrial cancer risk

Patient or population: Women treated with ovary‐stimulating drugs for subfertility
Intervention: Exposure to clomiphene citrate and gonadotropins for subfertility
Comparison: General population 2.99 [1.53, 5.86]

Outcomes

Anticipated absolute effects* (95% CI)

Relative effect
(95% CI)

№ of participants
(studies)

Quality of the evidence
(GRADE)

Comments

Risk with no treatment

Risk with exposure to clomiphene citrate and gonadotropins for subfertility

Endometrial cancer

Study population

RR 2.99
(1.53 to 5.86)

7789
(3 observational studies)

⊕⊝⊝⊝
Very low1,2,3

76 per 100,000

245 per 100,000
(150 to 401)

*The risk in the intervention group (and its 95% confidence interval) is based on the assumed risk in the comparison group and the relative effect of the intervention (and its 95% CI).

CI: Confidence interval; RR: Risk ratio

GRADE Working Group grades of evidence
High quality: We are very confident that the true effect lies close to that of the estimate of the effect
Moderate quality: We are moderately confident in the effect estimate: The true effect is likely to be close to the estimate of the effect, but there is a possibility that it is substantially different
Low quality: Our confidence in the effect estimate is limited: The true effect may be substantially different from the estimate of the effect
Very low quality: We have very little confidence in the effect estimate: The true effect is likely to be substantially different from the estimate of effect

1 Initial level of evidence was 'low' because of the study design (observational studies).
2 Downgraded because of risk of bias.
3 Optimal information size (OIS) not met; however, the sample size was large.

Figuras y tablas -
Summary of findings 8. Exposure to clomiphene citrate and gonadotropins for subfertility compared to general population and endometrial cancer risk
Summary of findings 9. Exposure to GnRH analogues for subfertility compared to untreated subfertile women and endometrial cancer risk

Patient or population: Women treated with ovary‐stimulating drugs for subfertility
Intervention: Exposure to GnRH analogues for subfertility
Comparison: Untreated subfertile women

Outcomes

Anticipated absolute effects* (95% CI)

Relative effect
(95% CI)

№ of participants
(studies)

Quality of the evidence
(GRADE)

Comments

Risk with no treatment

Risk with exposure to GnRH analogs for subfertility

Endometrial cancer

Study population

RR 1.21
(0.65 to 2.27)

42,558
(2 observational studies)

⊕⊝⊝⊝
Very low 1,2,3

458 per 100,000

554 per 100,000
(297 to 1039)

*The risk in the intervention group (and its 95% confidence interval) is based on the assumed risk in the comparison group and the relative effect of the intervention (and its 95% CI).

CI: Confidence interval; RR: Risk ratio

GRADE Working Group grades of evidence
High quality: We are very confident that the true effect lies close to that of the estimate of the effect
Moderate quality: We are moderately confident in the effect estimate: The true effect is likely to be close to the estimate of the effect, but there is a possibility that it is substantially different
Low quality: Our confidence in the effect estimate is limited: The true effect may be substantially different from the estimate of the effect
Very low quality: We have very little confidence in the effect estimate: The true effect is likely to be substantially different from the estimate of effect

1Initial level of evidence was 'low' because of the study design (observational studies).
2 Downgraded because of risk of bias.
3Optimal information size (OIS) criterion not met; however, the sample size was large

Figuras y tablas -
Summary of findings 9. Exposure to GnRH analogues for subfertility compared to untreated subfertile women and endometrial cancer risk
Comparison 1. Exposure to any drug; comparison group: subfertile; any

Outcome or subgroup title

No. of studies

No. of participants

Statistical method

Effect size

1 Endometrial cancer; subgroup by effect estimate Show forest plot

6

156774

Risk Ratio (Random, 95% CI)

0.96 [0.67, 1.37]

1.1 RR

2

12548

Risk Ratio (Random, 95% CI)

1.31 [0.61, 2.81]

1.2 IRR

2

32131

Risk Ratio (Random, 95% CI)

0.86 [0.46, 1.63]

1.3 HR

2

112095

Risk Ratio (Random, 95% CI)

0.90 [0.52, 1.54]

Figuras y tablas -
Comparison 1. Exposure to any drug; comparison group: subfertile; any
Comparison 2. Exposure to any drug; comparison group: subfertile; parous women

Outcome or subgroup title

No. of studies

No. of participants

Statistical method

Effect size

1 Endometrial cancer; subgroup by effect estimate Show forest plot

2

Risk Ratio (Random, 95% CI)

1.00 [0.05, 18.85]

Figuras y tablas -
Comparison 2. Exposure to any drug; comparison group: subfertile; parous women
Comparison 3. Exposure to any drug; comparison group: subfertile; nulliparous women

Outcome or subgroup title

No. of studies

No. of participants

Statistical method

Effect size

1 Endometrial cancer Show forest plot

2

Risk Ratio (Random, 95% CI)

0.76 [0.35, 1.67]

Figuras y tablas -
Comparison 3. Exposure to any drug; comparison group: subfertile; nulliparous women
Comparison 4. Exposure to any drug; comparison group: subfertile; low number of cycles

Outcome or subgroup title

No. of studies

No. of participants

Statistical method

Effect size

1 Endometrial cancer Show forest plot

2

Risk Ratio (Random, 95% CI)

0.82 [0.11, 6.17]

Figuras y tablas -
Comparison 4. Exposure to any drug; comparison group: subfertile; low number of cycles
Comparison 5. Exposure to any drug; comparison group: subfertile; medium number of cycles

Outcome or subgroup title

No. of studies

No. of participants

Statistical method

Effect size

1 Endometrial cancer Show forest plot

2

Risk Ratio (Random, 95% CI)

0.86 [0.46, 1.59]

Figuras y tablas -
Comparison 5. Exposure to any drug; comparison group: subfertile; medium number of cycles
Comparison 6. Exposure to any drug; comparison group: general population; any

Outcome or subgroup title

No. of studies

No. of participants

Statistical method

Effect size

1 Endometrial cancer; subgroup by effect estimate Show forest plot

15

1.762829E6

Risk Ratio (Random, 95% CI)

1.75 [1.18, 2.61]

1.1 SIR

7

165366

Risk Ratio (Random, 95% CI)

1.61 [0.92, 2.82]

1.2 OR

4

22450

Risk Ratio (Random, 95% CI)

1.87 [0.96, 3.64]

1.3 IRR

1

647704

Risk Ratio (Random, 95% CI)

1.71 [0.11, 25.85]

1.4 HR

2

821278

Risk Ratio (Random, 95% CI)

1.51 [0.32, 7.19]

1.5 RR

1

106031

Risk Ratio (Random, 95% CI)

3.52 [1.67, 7.41]

Figuras y tablas -
Comparison 6. Exposure to any drug; comparison group: general population; any
Comparison 7. Exposure to any drug; comparison group: general population; low number of cycles

Outcome or subgroup title

No. of studies

No. of participants

Statistical method

Effect size

1 Endometrial cancer Show forest plot

2

Risk Ratio (Random, 95% CI)

2.33 [0.93, 5.87]

Figuras y tablas -
Comparison 7. Exposure to any drug; comparison group: general population; low number of cycles
Comparison 8. Exposure to any drug; comparison group: general population; medium number of cycles

Outcome or subgroup title

No. of studies

No. of participants

Statistical method

Effect size

1 Endometrial cancer Show forest plot

2

Risk Ratio (Random, 95% CI)

3.39 [0.77, 14.87]

Figuras y tablas -
Comparison 8. Exposure to any drug; comparison group: general population; medium number of cycles
Comparison 9. Exposure to any drug; comparison group: general population; 0‐3 number of oocytes retrieved

Outcome or subgroup title

No. of studies

No. of participants

Statistical method

Effect size

1 Endometrial cancer Show forest plot

2

Risk Ratio (Random, 95% CI)

2.95 [0.47, 18.57]

Figuras y tablas -
Comparison 9. Exposure to any drug; comparison group: general population; 0‐3 number of oocytes retrieved
Comparison 10. Exposure to any drug; comparison group: general population; >10 number of oocytes retrieved

Outcome or subgroup title

No. of studies

No. of participants

Statistical method

Effect size

1 Endometrial cancer Show forest plot

2

Risk Ratio (Random, 95% CI)

6.93 [2.24, 21.50]

Figuras y tablas -
Comparison 10. Exposure to any drug; comparison group: general population; >10 number of oocytes retrieved
Comparison 11. Exposure to clomiphene; comparison group: subfertile: any

Outcome or subgroup title

No. of studies

No. of participants

Statistical method

Effect size

1 Endometrial cancer; subgroup by effect estimate Show forest plot

5

92849

Risk Ratio (Random, 95% CI)

1.32 [1.01, 1.71]

1.1 HR

2

82318

Risk Ratio (Random, 95% CI)

1.32 [0.94, 1.86]

1.2 RR

2

8259

Risk Ratio (Random, 95% CI)

1.38 [0.88, 2.17]

1.3 IRR

1

2272

Risk Ratio (Random, 95% CI)

1.0 [0.38, 2.63]

Figuras y tablas -
Comparison 11. Exposure to clomiphene; comparison group: subfertile: any
Comparison 12. Exposure to clomiphene; comparison group: subfertile; low dosage

Outcome or subgroup title

No. of studies

No. of participants

Statistical method

Effect size

1 Endometrial cancer Show forest plot

2

Risk Ratio (Random, 95% CI)

1.30 [0.78, 2.17]

Figuras y tablas -
Comparison 12. Exposure to clomiphene; comparison group: subfertile; low dosage
Comparison 13. Exposure to clomiphene; comparison group: subfertile; medium dosage

Outcome or subgroup title

No. of studies

No. of participants

Statistical method

Effect size

1 Endometrial cancer Show forest plot

2

Risk Ratio (Random, 95% CI)

1.27 [0.76, 2.13]

Figuras y tablas -
Comparison 13. Exposure to clomiphene; comparison group: subfertile; medium dosage
Comparison 14. Exposure to clomiphene; comparison group: subfertile; high dosage

Outcome or subgroup title

No. of studies

No. of participants

Statistical method

Effect size

1 Endometrial cancer Show forest plot

2

Risk Ratio (Random, 95% CI)

1.69 [1.07, 2.68]

Figuras y tablas -
Comparison 14. Exposure to clomiphene; comparison group: subfertile; high dosage
Comparison 15. Exposure to clomiphene; comparison group: subfertile; medium number of cycles

Outcome or subgroup title

No. of studies

No. of participants

Statistical method

Effect size

1 Endometrial cancer; subgroup by effect estimate Show forest plot

3

Risk Ratio (Random, 95% CI)

1.22 [0.87, 1.73]

1.1 RR

2

Risk Ratio (Random, 95% CI)

1.08 [0.61, 1.92]

1.2 HR

1

Risk Ratio (Random, 95% CI)

1.31 [0.85, 2.01]

Figuras y tablas -
Comparison 15. Exposure to clomiphene; comparison group: subfertile; medium number of cycles
Comparison 16. Exposure to clomiphene; comparison group: subfertile; high number of cycles

Outcome or subgroup title

No. of studies

No. of participants

Statistical method

Effect size

1 Endometrial cancer; subgroup by effect estimate Show forest plot

3

Risk Ratio (Random, 95% CI)

1.69 [1.16, 2.47]

1.1 RR

2

Risk Ratio (Random, 95% CI)

1.99 [1.08, 3.64]

1.2 HR

1

Risk Ratio (Random, 95% CI)

1.53 [0.95, 2.48]

Figuras y tablas -
Comparison 16. Exposure to clomiphene; comparison group: subfertile; high number of cycles
Comparison 17. Exposure to clomiphene; comparison group: subfertile: parous women

Outcome or subgroup title

No. of studies

No. of participants

Statistical method

Effect size

1 Endometrial cancer; subgroup by effect estimate Show forest plot

2

Risk Ratio (Random, 95% CI)

1.68 [0.82, 3.43]

Figuras y tablas -
Comparison 17. Exposure to clomiphene; comparison group: subfertile: parous women
Comparison 18. Exposure to clomiphene; comparison group: subfertile; nulliparous women

Outcome or subgroup title

No. of studies

No. of participants

Statistical method

Effect size

1 Endometrial cancer Show forest plot

2

Risk Ratio (Random, 95% CI)

1.01 [0.51, 2.01]

Figuras y tablas -
Comparison 18. Exposure to clomiphene; comparison group: subfertile; nulliparous women
Comparison 19. Exposure to clomiphene; comparison group: general population; any

Outcome or subgroup title

No. of studies

No. of participants

Statistical method

Effect size

1 Endometrial cancer; subgroup by effect estimate Show forest plot

4

19614

Risk Ratio (Random, 95% CI)

1.87 [1.00, 3.48]

1.1 SIR

2

4106

Risk Ratio (Random, 95% CI)

1.61 [0.79, 3.29]

1.2 OR

1

683

Risk Ratio (Random, 95% CI)

1.00 [0.24, 4.19]

1.3 HR

1

14825

Risk Ratio (Random, 95% CI)

4.56 [1.56, 13.33]

Figuras y tablas -
Comparison 19. Exposure to clomiphene; comparison group: general population; any
Comparison 20. Exposure to clomiphene; comparison group: general population; low dosage

Outcome or subgroup title

No. of studies

No. of participants

Statistical method

Effect size

1 Endometrial cancer Show forest plot

2

Risk Ratio (Random, 95% CI)

1.52 [0.48, 4.78]

Figuras y tablas -
Comparison 20. Exposure to clomiphene; comparison group: general population; low dosage
Comparison 21. Exposure to clomiphene; comparison group: general population; high dosage

Outcome or subgroup title

No. of studies

No. of participants

Statistical method

Effect size

1 Endometrial cancer Show forest plot

2

Risk Ratio (Random, 95% CI)

5.48 [2.28, 13.17]

Figuras y tablas -
Comparison 21. Exposure to clomiphene; comparison group: general population; high dosage
Comparison 22. Exposure to clomiphene; comparison group: general population; low number of cycles

Outcome or subgroup title

No. of studies

No. of participants

Statistical method

Effect size

1 Endometrial cancer Show forest plot

2

Risk Ratio (Random, 95% CI)

1.82 [0.56, 5.90]

Figuras y tablas -
Comparison 22. Exposure to clomiphene; comparison group: general population; low number of cycles
Comparison 23. Exposure to clomiphene; comparison group: general population; high number of cycles

Outcome or subgroup title

No. of studies

No. of participants

Statistical method

Effect size

1 Endometrial cancer Show forest plot

2

Risk Ratio (Random, 95% CI)

4.17 [1.35, 12.94]

Figuras y tablas -
Comparison 23. Exposure to clomiphene; comparison group: general population; high number of cycles
Comparison 24. Exposure to gonadotropins; comparison group: subfertile; any

Outcome or subgroup title

No. of studies

No. of participants

Statistical method

Effect size

1 Endometrial cancer; subgroup by effect estimate Show forest plot

4

17769

Risk Ratio (Random, 95% CI)

1.55 [1.03, 2.34]

1.1 RR

2

6390

Risk Ratio (Random, 95% CI)

2.15 [1.11, 4.17]

1.2 IRR

1

1547

Risk Ratio (Random, 95% CI)

1.0 [0.28, 3.51]

1.3 HR

1

9832

Risk Ratio (Random, 95% CI)

1.34 [0.76, 2.37]

Figuras y tablas -
Comparison 24. Exposure to gonadotropins; comparison group: subfertile; any
Comparison 25. Exposure to gonadotropins; comparison group: subfertile; medium number of cycles

Outcome or subgroup title

No. of studies

No. of participants

Statistical method

Effect size

1 Endometrial cancer Show forest plot

2

Risk Ratio (Random, 95% CI)

1.61 [1.00, 2.60]

Figuras y tablas -
Comparison 25. Exposure to gonadotropins; comparison group: subfertile; medium number of cycles
Comparison 26. Exposure to gonadotropins; comparison group: subfertile; high number of cycles

Outcome or subgroup title

No. of studies

No. of participants

Statistical method

Effect size

1 Endometrial cancer Show forest plot

2

Risk Ratio (Random, 95% CI)

1.90 [0.80, 4.52]

Figuras y tablas -
Comparison 26. Exposure to gonadotropins; comparison group: subfertile; high number of cycles
Comparison 27. Exposure to gonadotropins; comparison group: general population; any

Outcome or subgroup title

No. of studies

No. of participants

Statistical method

Effect size

1 Endometrial cancer Show forest plot

2

1595

Risk Ratio (Random, 95% CI)

2.12 [0.79, 5.64]

Figuras y tablas -
Comparison 27. Exposure to gonadotropins; comparison group: general population; any
Comparison 28. Exposure to clomiphene + gonadotropins; comparison group: subfertile; any

Outcome or subgroup title

No. of studies

No. of participants

Statistical method

Effect size

1 Endometrial cancer Show forest plot

2

6345

Risk Ratio (Random, 95% CI)

1.18 [0.57, 2.44]

Figuras y tablas -
Comparison 28. Exposure to clomiphene + gonadotropins; comparison group: subfertile; any
Comparison 29. Exposure to clomiphene + gonadotropins; comparison group: general population; any

Outcome or subgroup title

No. of studies

No. of participants

Statistical method

Effect size

1 Endometrial cancer Show forest plot

3

7789

Risk Ratio (Random, 95% CI)

2.99 [1.53, 5.86]

Figuras y tablas -
Comparison 29. Exposure to clomiphene + gonadotropins; comparison group: general population; any
Comparison 30. Exposure to GnRH; comparison group: subfertile; any

Outcome or subgroup title

No. of studies

No. of participants

Statistical method

Effect size

1 Endometrial cancer Show forest plot

2

42558

Risk Ratio (Random, 95% CI)

1.21 [0.65, 2.27]

Figuras y tablas -
Comparison 30. Exposure to GnRH; comparison group: subfertile; any
Comparison 31. Exposure to GnRH; comparison group: subfertile; parous women

Outcome or subgroup title

No. of studies

No. of participants

Statistical method

Effect size

1 Endometrial cancer Show forest plot

2

Risk Ratio (Random, 95% CI)

2.88 [0.95, 8.71]

Figuras y tablas -
Comparison 31. Exposure to GnRH; comparison group: subfertile; parous women
Comparison 32. Exposure to GnRH; comparison group: subfertile; nulliparous women

Outcome or subgroup title

No. of studies

No. of participants

Statistical method

Effect size

1 Endometrial cancer Show forest plot

2

Risk Ratio (Random, 95% CI)

0.75 [0.34, 1.63]

Figuras y tablas -
Comparison 32. Exposure to GnRH; comparison group: subfertile; nulliparous women
Comparison 33. Exposure to any drug; comparison group: subfertile; any; follow‐up >10 years

Outcome or subgroup title

No. of studies

No. of participants

Statistical method

Effect size

1 Endometrial cancer; subgroup by effect estimate Show forest plot

4

39671

Risk Ratio (Random, 95% CI)

0.95 [0.63, 1.44]

1.1 RR

2

12548

Risk Ratio (Random, 95% CI)

1.31 [0.61, 2.81]

1.2 IRR

1

2431

Risk Ratio (Random, 95% CI)

1.0 [0.49, 2.06]

1.3 HR

1

24692

Risk Ratio (Random, 95% CI)

0.71 [0.36, 1.39]

Figuras y tablas -
Comparison 33. Exposure to any drug; comparison group: subfertile; any; follow‐up >10 years
Comparison 34. Exposure to any drug; comparison group: general population; any; follow‐up>10 years

Outcome or subgroup title

No. of studies

No. of participants

Statistical method

Effect size

1 Endometrial cancer; subgroup by effect estimate Show forest plot

5

129209

Risk Ratio (Random, 95% CI)

2.52 [1.80, 3.53]

1.1 SIR

3

8148

Risk Ratio (Random, 95% CI)

2.17 [1.44, 3.26]

1.2 HR

1

15030

Risk Ratio (Random, 95% CI)

3.39 [1.28, 8.97]

1.3 RR

1

106031

Risk Ratio (Random, 95% CI)

3.52 [1.67, 7.41]

Figuras y tablas -
Comparison 34. Exposure to any drug; comparison group: general population; any; follow‐up>10 years
Comparison 35. Exposure to clomiphene; comparison group: subfertile; any; follow‐up>10 years

Outcome or subgroup title

No. of studies

No. of participants

Statistical method

Effect size

1 Endometrial cancer; subgroup by effect estimate Show forest plot

4

20363

Risk Ratio (Random, 95% CI)

1.35 [1.03, 1.78]

1.1 HR

1

9832

Risk Ratio (Random, 95% CI)

1.39 [0.96, 2.01]

1.2 RR

2

8259

Risk Ratio (Random, 95% CI)

1.38 [0.88, 2.17]

1.3 IRR

1

2272

Risk Ratio (Random, 95% CI)

1.0 [0.38, 2.63]

Figuras y tablas -
Comparison 35. Exposure to clomiphene; comparison group: subfertile; any; follow‐up>10 years
Comparison 36. Exposure to clomiphene; comparison group: general population; any; follow‐up>10 years

Outcome or subgroup title

No. of studies

No. of participants

Statistical method

Effect size

1 Endometrial cancer; subgroup by effect estimate Show forest plot

3

18931

Risk Ratio (Random, 95% CI)

2.08 [1.01, 4.28]

1.1 SIR

2

4106

Risk Ratio (Random, 95% CI)

1.61 [0.79, 3.29]

1.2 HR

1

14825

Risk Ratio (Random, 95% CI)

4.56 [1.56, 13.33]

Figuras y tablas -
Comparison 36. Exposure to clomiphene; comparison group: general population; any; follow‐up>10 years
Comparison 37. Exposure to gonadotropins; comparison group: subfertile; any; follow‐up>10 years

Outcome or subgroup title

No. of studies

No. of participants

Statistical method

Effect size

1 Endometrial cancer; subgroup by effect estimate Show forest plot

3

7937

Risk Ratio (Random, 95% CI)

1.82 [1.01, 3.27]

1.1 RR

2

6390

Risk Ratio (Random, 95% CI)

2.15 [1.11, 4.17]

1.2 IRR

1

1547

Risk Ratio (Random, 95% CI)

1.0 [0.28, 3.51]

Figuras y tablas -
Comparison 37. Exposure to gonadotropins; comparison group: subfertile; any; follow‐up>10 years
Comparison 38. Exposure to clomiphene + gonadotropins; comparison group: general population; any; follow‐up>10 years

Outcome or subgroup title

No. of studies

No. of participants

Statistical method

Effect size

1 Endometrial cancer Show forest plot

2

1246

Risk Ratio (Random, 95% CI)

3.58 [1.82, 7.06]

Figuras y tablas -
Comparison 38. Exposure to clomiphene + gonadotropins; comparison group: general population; any; follow‐up>10 years