Riesgo de cáncer endometrial en pacientes tratadas con fármacos estimulantes del ovario para la subfertilidad
Información
- DOI:
- https://doi.org/10.1002/14651858.CD010931.pub2Copiar DOI

- Base de datos:
-
- Cochrane Database of Systematic Reviews
- Versión publicada:
-
- 25 marzo 2017see what's new
- Tipo:
-
- Intervention
- Etapa:
-
- Review
- Grupo Editorial Cochrane:
-
Grupo Cochrane de Cáncer ginecológico, neurooncología y otros cánceres
- Copyright:
-
- Copyright © 2017 The Cochrane Collaboration. Published by John Wiley & Sons, Ltd.
Cifras del artículo
Altmetric:
Citado por:
Autores
Contributions of authors
-
Skalkidou A: conceived the idea of the review, contributed to study design, critical evaluation of the studies, extraction of data and interpretation of the findings, provided clinical gynaecological expertise, and prepared the draft.
-
Sergentanis TN: conceived of the idea of the review, contributed to study design, critical evaluation of the studies, extraction of data and interpretation of the findings, performed statistical analysis, and prepared the draft.
-
Gialamas SP: contributed to study design, critical evaluation of the studies, extraction of data and interpretation of the findings, and prepared the draft.
-
Georgakis MK: contributed to study design, critical evaluation of the studies, extraction of data and interpretation of the findings, performed statistical analysis, and prepared the draft.
-
Psaltopoulou T: contributed to study design, critical evaluation of the studies, extraction of data and interpretation of the findings, provided endocrinological clinical expertise, and prepared the draft.
-
Trivella M: contributed to study design, critical evaluation of the studies, extraction of data and interpretation of the findings, provided statistical and methodological expertise, and prepared the draft.
-
Siristatidis CS: contributed to study design, critical evaluation of the studies, extraction of data and interpretation of the findings, provided clinical gynaecological expertise, and prepared the draft.
-
Evangelou E: contributed to study design, critical evaluation of the studies, extraction of data and interpretation of the findings, performed statistical analysis, provided statistical and methodological expertise, and prepared the draft.
-
Petridou ET: conceived of the idea, contributed to study design, critical evaluation of the studies, extraction of data and interpretation of the findings, performed statistical analysis, selected coauthors, provided training, convened meetings, prepared the draft, provided final approval, and acted as a guarantor of the study protocol.
All review authors reviewed and approved the final version of the review.
Sources of support
Internal sources
-
None, Other.
External sources
-
None, Other.
Declarations of interest
-
Skalkidou A: None known
-
Sergentanis TN: None known
-
Gialamas SP: None known
-
Psaltopoulou T: None known
-
Georgakis MK: None known
-
Trivella M: None known
-
Siristatidis CS: None known
-
Evangelou E: Coinvestigator and site co‐PI for grants from EFSA and FP7
-
Petridou ET: My previous position as training co‐ordinator and as a statistical editor/referee for Cochrane groups (Anaesthesia, Wounds, Breast Cancer, and Sexually Transmitted Infections), are independent of my involvement in this review. I declare that my involvement here as an author has no related financial relationships.
Acknowledgements
The review authors would like to thank Dr P. Kanavidis for his valuable contribution in developing the software used for the selection of studies and for his pivotal contribution in creating the data extraction form used by the review authors, as well as Dr M. Sotiraki for her valuable contribution in preparation of the study protocol. Additionally, the authors would like to acknowledge the contribution of Dr Thomas P. Thomopoulos in the evaluation of the studies, extraction of data and statistical analysis, Dr T. Karavasilis, Dr I. Mavromatis, and Dr Kyriaki Antonopoulou should also be acknowledged for their work in the critical evaluation of the studies and extraction of data, as well as Dr V. Karathanos for his contribution to data analysis. We would also like to thank from the Cochrane Gynaecological, Neuro‐oncology and Orphan Cancer Group Jo Morrison, Co‐ordinating Editor, for her clinical expertise; Clare Jess and Gail Quinn, Managing Editors, for their editorial advice; and Jane Hayes and Jo Platt, Information Specialists, for their professional input in building a detailed MEDLINE, Embase and CENTRAL search strategy.
We would like to thank all the external peer reviewers, some of which include Ivana Rizzuto and Hassan Sallam, and also Dr. Louise Brinton for her valuable feedback regarding data in her published studies, as well as for her insightful comments.
This project was supported by the National Institute for Health Research, via Cochrane Infrastructure funding to the Cochrane Gynaecological, Neuro‐oncology and Orphan Cancer Group. The views and opinions expressed therein are those of the authors and do not necessarily reflect those of the Systematic Reviews Programme, NIHR, NHS or the Department of Health.
Version history
| Published | Title | Stage | Authors | Version |
| 2017 Mar 25 | Risk of endometrial cancer in women treated with ovary‐stimulating drugs for subfertility | Review | Alkistis Skalkidou, Theodoros N Sergentanis, Spyros P Gialamas, Marios K Georgakis, Theodora Psaltopoulou, Marialena Trivella, Charalampos S Siristatidis, Evangelos Evangelou, Eleni Petridou | |
| 2014 Jan 17 | Risk of endometrial cancer in women treated with ovary‐stimulating drugs for subfertility | Protocol | Alkistis Skalkidou, Theodoros N Sergentanis, Evangelos Evangelou, Theodora Psaltopoulou, Marianthi Sotiraki, Marialena Trivella, Charalampos S Siristatidis, Eleni Petridou | |
Differences between protocol and review
A broader search strategy was used for the purposes of this review, compared to the algorithm stated in the protocol. All algorithms were developed and run by Jane Hayes and Jo Platt, the Information Specialists for the Cochrane Gynaecological, Neuro‐oncology and Orphan Cancer Group.
Regarding the 'risk of bias' assessment, slight modifications were implemented after team consensus. In particular, comparability on the cause of subfertility were added to comparability of groups, PCOS was added to confounding/adjustment factors, and blinding of participants and personnel regarding the allocated interventions was evaluated with regards to performance bias. It was initially also planned to create a separate table with confounding and adjustment factors that were controlled by each study; however, all relevant data pertaining to the adjustment factors are now available in the 'Risk of bias' tables (subsection 'Selection bias (confounding)') and we considered that the construction of a separate table would be redundant.
Furthermore, although we aimed to use the Robins tool for assessment of risk of bias, as this was not yet available at the start of the review process, a customized version of the Newcastle‐Ottawa scale was used instead, in accordance with a previous Cochrane review (Rizzuto 2013).
Lastly, we did not transform effect estimates, if they were reported differently within studies, as stated in the protocol, but we rather pooled the effect estimates, presenting also subgroup analyses by type of effect estimate, to ensure the objective presentation of our data to the scientific audience. As endometrial cancer is a rather rare outcome, we believe that this approach is the most appropriate. We came to this decision following discussions with our methodology expert, Dr. Trivella and team consensus. This approach was also in accordance with our previously published meta‐analyses.
Keywords
MeSH
Medical Subject Headings (MeSH) Keywords
- Case‐Control Studies;
- Chorionic Gonadotropin [administration & dosage, adverse effects];
- Clomiphene [administration & dosage, *adverse effects];
- Drug Therapy, Combination [adverse effects];
- Endometrial Neoplasms [*chemically induced, epidemiology];
- Fertility Agents, Female [administration & dosage, *adverse effects];
- Gonadotropin‐Releasing Hormone [administration & dosage, adverse effects];
- Gonadotropins [*adverse effects];
- Infertility, Female [complications, *drug therapy];
- Ovulation Induction;
- Retrospective Studies;
- Risk;
Medical Subject Headings Check Words
Female; Humans;
PICO

PRISMA Flow Diagram

Risk of bias summary: review authors' judgements about each risk of bias item for each included study.

Risk of bias graph: review authors' judgements about each risk of bias item presented as percentages across all included studies.

Forest plot of comparison: 2 Exposure to any drug; comparison group: subfertile; any, outcome: 2.1 Endometrial cancer; subgroup by effect estimate.

Forest plot of comparison: 6 Exposure to any drug; comparison group: general population; any, outcome: 6.1 Endometrial cancer; subgroup by effect estimate.

Funnel plot of comparison: 6 Exposure to any drug; comparison group: general population; any, outcome: 6.1 Endometrial cancer; subgroup by effect estimate.

Comparison 1 Exposure to any drug; comparison group: subfertile; any, Outcome 1 Endometrial cancer; subgroup by effect estimate.

Comparison 2 Exposure to any drug; comparison group: subfertile; parous women, Outcome 1 Endometrial cancer; subgroup by effect estimate.

Comparison 3 Exposure to any drug; comparison group: subfertile; nulliparous women, Outcome 1 Endometrial cancer.

Comparison 4 Exposure to any drug; comparison group: subfertile; low number of cycles, Outcome 1 Endometrial cancer.

Comparison 5 Exposure to any drug; comparison group: subfertile; medium number of cycles, Outcome 1 Endometrial cancer.

Comparison 6 Exposure to any drug; comparison group: general population; any, Outcome 1 Endometrial cancer; subgroup by effect estimate.

Comparison 7 Exposure to any drug; comparison group: general population; low number of cycles, Outcome 1 Endometrial cancer.
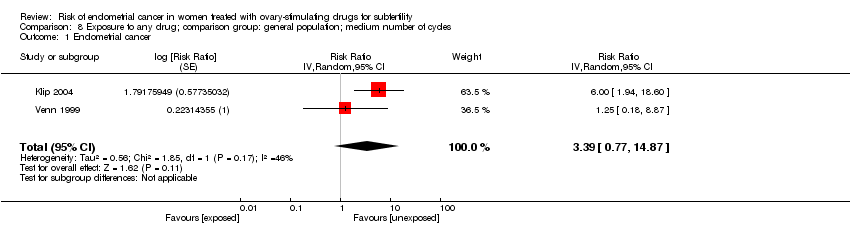
Comparison 8 Exposure to any drug; comparison group: general population; medium number of cycles, Outcome 1 Endometrial cancer.

Comparison 9 Exposure to any drug; comparison group: general population; 0‐3 number of oocytes retrieved, Outcome 1 Endometrial cancer.

Comparison 10 Exposure to any drug; comparison group: general population; >10 number of oocytes retrieved, Outcome 1 Endometrial cancer.
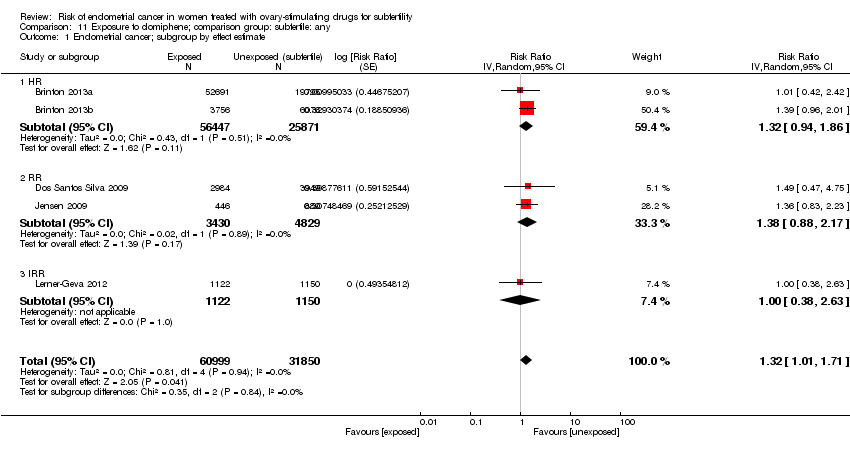
Comparison 11 Exposure to clomiphene; comparison group: subfertile: any, Outcome 1 Endometrial cancer; subgroup by effect estimate.

Comparison 12 Exposure to clomiphene; comparison group: subfertile; low dosage, Outcome 1 Endometrial cancer.

Comparison 13 Exposure to clomiphene; comparison group: subfertile; medium dosage, Outcome 1 Endometrial cancer.

Comparison 14 Exposure to clomiphene; comparison group: subfertile; high dosage, Outcome 1 Endometrial cancer.

Comparison 15 Exposure to clomiphene; comparison group: subfertile; medium number of cycles, Outcome 1 Endometrial cancer; subgroup by effect estimate.

Comparison 16 Exposure to clomiphene; comparison group: subfertile; high number of cycles, Outcome 1 Endometrial cancer; subgroup by effect estimate.

Comparison 17 Exposure to clomiphene; comparison group: subfertile: parous women, Outcome 1 Endometrial cancer; subgroup by effect estimate.

Comparison 18 Exposure to clomiphene; comparison group: subfertile; nulliparous women, Outcome 1 Endometrial cancer.

Comparison 19 Exposure to clomiphene; comparison group: general population; any, Outcome 1 Endometrial cancer; subgroup by effect estimate.

Comparison 20 Exposure to clomiphene; comparison group: general population; low dosage, Outcome 1 Endometrial cancer.

Comparison 21 Exposure to clomiphene; comparison group: general population; high dosage, Outcome 1 Endometrial cancer.

Comparison 22 Exposure to clomiphene; comparison group: general population; low number of cycles, Outcome 1 Endometrial cancer.

Comparison 23 Exposure to clomiphene; comparison group: general population; high number of cycles, Outcome 1 Endometrial cancer.

Comparison 24 Exposure to gonadotropins; comparison group: subfertile; any, Outcome 1 Endometrial cancer; subgroup by effect estimate.

Comparison 25 Exposure to gonadotropins; comparison group: subfertile; medium number of cycles, Outcome 1 Endometrial cancer.

Comparison 26 Exposure to gonadotropins; comparison group: subfertile; high number of cycles, Outcome 1 Endometrial cancer.

Comparison 27 Exposure to gonadotropins; comparison group: general population; any, Outcome 1 Endometrial cancer.

Comparison 28 Exposure to clomiphene + gonadotropins; comparison group: subfertile; any, Outcome 1 Endometrial cancer.

Comparison 29 Exposure to clomiphene + gonadotropins; comparison group: general population; any, Outcome 1 Endometrial cancer.

Comparison 30 Exposure to GnRH; comparison group: subfertile; any, Outcome 1 Endometrial cancer.

Comparison 31 Exposure to GnRH; comparison group: subfertile; parous women, Outcome 1 Endometrial cancer.

Comparison 32 Exposure to GnRH; comparison group: subfertile; nulliparous women, Outcome 1 Endometrial cancer.

Comparison 33 Exposure to any drug; comparison group: subfertile; any; follow‐up >10 years, Outcome 1 Endometrial cancer; subgroup by effect estimate.

Comparison 34 Exposure to any drug; comparison group: general population; any; follow‐up>10 years, Outcome 1 Endometrial cancer; subgroup by effect estimate.

Comparison 35 Exposure to clomiphene; comparison group: subfertile; any; follow‐up>10 years, Outcome 1 Endometrial cancer; subgroup by effect estimate.

Comparison 36 Exposure to clomiphene; comparison group: general population; any; follow‐up>10 years, Outcome 1 Endometrial cancer; subgroup by effect estimate.

Comparison 37 Exposure to gonadotropins; comparison group: subfertile; any; follow‐up>10 years, Outcome 1 Endometrial cancer; subgroup by effect estimate.

Comparison 38 Exposure to clomiphene + gonadotropins; comparison group: general population; any; follow‐up>10 years, Outcome 1 Endometrial cancer.
| Patient or population: Women treated with ovary‐stimulating drugs for subfertility | ||||||
| Outcomes | Anticipated absolute effects* (95% CI) | Relative effect | № of participants | Quality of the evidence | Comments | |
| Risk with no treatment | Risk with exposure to any ovary‐stimulating drug for subfertility | |||||
| Endometrial cancer | Study population | RR 0.96 | 156,774 | ⊕⊝⊝⊝ | ||
| 111 per 100,000 | 109 per 100,000 | |||||
| *The risk in the intervention group (and its 95% confidence interval) is based on the assumed risk in the comparison group and the relative effect of the intervention (and its 95% CI). | ||||||
| GRADE Working Group grades of evidence | ||||||
| 1 Initial level of evidence was 'low' because of the study design (observational studies). | ||||||
| Patient or population: Women treated with ovary‐stimulating drugs for subfertility | ||||||
| Outcomes | Anticipated absolute effects* (95% CI) | Relative effect | № of participants | Quality of the evidence | Comments | |
| Risk with no treatment | Risk with exposure to any ovary‐stimulating drug for subfertility | |||||
| Endometrial cancer | Study population | RR 1.75 | 1,762,829 | ⊕⊝⊝⊝ | ||
| 53 per 100,000 | 92 per 100,000 | |||||
| *The risk in the intervention group (and its 95% confidence interval) is based on the assumed risk in the comparison group and the relative effect of the intervention (and its 95% CI). | ||||||
| GRADE Working Group grades of evidence | ||||||
| 1 Initial level of evidence was 'low' because of the study design (observational studies). | ||||||
| Patient or population: Women treated with ovary‐stimulating drugs for subfertility | ||||||
| Outcomes | Anticipated absolute effects* (95% CI) | Relative effect | № of participants | Quality of the evidence | Comments | |
| Risk with no treatment | Risk with exposure to clomiphene citrate for subfertility | |||||
| Endometrial cancer | Study population | RR 1.32 | 92,849 | ⊕⊝⊝⊝ | ||
| 524 per 100,000 | 691 per 100,000 | |||||
| *The risk in the intervention group (and its 95% confidence interval) is based on the assumed risk in the comparison group and the relative effect of the intervention (and its 95% CI). | ||||||
| GRADE Working Group grades of evidence | ||||||
| 1 Initial level of evidence was 'low' because of the study design (observational studies). | ||||||
| Patient or population: Women treated with ovary‐stimulating drugs for subfertility | ||||||
| Outcomes | Anticipated absolute effects* (95% CI) | Relative effect | № of participants | Quality of the evidence | Comments | |
| Risk with no treatment | Risk with exposure to clomiphene citrate for subfertility | |||||
| Endometrial cancer | Study population | RR 1.87 | 19,614 | ⊕⊝⊝⊝ | ||
| 284 per 100,000 | 529 per 100,000 | |||||
| *The risk in the intervention group (and its 95% confidence interval) is based on the assumed risk in the comparison group and the relative effect of the intervention (and its 95% CI). | ||||||
| GRADE Working Group grades of evidence | ||||||
| 1 Initial level of evidence was 'low' because of the study design (observational studies). | ||||||
| undefined | ||||||
| Patient or population: Women treated with ovary‐stimulating drugs for subfertility | ||||||
| Outcomes | Anticipated absolute effects* (95% CI) | Relative effect | № of participants | Quality of the evidence | Comments | |
| Risk with no treatment | Risk with exposure to gonadotropins for subfertility | |||||
| Endometrial cancer | Study population | RR 1.55 | 17,769 | ⊕⊝⊝⊝ Very low 1,2,3 | ||
| 1291 per 100,000 | 1987 per 100,000 | |||||
| *The risk in the intervention group (and its 95% confidence interval) is based on the assumed risk in the comparison group and the relative effect of the intervention (and its 95% CI). | ||||||
| GRADE Working Group grades of evidence | ||||||
| 1 Initial level of evidence was 'low' because of the study design (observational studies). | ||||||
| Patient or population: Women treated with ovary‐stimulating drugs for subfertility | ||||||
| Outcomes | Anticipated absolute effects* (95% CI) | Relative effect | № of participants | Quality of the evidence | Comments | |
| Risk with no treatment | Risk with exposure to gonadotropins for subfertility | |||||
| Endometrial cancer | Study population | RR 2.12 | 1595 | ⊕⊝⊝⊝ | ||
| 542 per 100,000 | 1148 per 100,000 | |||||
| *The risk in the intervention group (and its 95% confidence interval) is based on the assumed risk in the comparison group and the relative effect of the intervention (and its 95% CI). | ||||||
| GRADE Working Group grades of evidence | ||||||
| 1 Initial level of evidence was 'low' because of the study design (observational studies). | ||||||
| Patient or population: Women treated with ovary‐stimulating drugs for subfertility | ||||||
| Outcomes | Anticipated absolute effects* (95% CI) | Relative effect | № of participants | Quality of the evidence | Comments | |
| Risk with no treatment | Risk with exposure to clomiphene citrate and gonadotropins for subfertility | |||||
| Endometrial cancer | Study population | RR 1.18 | 6345 | ⊕⊝⊝⊝ | ||
| 490 per 100,000 | 579 per 100,000 | |||||
| *The risk in the intervention group (and its 95% confidence interval) is based on the assumed risk in the comparison group and the relative effect of the intervention (and its 95% CI). | ||||||
| GRADE Working Group grades of evidence | ||||||
| 1 Initial level of evidence was 'low' because of the study design (observational studies). | ||||||
| Patient or population: Women treated with ovary‐stimulating drugs for subfertility | ||||||
| Outcomes | Anticipated absolute effects* (95% CI) | Relative effect | № of participants | Quality of the evidence | Comments | |
| Risk with no treatment | Risk with exposure to clomiphene citrate and gonadotropins for subfertility | |||||
| Endometrial cancer | Study population | RR 2.99 | 7789 | ⊕⊝⊝⊝ | ||
| 76 per 100,000 | 245 per 100,000 | |||||
| *The risk in the intervention group (and its 95% confidence interval) is based on the assumed risk in the comparison group and the relative effect of the intervention (and its 95% CI). | ||||||
| GRADE Working Group grades of evidence | ||||||
| 1 Initial level of evidence was 'low' because of the study design (observational studies). | ||||||
| Patient or population: Women treated with ovary‐stimulating drugs for subfertility | ||||||
| Outcomes | Anticipated absolute effects* (95% CI) | Relative effect | № of participants | Quality of the evidence | Comments | |
| Risk with no treatment | Risk with exposure to GnRH analogs for subfertility | |||||
| Endometrial cancer | Study population | RR 1.21 | 42,558 | ⊕⊝⊝⊝ | ||
| 458 per 100,000 | 554 per 100,000 | |||||
| *The risk in the intervention group (and its 95% confidence interval) is based on the assumed risk in the comparison group and the relative effect of the intervention (and its 95% CI). | ||||||
| GRADE Working Group grades of evidence | ||||||
| 1Initial level of evidence was 'low' because of the study design (observational studies). | ||||||
| Outcome or subgroup title | No. of studies | No. of participants | Statistical method | Effect size |
| 1 Endometrial cancer; subgroup by effect estimate Show forest plot | 6 | 156774 | Risk Ratio (Random, 95% CI) | 0.96 [0.67, 1.37] |
| 1.1 RR | 2 | 12548 | Risk Ratio (Random, 95% CI) | 1.31 [0.61, 2.81] |
| 1.2 IRR | 2 | 32131 | Risk Ratio (Random, 95% CI) | 0.86 [0.46, 1.63] |
| 1.3 HR | 2 | 112095 | Risk Ratio (Random, 95% CI) | 0.90 [0.52, 1.54] |
| Outcome or subgroup title | No. of studies | No. of participants | Statistical method | Effect size |
| 1 Endometrial cancer; subgroup by effect estimate Show forest plot | 2 | Risk Ratio (Random, 95% CI) | 1.00 [0.05, 18.85] | |
| Outcome or subgroup title | No. of studies | No. of participants | Statistical method | Effect size |
| 1 Endometrial cancer Show forest plot | 2 | Risk Ratio (Random, 95% CI) | 0.76 [0.35, 1.67] | |
| Outcome or subgroup title | No. of studies | No. of participants | Statistical method | Effect size |
| 1 Endometrial cancer Show forest plot | 2 | Risk Ratio (Random, 95% CI) | 0.82 [0.11, 6.17] | |
| Outcome or subgroup title | No. of studies | No. of participants | Statistical method | Effect size |
| 1 Endometrial cancer Show forest plot | 2 | Risk Ratio (Random, 95% CI) | 0.86 [0.46, 1.59] | |
| Outcome or subgroup title | No. of studies | No. of participants | Statistical method | Effect size |
| 1 Endometrial cancer; subgroup by effect estimate Show forest plot | 15 | 1.762829E6 | Risk Ratio (Random, 95% CI) | 1.75 [1.18, 2.61] |
| 1.1 SIR | 7 | 165366 | Risk Ratio (Random, 95% CI) | 1.61 [0.92, 2.82] |
| 1.2 OR | 4 | 22450 | Risk Ratio (Random, 95% CI) | 1.87 [0.96, 3.64] |
| 1.3 IRR | 1 | 647704 | Risk Ratio (Random, 95% CI) | 1.71 [0.11, 25.85] |
| 1.4 HR | 2 | 821278 | Risk Ratio (Random, 95% CI) | 1.51 [0.32, 7.19] |
| 1.5 RR | 1 | 106031 | Risk Ratio (Random, 95% CI) | 3.52 [1.67, 7.41] |
| Outcome or subgroup title | No. of studies | No. of participants | Statistical method | Effect size |
| 1 Endometrial cancer Show forest plot | 2 | Risk Ratio (Random, 95% CI) | 2.33 [0.93, 5.87] | |
| Outcome or subgroup title | No. of studies | No. of participants | Statistical method | Effect size |
| 1 Endometrial cancer Show forest plot | 2 | Risk Ratio (Random, 95% CI) | 3.39 [0.77, 14.87] | |
| Outcome or subgroup title | No. of studies | No. of participants | Statistical method | Effect size |
| 1 Endometrial cancer Show forest plot | 2 | Risk Ratio (Random, 95% CI) | 2.95 [0.47, 18.57] | |
| Outcome or subgroup title | No. of studies | No. of participants | Statistical method | Effect size |
| 1 Endometrial cancer Show forest plot | 2 | Risk Ratio (Random, 95% CI) | 6.93 [2.24, 21.50] | |
| Outcome or subgroup title | No. of studies | No. of participants | Statistical method | Effect size |
| 1 Endometrial cancer; subgroup by effect estimate Show forest plot | 5 | 92849 | Risk Ratio (Random, 95% CI) | 1.32 [1.01, 1.71] |
| 1.1 HR | 2 | 82318 | Risk Ratio (Random, 95% CI) | 1.32 [0.94, 1.86] |
| 1.2 RR | 2 | 8259 | Risk Ratio (Random, 95% CI) | 1.38 [0.88, 2.17] |
| 1.3 IRR | 1 | 2272 | Risk Ratio (Random, 95% CI) | 1.0 [0.38, 2.63] |
| Outcome or subgroup title | No. of studies | No. of participants | Statistical method | Effect size |
| 1 Endometrial cancer Show forest plot | 2 | Risk Ratio (Random, 95% CI) | 1.30 [0.78, 2.17] | |
| Outcome or subgroup title | No. of studies | No. of participants | Statistical method | Effect size |
| 1 Endometrial cancer Show forest plot | 2 | Risk Ratio (Random, 95% CI) | 1.27 [0.76, 2.13] | |
| Outcome or subgroup title | No. of studies | No. of participants | Statistical method | Effect size |
| 1 Endometrial cancer Show forest plot | 2 | Risk Ratio (Random, 95% CI) | 1.69 [1.07, 2.68] | |
| Outcome or subgroup title | No. of studies | No. of participants | Statistical method | Effect size |
| 1 Endometrial cancer; subgroup by effect estimate Show forest plot | 3 | Risk Ratio (Random, 95% CI) | 1.22 [0.87, 1.73] | |
| 1.1 RR | 2 | Risk Ratio (Random, 95% CI) | 1.08 [0.61, 1.92] | |
| 1.2 HR | 1 | Risk Ratio (Random, 95% CI) | 1.31 [0.85, 2.01] | |
| Outcome or subgroup title | No. of studies | No. of participants | Statistical method | Effect size |
| 1 Endometrial cancer; subgroup by effect estimate Show forest plot | 3 | Risk Ratio (Random, 95% CI) | 1.69 [1.16, 2.47] | |
| 1.1 RR | 2 | Risk Ratio (Random, 95% CI) | 1.99 [1.08, 3.64] | |
| 1.2 HR | 1 | Risk Ratio (Random, 95% CI) | 1.53 [0.95, 2.48] | |
| Outcome or subgroup title | No. of studies | No. of participants | Statistical method | Effect size |
| 1 Endometrial cancer; subgroup by effect estimate Show forest plot | 2 | Risk Ratio (Random, 95% CI) | 1.68 [0.82, 3.43] | |
| Outcome or subgroup title | No. of studies | No. of participants | Statistical method | Effect size |
| 1 Endometrial cancer Show forest plot | 2 | Risk Ratio (Random, 95% CI) | 1.01 [0.51, 2.01] | |
| Outcome or subgroup title | No. of studies | No. of participants | Statistical method | Effect size |
| 1 Endometrial cancer; subgroup by effect estimate Show forest plot | 4 | 19614 | Risk Ratio (Random, 95% CI) | 1.87 [1.00, 3.48] |
| 1.1 SIR | 2 | 4106 | Risk Ratio (Random, 95% CI) | 1.61 [0.79, 3.29] |
| 1.2 OR | 1 | 683 | Risk Ratio (Random, 95% CI) | 1.00 [0.24, 4.19] |
| 1.3 HR | 1 | 14825 | Risk Ratio (Random, 95% CI) | 4.56 [1.56, 13.33] |
| Outcome or subgroup title | No. of studies | No. of participants | Statistical method | Effect size |
| 1 Endometrial cancer Show forest plot | 2 | Risk Ratio (Random, 95% CI) | 1.52 [0.48, 4.78] | |
| Outcome or subgroup title | No. of studies | No. of participants | Statistical method | Effect size |
| 1 Endometrial cancer Show forest plot | 2 | Risk Ratio (Random, 95% CI) | 5.48 [2.28, 13.17] | |
| Outcome or subgroup title | No. of studies | No. of participants | Statistical method | Effect size |
| 1 Endometrial cancer Show forest plot | 2 | Risk Ratio (Random, 95% CI) | 1.82 [0.56, 5.90] | |
| Outcome or subgroup title | No. of studies | No. of participants | Statistical method | Effect size |
| 1 Endometrial cancer Show forest plot | 2 | Risk Ratio (Random, 95% CI) | 4.17 [1.35, 12.94] | |
| Outcome or subgroup title | No. of studies | No. of participants | Statistical method | Effect size |
| 1 Endometrial cancer; subgroup by effect estimate Show forest plot | 4 | 17769 | Risk Ratio (Random, 95% CI) | 1.55 [1.03, 2.34] |
| 1.1 RR | 2 | 6390 | Risk Ratio (Random, 95% CI) | 2.15 [1.11, 4.17] |
| 1.2 IRR | 1 | 1547 | Risk Ratio (Random, 95% CI) | 1.0 [0.28, 3.51] |
| 1.3 HR | 1 | 9832 | Risk Ratio (Random, 95% CI) | 1.34 [0.76, 2.37] |
| Outcome or subgroup title | No. of studies | No. of participants | Statistical method | Effect size |
| 1 Endometrial cancer Show forest plot | 2 | Risk Ratio (Random, 95% CI) | 1.61 [1.00, 2.60] | |
| Outcome or subgroup title | No. of studies | No. of participants | Statistical method | Effect size |
| 1 Endometrial cancer Show forest plot | 2 | Risk Ratio (Random, 95% CI) | 1.90 [0.80, 4.52] | |
| Outcome or subgroup title | No. of studies | No. of participants | Statistical method | Effect size |
| 1 Endometrial cancer Show forest plot | 2 | 1595 | Risk Ratio (Random, 95% CI) | 2.12 [0.79, 5.64] |
| Outcome or subgroup title | No. of studies | No. of participants | Statistical method | Effect size |
| 1 Endometrial cancer Show forest plot | 2 | 6345 | Risk Ratio (Random, 95% CI) | 1.18 [0.57, 2.44] |
| Outcome or subgroup title | No. of studies | No. of participants | Statistical method | Effect size |
| 1 Endometrial cancer Show forest plot | 3 | 7789 | Risk Ratio (Random, 95% CI) | 2.99 [1.53, 5.86] |
| Outcome or subgroup title | No. of studies | No. of participants | Statistical method | Effect size |
| 1 Endometrial cancer Show forest plot | 2 | 42558 | Risk Ratio (Random, 95% CI) | 1.21 [0.65, 2.27] |
| Outcome or subgroup title | No. of studies | No. of participants | Statistical method | Effect size |
| 1 Endometrial cancer Show forest plot | 2 | Risk Ratio (Random, 95% CI) | 2.88 [0.95, 8.71] | |
| Outcome or subgroup title | No. of studies | No. of participants | Statistical method | Effect size |
| 1 Endometrial cancer Show forest plot | 2 | Risk Ratio (Random, 95% CI) | 0.75 [0.34, 1.63] | |
| Outcome or subgroup title | No. of studies | No. of participants | Statistical method | Effect size |
| 1 Endometrial cancer; subgroup by effect estimate Show forest plot | 4 | 39671 | Risk Ratio (Random, 95% CI) | 0.95 [0.63, 1.44] |
| 1.1 RR | 2 | 12548 | Risk Ratio (Random, 95% CI) | 1.31 [0.61, 2.81] |
| 1.2 IRR | 1 | 2431 | Risk Ratio (Random, 95% CI) | 1.0 [0.49, 2.06] |
| 1.3 HR | 1 | 24692 | Risk Ratio (Random, 95% CI) | 0.71 [0.36, 1.39] |
| Outcome or subgroup title | No. of studies | No. of participants | Statistical method | Effect size |
| 1 Endometrial cancer; subgroup by effect estimate Show forest plot | 5 | 129209 | Risk Ratio (Random, 95% CI) | 2.52 [1.80, 3.53] |
| 1.1 SIR | 3 | 8148 | Risk Ratio (Random, 95% CI) | 2.17 [1.44, 3.26] |
| 1.2 HR | 1 | 15030 | Risk Ratio (Random, 95% CI) | 3.39 [1.28, 8.97] |
| 1.3 RR | 1 | 106031 | Risk Ratio (Random, 95% CI) | 3.52 [1.67, 7.41] |
| Outcome or subgroup title | No. of studies | No. of participants | Statistical method | Effect size |
| 1 Endometrial cancer; subgroup by effect estimate Show forest plot | 4 | 20363 | Risk Ratio (Random, 95% CI) | 1.35 [1.03, 1.78] |
| 1.1 HR | 1 | 9832 | Risk Ratio (Random, 95% CI) | 1.39 [0.96, 2.01] |
| 1.2 RR | 2 | 8259 | Risk Ratio (Random, 95% CI) | 1.38 [0.88, 2.17] |
| 1.3 IRR | 1 | 2272 | Risk Ratio (Random, 95% CI) | 1.0 [0.38, 2.63] |
| Outcome or subgroup title | No. of studies | No. of participants | Statistical method | Effect size |
| 1 Endometrial cancer; subgroup by effect estimate Show forest plot | 3 | 18931 | Risk Ratio (Random, 95% CI) | 2.08 [1.01, 4.28] |
| 1.1 SIR | 2 | 4106 | Risk Ratio (Random, 95% CI) | 1.61 [0.79, 3.29] |
| 1.2 HR | 1 | 14825 | Risk Ratio (Random, 95% CI) | 4.56 [1.56, 13.33] |
| Outcome or subgroup title | No. of studies | No. of participants | Statistical method | Effect size |
| 1 Endometrial cancer; subgroup by effect estimate Show forest plot | 3 | 7937 | Risk Ratio (Random, 95% CI) | 1.82 [1.01, 3.27] |
| 1.1 RR | 2 | 6390 | Risk Ratio (Random, 95% CI) | 2.15 [1.11, 4.17] |
| 1.2 IRR | 1 | 1547 | Risk Ratio (Random, 95% CI) | 1.0 [0.28, 3.51] |
| Outcome or subgroup title | No. of studies | No. of participants | Statistical method | Effect size |
| 1 Endometrial cancer Show forest plot | 2 | 1246 | Risk Ratio (Random, 95% CI) | 3.58 [1.82, 7.06] |