Intervenciones en el lugar de trabajo para la reducción de la sedestación laboral
Resumen
Antecedentes
Un gran número de personas están empleadas en ocupaciones sedentarias. La inactividad física y la sedestación excesiva en el lugar de trabajo se han vinculado con un mayor riesgo de enfermedades cardiovasculares, obesidad y mortalidad por todas las causas.
Objetivos
Evaluar la efectividad de las intervenciones en el lugar de trabajo para reducir la sedestación laboral en comparación con ninguna intervención o intervenciones alternativas.
Métodos de búsqueda
Se hicieron búsquedas en el Registro Cochrane Central de Ensayos Controlados (Cochrane Central Register of Controlled Trials) (CENTRAL), MEDLINE, Embase, CINAHL, OSH UPDATE, PsycINFO, Clinical trials.gov y en el World Health Organization (WHO) International Clinical Trials Registry Platform (ICTRP) search portal hasta el 9 agosto, 2017. También se revisaron las listas de referencias de los artículos y se estableció contacto con los autores para encontrar más estudios.
Criterios de selección
Se incluyeron ensayos controlados aleatorios (ECA), ECA cruzados, ensayos controlados aleatorios grupales (ECA grupales) y ensayos controlados cuasialeatorios de intervenciones para reducir la sedestación en el trabajo. Para los cambios de las modificaciones en el lugar de trabajo también se incluyeron estudios controlados tipo antes y después. El resultado primario fue tiempo de sedestación en el trabajo por día, informado por el participante o medido con dispositivos como un acelerómetro‐inclinómetro, y la duración y el número de episodios de sedestación que duraron 30 minutos o más. Como resultados secundarios se consideraron el gasto de energía, el tiempo total de sedestación (incluida la sedestación en y fuera del trabajo), el tiempo de pie en el trabajo, la productividad del trabajo y los eventos adversos.
Obtención y análisis de los datos
Dos autores de la revisión, de forma independiente, examinaron los títulos, resúmenes y artículos de texto completo para conocer la elegibilidad de los estudios. Dos autores de la revisión, de forma independiente, extrajeron los datos y evaluaron el riesgo de sesgo. Cuando fue necesario, se estableció contacto con los autores para solicitar datos adicionales.
Resultados principales
Se encontraron 34 estudios (incluidos dos ECA cruzados, 17 ECA, siete ECA grupales o por conglomerados y ocho estudios controlados tipo antes y después) con un total de 3397 participantes, todos en países de ingresos altos. Los estudios evaluaron los cambios físicos en el lugar de trabajo (16 estudios), los cambios de política en el lugar de trabajo (cuatro estudios), la información y el asesoramiento (11 estudios) y las intervenciones con múltiples componentes (cuatro estudios). Un estudio incluyó cambios físicos en el lugar de trabajo y componentes de información y asesoramiento. No se encontraron estudios que investigaran específicamente los efectos de las reuniones de pie o caminando sobre el tiempo de sedestación.
Cambios físicos en el lugar de trabajo
Las intervenciones que utilizaron escritorios que permiten estar sentados y de pie, solos o en combinación con información y asesoramiento, redujeron el tiempo de sedestación en el trabajo en 100 minutos por día laboral como promedio en el seguimiento a corto plazo (hasta tres meses) en comparación con los escritorios que permiten estar sentados (intervalo de confianza [IC] del 95%: −116 a −84, 10 estudios, evidencia de baja calidad). El efecto agrupado de dos estudios mostró que los escritorios que permiten estar sentados y de pie redujeron el tiempo de sedestación en el seguimiento a plazo medio (tres a 12 meses) en 57 minutos por día como promedio (IC del 95%: −99 a −15) en comparación con los escritorios que permiten estar sentados. El tiempo total de sedestación (incluida la sedestación en y fuera del trabajo) también disminuyó con los escritorios que permiten estar sentados y de pie en comparación con los escritorios que permiten estar sentados (diferencia de medias [DM] −82 minutos/día; IC del 95%: −124 a −39, dos estudios), al igual que la duración de los episodios de sedestación que duran 30 minutos o más (DM −53 minutos/día; IC del 95%: −79 a −26, dos estudios, evidencia de muy baja calidad).
No se encontraron diferencias significativas entre los efectos de los escritorios que permiten estar de pie y los escritorios que permiten estar sentados y de pie en la reducción de la sedestación en el trabajo. Los lugares de trabajo activos, como los escritorios con cinta rodante o los escritorios con pedaleo, tuvieron efectos poco claros o inconsistentes sobre el tiempo de sedestación.
Cambios de políticas en el lugar de trabajo
No se encontró un efecto significativo de la implementación de estrategias de caminar sobre la sedestación en el lugar de trabajo en el seguimiento a corto plazo (DM −15 minutos por día; IC del 95%: −50 a 19, evidencia de baja calidad, un estudio) y a plazo medio (DM −17 minutos/día; IC del 95%: −61 a 28, un estudio). Las interrupciones cortas (uno a dos minutos cada media hora) redujeron el tiempo de sedestación en el trabajo en 40 minutos por día como promedio (IC del 95%: −66 a −15, un estudio, evidencia de baja calidad) en comparación con las interrupciones largas (dos interrupciones de 15 minutos por día laboral), en el seguimiento a corto plazo.
Información y asesoramiento psicológico
La provisión de información, retroalimentación, asesoramiento o todos los anteriores no dio lugar a cambios significativos en el tiempo de sedestación en el trabajo en el seguimiento a corto plazo (DM −19 minutos por día; IC del 95%: −57 a 19, dos estudios, evidencia de baja calidad). Sin embargo, la reducción fue significativa en el seguimiento a plazo medio (DM −28 minutos por día; IC del 95%: −51 a −5, dos estudios, evidencia de baja calidad).
Los avisos informáticos combinados con la información no dieron lugar a cambios significativos en el tiempo de sedestación en el trabajo en el seguimiento a corto plazo (DM −10 minutos por día; IC del 95%: −45 a 24, dos estudios, evidencia de baja calidad), pero en el seguimiento a plazo medio produjeron una reducción significativa (DM −55 minutos por día; IC del 95%: −96 a −14, un estudio). Además, los avisos informáticos dieron lugar a una disminución significativa en el número (DM −1,1; IC del 95%: −1,9 a −0,3, un estudio) y la duración (DM ‐74 minutos por día; IC del 95%: −124 a −24, un estudio) promedio de los episodios de sedestación que duran 30 minutos o más.
Los avisos infomáticos con instrucciones para ponerse de pie redujeron la sedestación en el trabajo en 14 minutos por día como promedio (IC del 95%: 10 a 19, un estudio), más que los avisos informáticos con instrucciones para caminar al menos 100 pasos, en el seguimiento a corto plazo.
No se encontró una reducción significativa en el tiempo de sedestación en el lugar de trabajo a plazo medio después del entrenamiento de conciencia plena (DM −23 minutos por día; IC del 95%: −63 a 17, un estudio, evidencia de baja calidad). De manera similar, un único estudio no reportó cambios en el tiempo de sedestación en el trabajo después de la provisión de información muy personalizada o contextualizada y de información menos personalizada o contextualizada. Un estudio no encontró efectos significativos con los rastreadores de la actividad sobre el tiempo de sedestación en el trabajo.
Intervenciones con múltiples componentes
La combinación de intervenciones múltiples tuvo efectos significativos pero heterogéneos sobre el tiempo de sedestación en el trabajo (573 participantes, tres estudios, evidencia de muy baja calidad) y el tiempo de los episodios de sedestación prolongados (dos estudios, evidencia de muy baja calidad) en el seguimiento a corto plazo.
Conclusiones de los autores
En la actualidad, hay evidencia de baja calidad de que el uso de escritorios que permiten estar sentados y de pie reduce la sedestación en el lugar de trabajo en el seguimiento a corto plazo y a plazo medio. Sin embargo, no existe evidencia de sus efectos sobre la sedestación en los períodos de seguimiento más prolongados. Los efectos de otros tipos de intervenciones como los cambios de políticas en el lugar de trabajo, la provisión de información y asesoramiento y las intervenciones con múltiples componentes, en su mayoría no son consistentes. La calidad de la evidencia es baja a muy baja para la mayoría de las intervenciones, debido principalmente a las limitaciones en los protocolos de los estudios y los tamaños pequeños de la muestra. Se necesitan ECA grupales o por conglomerados más grandes con seguimientos a más largo plazo para determinar la efectividad de diferentes tipos de intervenciones para reducir el tiempo de sedestación en el trabajo.
PICO
Resumen en términos sencillos
Intervenciones en el lugar de trabajo (métodos) para reducir el tiempo que las personas pasan sentadas en el trabajo
¿Por qué es importante el tiempo de sedestación laboral?
El tiempo que las personas pasan sentadas y físicamente inactivas en el trabajo ha aumentado en décadas recientes. Los períodos largos de sedestación pueden aumentar el riesgo de obesidad, cardiopatía y muerte prematura. No está claro si las intervenciones que intentan reducir la sedestación en el lugar de trabajo son efectivas.
Propósito de esta revisión
Se planificó determinar los efectos de las intervenciones orientadas a reducir el tiempo de sedestación laboral. Se realizaron búsquedas en la literatura en varias bases de datos hasta el 9 de agosto de 2017.
¿Qué ensayos encontró la revisión?
Se encontraron 34 estudios realizados con un total de 3397 empleados de países de altos ingresos. Dieciséis estudios evaluaron los cambios físicos en el diseño y el ambiente del lugar de trabajo, cuatro estudios evaluaron cambios en las políticas del lugar de trabajo, diez estudios evaluaron intervenciones de información y asesoramiento y cuatro estudios evaluaron intervenciones en categorías múltiples.
Efecto de los escritorios que permiten estar sentados y de pie
El uso de escritorios que permiten estar sentados y de pie parece reducir la sedestación en el lugar de trabajo de 84 a 116 minutos por día como promedio. Cuando se combinó con la provisión de información y asesoramiento, el uso de escritorios que permiten estar sentados y de pie parece dar lugar a reducciones similares de la sedestación en el trabajo. Los escritorios que permiten estar sentados y de pie también parecen reducir el tiempo total de sedestación (laboral y fuera del trabajo) y la duración de los episodios de sedestación de 30 minutos o más. Un estudio comparó los escritorios de pie y los escritorios que permiten estar sentados y de pie pero, debido al número pequeño de empleados incluidos, no aporta suficiente evidencia para determinar qué tipo de escritorio es más efectivo para reducir el tiempo de sedestación.
Efecto de los puestos de trabajo activos
Los escritorios con cinta rodante combinados con el asesoramiento parecen reducir el tiempo de sedestación en el trabajo, aunque la evidencia disponible no es suficiente para concluir si los escritorios con pedaleo combinados con la provisión de información reducen la sedestación en el trabajo más que la provisión de información sola.
Efecto de caminar durante los recesos o duración de los recesos
La evidencia disponible no es suficiente para establecer conclusiones acerca de la efectividad de caminar durante los recesos para reducir el tiempo de sedestación. Hacer pausas cortas (uno a dos minutos cada media hora) parece reducir el tiempo de sedestación en el trabajo en 15 a 66 minutos por día, más que hacer pausas largas (dos interrupciones de 15 minutos por día laboral).
Efecto de la información y el asesoramiento psicológico
El aporte de información, retroalimentación, asesoramiento o todas estas acciones, reduce el tiempo de sedestación en el seguimiento a plazo medio (tres a 12 meses después de la intervención) en cinco a 51 minutos por día como promedio. La evidencia disponible no es suficiente para establecer conclusiones acerca de los efectos del seguimiento a corto plazo (hasta tres meses después de la intervención). El uso de avisos informàticos combinado con proporcionar información reduce a plazo medio el tiempo de sedestación en 14 a 96 minutos por día como promedio. La evidencia disponible no es suficiente para establecer conclusiones acerca de los efectos a corto plazo.
Un estudio encontró que los avisos para levantarse reducen el tiempo de sedestación más que los avisos para caminar en 10 a 19 minutos por día como promedio.
La evidencia disponible no es suficiente para concluir si la provisión de información muy personalizada o contextualizada es más o menos efectiva que proporcionar información menos personalizada o contextualizada para reducir el tiempo de sedestación en el trabajo. La evidencia disponible tampoco es suficiente para establecer conclusiones acerca del efecto del entrenamiento de conciencia plena y el uso de rastreadores de actividad sobre la sedestación en el trabajo.
Efecto de la combinación de intervenciones múltiples
La combinación de intervenciones múltiples parece ser efectiva para reducir el tiempo de sedestación y el tiempo de los episodios de sedestación prolongados a corto plazo y a plazo medio. Sin embargo, esta evidencia proviene de solo un número pequeño de estudios y los efectos fueron muy diferentes entre los estudios.
Conclusiones
La calidad de la evidencia es baja a muy baja para la mayoría de las intervenciones, debido principalmente a las limitaciones en los protocolos de los estudios y los tamaños pequeños de la muestra. Actualmente hay evidencia de baja calidad de que los escritorios que permiten estar sentados y de pie puedan reducir la sedestación en el trabajo en el primer año de uso. Sin embargo, es probable que los efectos se reduzcan con el tiempo. En general, no hay evidencia suficiente para establecer conclusiones acerca de dichos efectos para otros tipos de intervenciones ni para la efectividad de la reducción de la sedestación en el lugar de trabajo durante períodos de tiempo mayores de un año. Se necesitan más estudios de investigación para evaluar la efectividad de diferentes tipos de intervenciones para la reducción de la sedestación en el lugar de trabajo, en particular durante períodos más prolongados.
Conclusiones de los autores
Summary of findings
| Alternative desks and workstations compared to sit‐desks for reducing sitting at work | |||||
| Patient or population: employees who sit at work | |||||
| Outcomes | Anticipated absolute effects* (95% CI) | № of participants | Certainty of the evidence | Comments | |
| Risk with sit‐desk | Risk with changes in desk | ||||
| Comparison: sit‐stand desk with or without information and counselling versus sit‐desk | |||||
| Mean difference in time spent sitting at work, short‐term follow‐up (up to 3 months) | The mean difference in time spent sitting at work (short‐term follow‐up) was 364 minutes | MD 100 minutes lower | 323 | ⊕⊕⊝⊝ | Subgroup analysis showed no difference in effect between sit‐stand desks used alone or in combination with information and counselling. Restricting the analysis to RCTs only did not show any difference in effect either. |
| Mean difference in time in sitting bouts lasting 30 minutes or more, short‐term follow‐up | The mean difference in time in sitting bouts lasting 30 minutes or more (short‐term follow‐up) was 167 minutes | MD 53 minutes lower | 74 | ⊕⊝⊝⊝ | |
| Comparison: treadmill desk combined with counselling versus sit‐desk | |||||
| Mean difference in time spent sitting at work, short‐term follow‐up (up to 3 months) | The mean difference in time spent sitting at work (short‐term follow‐up) was 342 minutes | MD 29 minutes lower | 31 | ⊕⊕⊝⊝ | |
| Mean difference in time in sitting bouts lasting 30 minutes or more, short‐term follow‐up — not reported | ‐ | ‐ | ‐ | ‐ | |
| Comparison: cycling desk + information and counselling versus sit‐desk + information and counselling | |||||
| Mean difference in time spent in inactive sitting at work, medium‐term follow‐up (from 3 to 12 months) | The mean difference in time spent in inactive sitting at work (medium‐term follow‐up) was 413 minutes | MD 12 minutes lower | 54 | ⊕⊕⊝⊝ | |
| *The risk in the intervention group (and its 95% confidence interval) is based on the assumed risk in the comparison group and the relative effect of the intervention (and its 95% CI). | |||||
| GRADE Working Group grades of evidence | |||||
| 1 Of the six RCTs, five were at high risk of bias. The non‐randomised controlled before‐and‐after study/studies were also at high risk of bias; downgraded one level 2 Imprecision with wide confidence intervals, small sample size; downgraded one level 3 Unconcealed allocation, unblinded outcome assessment and attrition bias; downgraded two levels 4 Unblinded outcome assessment; downgraded one level 5 Unblinded outcome assessment and attrition bias; downgraded one level | |||||
| Workplace policy changes compared to no intervention for reducing sitting at work | |||||
| Patient or population: employees who sit at work | |||||
| Outcomes | Anticipated absolute effects* (95% CI) | № of participants | Certainty of the evidence | Comments | |
| Risk with no intervention | Risk with Policy changes | ||||
| Comparision: walking strategies versus no intervention | |||||
| Mean difference in time spent sitting at work, short‐term follow‐up | The mean difference in time spent sitting at work (short‐term follow‐up) was 344 minutes | MD 15 minutes lower | 179 | ⊕⊕⊝⊝ | |
| Mean difference in time in sitting bouts lasting 30 minutes or more, short‐term follow‐up — not reported | ‐ | ‐ | ‐ | ‐ | |
| Comparision: short break versus long break | |||||
| Mean difference in time spent sitting at work, short‐term follow‐up | The mean difference in time spent sitting at work (short term follow‐up) was 131 minutes | MD 40 minutes lower | 49 | ⊕⊕⊝⊝ | |
| Mean difference in time in sitting bouts lasting 30 minutes or more, short‐term follow‐up — not reported | ‐ | ‐ | ‐ | ‐ | |
| *The risk in the intervention group (and its 95% confidence interval) is based on the assumed risk in the comparison group and the relative effect of the intervention (and its 95% CI). | |||||
| GRADE Working Group grades of evidence | |||||
| 1 Risk of bias high due to unblinded outcome assessment and lack of allocation concealment; downgraded with one level 2 Imprecision with wide confidence intervals; downgraded with one level 3 Unconcealed allocation and attrition bias | |||||
| Information and counselling compared to information only or no intervention for reducing sitting at work | |||||
| Patient or population: employees who sit at work | |||||
| Outcomes | Anticipated absolute effects* (95% CI) | № of participants | Certainty of the evidence | Comments | |
| Risk with information only or no intervention | Risk with Information and counselling | ||||
| Information, feedback and counselling versus no intervention | |||||
| Mean difference in time spent sitting at work, short‐term follow‐up — information and feedback versus no intervention | The mean difference in time spent sitting at work (short‐term follow‐up) was 550 minutes | MD 19 minutes lower | 63 | ⊕⊕⊝⊝ | |
| Mean difference in time spent sitting at work, medium‐term follow‐up — counselling versus no intervention | The mean difference in time spent sitting at work (medium‐term follow‐up) was 462 minutes | MD 28 minutes lower | 747 | ⊕⊕⊝⊝ | |
| Mean difference in time in sitting bouts lasting 30 minutes or more, short‐term follow‐up ‐ not reported | ‐ | ‐ | ‐ | ‐ | |
| Prompts combined with information versus information alone | |||||
| Mean difference in time spent sitting at work, short‐term follow‐up | The mean difference in time spent sitting at work (short‐term follow‐up) was 349 minutes | MD 10 minutes lower | 75 | ⊕⊕⊝⊝ | |
| Mean difference in time in sitting bouts lasting 30 minutes or more, short‐term follow‐up | The mean difference in time in sitting bouts lasting 30 minutes or more (short‐term follow‐up) was 286 minutes | MD 74 minutes lower | 28 | ⊕⊕⊝⊝ | |
| Mindfulness training versus no intervention | |||||
| Mean difference in time spent sitting at work, medium‐term follow‐up | The mean difference in time spent sitting at work (medium‐term follow‐up) was 316 minutes | MD 23 minutes lower | 257 | ⊕⊕⊝⊝ | |
| Mean difference in time in sitting bouts lasting 30 minutes or more, medium‐term follow‐up — not reported | ‐ | ‐ | ‐ | ‐ | |
| *The risk in the intervention group (and its 95% confidence interval) is based on the assumed risk in the comparison group and the relative effect of the intervention (and its 95% CI). | |||||
| GRADE Working Group grades of evidence | |||||
| 1 Imprecision with wide confidence intervals, small sample size; downgraded with one level 2 Unblinded outcome assessment and attrition bas 3 Risk of bias, allocation not concealed, lack of blinding, high attrition rate; downgraded with one level 4 Lack of blinding of participants and selective reporting 5 Lack of blinding of participants and attrition bias 6 Risk of bias high due to unconcealed allocation and unblinded outcome assessment; downgraded with one level 7 Lack of blinding of participants | |||||
| Multi‐component intervention compared to no intervention for reducing sitting at work | |||||
| Patient or population: employees who sit at work | |||||
| Outcomes | Anticipated absolute effects* (95% CI) | № of participants | Certainty of the evidence | Comments | |
| Risk with no intervention | Risk with Multi‐component intervention | ||||
| Mean difference in time spent sitting at work, short‐term follow‐up | See comment | see comment | 573 | ⊕⊝⊝⊝ | Not pooled |
| Mean difference in time in sitting bouts lasting 30 minutes or more, short‐term follow‐up | See comment | See comment | 518 | ⊕⊝⊝⊝ | Not pooled |
| *The risk in the intervention group (and its 95% confidence interval) is based on the assumed risk in the comparison group and the relative effect of the intervention (and its 95% CI). CI: Confidence interval; RR: Risk ratio; OR: Odds ratio; RCT: randomised controlled trial | |||||
| GRADE Working Group grades of evidence | |||||
| 1 Unconcealed allocation and unblinded outcome assessment 2 Imprecision with wide confidence interval, small sample size 3 Not pooled due to high heterogeneity 3 Small sample size | |||||
Antecedentes
Descripción de la afección
En años recientes, el comportamiento sedentario, especialmente la sedestación, ha atraído un gran interés de los medios, las agencias gubernamentales y los investigadores. El gasto de energía en diversas tareas se puede expresar en equivalentes metabólicos (MET, por sus siglas en inglés). Un MET es la energía durante el reposo, es decir, el gasto de energía cuando se descansa tranquilamente, definido como una captación de oxígeno de 3,5 ml kg‐1 min‐1(Ainsworth 2000). La sedestación laboral y realizar tareas laborales asignadas mientras se está sentado invierte un gasto de energía de 1,5 MET o menos. La reducción del tiempo de sedestación generalmente da lugar a mayores niveles de actividad física de intensidad ligera a moderada, como estar de pie o caminar (Mansoubi 2014).
La naturaleza del trabajo de oficina ha cambiado desde el año 2000 y actualmente los trabajadores no tienen que moverse con frecuencia de sus lugares de trabajo (VicHealth 2012). El progreso de la tecnología (p.ej. robótica, computadoras) ha dado lugar a una disminución en el esfuerzo físico en los lugares de trabajo (Craig 2002). Por lo tanto, los trabajadores se han vuelto físicamente menos activos en su puesto de trabajo en comparación con su tiempo libre (Franklin 2011; McCrady 2009; Parry 2013; Thorp 2012; van Uffelen 2010). Por ejemplo, desde los años sesenta en los EE.UU. y el Reino Unido los niveles de la actividad física ocupacional en la población han descendido en más del 30% (Ng 2012). También se ha encontrado una disminución grande en la actividad física ocupacional en los países de ingresos bajos y medios, como Brasil y China (Ng 2012). Esta disminución en la actividad física ocupacional se puede atribuir en gran parte al aumento del tiempo de sedestación laboral. Se ha encontrado que los empleados de oficinas estuvieron sentados durante el 66% del tiempo total de trabajo y que el 5% de todos los eventos de sedestación y el 25% del tiempo total de los episodios de sedestación fueron mayores de 55 minutos (Ryan 2011).
Los estudios han mostrado que la sedestación durante un tiempo excesivo en el trabajo puede aumentar el riesgo de enfermedad cardiovascular, obesidad, diabetes y mortalidad por todas las causas, incluso si la persona se vincula a niveles recomendados de actividad física durante su tiempo de ocio (Chau 2014a; Craft 2012; Dunstan 2011). Las estimaciones muestran un aumento del 5% en el riesgo de obesidad y un aumento del 7% en el riesgo de diabetes asociada con cada dos horas por día de aumento del tiempo de sedestación en el trabajo (Hu 2003). También se ha calculado que los que permanecen sentados durante ocho a 11 horas por día tienen un aumento del 15% en el riesgo de muerte en los próximos tres años que los que permanecen sentados menos de cuatro horas por día, mientras que el riesgo aumenta hasta el 40% en los que permanecen sentados más de 11 horas por día (Van der Ploeg 2012). En Bey 2003 se formula la hipótesis de que el reemplazo de la sedestación con una actividad física de intensidad ligera (de 1,5 ETS a 3 ETS) a moderada (3 ETS a 6 ETS; Ainsworth 2011) mejora el metabolismo de la glucosa y los lípidos. Otro estudio, Duvivier 2013, también ha indicado que los efectos beneficiosos pueden ser mayores cuando la sedestación se reemplaza con actividad de intensidad ligera a moderada, como ponerse de pie y caminar, que cuando se reemplaza con el pedaleo vigoroso con un gasto de energía similar. Lo anterior puede indicar que, en las intervenciones para reducir el comportamiento sedentario, el cambio de postura puede ser igual, o incluso más importante, que el aumento del gasto de energía.
Descripción de la intervención
Se calcula que el 60% de la población mundial forma parte de la fuerza laboral y pasa como promedio el 60% de las horas de vigilia en el trabajo (WHO/WEF 2008). Por tanto, es posible influir en las conductas saludables de una gran parte de la población adulta a nivel mundial mediante intervenciones en el lugar de trabajo.
Los lugares de trabajo tienen la ventaja de que es posible crear apoyo social integrado, o sea, la colaboración activa de los empleados para hacer cambios sostenibles para lograr un estilo de vida saludable, lo que puede reducir el grado de esfuerzo y motivación individuales necesarios para hacer cambios conductuales. Por tanto, los cambios en el estilo de vida logrados en el trabajo son sostenibles a largo plazo (Plotnikoff 2012).
A los trabajadores se les puede alentar a que sean más activos físicamente mediante cambios en el diseño y el ámbito laboral. Un escritorio convencional que permite estar sentado se puede reemplazar o complementar con: un escritorio que permite estar sentado y de pie; un denominado "escritorio cálido", que es de altura regulable y permite al usuario alternar la postura entre la sedestación y estar de pie (Alkhajah 2012; Gilson ND 2012; Straker 2013); un puesto de trabajo vertical que permite el uso de un ordenador personal mientras se camina en una cinta rodante a una velocidad seleccionada por el usuario (Levine 2007); una máquina de ejercicio de escritorio con pedales/escalones colocada bajo el escritorio que permite al usuario dar pasos o pedalear mientras está sentado (McAlpine 2007); una silla de balón inflado; o un balón terapéutico (Beers 2008; USPTO 2000). El reemplazo de las sillas de oficina convencionales por sillas de balón inflado hace el acto de la sedestación más activo físicamente al aumentar la necesidad de utilizar los músculos abdominales, de la espalda, las piernas y los muslos para permanecer en posición vertical y mantener el equilibrio.
El tiempo pasado en comportamiento sedentario teóricamente también se puede reducir al cambiar la disposición de los lugares de trabajo, por ejemplo, al colocar las impresoras más lejos de los escritorios. El trabajo de oficina también se puede hacer más exigente físicamente al formar grupos para caminar o hacer otros ejercicios como bailar o grupos de gimnasia durante el horario laboral (Ogilvie 2007; Thogersen‐Ntoumani 2013), al estimular a los empleados a que caminen alrededor de los edificios de oficinas durante los recesos o a que caminen para comunicarse con sus compañeros en lugar de utilizar el teléfono o el correo electrónico. Las prácticas y políticas en los lugares de trabajo se pueden cambiar al incorporar interrupciones periódicas dentro del calendario institucional, incluidos episodios cortos de actividad física (p.ej. episodios de actividad de cinco a 15 minutos) o al realizar reuniones caminando o de pie (Commissaris 2007). Las salas de reunión pueden estar equipadas con puestos de trabajo que permitan estar sentados y de pie de manera que los empleados pueda elegir permanecer de pie durante las reuniones si lo desean (Atkinson 2014). Estos cambios en la práctica y la política del lugar de trabajo pueden brindar una oportunidad para que un gran número de personas, que están principalmente sentados en el trabajo, reduzcan su tiempo de sedestación.
Los trabajadores también pueden concienciarse de la importancia de cambiar su comportamiento de sedestación mediante lel aporte de información, como los avisos motivacionales para sentarse menos en el lugar de trabajo, mediante acciones de difusión electrónica que estimulan y recuerdan a los trabajadores a que se sienten menos o a que interrumpan los períodos prolongados de sedestación (Cooley 2014; Evans 2012; Pedersen 2013) o al distribuir folletos con mensajes como "Sentarse menos, moverse más" que destacan los riesgos asociados con la sedestación. Una intervención sanitaria electrónica consiste en información que se proporciona de modo electrónico, como correo electrónico, avisos recordatorios o cualquier mensaje mostrado periódicamente en la pantalla del ordenador. Las intervenciones informativas también pueden ser proporcionadas de una manera interactiva por parte de asesores entrenados, en la que, como parte de las sesiones de asesoramiento, informan acerca de los intereses de los trabajadores y les proporcionan diferentes opciones sobre cómo reducir el comportamiento sedentario (Opdenacker 2008).
También hay algunos inconvenientes relacionados con estas intervenciones. El rendimiento y la productividad de los trabajadores que trabajan sentados pueden disminuir cuando se promueve caminar en el lugar de trabajo y los empleados abandonan sus escritorios con mayor frecuencia. Las personas que trabajan en un escritorio con cinta rodante deben tener cuidado de no tropezar o caer, por lo que dividen su atención entre el trabajo y la seguridad, lo que podría comprometer la productividad (Tudor‐Locke 2013). Además, las habilidades motoras complejas como la exactitud en la manipulación del ratón, las habilidades para la solución de problemas matemáticos y el rendimiento laboral percibido parecen disminuir con los puestos de trabajo con cintas rodantes y con pedaleo (Commissaris 2014; John 2009). Esta disminución en la eficiencia se podría deber a los efectos del aprendizaje, al familiarizarse con las nuevas formas de trabajo.
De qué manera podría funcionar la intervención
Según modelos ecológicos, las estrategias exitosas para reducir el comportamiento sedentario incluyen:
-
proporcionar acceso a las infraestructuras para reducir el comportamiento sedentario;
-
mayor conocimiento y comprensión de la importancia y los métodos para reducir el comportamiento sedentario; o
-
uso de las redes sociales y el apoyo institucional para informar y promover los cambios en las políticas y normas relacionadas con el comportamiento sedentario (Sallis 2006).
Sobre la base de esta definición, se prevén tres maneras diferentes (solas o en conjunto entre sí) en que estas intervenciones podrían funcionar para reducir la sedestación en el lugar de trabajo.
Cambios físicos en el diseño y el ámbito del lugar de trabajo
Si los empleados utilizan un escritorio o una silla estándar en el lugar de trabajo, la provisión de nuevos tipos de escritorios o sillas de trabajo pueden concienciarlos acerca de las posibilidades que este equipamiento nuevo les ofrece para disminuir la sedestación y pueden estar tentados a probarlas. Lo anterior reemplazaría la sedestación con alguna otra actividad, a la vez que permitiría realizar las tareas habituales con la misma eficiencia. El cambio de la disposición del lugar de trabajo, por ejemplo, al colocar las impresoras lejos de los escritorios obliga a los empleados a que se levanten y caminen para obtener sus impresos.
Políticas para cambiar la organización del trabajo
Las políticas organizacionales podrían apoyar la formación de grupos para caminar o hacer ejercicios en el lugar de trabajar o realizar reuniones caminando. La formación de grupos para caminar o hacer ejercicios o la realización de reuniones caminando, podría ayudar a los individuos a reducir la sedestación y quizá también les ayude a estimularse a sí mismos a adoptar nuevos comportamientos. La provisión de recesos cortos intencionales (con la intención de reducir la sedestación) podría ayudar a que los trabajadores se vinculen a dichas actividades con mayor frecuencia. Los recesos también podrían estimular a los empleados a caminar para comunicarse con los colegas en lugar de utilizar el teléfono o el correo electrónico. Las salas de reuniones donde se esté de pie les proporcionarían a los empleados de oficina una oportunidad para reducir el tiempo de sedestación.
Provisión de información y asesoramiento psicológico
Los trabajadores sedentarios podrían reconocer la importancia de reducir el tiempo que pasan en comportamiento sedentario. Podrían estar informados acerca de los riesgos para la salud y los efectos beneficiosos de reducir el tiempo en sedestación y reemplazarlo con pasar tiempo en un comportamiento físicamente más exigente. En Wilks 2006, se encontró que fue más probable que los empleados que habían recibido información con respecto a los riesgos para la salud de la sedestación utilizaran un escritorio que permite estar sentados y de pie con mayor frecuencia que los que no la recibieron. Aunque las personas sean conscientes de los efectos adversos de la sedestación y tengan acceso a los servicios y los programas para disminuir la sedestación, aún podrían encontrar dificultades para adaptarse a un nuevo comportamiento. Lo anterior requiere de un esfuerzo consciente para que la persona interrumpa su comportamiento normal de sedestación y participe de la actividad física mientras trabaja. Para facilitar el cambio de comportamiento, a los trabajadores se les podrían proporcionar estímulos de su preferencia o asesoría, lo que podría permitir que los individuos evalúen sus decisiones conductuales y se motiven a adoptar las que son saludables. Los mensajes sobre las preferencias se pueden proporcionar mediante diversos medios como letreros, correo electrónico, mensajes de texto o llamadas telefónicas, para motivar el cambio de comportamiento. En el ordenador personal del empleado se puede instalar un programa informático de aviso para que cada 30 minutos aparezca en su pantalla un recordatorio de un minuto para hacer un receso (Evans 2012).
Por qué es importante realizar esta revisión
Las intervenciones para reducir la sedestación laboral son cada vez más populares, aunque no está claro si son efectivas a largo plazo (Healy 2013). Por tanto, es necesario evaluar si la sedestación laboral se puede reducir con intervenciones y comparar la efectividad de varias tipos de intervenciones.
Aunque algunos estudios han mostrado que los escritorios que permiten estar sentados y de pie y las estrategias de caminar han sido útiles para reducir la sedestación, no se encontraron diferencias significativas en la duración de los episodios individuales de sedestación en Straker 2013. Otro estudio encontró un efecto significativo de las estrategias para aumentar la deambulación sobre el comportamiento de sedestación (Gilson 2009), mientras que Evans 2012 encontró que un programa informático con avisos recordatorios junto con la educación fue superior a la educación sola. Esta inconsistencia en los resultados a partir de estudios individuales significa que no está claro si las intervenciones en el lugar de trabajo para la reducción de la sedestación son efectivas, y si diferentes tipos de intervenciones difieren en cuanto a su efectividad.
Posiblemente debido a la variación en los resultados entre los estudios, las recomendaciones para la reducción de la sedestación laboral varían. En los últimos años, varios países, como el Reino Unido y Australia (Australian Government 2014; Department of Health 2011), han incorporado recomendaciones para los comportamientos sedentarios como parte de sus guías de actividad física. Sin embargo, estas guías solo proponen posibles estrategias para reducir el tiempo de sedestación sin cuantificar la duración total recomendada del tiempo de sedestación. En 2015, un grupo internacional de expertos recomendó que a los empleados de oficina se les debe proponer acumular dos horas por día para levantarse y realizar una actividad ligera (caminata ligera) durante las horas de trabajo, que progrese con el tiempo hasta acumular cuatro horas por día. Para lograr lo anterior, recomendaron dividir el tiempo de sedestación y el tiempo de estar de pie mediante escritorios para permanecer sentados y de pie o al tomar pequeños recesos activos para estar de pie. (Buckley 2015). Aunque todas estas guías fortalecen la evidencia de los efectos adversos de la sedestación sobre la salud, hay escasa evidencia de que las diferentes intervenciones que intentan reducir la sedestación puedan ayudar a las personas a cumplir cualquiera de estas recomendaciones. Además, como este tema es cada vez de mayor interés, es probable que la disponibilidad de la evidencia aumente en un futuro próximo. Una revisión sistemática Cochrane asegurará la actualización oportuna de esta información para los encargados de adoptar decisiones.
Objetivos
Evaluar la efectividad de las intervenciones en el lugar de trabajo para reducir la sedestación laboral en comparación con ninguna intervención o intervenciones alternativas.
Métodos
Criterios de inclusión de estudios para esta revisión
Tipos de estudios
Se incluyeron ensayos controlados aleatorios (ECA), ECA cruzados, ECA grupales o por conglomerados y ensayos controlados cuasialeatorios. Los ensayos controlados cuasialeatorios son ensayos que asignan al azar a los participantes a un grupo de intervención o control mediante un método de asignación al azar que no es aleatorio. En los lugares de trabajo, las intervenciones funcionan a nivel grupal y, por tanto, son difíciles de proporcionar de forma individual (Ijaz 2014). Como es más difícil asignar al azar las unidades cuando la intervención se implementa a un nivel global mayor, también se incluyeron estudios controlados tipo antes y después (ECAD) que utilizaron un grupo control concurrente para las intervenciones dirigidas a cambiar la organización de los lugares de trabajo.
Tipos de participantes
Se incluyeron todos los estudios realizados con participantes a partir de los 18 años de edad, cuyas ocupaciones incluían pasar la mayoría de su tiempo laboral sentados ante un escritorio, como en trabajos administrativos, servicio de clientes, profesionales de servicios de asistencia, representantes de centro de llamadas y recepcionistas.
Se excluyeron los estudios que abordaron el trabajo de transporte. Las personas que trabajan en la industria del transporte (como taxistas, camioneros, conductores de autobuses, pilotos de compañías aéreas) y con equipos pesados (como operadores de grúas y excavadoras) también están expuestas a una sedestación prolongada, pero la tecnología actual brinda opciones muy limitadas para implementar intervenciones que disminuyan la sedestación en estas ocupaciones. La reducción de la sedestación en las personas que trabajan en la industria del transporte y operan maquinarias pesadas requiere intervenciones diferentes que podrían ser el tema de otra revisión.
Tipos de intervenciones
Intervención
Cambios físicos en el diseño y el ámbito del lugar de trabajo
-
Cambios en la disposición del lugar de trabajo, como colocar las impresoras lejos de los escritorios de la oficina.
-
Cambios en los escritorios que permitan una mayor actividad física, como el uso de escritorios que permitan estar sentados y de pie, lugares de trabajo verticales sobre cintas rodantes, escritorios con pedales/con pedaleo, o dispositivos para dar pasos.
-
Cambios en las sillas que permitan más actividad, como sillas de balones inflados o balones terapéuticos.
Políticas para cambiar la organización del trabajo
-
Reuniones caminando y caminar u otros grupos de ejercicios durante el tiempo de trabajo.
-
Recesos (periódicos, frecuentes o intencionales) para disminuir la sedestación, pararse y hacer ejercicios.
-
Diarios de sedestación.
Provisión de información y asesoramiento psicológico
-
Señales o avisos en el lugar de trabajo (p.ej. carteles) o en el puesto de trabajo (ordenador).
-
Intervención sanitaria electrónica.
-
Distribución de folletos.
-
Asesoramiento psicológico (personal, correo electrónico o teléfono).
Intervenciones con múltiples componentes
-
Las intervenciones que incluyeron elementos de las tres categorías mencionadas anteriormente.
Comparación
Se compararon las intervenciones descritas anteriormente con ninguna intervención o con otras intervenciones.
Tipos de medida de resultado
Resultados primarios
Se incluyeron los estudios que evaluaron la sedestación laboral medida como:
-
el tiempo de sedestación laboral informado por el participante mediante cuestionarios; o
-
medición con dispositivos de la sedestación evaluada objetivamente por medio de un acelerómetro‐inclinómetro, que evalúa la intensidad de la actividad física y la postura corporal (Kanoun 2009; Kim 2015); o
-
medición informada por el participante o con dispositivos del tiempo de los episodios de sedestación prolongados (p.ej. 30 minutos o más) y el número de dichos episodios.
Resultados secundarios
-
Gasto de energía calculado en horas de equivalente metabólico (MET) por día laboral como medida aproximada para detectar cambios en el tiempo de sedestación.
-
Tiempo total informado por el participante o medido objetivamente de sedestación laboral y fuera del trabajo.
-
Informado por el propio participante o tiempo de pie y caminando en el trabajo.
-
Productividad laboral.
-
Eventos adversos, incluido cualquier síntoma musculoesquelético informado debido a la posición de pie prolongada, como un efecto secundario posible por utilizar un escritorio que permite estar sentado y de pie.
Métodos de búsqueda para la identificación de los estudios
Búsquedas electrónicas
We searched for all eligible published and unpublished trials in any language. We were prepared to translate non‐English language abstracts for potential inclusion. Our search strategy was based on types of study population, types of study design, work‐related aspects, and outcomes related to sitting, and it consisted of keywords generated with the help of a thesaurus, such as 'seated posture'.
We searched the following electronic databases from inception to 9 August 2017 for identifying potential studies:
-
Cochrane Central Register of Controlled Trials (CENTRAL; Appendix 1);
-
MEDLINE (searched through Ovid; Appendix 2);
-
Cumulative Index to Nursing & Allied Health Literature (CINAHL; Appendix 3);
-
Occupational Safety and Health Database (OSH UPDATE; Appendix 4);
-
Excerpta Medica dataBASE (Embase; Appendix 5);
-
PsycINFO (searched through Ovid; Appendix 6);
-
ClinicalTrials.gov (http://clinicaltrials.gov/; Appendix 7); and
-
World Health Organization (WHO) International Clinical Trials Registry Platform (ICTRP) search portal (http://apps.who.int/trialsearch/; Appendix 8).
Búsqueda de otros recursos
We checked reference lists of all included studies and systematic reviews for additional trials. We contacted experts in the field and authors of included studies to identify additional unpublished or ongoing studies.
Obtención y análisis de los datos
Selección de los estudios
Two review authors (NS, KKH) independently screened titles and abstracts of the documents found in our systematic search, to identify potential studies for inclusion. The same authors marked citations as 'retrieve' (eligible or potentially eligible/unclear) or 'do not retrieve'. We retrieved full‐text study reports or publications for all citations considered potentially relevant. Two authors (NS, KKH) independently assessed the retrieved full‐texts to identify eligible studies for inclusion. We recorded reasons for exclusion of ineligible studies. We resolved disagreements through discussion or, if required, we consulted a third author (SI). We identified and excluded duplicates and collated multiple reports of the same study so that each study rather than each report was the unit of interest in the review. We recorded the selection process in sufficient detail to create a Preferred Reporting Items for Systematic Reviews and Meta‐Analyses (PRISMA) flow diagram (Moher 2009).
Extracción y manejo de los datos
We used a data collection template to extract study characteristics and outcome data. We extracted the following information.
-
Methods: study location, date of publication, type of study design, study setting.
-
Participants: number randomised or recruited, mean age or age range, gender, inclusion and exclusion criteria of the trial, occupation, number of withdrawals, similarity of study groups in age, gender, occupation, and sitting time at baseline.
-
Interventions: description of intervention methods and randomised groups, duration of active intervention, duration of follow‐up, and description of comparisons, interventions and co‐interventions.
-
Outcomes: description of primary and secondary outcomes and their assessment methods.
-
Notes: source of funding for the trial and potential conflicts of interest of trial authors.
Two review authors (NS and either VH or SI) independently extracted outcome data from the included studies. We noted in the Characteristics of included studies table when trial authors did not report outcome data in a usable way. We resolved disagreements by consensus or by involving a third author (either SI or VH). One review author (NS) transferred data into Cochrane's statistical software, Review Manager 5 (Review Manager 2014). We double‐checked that we had entered the data correctly. For this purpose we tabulated extracted information about studies in a spreadsheet before entry into Review Manager. A review author (JV) spot‐checked a random 20% of extracted data for accuracy against the trial report.
Evaluación del riesgo de sesgo de los estudios incluidos
Two review authors (NS and either VH or SI) independently assessed risk of bias for each study using the criteria outlined in the Cochrane Handbook for Systematic Reviews of Interventions (Higgins 2011). We resolved disagreements by discussion or by involving another author (ZP). We assessed the included studies' risk of bias according to the following domains.
-
Random sequence generation
-
Allocation concealment
-
Blinding of participants and personnel
-
Blinding of outcome assessment
-
Incomplete outcome data
-
Selective outcome reporting
-
Validity of outcome measure
-
Baseline comparability/imbalance for age, gender and occupation of study groups
We graded each potential source of bias as high, low, or unclear and provided a quote from the study report together with a justification for our judgment in the 'Risk of bias' tables. We summarised the risk of bias judgements across different studies for each of the domains. Where information on risk of bias related to unpublished data or correspondence with a trialist, we noted it as such in the 'Risk of bias' tables.
We judged studies as being at low risk for selective outcome reporting, if the publications of the trial followed what had been planned and had been registered in international databases (trial registries), such as ClinicalTrials.gov, Australia and New Zealand Clinical Trials Registry (anzctr.org.au/), or Netherlands Trial Registry (trialregister.nl). We judged the studies that were not registered in trial registries as being at low risk for selective outcome reporting if they had reported all the outcomes mentioned in their methods section.
We judged a study to be at low risk of bias overall when the study included a sufficiently detailed description of its random sequence generation, allocation concealment, blinding of outcome assessment, complete outcome data, no selective outcome reporting, and valid outcome measures, that is, all the domains had a low risk of bias. We judged a study to have a high risk of bias when it reported a feature that would be judged as having a high risk of bias in any one of the eight domains. We did not assess blinding of participants or study personnel for risk of bias, as it is very difficult to blind either of them in studies that are trying to modify sedentary behaviour.
Medidas del efecto del tratamiento
We entered the outcome data for each study into the data tables in Review Manager to calculate the pooled treatment effects. We used risk ratios (RRs) for dichotomous outcomes and mean differences (MDs) for continuous outcomes. Where only effect estimates and their 95% confidence intervals (CIs) or standard errors were reported in studies, we entered these data into Review Manager using the generic inverse variance method.
Cuestiones relativas a la unidad de análisis
For cluster‐RCTs that did not present results accounting for clustering effect, we calculated these assuming a large intra‐cluster correlation coefficient of 0.10. We based this assumption on a realistic estimate by analogy on studies about implementation research (Campbell 2001). We transformed all measurement units for sitting at work into minutes per eight‐hour workday where needed and possible, and assumed the data referred to a five‐day work week, if this was not reported.
Manejo de los datos faltantes
We contacted researchers or study sponsors to verify key study characteristics and obtain missing information or full‐text reports. When we did not find a full study report even after contacting authors listed in the respective abstract, we categorised the references as Studies awaiting classification.
For missing data not obtained from authors, such as standard deviations, we calculated these following the advice in the Cochrane Handbook section 16.1.2 (Higgins 2011). We tested the inclusion of studies with missing data and any imputations in sensitivity analyses.
Evaluación de la heterogeneidad
We assessed clinical homogeneity of the results of included studies based on similarity of populations, interventions, outcomes, and follow‐up times. We considered populations to be similar when the participants were 18 years or older and their occupations involved sitting for a major part of their working time. We considered interventions to be similar when their working mechanisms were similar, for example, replacing sit‐desks with sit‐stand desks (see Types of interventions). We regarded follow‐up times of three months or less as short‐term, between three months and one year as medium‐term, and more than one year as long‐term.
We quantified the degree of heterogeneity using the I² statistic, where an I² value of 25% to 50% indicates a low degree of heterogeneity, 50% to 75% a moderate degree of heterogeneity, and more than 75% a high degree of heterogeneity. If we identified moderate to high heterogeneity, we reported it and explored possible causes by pre‐specified subgroup analyses.
Evaluación de los sesgos de notificación
When ten or more studies were included in a meta‐analysis, we tested for the effect of small studies using a funnel plot.
Síntesis de los datos
We analysed the effects of interventions in the categories defined in Types of interventions: physical changes in the workplace design and environment (changes in desks; changes in chairs); policies to change the organisation of work (supporting social environment and policies for breaks); or provision of information and counselling. We pooled effect size estimates from individual studies using Review Manager 5 (Review Manager 2014). We considered studies to be heterogeneous, and therefore used a random‐effects model to calculate pooled effect sizes.
We calculated the prediction interval for the outcome sitting time at work for sit‐stand desks compared to sit‐desks. Prediction intervals give an estimate of the effect of a new study based on the heterogeneity of effects of studies included in the meta‐analysis (Higgins 2009; IntHout 2016).
'Summary of findings' table
We reported time spent sitting at work and time spent in sitting bouts of 30 minutes or more at short‐term follow‐up in the 'Summary of findings' table. Where study authors did not report effects in the short‐term follow‐up for the outcomes mentioned above, we presented results at medium‐term follow‐up. We only reported the most relevant comparisons. We used the Grading of Recommendations Assessment, Development and Evaluation (GRADE) considerations (study limitations, consistency of effect, imprecision, indirectness, and publication bias) to assess the quality of the body of evidence that contributed data to the meta‐analyses for these outcomes (Higgins 2011). We justified all decisions to downgrade or upgrade the quality of evidence using footnotes and we made comments to aid readers’ understanding of the review where necessary.
Análisis de subgrupos e investigación de la heterogeneidad
If sufficient data become available in future updates of this review we will conduct the following subgroup analyses for the primary outcome of time spent sitting at work.
-
Age: we will compare studies conducted in participants aged 18 to 40 years with studies where all participants were aged 41 years or older, as the probability of maintaining good health and fitness diminishes with older age (AIHW 2008). Older employees might also expect a larger health benefit due to a reduction in sitting (Manini 2015).
-
Types of outcome measure: we will carry out a subgroup analysis by type of outcome measure, that is, self‐reported (e.g. questionnaire, log book) versus accelerometer/inclinometer versus Ecological Momentary Assessment.
-
Types of intervention: we will carry out a subgroup analysis for different interventions that have been pooled under a broader category of intervention.
Similarly, we will assess the robustness of our results by excluding studies we judge to have a high risk of bias from all meta‐analyses.
Results
Description of studies
See: Figure 1, Characteristics of included studies, Characteristics of excluded studies, Characteristics of studies awaiting classification, and Characteristics of ongoing studies.

PRISMA study flow diagram
Results of the search
We conducted systematic searches in selected electronic databases and grey literature sources. We identified altogether 12,368 references in the initial search (December 2013) and the first search update (June 2015), and retrieved a total of 92 references for full‐text scrutiny. Of these, we excluded 72 articles and included 20 studies in the previous published version of this review. For this update, we searched the electronic databases from June 2015 until 9 August 2017. The updated search identified a total of 6,040 references, as outlined in Figure 1: 396 from CENTRAL (Appendix 1; 9 August 2017); 2683 from MEDLINE (searched through Ovid, Appendix 2; 9 August 2017); 849 from CINAHL (Appendix 3; 9 August 2017); 108 from OSH UPDATE (Appendix 4; 9 August 2017); 1099 from Embase (Appendix 5; 9 August 2017); 899 from PsycINFO (Appendix 6; 9 August 2017); 4 from ClinicalTrials.gov (Appendix 7; 9 August 2017); and 2 from the WHO trials search portal (Appendix 8; 9 August 2017). Removal of duplicates reduced the total number of references to 4,534. Based on their titles and abstracts, we selected 54 of these references for full‐text reading. Out of these, we excluded 33 studies. Six studies are ongoing and one study was not available in full text so we classified it as a study awaiting classification. This resulted in 14 studies being included in this review update in addition to the 20 studies already included in the previous version of the review.
Included studies
Study design
Out of the 34 included studies, 17 are RCTs, two are cross‐over RCTs, seven are cluster‐RCTs, and eight are controlled before‐and‐after studies with concurrent controls. See Characteristics of included studies for further details. Although the authors described their studies as quasi‐RCTs, we categorised Alkhajah 2012, and Neuhaus 2014a, as controlled before‐and‐after studies because the risk of baseline differences for studies with only two clusters is very high. Only one cluster trial reported unadjusted results (De Cocker 2016). Therefore we adjusted their results for the design effect following the methods stated in Section 16.3 of the Cochrane Handbook for Systematic Reviews of Interventions for the calculations (Higgins 2011).
We considered randomised and non‐randomised studies as similar if there were no considerable differences in their effect estimates (Alkhajah 2012; Chau 2014; Chau 2016; Dutta 2014; Graves 2015; Healy 2013; Li 2017; MacEwen 2017; Neuhaus 2014a; Tobin 2016), but explored any potential differences in a subgroup analysis.
For meta‐analyses that included two arms of the same study, we halved the number of participants in the control group (Coffeng 2014; De Cocker 2016; Neuhaus 2014a). For Coffeng 2014, we used the unadjusted results at twelve months follow‐up. In other comparisons we used the adjusted values with the generic inverse variance method. One included study (Neuhaus 2014a) reported only MDs and standard errors and the authors could not provide raw data, so we could not adjust the number of participants. In this case we modelled the means and standard deviations from the intervention and the control group in Review Manager as closely to the real data as possible to achieve the same MD and standard error. Then we halved the number of participants in the control group and entered the resulting standard errors into Review Manager.
Participants
The included studies were conducted with a total of 3,397 employees. The sample sizes of included trials ranged from 16 in the smallest study (Chau 2016), to 523 in the largest one (Verweij 2012), with a median of 44. Studies included workers from the public and private sectors, with nine studies including researchers and other academic staff, two studies including health workers, and 23 including employees in private companies.
Gender
Participants in 20 studies were predominantly women (Carr 2015; Danquah 2017; De Cocker 2016; Donath 2015; Dutta 2014; Evans 2012; Gao 2015; Gilson 2009; Graves 2015; Healy 2016; Kress 2014; Li 2017; MacEwen 2017; Mailey 2016; Pickens 2016; Priebe 2015; Schuna 2014; Swartz 2014; Tobin 2016; Urda 2016). In the remaining 14 studies the proportions of women and men did not differ significantly.
Country
The studies were conducted in Australia, the USA, Canada, and several high‐income countries in Europe.
Interventions
1. Physical changes in the workplace design and environment
Sixteen studies evaluated the effectiveness of individual workspace modifications on workplace sitting time (Alkhajah 2012; Carr 2015; Chau 2014; Chau 2016; Dutta 2014; Gao 2015; Graves 2015; Healy 2013; Kress 2014; Pickens 2016; Li 2017; MacEwen 2017; Neuhaus 2014a; Schuna 2014; Sandy 2016; Tobin 2016)
Sit‐stand desk
Twelve studies assessed the effectiveness of interventions using sit‐stand desks. The interventions using a sit‐stand desk were assessed independently (Alkhajah 2012; Chau 2014; Dutta 2014; Gao 2015; MacEwen 2017; Neuhaus 2014a), and in combination with information and counselling (Chau 2016; Graves 2015; Healy 2013; Li 2017; Neuhaus 2014a; Tobin 2016).
One study compared the effectiveness of multiple types of interventions, including: 1) sit‐stand desk; 2) ergonomic training; 3) sit‐stand desk combined with ergonomic training; and 4) standard sit‐desk (Sandy 2016).
Standing desk
Two studies compared the effectiveness of a standing desk intervention and a sit‐stand desk intervention (Kress 2014; Pickens 2016).
Active workstation
Two studies evaluated the effectiveness of interventions using active workstations (i.e. desks that cause significant increase in energy expenditure compared to conventional sit‐desks). One study assessed the effectiveness of a treadmill desk (Schuna 2014), while another assessed the effectiveness of a cycle desk (Carr 2015).
2. Policy to change the organisation of work
Two studies evaluated the effectiveness of walking strategies (Gilson 2009; Puig‐Ribera 2015). The first evaluated the effectiveness of route and incidental walking on office employees' sitting time at work (Gilson 2009). The route‐based walking intervention was intended to increase the amount of brisk, sustained walking during work breaks. The incidental walking intervention aimed to increase walking and talking to colleagues, instead of sending emails or making telephone calls, and standing and walking during meetings, instead of sitting at desks. The other study evaluated the effectiveness of incidental movement and short (5 to 10 minutes) and longer (10+ minute) walks on office employees' sitting time at work (Puig‐Ribera 2015).
One study evaluated the effectiveness of planned daily breaks from sitting (Mailey 2016). They compared taking short breaks (one to two minutes every half hour) to taking long breaks (two 15‐minute breaks per workday).
3. Provision of information and counselling
Information and feedback
One study evaluated the effectiveness of personalised computer‐tailored feedback and generic feedback intervention in reducing sitting time in office employees (De Cocker 2016). Another compared the effectiveness of delivering emails containing psychosocial materials and other available resources that were based on constructs of Social Cognitive Theory relating to decreasing sedentary behaviours at work, to delivering emails concerning general health topics (Gordon 2013). In Priebe 2015, the effectiveness of providing highly personalised or contextualised information was compared with the effectiveness of providing less personalised or contextualised information.
Counselling
In Verweij 2012, the effectiveness of counselling by occupational physicians (highly trained specialists who provide health services to employees and employers (AFOEM 2014)) was compared with usual care in decreasing sitting time in office employees. Another study evaluated the effectiveness of group motivational interviewing (i.e. a counselling style that stimulates behavioural change by focusing on exploring and resolving ambivalence in a group) by occupational physicians on office employees' sitting time (Coffeng 2014).
Computer prompts
Four studies evaluated the effectiveness of computer prompts combined with information, compared to information alone, for decreasing sitting time in office employees (Donath 2015; Evans 2012; Pedersen 2013; Urda 2016). Computer prompts offer an opportunity to employees to choose and engage in a short 'burst' of physical activity such as standing or walking. One study, Swartz 2014, assessed the effect of hourly prompts (computer‐based and wrist worn) to stand up or to step on reducing sitting time in office employees.
One study, Brakenridge 2016, assessed the effectiveness of activity tracker combined with organisational support compared to organisational support only.
One study, van Berkel 2014, evaluated the effectiveness of mindfulness training in decreasing sitting time in office employees. The mindfulness intervention consisted of homework exercises and information through emails.
4. Multi‐component interventions
Four studies evaluated the effectiveness of combining multiple interventions on sitting at work (Coffeng 2014; Danquah 2017; Ellegast 2012; Healy 2016).
In Coffeng 2014, the effectiveness of combining multiple environmental interventions with Group Motivational Interviewing (GMI) was assessed. The multi‐component environmental intervention consisted of: 1) the Vitality in Practice (VIP) Coffee Corner Zone, where a workplace coffee corner was modified by adding a bar with bar chairs, a large plant, and a giant wall poster (a poster visualizing a relaxing environment, e.g. wood, water, and mountains); 2) the VIP Open Office Zone, where an office was modified by introducing exercise balls and curtains to divide desks in order to reduce background noise; 3) the VIP Meeting Zone, where conference rooms were modified by placing a standing table and a giant wall poster; and 4) the VIP Hall Zone, where table tennis tables were placed and lounge chairs were introduced in the hall for informal meetings. In addition, footsteps were placed on the floor in the entrance hall to promote stair walking.
In Ellegast 2012, the effectiveness of multiple environmental interventions in combination with a walking strategy were assessed. The intervention consisted of measures aiming to change workplace environment (e.g. sit‐stand tables) and behaviour (e.g. using pedometers to provide activity feedback, face‐to‐face motivation for lunch walks, and an incentive system for bicycle commuting or sports activities).
The study by Danquah and colleagues evaluated the effectiveness of a multi‐component intervention comprising of organisational strategies (support from management), environmental strategies (installation of standing meeting tables), and individual strategies (a lecture and email or text messages) (Danquah 2017).
The fourth study evaluated the effectiveness of a multi‐component intervention comprising of organisational strategies (consultation and support from the management), environmental strategies (sit‐stand desk), and individual strategies (coaching and goal setting) (Healy 2016).
Type of control group
No intervention
Twenty‐three included studies used a 'no intervention' control group (Alkhajah 2012; Chau 2014; Chau 2016; Coffeng 2014; Danquah 2017; De Cocker 2016; Dutta 2014; Ellegast 2012; Gao 2015; Gilson 2009; Graves 2015; Healy 2013; Healy 2016; Li 2017; MacEwen 2017; Neuhaus 2014a; Puig‐Ribera 2015; Sandy 2016; Schuna 2014; Tobin 2016; Urda 2016; van Berkel 2014; Verweij 2012).
Other controls
In Carr 2015, a cycle desk in combination with information and counselling was compared with information and counselling only, resulting in the net effect of a cycle desk. In Kress 2014, and Pickens 2016, the effectiveness of standing desks was compared with the effectiveness of sit‐stand desks. Three studies compared computer prompts combined with information with information only, resulting in the net effect of computer prompts (Donath 2015; Evans 2012; Pedersen 2013). In Gordon 2013, the effectiveness of delivering emails concerning general health topics was compared with delivering emails containing psychosocial materials and other available resources based on constructs of the Social Cognitive Theory relating to decreasing sedentary behaviours at work. In Swartz 2014, computer‐based and wrist‐worn prompts, combined with instruction to stand, were compared with the same prompts combined with instruction to walk at least 100 steps. In Priebe 2015, highly personalised information was compared with less personalised information. One study evaluated the effectiveness of short breaks compared to long breaks (Mailey 2016). Another study compared the effectiveness of activity trackers combined with organisational support with organisational support only (Brakenridge 2016).
Outcomes
Total time spent sitting at work
Total time spent sitting at work was used as an outcome variable in 24 studies (Alkhajah 2012; Brakenridge 2016; Chau 2014; Chau 2016; Danquah 2017; De Cocker 2016; Donath 2015; Dutta 2014; Ellegast 2012; Gilson 2009; Gordon 2013; Graves 2015; Healy 2013; Healy 2016; Kress 2014; Li 2017; MacEwen 2017; Neuhaus 2014a; Pedersen 2013; Puig‐Ribera 2015; Sandy 2016; Swartz 2014; Tobin 2016; Urda 2016).
Eight studies reported time spent in occupational sedentary behaviour, which we considered to be equivalent to time spent sitting at work (Carr 2015; Coffeng 2014; Gao 2015; Mailey 2016; Pickens 2016; Schuna 2014; Verweij 2012; van Berkel 2014).
Number of prolonged sitting bouts at work
Three studies reported number of prolonged sitting bouts at work (Evans 2012; Danquah 2017; Swartz 2014).
Total duration of prolonged sitting bouts at work
Six studies reported time spent in prolonged periods of sitting at work (Brakenridge 2016; Danquah 2017; Evans 2012; Healy 2013; Neuhaus 2014a; Priebe 2015).
Total time spent sitting, including sitting at and outside work
Eight studies reported total time spent sitting, including sitting at and outside work (Alkhajah 2012; Brakenridge 2016; De Cocker 2016; Dutta 2014; Ellegast 2012; Healy 2016; MacEwen 2017; Verweij 2012).
Time spent standing and stepping at work
Sixteen studies reported time spent standing at work (Alkhajah 2012; Brakenridge 2016; Chau 2014; Chau 2016; Danquah 2017; De Cocker 2016; Donath 2015; Gao 2015; Graves 2015; Healy 2013; Healy 2016; Li 2017; MacEwen 2017; Neuhaus 2014a; Swartz 2014; Tobin 2016).
Eleven studies reported time spent stepping at work (Alkhajah 2012; Brakenridge 2016; Chau 2014; Chau 2016; Graves 2015; Healy 2013; Healy 2016; Li 2017; Neuhaus 2014a; Swartz 2014; Tobin 2016).
Energy expenditure
Only one study reported estimated energy expenditure based on information about sitting time at work (Pedersen 2013). They used 1.5 METs to represent energy expenditure of sitting and 2.3 METs to represent energy expenditure of quiet standing.
Work productivity
Three studies assessed work performance on a scale from 1 to 10 (Alkhajah 2012; Healy 2013; Neuhaus 2014a). One study, Carr 2015, also reported they had assessed work productivity, but the authors did not report the results.
Two studies assessed work engagement on a scale from 0 to 6 (Coffeng 2014; van Berkel 2014), using the Utrecht Work Engagement Scale, a questionnaire that measures three aspects of engagement: vigour (six items); dedication (five items); and absorption (six items).
One study, Puig‐Ribera 2015, reported the percentage of lost work productivity in terms of Work Limitation Questionnaire Index (WLQ Index) Score. WLQ Index Score is a weighted sum of the scores from the WLQ scales. The Work Limitation Questionnaire consists of 25 items which require employees to rate their level of difficulty to perform 25 specific job demands in the last two weeks. The individual items form four scales: Time management; Physical demands; Mental or Interpersonal, and Output demands scale.
Adverse events
Three studies reported musculoskeletal symptoms by anatomical regions (Alkhajah 2012; Healy 2013; Neuhaus 2014a). Two studies reported musculoskeletal discomfort or pain at three sites: lower back, upper back, and neck and shoulders (Gao 2015; Graves 2015). The first study, Gao 2015, used a scale ranging from 1 (very comfortable) to 5 (very uncomfortable); and in Graves 2015, a scale ranging from 0 (no discomfort) to 10 (extremely uncomfortable) was used. Another study, Carr 2015, also reported having measured musculoskeletal discomfort but they presented no respective data in their article. One study, Danquah 2017, reported musculoskeletal symptoms at all sites on the scale from 0 to 6.
One study measured adverse events as 'one sick day in the last three months' (Alkhajah 2012), whilst two studies used 'more than one sick day in the last month of intervention' (Healy 2013; Neuhaus 2014a).
In Neuhaus 2014a, adverse events were defined as overall body pain.
Follow‐up times
In six studies the longest follow‐up was one month or less (Evans 2012; Healy 2013; Li 2017; Priebe 2015; Swartz 2014; Urda 2016), and in 20 studies the longest follow‐up was between one and three months (Alkhajah 2012; Brakenridge 2016; Chau 2014; Chau 2016; Danquah 2017; De Cocker 2016; Donath 2015; Dutta 2014; Ellegast 2012; Gilson 2009; Gordon 2013; Graves 2015; Healy 2016; Kress 2014; MacEwen 2017; Mailey 2016; Neuhaus 2014a; Pickens 2016; Schuna 2014; Tobin 2016). We categorised all these as short‐term follow‐up.
The remaining eight studies followed participants between three and 12 months (Carr 2015; Coffeng 2014; Gao 2015; Pedersen 2013; Puig‐Ribera 2015; Sandy 2016; van Berkel 2014; Verweij 2012), which we categorised as medium‐term follow‐up.
No studies had a follow‐up longer than 12 months, which we defined as long‐term follow‐up.
Excluded studies
Of the 54 papers we assessed as full‐text, 33 did not meet our inclusion criteria and we summarily excluded them. Thirteen studies were not RCTs or controlled before‐and‐after studies with concurrent controls. Five studies were not conducted in a workplace setting and another 15 studies did not report sitting time at work. See the Characteristics of excluded studies table for further details.
Risk of bias in included studies
Risk of bias varied considerably across the studies (Figure 2).
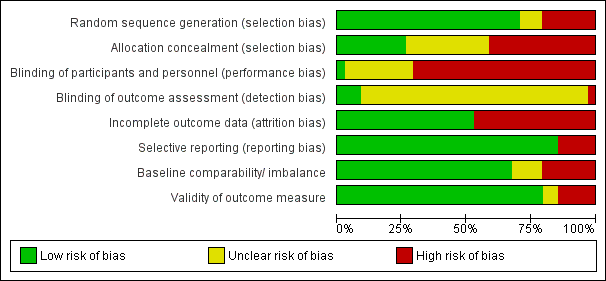
Risk of bias graph: review authors' judgements about each risk of bias item presented as percentages across all included studies.
Allocation
Seven studies, Alkhajah 2012, Chau 2016, Gao 2015, Healy 2013, Kress 2014, Neuhaus 2014a, Pickens 2016, did not randomise participants and we judged these studies to be at high risk of bias for the domain of random sequence generation. Except for De Cocker 2016, Puig‐Ribera 2015, and Tobin 2016, all the studies described the method of randomisation they had used, so we judged them as having a low risk of bias for the domain of sequence generation. Although these studies mentioned in their publication they conducted randomised trials (De Cocker 2016; Puig‐Ribera 2015; Tobin 2016), they did not describe the method of randomisation and so we judged them to have an unclear risk of bias. One study, Donath 2015, used the minimisation method which is considered equivalent to randomisation (Chapter 8 of the Cochrane Handbook for Systematic Reviews of Interventions, Higgins 2011).
Only nine studies reported concealing intervention versus control group allocation, so we judged these studies to be at low risk of bias (Brakenridge 2016; Carr 2015; Danquah 2017; Ellegast 2012; Evans 2012; Li 2017; Mailey 2016; Schuna 2014; Swartz 2014). Eleven studies provided no information on allocation concealment, thus we judged these studies to be at unclear risk of bias (Coffeng 2014; De Cocker 2016; Donath 2015; Gilson 2009; Gordon 2013; MacEwen 2017; Priebe 2015; Puig‐Ribera 2015; Sandy 2016; Tobin 2016; Urda 2016). Allocation was not concealed in the remaining studies (Alkhajah 2012; Chau 2014; Chau 2016; Dutta 2014; Gao 2015; Graves 2015; Healy 2013; Healy 2016; Kress 2014; Neuhaus 2014a; Pedersen 2013; Pickens 2016; van Berkel 2014; Verweij 2012) and thus we judged them to be at high risk of bias.
Blinding
In all but a single study (Verweij 2012), the blinding of participants to the interventions they were receiving was not done due to the nature and aims of interventions being self‐evident, so we judged that these 33 studies had a high risk of bias in the performance bias domain. The single study, Verweij 2012, reported asking randomised occupational physicians not to reveal their allocation to participating employees who were their patients.
With regard to outcome assessment, only three studies reported blinding of outcome assessor to group allocation and thus we judged them to have a low risk of bias (Danquah 2017; Evans 2012; Li 2017). One study, Healy 2013, reported that outcome assessors were not blinded to group allocation and we judged their study to have a high risk of bias. The remaining studies did not report on blinding of outcome assessors and thus we judged them to have an unclear risk of detection bias.
Incomplete outcome data
We judged 16 studies to have a high risk of bias due to incomplete outcome data (Chau 2016; De Cocker 2016; Donath 2015; Dutta 2014; Gao 2015; Gilson 2009; Kress 2014; Li 2017; MacEwen 2017; Mailey 2016; Neuhaus 2014a; Pickens 2016; Priebe 2015; Puig‐Ribera 2015; Swartz 2014; Verweij 2012). One study, Dutta 2014, did not report 14% of working hours; the remaining studies lost more than 10% of participants during the follow‐up period. We judged all the remaining 18 studies to have a low risk of bias for incomplete outcome data because of the following reasons. Three studies, Gordon 2013, Graves 2015, and van Berkel 2014, conducted an intention‐to‐treat analysis. One study, Coffeng 2014, conducted multilevel analysis to account for missing data. Another, Chau 2014, reported that imputing values for missing covariate data did not influence the estimated adjusted effects of the intervention on the outcomes. Three studies, Brakenridge 2016, Danquah 2017, and Healy 2016, reported assessing sensitivity of results by multiple imputation using chained equations. Another three studies, Evans 2012, Healy 2013, and Tobin 2016, lost the same proportion of participants from both the intervention groups and the control groups, so we assumed that the missing data was unlikely to have had a significant impact on outcomes (Cochrane Handbook for Systematic Reviews of Interventions, section 8.13.2,Higgins 2011).
Selective reporting
We judged five studies to have a high risk of bias due to discordance between outcomes in available protocols and the ones reported in study results (De Cocker 2016; Evans 2012; Li 2017; Neuhaus 2014a; Schuna 2014). We judged the remaining 17 studies to have a low risk of bias as they reported results for all the outcome measures mentioned either in the protocol or in the methods section of studies where a protocol was not available (Alkhajah 2012; Chau 2014; Coffeng 2014; Donath 2015; Dutta 2014; Gao 2015; Gilson 2009; Gordon 2013; Healy 2013; Pedersen 2013; Puig‐Ribera 2015; Schuna 2014; Swartz 2014; van Berkel 2014; Verweij 2012).
Other potential sources of bias
This domain had the following two parts of assessment, as decided a priori:
-
validity of outcome measure;
-
baseline comparability or imbalance for age, gender and occupation of study groups.
Eight studies assessed sitting time at work using questionnaires (Coffeng 2014; Gao 2015; Pedersen 2013; Pickens 2016; Priebe 2015; Sandy 2016; Verweij 2012; van Berkel 2014). Questionnaires are cost‐effective and readily accessible to the majority of the population, but participants receiving the intervention might be aware of the goals and the purpose of the intervention and may, therefore, misreport outcomes (Healy 2011). In six studies (Coffeng 2014; Gao 2015; Priebe 2015; Sandy 2016; Verweij 2012; van Berkel 2014), the questionnaire used has not been tested for validity in assessing time spent sitting at work. Two studies, Pedersen 2013, and Pickens 2016 used the Occupational Sitting and Physical Activity Questionnaire (OSPAQ) which has moderate validity for assessing time spent sitting at work (Chau 2012). Another two studies, Gilson 2009, and Puig‐Ribera 2015, assessed sitting time using a paper‐based diary (log book). The validity and reliability of assessing sitting time using log‐books has not been established. However, they are less dependent on long‐term recall and therefore might provide a more accurate measurement of sitting time at work. In any case log data are subject to reporting bias, as it is not possible to determine whether the log has been filled in at the required intervals or if it was, for example, completed in whole on the final day of assessment (Clark 2009). In Graves 2015, sitting time at work was assessed with Ecological Momentary Assessment diaries. This is a valid, reliable, and feasible approach to assess physical activity and sedentary behaviour. The benefit of Ecological Momentary Assessment is its ability to collect data in real‐time and real‐world circumstances; hence there is no recall bias (Marszalek 2014).
Twenty‐three studies assessed sitting time at work with an accelerometer‐inclinometer (Alkhajah 2012; Brakenridge 2016; Carr 2015; Chau 2014; Chau 2016; Danquah 2017; De Cocker 2016; Donath 2015; Dutta 2014; Ellegast 2012; Evans 2012; Gordon 2013; Healy 2013; Healy 2016; Kress 2014; Li 2017; MacEwen 2017; Mailey 2016; Neuhaus 2014a; Schuna 2014; Swartz 2014; Tobin 2016; Urda 2016. Such device‐based measurements also have some limitations, as outcomes may be affected by methodological decisions made before and after the data collection (e.g. type of accelerometer, cut‐off points, and non‐wear time definitions) (Janssen 2015; Pedišić 2015). Self‐reported sedentary time has shown to have low to moderate correlation with accelerometer‐derived sedentary time, with improved validity when specific domains of sedentary time are recalled (e.g. time spent watching television, computer use, sitting at work; Healy 2011). We therefore judged six studies to have a high risk of bias based on validity of outcome measure (Coffeng 2014; Gao 2015; Priebe 2015; Sandy 2016; Verweij 2012; van Berkel 2014).
We judged two studies to have a high risk of other bias. In Alkhajah 2012, participants in the intervention group were academics involved in sedentary behaviour research, whilst participants in the control group had never been involved in sedentary behaviour or physical activity research. In Gao 2015, Gordon 2013, MacEwen 2017, Mailey 2016, and Pickens 2016, a significant difference was reported between the intervention group and the control group in baseline characteristics and thus we judged these studies to have a high risk of bias. Four studies did not report characteristics of participants at baseline and thus we judged them to have an unclear risk of bias (Priebe 2015; Puig‐Ribera 2015; Sandy 2016; Urda 2016). We judged all other studies to have a low risk of other bias, as neither baselines nor outcome validity was questionable.
Overall Risk of Bias
Overall, we judged only three studies to have a low risk of bias (Carr 2015; Danquah 2017; Ellegast 2012). The remaining studies were judged to have a high risk of bias overall based on: inadequate randomisation (Alkhajah 2012; Chau 2016; Gao 2015; Healy 2013; Kress 2014; Neuhaus 2014a; Pickens 2016); allocation concealment (Alkhajah 2012; Chau 2014; Chau 2016; Dutta 2014; Gao 2015; Graves 2015; Healy 2013; Healy 2016; Kress 2014; Neuhaus 2014a; Pedersen 2013; Pickens 2016; van Berkel 2014; Verweij 2012); blinding of outcome assessment (Healy 2013); incomplete outcome data (Chau 2016; De Cocker 2016; Donath 2015; Dutta 2014; Gao 2015; Gilson 2009; Kress 2014; Li 2017; MacEwen 2017; Mailey 2016; Neuhaus 2014a; Pickens 2016; Priebe 2015; Puig‐Ribera 2015; Swartz 2014; Verweij 2012); selective reporting (De Cocker 2016; Evans 2012; Li 2017; Neuhaus 2014a; Schuna 2014); and other bias (Alkhajah 2012; Brakenridge 2016; Coffeng 2014; Gao 2015; Gordon 2013; MacEwen 2017; Mailey 2016; Pickens 2016; Sandy 2016; van Berkel 2014; Verweij 2012). See Figure 3 for a summary of our judgements about each risk of bias item for each included study.
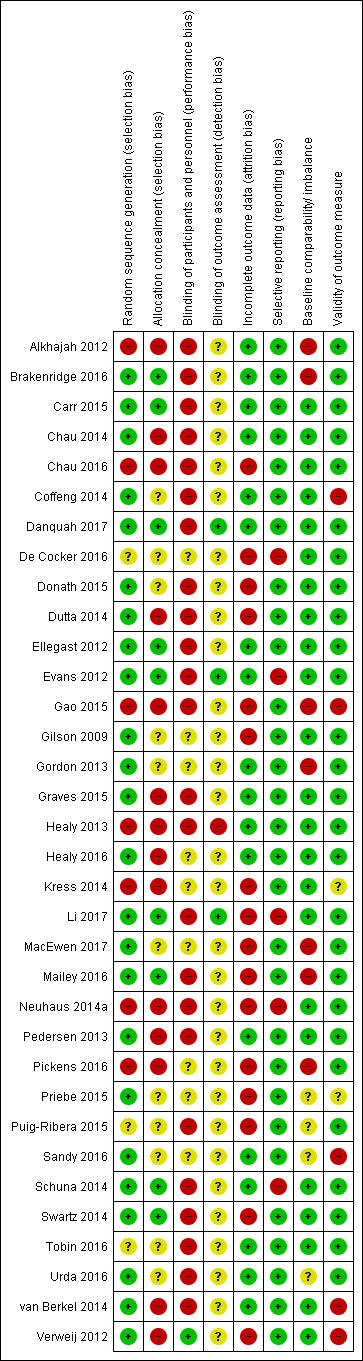
Risk of bias summary: review authors' judgements about each risk of bias item for each included study.
Effects of interventions
See: Summary of findings for the main comparison Alternative desks and workstations compared to sit‐desks for reducing sitting at work; Summary of findings 2 Workplace policy changes compared to no intervention or alternate intervention for reducing sitting at work; Summary of findings 3 Information, feedback, and/or counselling compared to information only or no intervention for reducing sitting at work; Summary of findings 4 Multi‐component intervention compared to no intervention for reducing sitting at work
We present results using only outcomes for which data were available.
Physical changes in the workplace design and environment
Sit‐stand desk with or without information and counselling versus sit‐desk
Outcome: sitting time
Time spent sitting at work: follow‐up at short term
Ten studies compared the effects of using a sit‐stand desk with or without information and counselling to the effects of using a sit‐desk (Chau 2014; Chau 2016; Dutta 2014; Gao 2015; Graves 2015; Healy 2013; Li 2017; MacEwen 2017; Neuhaus 2014a; Tobin 2016). The pooled analysis showed that the sit‐stand desk with or without information and counselling intervention reduced sitting time at work by on average 100 minutes per eight‐hour workday (95% CI −116 to −84, I² = 37%; Analysis 1.1). In a subgroup analysis, there was no difference in effectiveness between sit‐stand desks with information and counselling and sit‐stand desks only in reducing sitting time at work.
In a subgroup analysis including only RCTs, (four studies, Graves 2015; Li 2017; MacEwen 2017; Tobin 2016), a sit‐stand desk with information and counselling reduced sitting time at work on average by 105 minutes (95% CI −128 to −82, I² = 0%; Analysis 1.2). Data presented by one study, Sandy 2016, did not allow for calculation of time spent in sitting time at work and therefore we did not include the study in the quantitative synthesis.
The prediction interval for sitting time ranged from −146 to −54 minutes a day, indicating that in 95% of cases the true effect of a new unique intervention will fall within these values.
Time spent sitting at work: follow‐up at medium‐term
At medium‐term follow‐up, two controlled before‐and‐after studies (Chau 2016; Gao 2015), that provided workers with sit‐stand desks, reduced sitting time at work on average by 57 minutes per eight‐hour workday (95% CI −99 to −15, I² = 0%) compared to sit‐desks (Analysis 1.3).
Total duration of sitting bouts lasting 30 minutes or more: follow‐up at short‐term
Two controlled before‐and‐after studies containing three study arms measured the intervention effect on the total duration of sitting bouts lasting 30 minutes or more (Healy 2013; Neuhaus 2014a).
In Neuhaus 2014a, they compared the effects of using a sit‐stand desk only with a sit‐stand desk combined with counselling and with a sit‐desk. In Healy 2013, they compared a sit‐stand desk combined with counselling with a sit‐desk. The pooled effect estimate combining sit‐stand desk and sit‐stand desk combined with counselling showed a reduction of 53 minutes, on average, per eight‐hour workday (95% CI −79 to −26) in the total duration of sitting bouts lasting 30 minutes or more in the intervention group, with moderate heterogeneity (I² = 45%; Analysis 1.4). Analysis of the subgroup of interventions combining sit‐stand desks with counselling resulted in a mean reduction of 63 minutes per eight‐hour workday (95% CI −93 to −34), with moderate heterogeneity (I² = 31%; Analysis 1.4).
Total time spent sitting, including sitting at and outside work: follow‐up at short‐term
The pooled analysis of two studies (Alkhajah 2012; MacEwen 2017), which compared the effects of sit‐stand desks and sit‐desks on total sitting time, including sitting at work and outside work, at short‐term follow‐up showed a reduction of 82 minutes, on average, per day (95% CI −124 to −39, I² = 0%; Analysis 1.5).
Outcome: standing and stepping time
Time spent standing at work: follow‐up at short‐term
Nine studies reported time spent standing at work at short‐term follow‐up (Alkhajah 2012; Chau 2014; Chau 2016; Graves 2015; Healy 2013; Li 2017; MacEwen 2017; Neuhaus 2014a; Tobin 2016). The pooled analysis showed that sit‐stand desks with or without information and counselling increased standing time at work on average by 89 minutes per eight‐hour workday (95% CI 76 to 102, I² = 58%; Analysis 1.6). However, in a subgroup analysis, sit‐stand desks combined with information and counselling were more effective in increasing standing time at work than sit‐stand desks only (test for subgroup differences: Chi² = 4.31, df = 1 (P = 0.04), I² = 76.8%). Sit‐stand desks only increased standing time at work on average by 76 minutes per eight‐hour workday (95% CI 58 to 94), but there was substantial heterogeneity (I² = 78%) in effect sizes. Sit‐stand desks combined with information and counselling increased standing time at work on average by 103 minutes per eight‐hour workday (95% CI 85 to 122, I² = 0%; Analysis 1.6.2).
In a sensitivity analysis, including only RCTs (four studies, Graves 2015; Li 2017; MacEwen 2017; Tobin 2016), a sit‐stand desk combined with information and counselling increased standing at work on average by 99 minutes per eight‐hour workday (95% CI 75 to 122, I² = 0%; Analysis 1.7).
Time spent stepping at work: follow‐up at short‐term
In the pooled analysis of eight studies (Alkhajah 2012; Chau 2014; Chau 2016; Graves 2015; Healy 2013; Li 2017; Neuhaus 2014a; Tobin 2016), we found no significant difference between the effects of sit‐stand desks and sit‐desks on time spent stepping at work at short‐term follow‐up (MD −1 minute per eight hour workday, 95% CI −4 to 3, I² = 0%; Analysis 1.8).
Time spent standing at work: follow‐up at medium‐term
At medium‐term follow‐up, two controlled before‐and‐after studies (Chau 2016; Gao 2015), found that providing workers with sit‐stand desks increased standing time at work on average by 53 minutes per eight‐hour workday (95% CI 17 to 90, I² = 0%) compared to sit‐desks (Analysis 1.9).
Outcome: work performance
Self‐reported work performance: follow‐up at short‐term
In three studies (Alkhajah 2012; Healy 2013; Neuhaus 2014a), interventions with sit‐stand desks produced a non‐significant pooled effect on work performance (on a scale from 1 to 10; MD 0.35 score points; 95% CI −0.1 to 0.8; Analysis 1.10). In these studies, work performance was assessed with a 10‐item scale ranging from 1 to 10 relating to the past week, with higher values on the scale indicating better performance.
Number of sick days: follow‐up at short‐term
One study found no significant change in the proportion of employees having more than one sick day in the sit‐stand desk group compared to sit‐desk in the three months following the installation of sit‐stand desks (risk ratio (RR) 2.2, 95% CI 0.9 to 5.2; Analysis 1.11; Alkhajah 2012).
Two studies assessed the proportion of people with more than one sick day in the last month at three months follow‐up (Healy 2013; Neuhaus 2014a). We found no significant pooled effect of the introduction of sit‐stand desks on the risk of having more than one sick day in the last month (RR 0.8, 95% CI 0.5 to 1.2). Accordingly, we found no significant effects for interventions that included information and counselling along with a sit‐stand desk (RR 0.7, 95% CI 0.4 to 1.2) and for those that included sit‐stand desks only (RR 0.9, 95% CI 0.4 to 2.1; Analysis 1.12).
Outcome: adverse events
Overall body pain
In one controlled before‐and‐after study, Neuhaus 2014a, one out of 13 participants in the sit‐stand desk group withdrew from the trial because of overall body pain.
Musculoskeletal symptoms: follow‐up at short‐term
Three studies, Alkhajah 2012, Healy 2013, and Neuhaus 2014a, reported musculoskeletal symptoms, assessed using questions with a binary response scale (yes/no), by anatomic regions. We did not combine their results in a meta‐analysis because of substantial heterogeneity in the results (I² = 98%).
Two studies found a lower prevalence of musculoskeletal symptoms among participants using sit‐stand desks compared to those using sit‐desks at three months follow‐up (Alkhajah 2012; Neuhaus 2014a). In the study by Neuhaus 2014a, the magnitude of the effect was significantly larger (MD −16.5, 95% CI −17.8 to −15.3) than in the study by Alkhajah 2012 (MD −6, 95% CI −6.9 to −5.1).
In Healy 2013, a significant but relatively small increase was found in the percentage of participants with musculoskeletal symptoms in the sit‐stand desk combined with counselling group (MD 4, 95% CI 2.6 to 5.5), while in Neuhaus 2014a, a slight decrease was found in the percentage of participants with musculoskeletal symptoms (MD −11.5, 95% CI −12.6 to −10.5) in the sit‐stand desk combined with counselling group compared to the sit‐desk group at three‐month follow‐up.
In Graves 2015, a non‐significant change was found in the ratings of musculoskeletal discomfort by participants using sit‐stand desks compared to participants using sit‐desk at short‐term follow‐up (MD −0.5, 95% CI −1 to 0; Analysis 1.13). Participants rated musculoskeletal discomfort or pain at three sites (lower back, upper back, and neck and shoulders) on a Likert scale ranging from 0 (no discomfort) to 10 (extremely uncomfortable).
Musculoskeletal symptoms: follow‐up at medium‐term
One study, Gao 2015, assessed perceived musculoskeletal comfort for different body parts (neck and shoulders, upper limbs, back, and lower limbs) rated at the end of a normal workday on a scale from 1 (very comfortable) to 5 (very uncomfortable). The study found a significant but relatively small change in musculoskeletal symptoms with a sit‐stand desk compared to a sit‐desk at six‐month follow‐up (MD −0.5, 95% CI −0.9 to −0.2; Analysis 1.14).
Standing desk versus sit‐stand desk
Outcome: sitting time
Time spent sitting at work
One controlled before‐and‐after study, Kress 2014, found that using a standing desk reduced sitting time at work in their sample on average by 10 minutes per eight‐hour workday (95% CI −62 to 43) at short‐term follow‐up (Analysis 2.1) and by 19 minutes per eight‐hour workday (95% CI −64 to 26) at medium‐term follow‐up, but these effects were not statistically significant (Analysis 2.2). Data presented by another study, Pickens 2016, did not allow for calculation of time spent sitting at work and the study was therefore not included in the quantitative synthesis.
Active workstation versus sit‐desk
Outcome: sitting time
Time spent sitting at work: follow‐up at short‐term
Treadmill desk combined with counselling versus sit‐desk
One RCT, Schuna 2014, found that a treadmill desk combined with counselling reduced sitting time at work by 29 minutes on average per eight‐hour workday (95% CI −55 to −2) compared to no intervention at short‐term follow‐up (Analysis 3.1).
Time spent in inactive sitting at work: follow‐up at medium‐term
Cycling desks + information and counselling versus information and counselling only
One RCT, Carr 2015, found a non‐significant decrease in inactive sitting at work (MD −12 minutes per day, 95% CI −24 to 1) with a cycling desk combined with information and counselling compared to information and counselling only at medium‐term follow‐up (Analysis 3.2).
Outcome: work productivity
One RCT, Carr 2015, found no significant change in musculoskeletal discomfort over the past seven days and work productivity with a cycling desk combined with information and counselling compared to information and counselling only at medium‐term follow‐up. The study did not report any quantitative data for these outcomes.
Policies to change organisation of work
Walking strategies versus no intervention
Outcome: sitting time
Time spent sitting at work: follow‐up at short‐term
A three‐armed RCT, Gilson 2009, found a non‐significant decrease in mean sitting time at work per day (MD −15 minutes per day, 95% CI −50 to 19) in route and incidental walking groups compared to a control group (Analysis 4.1).
Time spent sitting at work: follow‐up at medium‐term
A cluster‐RCT, Puig‐Ribera 2015, found a non‐significant decrease in sitting time at work (MD −17 minutes per day, 95% Cl −61 to 28) following a web‐based intervention encouraging incidental walking and short walks during the working day compared to a control group at 21‐week follow‐up (Analysis 4.2).
Outcome: work productivity
Percentage of lost work productivity: follow‐up at medium‐term
One cluster‐RCT, Puig‐Ribera 2015, found walking strategies resulted in an average decrease in Work Limitation Questionnaire Index Score of −2.6% (95% CI −4 to −1.3) when compared to no intervention (Analysis 4.3).
Short break versus long break
Time spent sitting at work: follow‐up at short‐term
One RCT, Mailey 2016, reported that short breaks reduced time spent sitting at work by 40 minutes per eight‐hour workday (95% CI −66 to −15) when compared to long breaks at short‐term follow‐up (Analysis 5.1).
Information and counselling
Information, counselling, and feedback versus no intervention
Outcome: sitting time
Time spent sitting at work: follow‐up at short‐term
Two RCTs compared the effects of information and feedback to no intervention on time spent sitting a work at short‐term follow‐up (De Cocker 2016; Gordon 2013). The pooled effect size for information, feedback, reminder, or all of the above was not significantly different from no intervention (MD −19 minutes per eight‐hour workday, 95% CI −57 to 19, I² = 0%; Analysis 6.1).
Time spent sitting at work: follow‐up at medium‐term
The pooled analysis of two RCTs comparing counselling to no intervention, Coffeng 2014, and Verweij 2012, showed that counselling reduced sitting time at work on average by 28 minutes per eight‐hour workday (95% CI −51 to −5; I² =0%; Analysis 6.2).
Total time spent sitting, including sitting at and outside work: follow‐up at short‐term
One RCT, De Cocker 2016 found a non‐significant decrease in total time spent sitting with information and feedback compared to no intervention at short‐term follow‐up (MD −16 minutes per day, 95% CI −97 to 64; Analysis 6.3).
Total time spent sitting, including sitting at and outside work: follow‐up at medium‐term
One RCT, Verweij 2012, found a non‐significant decrease in total sitting time with guideline‐based counselling by an occupational physician compared to usual care by an occupational physician (MD −20 minutes per day, 95% CI −85 to 45; Analysis 6.4).
Outcome: standing time at work
Time spent standing at work: follow‐up at short‐term
One RCT, De Cocker 2016, found a non‐significant effect of information and feedback compared to no intervention on time spent standing at work at short‐term follow‐up (MD 10 minutes per eight‐hour workday, 95% CI −17 to 38; Analysis 6.5).
Outcome: work engagement
One RCT, Coffeng 2014, found a non‐significant difference in work engagement (MD 0.1 score points, 95% CI −0.1 to 0.3; on a scale of 0 to 6) at medium‐term follow‐up (Analysis 6.6).
Prompts combined with information versus information alone
Outcome: sitting time
Time spent sitting at work: follow‐up at short‐term
Two RCTs compared the effects of computer prompts combined with information to information only on time spent sitting at work (Donath 2015; Urda 2016). The pooled effect size for the computer prompts combined with information compared to information alone was not significant (−10 minutes per eight‐hour workday, 95% CI −45 to 24; I² =0%) (Analysis 7.1).
Time spent sitting at work: follow‐up at medium‐term
One RCT, Pedersen 2013, reported a mean decrease in sitting time at work of 55 minutes per eight‐hour workday (95% CI −96 to −14) when computer prompting combined with information was compared to information alone (Analysis 7.2).
Number of sitting bouts lasting 30 minutes or more: follow‐up at short‐term
One RCT, Evans 2012, found a significant but small decrease of on average 1.1 sitting bouts lasting 30 minutes or more per day (95% CI −1.9 to −0.3) when computer prompting combined with information was compared to information alone (Analysis 7.3).
Total duration of sitting bouts lasting 30 minutes or more: follow‐up at short‐term
One RCT, Evans 2012, also found a reduction of on average 74 minutes per day in the total duration of sitting bouts lasting 30 minutes or more (95% CI −124 to −24) when computer prompts combined with information was compared to information alone (Analysis 7.4).
Total time spent sitting, including sitting at and outside work: follow‐up at short‐term
One RCT, Evans 2012, found a non‐significant decrease in total time spent sitting, including sitting at and outside work, with information and feedback compared to no intervention at short‐term follow‐up (MD −18 minutes per day, 95% CI −53 to 17) (Analysis 7.5).
Outcome: standing time at work
Time spent standing at work: follow‐up at short‐term
One RCT, Donath 2015, found a non‐significant increase in time spent standing at work with information and feedback compared to no intervention at short‐term follow‐up (MD 32 minutes per eight‐hour workday, 95% CI −7 to 72; Analysis 7.6).
Outcome: energy expenditure at workplace
Calories: follow‐up at medium‐term
One RCT, Pedersen 2013, found a non‐significant difference between the effects of an intervention using computer prompts combined with information and computer prompts alone on estimated energy expenditure at the workplace based on reported activities (MD −278 kilocalories per workday, 95% CI −556 to 0.01; Analysis 7.7).
Computer prompts with instruction to walk 100 steps versus computer prompts with instruction to stand
Outcome: sitting time
Time spent sitting at work: follow‐up at short‐term
One RCT, Swartz 2014, found that employees who received computer prompts to step, sat on average 14 minutes per eight‐hour workday more (95% CI 10 to 19) than employees who received computer prompts to stand (Analysis 8.1).
Number of sitting bouts lasting 30 minutes or more: follow‐up at short‐term
In the same study, Swartz 2014, the number of sitting events lasting 30 minutes or more was on average 0.4 (95% CI 0.3 to 0.5) higher among the employees in the step group than among the employees in the stand group (Analysis 8.2).
Outcome: standing and stepping time
Time spent standing and stepping at work: follow‐up at short‐term
One RCT, Swartz 2014, found that employees who received computer prompts to step stood on average 12 minutes less (95% CI −15 to −8; Analysis 8.3) and stepped on average 7 minutes more (95% CI 5 to 8; Analysis 8.4) compared to employees who received computer prompts to stand.
Highly personalised information versus less personalised information
Total duration of sitting bouts lasting 30 minutes or more: follow‐up at short‐term
One RCT, Priebe 2015, found a non‐significant increase in the total duration of sitting bouts lasting 30 minutes or more at short‐term follow‐up (MD 14 minutes per eight‐hour workday, 95% CI −37 to 65; Analysis 9.1).
Mindfulness training versus no intervention
Outcome: sitting time
Time spent sitting at work: follow‐up at medium‐term
One RCT, van Berkel 2014, found a non‐significant reduction in sitting time at work with mindfulness training compared to no intervention at medium‐term follow‐up (MD −23 minutes per day, 95% CI −63 to 17; Analysis 10.1).
Outcome: work engagement
One study, van Berkel 2014, reported no significant difference in work engagement (on a scale of 0 to 6) at medium‐term follow‐up (0.2 score points; 95% CI −0.1 to 0.5; Analysis 10.2). The authors assessed work engagement using the Utrecht Work Engagement Scale, which is a self‐reported questionnaire that measures three aspects of engagement: vigour, dedication and absorption.
Activity tracker combined with organisational support versus organisational support only
Time spent sitting at work: follow‐up at short‐term
One RCT, Brakenridge 2016, found a non‐significant difference in the effectiveness of an activity tracker combined with organisational support and organisational support only in reducing time spent sitting at work at short‐term follow‐up (MD −6.60 minutes per eight‐hour workday, 95% CI −35 to 22; Analysis 11.1).
Time spent sitting at work: follow‐up at medium‐term
One RCT, Brakenridge 2016, found a non‐significant difference in the effectiveness of an activity tracker combined with organisational support and organisational support only in reducing time spent sitting at work at medium‐term follow‐up (MD −4.40 minutes per eight‐hour workday, 95% CI −33 to 42; Analysis 11.2).
Total duration of sitting bouts lasting 30 minutes or more: follow‐up at short‐term
One RCT, Brakenridge 2016, found a non‐significant increase in the duration of sitting bouts lasting 30 minutes or more at short‐term follow‐up with an activity tracker combined with organisational support compared to organisational support only (MD 11 minutes per eight‐hour workday, 95% CI −28 to 50; Analysis 11.3).
Total duration of sitting bouts lasting 30 minutes or more: follow‐up at medium‐term
One RCT, Brakenridge 2016, found a non‐significant difference in the effectiveness of an activity tracker combined with organisational support and organisational support only in reducing duration of sitting bouts lasting 30 minutes or more at medium‐term follow‐up (MD −1 minute per eight‐hour workday, 95% CI −51 to 48; Analysis 11.4).
Total time spent sitting, including sitting at and outside work: follow‐up at short‐term
One RCT, Brakenridge 2016, found a non‐significant difference in the effectiveness of an activity tracker combined with organisational support and organisational support only in reducing total time spent sitting, including sitting at and outside work, at short‐term follow‐up (MD 2 minutes per eight‐hour workday, 95% CI −42 to 46; Analysis 11.5).
Total time spent sitting, including sitting at and outside work: follow‐up at medium‐term
One RCT, Brakenridge 2016, found a non‐significant decrease in total time spent sitting, including sitting at and outside work, at medium‐term follow‐up with an activity tracker combined with organisational support compared to organisational support only (MD −8 minutes per eight‐hour workday, 95% CI −57 to 40; Analysis 11.6).
Outcome: standing and stepping time
Time spent standing and stepping at work: follow‐up at short‐term
One RCT, Brakenridge 2016, found a non‐significant change in time spent standing (MD 3 minutes per eight‐hour workday, 95% CI −20 to 26 minutes per eight‐hour workday; Analysis 11.7) and stepping at work (MD 4 minutes per eight‐hour workday, 95% CI −6 to 14 minutes per eight‐hour workday; Analysis 11.8) with an activity tracker combined with organisational support compared to organisational support only at short‐term follow‐up.
Time spent standing and stepping at work: follow‐up at medium‐term
One RCT, Brakenridge 2016, found a non‐significant change in time spent standing (MD −12 minutes per eight‐hour workday, 95% CI −45 to 20 minutes per eight‐hour workday; Analysis 11.9) and stepping at work (MD 8 minutes per eight‐hour workday, 95% CI −4 to 19 minutes per eight‐hour workday; Analysis 11.10) with an activity tracker combined with organisational support compared to organisational support only at medium‐term follow‐up.
Multi‐component intervention versus no intervention
Outcome: sitting time
Time spent sitting at work: follow‐up at short‐term
Three RCTs reported effects on time spent sitting at work at short‐term follow‐up (Ellegast 2012; Danquah 2017; Healy 2016). The pooled analysis of two studies (Ellegast 2012; Healy 2016), showed a significant reduction of on average 101 minutes per eight‐hour workday (95% CI −117.27 to −84, I² =0%; Analysis 12.1) in time spent sitting at work at short‐term follow‐up. However, the third study, Danquah 2017, reported a much smaller reduction in sitting of on average 48 minutes per eight‐hour workday (95% CI −62 to −34). Therefore, we did not pool this study with the other two studies comparing the effect of multi‐component intervention versus no intervention, due to substantial heterogeneity (I² = 92%).
Time spent sitting at work: follow‐up at medium‐term
The pooled analysis of two RCTs (Coffeng 2014; Healy 2016), showed a significant decrease of on average 46 minutes per eight‐hour workday in workplace sitting (95% CI −63 to −29, I² = 0%) following multi‐component intervention compared to no intervention at medium‐term follow‐up (Analysis 12.2).
Number of sitting bouts lasting 30 minutes or more: follow‐up at short‐term
One RCT, Danquah 2017, found a small decrease in the number of sitting bouts lasting 30 minutes or more with multi‐component intervention compared to no intervention at short‐term follow‐up (MD −0.4 bouts per day, 95% CI −0.7 to −0.12; Analysis 12.3).
Total duration of sitting bouts lasting 30 minutes or more: follow‐up at short‐term
One RCT, Healy 2016, found a decrease of 73 minutes, on average, per eight‐hour workday (95% CI −94 to −51) in the total duration of sitting bouts lasting 30 minutes or more following multi‐component intervention compared to no intervention at short‐term follow‐up. However, in the study by Danquah 2017, a much smaller decrease was found in the total duration of sitting bouts lasting 30 minutes or more of on average 16 minutes per eight‐hour workday (95% CI −31 to −1) following multi‐component intervention. Therefore, we did not pool the results of these two studies due to substantial heterogeneity (Analysis 12.4, I² = 95%).
Total duration of sitting bouts lasting 30 minutes or more: follow‐up at medium‐term
One RCT, Healy 2016, reported a non‐significant decrease of on average 18 minutes per eight‐hour workday (95% CI −46 to 10) in the total duration of sitting bouts lasting 30 minutes or more at medium‐term follow‐up (Analysis 12.5).
Total time spent sitting, including sitting at and outside work: follow‐up at short‐term
Two RCTs reported total time spent sitting, including sitting at and outside work, at short‐term follow‐up (Ellegast 2012; Healy 2016). The pooled analysis showed a significant reduction of on average 73 minutes per day (95% CI −92 to −54) in total time spent sitting, including sitting at and outside work with multi‐component intervention compared to no intervention (Analysis 12.6).
Total time spent sitting, including sitting at and outside work: follow‐up at medium‐term
One RCT, Healy 2016, reported a reduction of on average 36 minutes per day (95% CI −62 to −11) in total time spent sitting, including sitting at and outside work, at medium‐term follow‐up (Analysis 12.7).
Outcome: standing and stepping time
Time spent standing and stepping at work: follow‐up at short‐term
Two RCTs reported effects on time spent standing at work at short‐term follow‐up (Danquah 2017; Healy 2016). In Healy 2016, an increase was reported of on average 95 minutes per eight‐hour workday (95% CI 79 to 112) in time spent standing at work with multi‐component intervention compared to no intervention (Analysis 12.8). Danquah 2017, however, reported a significantly smaller increase of 43 minutes, on average, per eight‐hour workday (95% CI 30 to 56; Analysis 12.8). We did not pool the results of these two studies due to high heterogeneity (I ² = 96%).
One RCT, Healy 2016, found no significant change in time spent stepping at work (MD 1 minute per eight‐hour workday, 95% CI −4 to 5; Analysis 12.9) following multi‐component intervention compared to no intervention at short‐term follow‐up.
Time spent standing and stepping at work: follow‐up at medium‐term
One RCT, Healy 2016, reported an average increase of 43 minutes per eight‐hour workday (95% CI 26 to 60; Analysis 12.10) in standing time, whilst they found no significant change in stepping time at work (MD 0 minutes per eight‐hour workday, 95% CI −5 to 4; Analysis 12.11) at medium‐term follow‐up.
Outcome: work engagement
Work engagement: follow‐up at medium‐term
One study, Coffeng 2014, reported no change in work engagement scale score (MD 0 points, 95% CI −0.1 to 0.1, on a scale from 0 to 6) following multi‐component intervention compared to no intervention at medium‐term follow‐up (Analysis 12.12).
Outcome: adverse events
Musculoskeletal symptoms: follow‐up at short‐term
One study, Danquah 2017, reported no change in musculoskeletal symptom score (MD −0.2 points, 95% CI −0.32 to −0.02, on a scale from 0 to 6) following multi‐component intervention compared to no intervention at short‐term follow‐up (Analysis 12.13).
Discusión
Resumen de los resultados principales
Se identificaron 34 estudios que evaluaron intervenciones para reducir la sedestación en el trabajo. Estos estudios investigaron los cambios físicos en el lugar de trabajo en cuanto al diseño y el ambiente del lugar de trabajo, los cambios de política en el lugar de trabajo, la información y el asesoramiento, y las intervenciones con múltiples componentes para la reducción de la sedestación en el trabajo.
Cambios físicos en el lugar de trabajo
Según diez estudios, proporcionarles a los trabajadores escritorios que permiten estar sentados y de pie, solos o en combinación con información y asesoramiento, reduce la sedestación en el lugar de trabajo a corto plazo en 100 minutos por día laboral de ocho horas como promedio (IC del 95%: −116 a −84, evidencia de baja calidad) en comparación con los escritorios que permiten estar sentados. Este hallazgo muestra que las intervenciones con escritorios que permiten estar sentados y de pie pueden contribuir a lograr las dos a cuatro horas de pie en el trabajo que promueve un grupo de expertos, a corto plazo (Buckley 2015). El intervalo de predicción para el tiempo de sedestación en el trabajo a partir de las intervenciones que compararon los escritorios que permiten estar sentados y de pie con los escritorios que permiten estar sentados varía de −146 a −54, lo que indica que en el 95% de los casos el efecto de una única nueva intervención estará dentro de estos valores. Es importante conocer qué actividad reemplazó la sedestación cuando se implementó la intervención. La intervención con escritorios que permiten estar sentados y de pie parece reemplazar la sedestación principalmente con la posición de pie en el seguimiento a corto plazo (DM 89 minutos; IC del 95%: 76 a 102). La efectividad de los escritorios que permiten estar sentados y de pie parece disminuir con la duración del seguimiento; dos estudios muestran una reducción de 57 minutos por día como promedio (IC del 95%: −99 a −15) en el seguimiento a plazo medio. En dos estudios que tuvieron un seguimiento a corto plazo, la provisión de escritorios que permiten estar sentados y de pie a los trabajadores redujo la cantidad total de tiempo de los episodios de sedestación prolongada en 53 minutos por día (IC del 95%: −79 a −26, evidencia de muy baja calidad). De manera similar, el tiempo total de sedestación (incluida la sedestación en y fuera del trabajo) también se redujo en el seguimiento a corto plazo 82 minutos por día como promedio (IC del 95%: −124 a −39, dos estudios). Un único estudio encontró una diferencia no significativa entre los escritorios que permiten estar de pie y los escritorios que permiten estar sentados y de pie en cuanto a los efectos sobre la reducción de la cantidad total de tiempo en episodios de sedestación prolongada. Los efectos sobre el tiempo de sedestación de los lugares de trabajo activos, como los escritorios con cinta rodante o los escritorios con pedaleo, fueron poco claros o inconsistentes.
Políticas para cambiar la organización del trabajo
Un estudio mostró que la implementación de estrategias para caminar no tuvo un efecto significativo sobre el tiempo de sedestación en el lugar de trabajo en el seguimiento a corto plazo (DM −15 minutos por día; IC del 95%: −50 a 19, evidencia de baja calidad) y a plazo medio (DM −17 minutos por día; IC del 95%: −61 a 28). Además, un estudio único encontró que las interrupciones cortas (uno a dos minutos cada media hora) redujeron el tiempo de sedestación en el trabajo en 40 minutos por día como promedio (IC del 95%: 66 a 15, evidencia de baja calidad) más que las interrupciones largas (dos interrupciones de 15 minutos por día de trabajo) en el seguimiento a corto plazo.
Información y asesoramiento psicológico
El tamaño agrupado del efecto de dos estudios que evaluaron la provisión de información y la retroalimentación encontró una reducción no significativa del tiempo de sedestación en el trabajo en el seguimiento a corto plazo (DM −19 minutos por día; IC del 95%: −57 a 19, evidencia de baja calidad). Un análisis agrupado de dos estudios que compararon el asesoramiento con ninguna intervención mostró una reducción significativa del tiempo de sedestación en el trabajo en el seguimiento a plazo medio (DM −28 minutos por día; IC del 95%: −51 a −5, evidencia de baja calidad). Los avisos electrónicos dieron lugar a una reducción no significativa del tiempo de sedestación en el trabajo a corto plazo (DM −10 minutos por día; IC del 95%: −45 a 24, dos estudios, evidencia de baja calidad). Sin embargo, su efecto en el seguimiento a plazo medio fue significativo (DM −55 minutos por día; IC del 95%: −96 a −15, un estudio). Además, los avisos electrónicos dieron lugar a una disminución significativa en el número (−1,1; IC del 95%: −1,9 a −0,3; un estudio) y la duración (DM −74 minutos por día; IC del 95%: −124 a −24) promedio de los episodios de sedestación que duraron 30 minutos o más. Un único estudio encontró que, a corto plazo, los empleados que recibieron avisos informáticos para caminar, permanecieron sentados como promedio 14 minutos más por día de trabajo de ocho horas (IC del 95%: 10 a 19) que los empleados que recibieron avisos informáticos para ponerse de pie. Un estudio no encontró efectos beneficiosos adicionales significativos con la provisión de información muy personalizada en comparación con la información menos personalizada en cuanto a la reducción del tiempo de sedestación en el trabajo. Un único estudio no encontró un cambio significativo en el tiempo de sedestación en el lugar de trabajo en el seguimiento a plazo medio con el entrenamiento de conciencia plena (DM −16 minutos; IC del 95%: −45 a 12, evidencia de baja calidad). De manera similar, un único estudio no encontró efectos significativos de rastrear la actividad sobre la reducción de la sedestación en el trabajo a corto y medio plazo.
Intervenciones en categorías múltiples
Las intervenciones con múltiples componentes que consistieron en cambios físicos en el lugar de trabajo, cambios de políticas en el lugar de trabajo y componentes informativos dieron lugar a reducciones significativas del tiempo de sedestación en el trabajo (tres estudios, evidencia de muy baja calidad) y el tiempo de los episodios de sedestación prolongados (dos estudios, evidencia de muy baja calidad) a corto plazo. Sin embargo, hubo heterogeneidad significativa en los tamaños del efecto entre los diferentes estudios. En el seguimiento a medio plazo, los efectos agrupados de dos estudios mostraron una reducción de 46 minutos por día laboral de ocho horas como promedio (IC del 95%: −63 a −29) con la intervención con múltiples componentes.
Compleción y aplicabilidad general de las pruebas
En total se incluyeron 34 estudios que evaluaron diversas clases de intervenciones para la reducción del tiempo de sedestación en el trabajo. La mayoría de los estudios evaluaron la efectividad de los escritorios que permiten estar sentados y de pie y los resultados de la presente revisión tratan en gran parte esta intervención concreta. No hay ECA ni estudios controlados tipo antes y después que hayan evaluado específicamente los efectos de las reuniones de pie o caminando para reducir la sedestación en el trabajo.
Los estudios incluidos son todos de Australia, Europa, Canadá y EE. UU. No se encontraron estudios de otros países o continentes. Ninguno de los estudios incluidos se realizó en países de ingresos bajos y medios. Lo anterior limita potencialmente la generalizabilidad de los resultados de esta revisión más allá de los contextos en los que se han realizado los estudios incluidos. Lo anterior se debe en parte a que los ámbitos y las guías laborales varían enormemente en todo el mundo y, por lo tanto, la aceptabilidad y la factibilidad de las intervenciones en el puesto de trabajo que son relevantes para la sedestación laboral pueden diferir. Debido a que la obesidad y otras enfermedades relacionadas con el estilo de vida son frecuentes en los países de ingresos altos, no es sorprendente que la mayoría de los estudios sean de dichos países. Sin embargo, como estas enfermedades se hacen cada vez más prevalentes en otros países, por ejemplo, en algunas partes de Asia (Tan 2011; Wang 2011), sería importante probar la efectividad de estas intervenciones entre los empleados de oficina en un rango más diverso de países.
Casi todos los estudios incluidos en esta revisión Cochrane han realizado solamente un seguimiento a corto plazo. No hay estudios con un período de seguimiento superior a un año. Es importante demostrar que el cambio del comportamiento de la sedestación a un comportamiento más activo es sostenible a largo plazo. El costo de las intervenciones, como la implementación de escritorios que permiten estar sentados y de pie, puede ser considerable; pero si los efectos se pueden mantener a largo plazo, es más probable que los posibles efectos beneficiosos superen los costos.
La población de participantes en los estudios incluidos consistió en trabajadores de oficina de instituciones académicas, una agencia gubernamental, una organización policial y organizaciones privadas. Se considera que globalmene la población es en gran parte representativa de los trabajadores de oficina que pasan una gran parte de su tiempo sentados y que necesitan intervenciones para reducir el tiempo de sedestación en el lugar de trabajo.
Aunque las intervenciones centradas en los individuos, como los escritorios que permiten estar sentados y de pie, parecen ser muy populares, son considerablemente más costosas que los escritorios estándar, por lo que su uso puede no ser factible en muchos lugares de trabajo con recursos financieros limitados. En algunos sitios, las reuniones de pie pueden ser una alternativa de bajo costo para la reducción del tiempo de sedestación en el trabajo (Atkinson 2014). Los carteles o avisos motivacionales para ponerse de pie o realizar actividad física de intensidad leve a moderada, o colocar las impresoras o los cestos de basura lejos de los escritorios también podrían ser intervenciones factibles de bajo costo para poblaciones más grandes de empleados. Hay cierta evidencia disponible de beneficios para la salud de la interrupción del tiempo de sedestación por intervalos breves e intermitentes de actividad física de intensidad leve o moderada (Bailey 2015; Larsen 2014), pero por ahora no es posible establecer una conclusión definitiva acerca de la aplicabilidad de dichos resultados a los lugares de trabajo. Es necesario evaluar la efectividad de intervenciones de bajo costo que les permitirían a los trabajadores interrumpir el tiempo de sedestación al involucrarse en episodios breves de actividad física. Solo algunos de los estudios incluidos evaluaron resultados como ponerse de pie o dar pasos para identificar en que se reasignó el tiempo de sedestación. Sería importante evaluar este dato en los estudios futuros, ya que la reasignación del tiempo de sedestación en el trabajo a caminar u otras actividades físicas sería potencialmente un sustituto más saludable que la reasignación a estar de pie.
Calidad de la evidencia
Aunque 26 de los 34 estudios incluidos en esta revisión Cochrane fueron ECA o ECA grupales, se consideró que la mayoría tuvo alto riesgo de sesgo, por lo que la calidad de la evidencia que producen es baja a muy baja. Con intervenciones complejas en el contexto de salud ocupacional, se sabe que la asignación aleatoria y la ocultación son más difíciles que en los ensayos clínicos. No obstante, nueve de los estudios incluidos lo lograron. A menos que el tamaño de la muestra sea suficientemente grande, la asignación aleatoria no distribuye los factores de confusión potenciales por igual a través de los grupos; por lo tanto, la asignación al azar no es muy efectiva en los estudios tan pequeños como los incluidos en la presente revisión. Además, la naturaleza evidente de las intervenciones hace muy difícil el cegamiento del personal y los participantes.
El riesgo de sesgo de las mediciones del tiempo de sedestación con dispositivos mediante acelerómetro‐inclinómetro es diferente del tiempo de sedestación informado por el participante. Los participantes pueden estar al tanto de los objetivos de la intervención y sobrestimar o subestimar el tiempo de sedestación, si se evalúa con el informe del propio participante. El uso de acelerómetros‐inclinómetros puede hacer que sea menos probable que los participantes interfieran con la medición del resultado. Por lo tanto, para los ensayos de intervención se ha recomendado el uso de dispositivos para medir el comportamiento sedentario (Pedišić 2015).
Dos estudios no son ECA, como se declara a priori en la publicación, porque solo asignaron al azar dos grupos (Alkhajah 2012; Neuhaus 2014a). Los autores de los ensayos los describieron como ensayos controlados cuasialeatorios. El riesgo de presentar diferencias iniciales es mucho mayor en estos estudios con solo dos grupos, por lo que se categorizaron como estudios controlados tipo antes y después, en lugar de ECA. En la evaluación del "Riesgo de sesgo", se analizaron los desequilibrios iniciales de ambos estudios.
Aunque los estudios realizaron de forma deficiente la ocultación de la asignación y el cegamiento de los dominios de los participantes y el personal, la mayoría de los estudios evaluó los resultados de una manera que se consideró con bajo riesgo de sesgo. Al tomar todo lo anterior en consideración, la calidad general de la evidencia se consideró muy baja.
Sesgos potenciales en el proceso de revisión
No se excluyeron los artículos publicados en idiomas distintos del inglés. De esta manera se evitó el sesgo de idioma en la revisión.
No fue posible evaluar la solidez de los resultados porque no hubo suficientes estudios con bajo riesgo de sesgo para realizar un análisis de sensibilidad significativo.
Para evitar el sesgo de publicación se buscaron las fuentes de literatura gris y los estudios y datos no publicados. No se observó una asimetría obvia (que indicaría sesgo de publicación) en los gráficos en embudo de los estudios que compararon los escritorios que permiten estar sentados y de pie con o sin información y asesoramiento con los escritorios que permiten estar sentados con respecto al tiempo de sedestación en el trabajo como un resultado (Figura 4). Para otras comparaciones y resultados, hubo muy pocos estudios por resultado (menos de diez estudios) para evaluar el sesgo de publicación mediante gráficos en embudo. Sin embargo, como en su mayoría los estudios incluidos fueron pequeños y todos informaron resultados positivos, es de esperar que pueda haber sesgo de publicación en este sentido. Si se incluyeran más estudios en una actualización futura, el grado de sesgo de publicación se evaluará mediante los gráficos en embudo y la prueba de Egger (Egger 1997).
Acuerdos y desacuerdos con otros estudios o revisiones
Recientemente se han publicado varias revisiones sistemáticas sobre intervenciones para la reducción del comportamiento sedentario (Commissaris 2016; Gardner 2015a; Martin 2015; Prince 2014). Dos de estas revisiones evaluaron la efectividad de las intervenciones para la reducción del comportamiento sedentario en adultos en el lugar de trabajo, así como en otros contextos; incluyeron 51 estudios (Martin 2015), y 65 estudios (Prince 2014). Ambas revisiones concluyeron que las intervenciones sobre el comportamiento sedentario en adultos pueden ser efectivas para reducir dicho comportamiento. Una revisión sistemática reciente, Commissaris 2016, con 40 estudios, evaluó la efectividad de las intervenciones en el lugar de trabajo para cambiar el comportamiento sedentario o la actividad física, o ambos, de los empleados. Esta revisión encontró evidencia sólida de una disminución en el comportamiento sedentario con el uso de puestos de trabajo alternativos, lo que difiere significativamente de los resultados de evidencia de muy baja a baja calidad para los escritorios alternativos.
Otra revisión sistemática reciente que incluyó 26 estudios, Gardner 2015a, investigó las estrategias de cambio de comportamiento adoptadas mediante intervenciones sobre los comportamientos sedentarios al utilizar la Behaviour Change Wheel. Esta revisión encontró que el uso de más técnicas hizo las intervenciones más prometedoras en cuanto a su efectividad. Las técnicas de cambio de comportamiento observadas con mayor frecuencia fueron: establecimiento de objetivos conductuales, provisión de apoyo social e intervenciones ambientales. En Gardner 2015a se encontraron dos intervenciones en el lugar de trabajo que fueron prometedoras: intervenciones educativas y ambientales. Solo el hallazgo acerca del último tipo de intervención coincide con los resultados de la presente revisión.
Las diferencias en el gasto de energía entre la sedestación y la posición de pie son leves. En Mansoubi 2015 se encontró que las tareas de tipificación de la sedestación dieron lugar a un gasto de energía de 1,45 ETS (desviación estándar [DE] 0,32), mientras que el costo de energía de estar de pie se equiparó a 1,59 ETS (DE 0,37). Por el contrario, hubo una diferencia considerable entre los costos de energía de la sedestación y la actividad física; por ejemplo, los valores MET de caminar aumentaron de manera gradual con la velocidad de 2,17 ETS (DE 0,5) a 0,2 millas/hora a 3,22 ETS (DE 0,69) a 1,6 millas/hora. Por lo tanto, está claro que es posible que el uso de lugares de trabajo más dinámicos aumente considerablemente los gastos de energía. Por ejemplo, el gasto de energía del uso de un lugar de trabajo tipo escritorio con pedaleo a intensidad ligera alcanza 2,4 ETS (Botter 2015). Mansoubi 2015, en concordancia con lo anterior, cuestiona si los efectos beneficiosos para la salud de la reducción del comportamiento sedentario dependen principalmente del aumento del gasto de energía que acompaña a la transición a la actividad ligera (p.ej. el pedaleo), de las diferencias en la colocación postural (p.ej. estar de pie) o de una combinación de ambos (p.ej. caminar y pedalear). Lo anterior se debe investigar de manera adicional para informar las intervenciones futuras.
Aunque la obesidad en los empleados podría significar una pérdida significativa para el lugar de trabajo (Shrestha 2016), es posible que el objetivo de reducir la obesidad o el sobrepeso con la posición de pie en el trabajo no sea pragmático. Un estudio encontró un gasto metabólico adicional solo ligeramente mayor para la posición de pie tranquila en comparación con la sedestación (Júdice 2015b). En teoría, si un hombre y una mujer promedio pasan el 50% de un día de trabajo de ocho horas de pie, gastarían aproximadamente 20 kilocalorías (kcal) y 12 kcal adicionales, respectivamente. Estos hallazgos muestran que, después de tres meses, un escritorio que permite estar sentado y de pie combinado con asesoramiento aumentó el tiempo en posición de pie en 89 minutos como promedio (IC del 95%: 76 a 102), de manera que el gasto adicional de energía que se puede esperar de la posición de pie en dichas intervenciones es insignificante. En conformidad con los hallazgos de la presente revisión, los autores de un estudio longitudinal indicaron que el aumento del tiempo ocupacional de pie puede no ser suficiente para prevenir la aparición del sobrepeso, la obesidad, la intolerancia a la glucosa y la diabetes tipo 2 (Chaput 2015).
Un estudio ha indicado que cantidades mayores de tiempo en posición de pie se pueden asociar con una reducción del riesgo de mortalidad por todas las causas y por enfermedad cardiovascular (Katzmarzyk 2014). Debido a que las tasas de mortalidad disminuyen en los niveles más altos en la posición de pie, independientemente del aumento insignificante del gasto de energía, puede ser que la posición de pie sea en general un comportamiento más saludable que la sedestación. Sin embargo, promover de manera sostenida la posición de pie durante períodos más largos tampoco parece una solución razonable; por ejemplo, Andersen 2007 informó más síntomas musculoesqueléticos asociados con la posición de pie prolongada. Coenen y colegas han mencionado que una intervención con una posición de pie más prolongada y una reducción de la sedestación fue menos efectiva para los pacientes con lumbalgia que para los que no tenían lumbalgia (Coenen 2015). Todavía no se conoce con qué cantidad de tiempo en posición de pie se pueden esperar efectos nocivos para la salud, pero es posible que promover diariamiente cuatro horas en posición de pie durante las horas de trabajo podría tener consecuencias negativas para algunos grupos poblacionales. Por ejemplo, los trabajadores de edad avanzada se quejan cuando realizan trabajos en posición de pie, aunque sea menos del 50% del tiempo de trabajo (Graf 2015). Pedišić y colegas han indicado que explorar la efectividad de las intervenciones que promueven un equilibrio óptimo entre la actividad física, la posición de pie tranquila, el comportamiento sedentario y el sueño puede ser una vía importante para los estudios futuros de investigación (Pedišić 2017).

PRISMA study flow diagram

Risk of bias graph: review authors' judgements about each risk of bias item presented as percentages across all included studies.

Risk of bias summary: review authors' judgements about each risk of bias item for each included study.
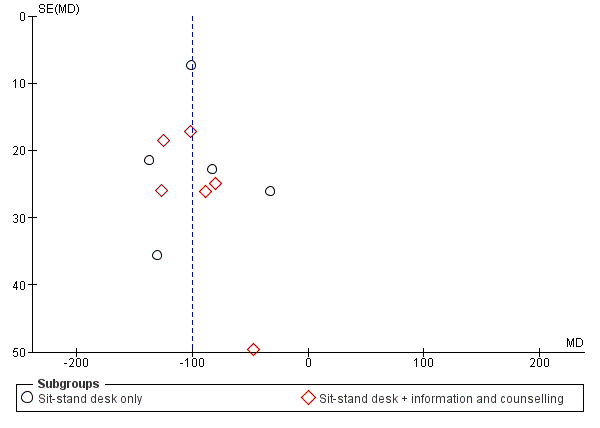
Funnel plot of comparison: 1 Sit‐stand desk with or without information and counselling versus sit‐desk, outcome: 1.1 Mean difference in time spent sitting at work: short‐term follow‐up.

Comparison 1 Sit‐stand desk with or without information and counselling versus sit‐desk, Outcome 1 Mean difference in time spent sitting at work follow‐up short‐term.

Comparison 1 Sit‐stand desk with or without information and counselling versus sit‐desk, Outcome 2 Mean difference in time spent sitting at work, follow‐up short‐term ‐ sensitivity analysis.
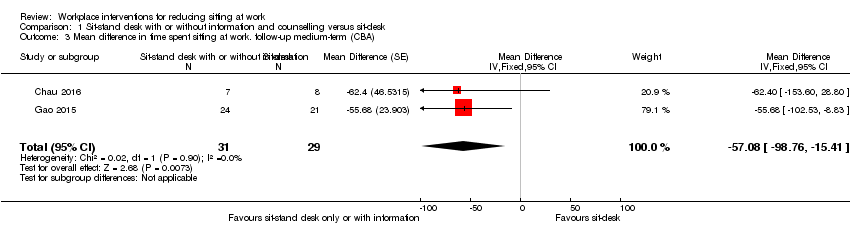
Comparison 1 Sit‐stand desk with or without information and counselling versus sit‐desk, Outcome 3 Mean difference in time spent sitting at work. follow‐up medium‐term (CBA).

Comparison 1 Sit‐stand desk with or without information and counselling versus sit‐desk, Outcome 4 Mean difference in time in sitting bouts lasting 30 minutes or more, follow‐up short‐term (CBA).
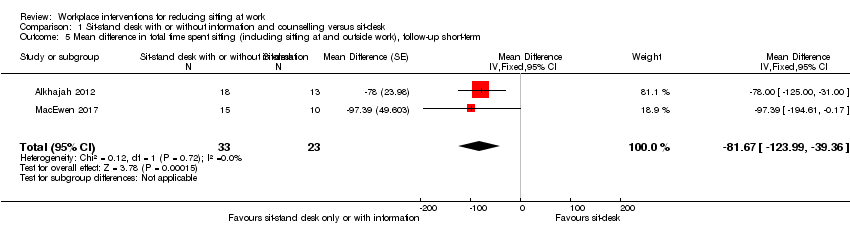
Comparison 1 Sit‐stand desk with or without information and counselling versus sit‐desk, Outcome 5 Mean difference in total time spent sitting (including sitting at and outside work), follow‐up short‐term.
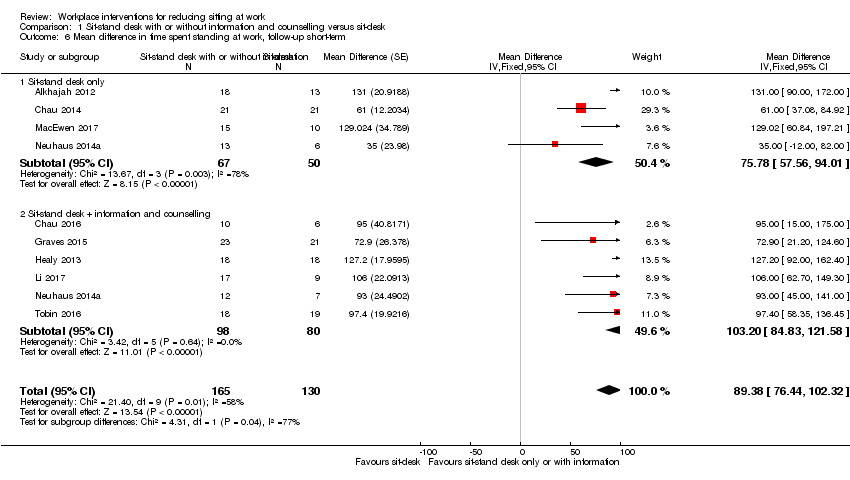
Comparison 1 Sit‐stand desk with or without information and counselling versus sit‐desk, Outcome 6 Mean difference in time spent standing at work, follow‐up short‐term.
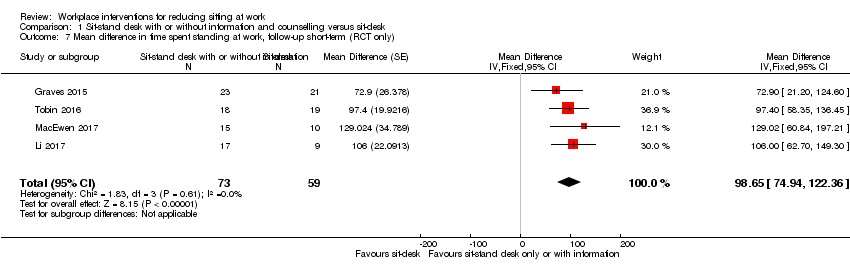
Comparison 1 Sit‐stand desk with or without information and counselling versus sit‐desk, Outcome 7 Mean difference in time spent standing at work, follow‐up short‐term (RCT only).

Comparison 1 Sit‐stand desk with or without information and counselling versus sit‐desk, Outcome 8 Mean difference in time spent stepping at work follow‐up short‐term.

Comparison 1 Sit‐stand desk with or without information and counselling versus sit‐desk, Outcome 9 Mean difference in time spent standng at work, follow‐up medium‐term (CBA).

Comparison 1 Sit‐stand desk with or without information and counselling versus sit‐desk, Outcome 10 Work performance (1‐10 scale), follow‐up short‐term (CBA).

Comparison 1 Sit‐stand desk with or without information and counselling versus sit‐desk, Outcome 11 Proportion with ≥ 1 sick days in the last three months (CBA).

Comparison 1 Sit‐stand desk with or without information and counselling versus sit‐desk, Outcome 12 Proportion with ≥ 1 sick days in the last month (CBA).
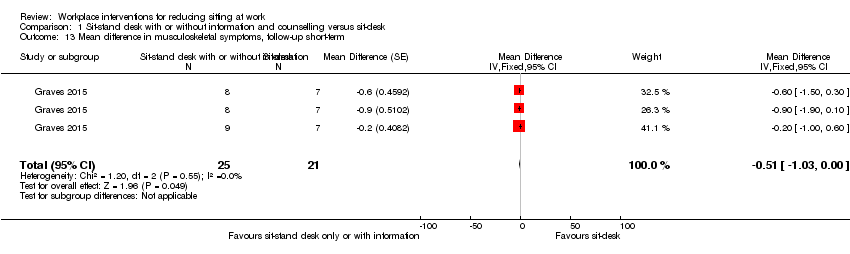
Comparison 1 Sit‐stand desk with or without information and counselling versus sit‐desk, Outcome 13 Mean difference in musculoskeletal symptoms, follow‐up short‐term.

Comparison 1 Sit‐stand desk with or without information and counselling versus sit‐desk, Outcome 14 Mean difference in musculoskeletal symptoms, follow‐up Medium‐term.

Comparison 2 Standing desk versus sit‐stand desk, Outcome 1 Mean difference in time spent sitting at work, follow‐up short‐term.

Comparison 2 Standing desk versus sit‐stand desk, Outcome 2 Mean difference in time spent sitting at work, follow‐up medium‐term.
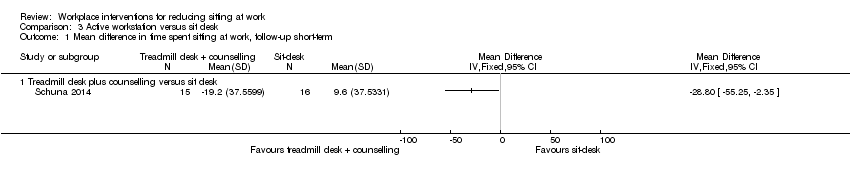
Comparison 3 Active workstation versus sit desk, Outcome 1 Mean difference in time spent sitting at work, follow‐up short‐term.
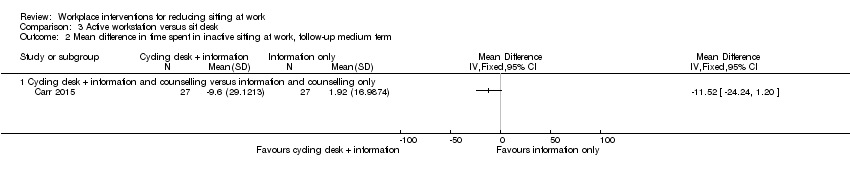
Comparison 3 Active workstation versus sit desk, Outcome 2 Mean difference in time spent in inactive sitting at work, follow‐up medium term.
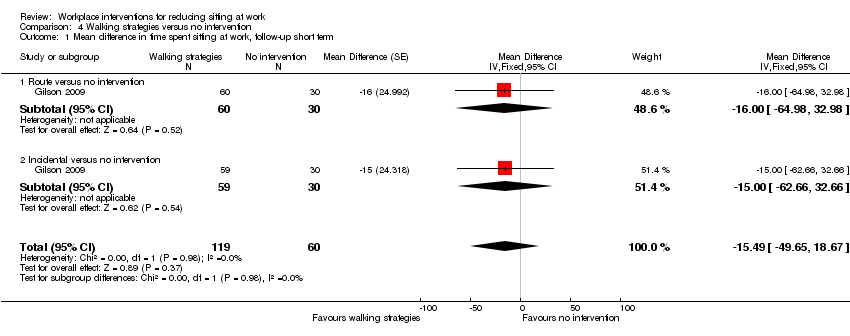
Comparison 4 Walking strategies versus no intervention, Outcome 1 Mean difference in time spent sitting at work, follow‐up short term.
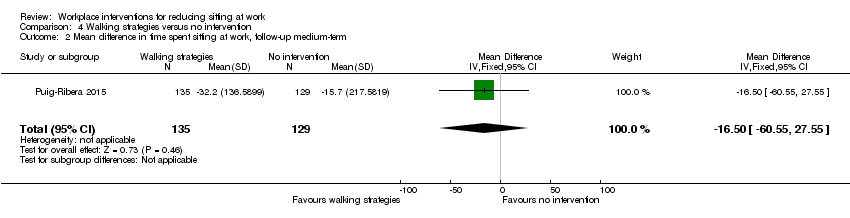
Comparison 4 Walking strategies versus no intervention, Outcome 2 Mean difference in time spent sitting at work, follow‐up medium‐term.
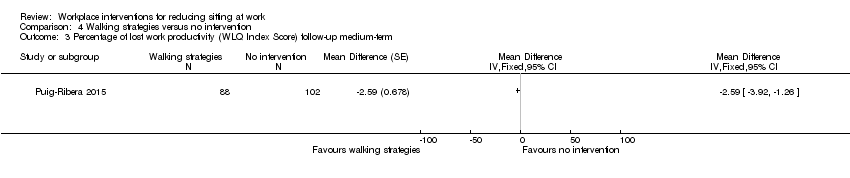
Comparison 4 Walking strategies versus no intervention, Outcome 3 Percentage of lost work productivity (WLQ Index Score) follow‐up medium‐term.
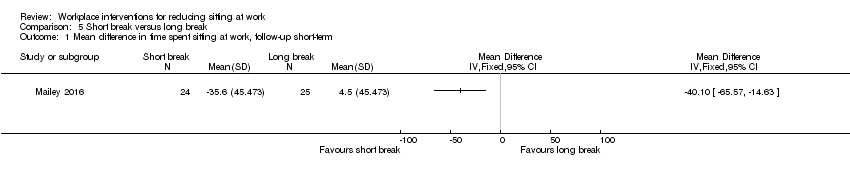
Comparison 5 Short break versus long break, Outcome 1 Mean difference in time spent sitting at work, follow‐up short‐term.
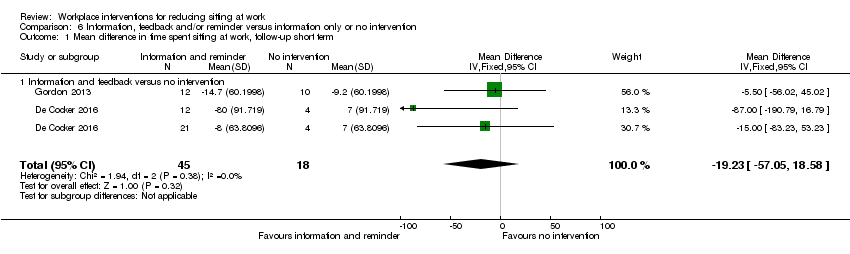
Comparison 6 Information, feedback and/or reminder versus information only or no intervention, Outcome 1 Mean difference in time spent sitting at work, follow‐up short term.
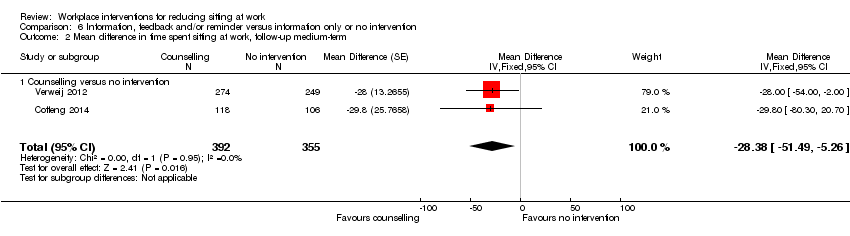
Comparison 6 Information, feedback and/or reminder versus information only or no intervention, Outcome 2 Mean difference in time spent sitting at work, follow‐up medium‐term.
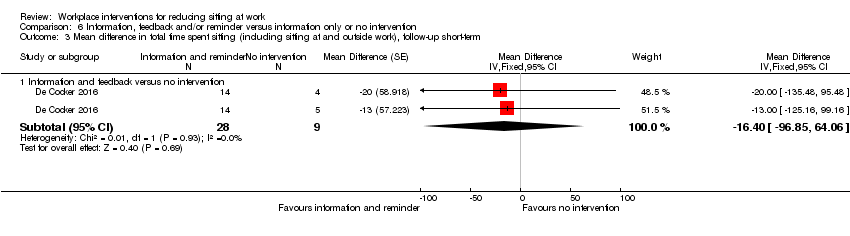
Comparison 6 Information, feedback and/or reminder versus information only or no intervention, Outcome 3 Mean difference in total time spent sitting (including sitting at and outside work), follow‐up short‐term.

Comparison 6 Information, feedback and/or reminder versus information only or no intervention, Outcome 4 Mean difference in total time spent sitting (including sitting at and outside work), follow‐up medium term.

Comparison 6 Information, feedback and/or reminder versus information only or no intervention, Outcome 5 Mean difference in time spent standing at work follow‐up short‐term.
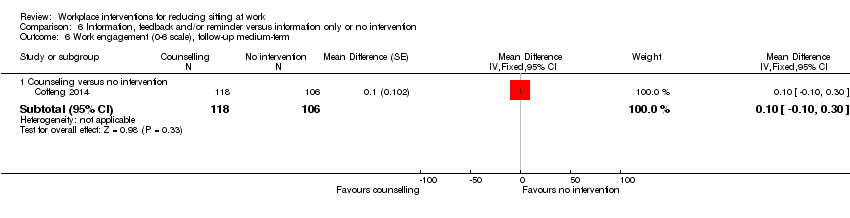
Comparison 6 Information, feedback and/or reminder versus information only or no intervention, Outcome 6 Work engagement (0‐6 scale), follow‐up medium‐term.

Comparison 7 Prompts plus information versus information alone, Outcome 1 Mean difference in time spent sitting at work, follow‐up short term.
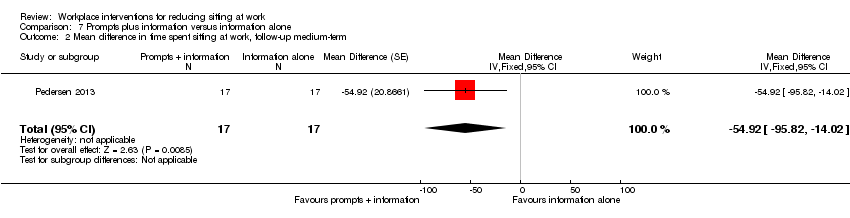
Comparison 7 Prompts plus information versus information alone, Outcome 2 Mean difference in time spent sitting at work, follow‐up medium‐term.

Comparison 7 Prompts plus information versus information alone, Outcome 3 Mean difference in number of sitting bouts lasting 30 minutes or more, follow‐up short‐term.
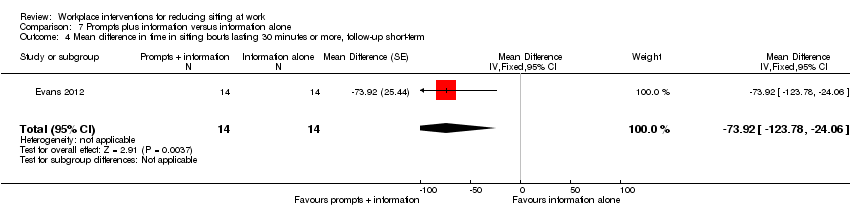
Comparison 7 Prompts plus information versus information alone, Outcome 4 Mean difference in time in sitting bouts lasting 30 minutes or more, follow‐up short‐term.

Comparison 7 Prompts plus information versus information alone, Outcome 5 Mean difference in total time spent sitting (including sitting at and outside work), follow‐up short‐term.
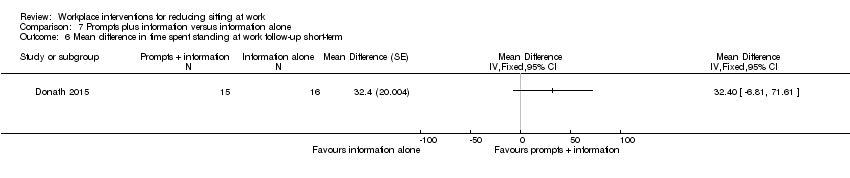
Comparison 7 Prompts plus information versus information alone, Outcome 6 Mean difference in time spent standing at work follow‐up short‐term.

Comparison 7 Prompts plus information versus information alone, Outcome 7 Mean difference in energy expenditure, follow‐up medium‐term.

Comparison 8 Computer prompts to step versus computer prompts to stand, Outcome 1 Mean difference in time spent sitting at work, follow‐up short‐term.
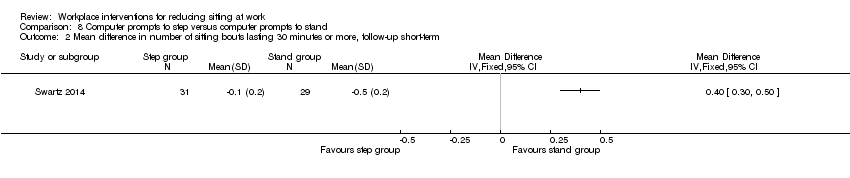
Comparison 8 Computer prompts to step versus computer prompts to stand, Outcome 2 Mean difference in number of sitting bouts lasting 30 minutes or more, follow‐up short‐term.

Comparison 8 Computer prompts to step versus computer prompts to stand, Outcome 3 Mean difference in time spent standing at work, follow‐up short‐term.
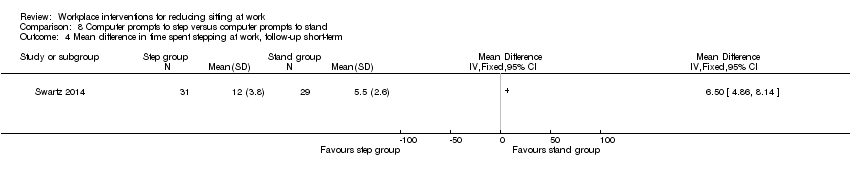
Comparison 8 Computer prompts to step versus computer prompts to stand, Outcome 4 Mean difference in time spent stepping at work, follow‐up short‐term.

Comparison 9 High personalised or contextualised information versus less personalised or contextualised information, Outcome 1 Mean difference in time in sitting bouts lasting 30 minutes or more, follow‐up short‐term.
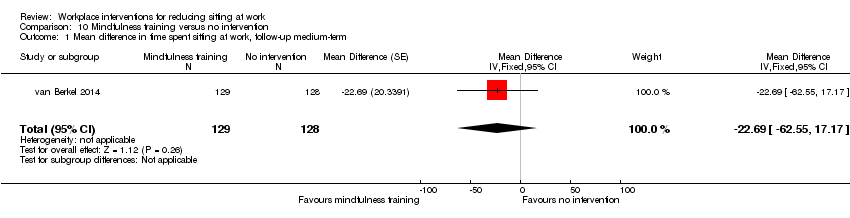
Comparison 10 Mindfulness training versus no intervention, Outcome 1 Mean difference in time spent sitting at work, follow‐up medium‐term.
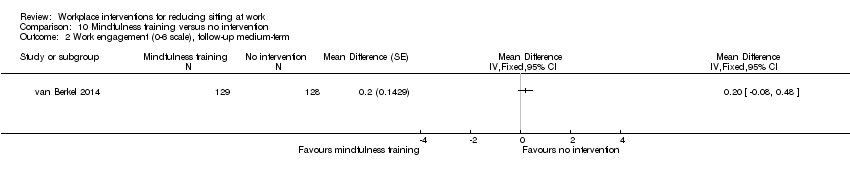
Comparison 10 Mindfulness training versus no intervention, Outcome 2 Work engagement (0‐6 scale), follow‐up medium‐term.

Comparison 11 Activity tracker combined with organisational support versus organisational support only, Outcome 1 Mean difference in time spent sitting at work, follow‐up short‐term.

Comparison 11 Activity tracker combined with organisational support versus organisational support only, Outcome 2 Mean difference in time spent sitting at work, follow‐up medium‐term.

Comparison 11 Activity tracker combined with organisational support versus organisational support only, Outcome 3 Mean difference in time in sitting bouts lasting 30 minutes or more, follow‐up short‐term.
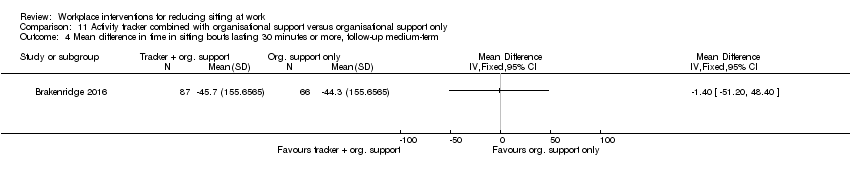
Comparison 11 Activity tracker combined with organisational support versus organisational support only, Outcome 4 Mean difference in time in sitting bouts lasting 30 minutes or more, follow‐up medium‐term.

Comparison 11 Activity tracker combined with organisational support versus organisational support only, Outcome 5 Mean difference in total time spent sitting (including sitting at and outside work), follow‐up short‐term.

Comparison 11 Activity tracker combined with organisational support versus organisational support only, Outcome 6 Mean difference in total time spent sitting (including sitting at and outside work), follow‐up medium‐term.

Comparison 11 Activity tracker combined with organisational support versus organisational support only, Outcome 7 Mean difference in time spent standing at work follow‐up short‐term.

Comparison 11 Activity tracker combined with organisational support versus organisational support only, Outcome 8 Mean difference in time spent stepping at work, follow‐up short‐term.
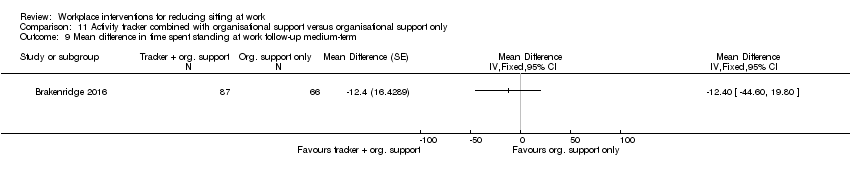
Comparison 11 Activity tracker combined with organisational support versus organisational support only, Outcome 9 Mean difference in time spent standing at work follow‐up medium‐term.
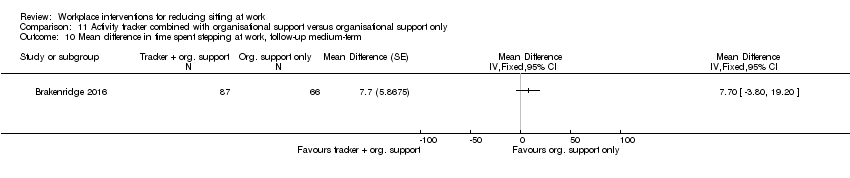
Comparison 11 Activity tracker combined with organisational support versus organisational support only, Outcome 10 Mean difference in time spent stepping at work, follow‐up medium‐term.
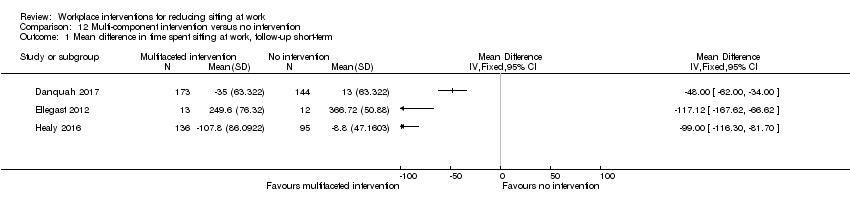
Comparison 12 Multi‐component intervention versus no intervention, Outcome 1 Mean difference in time spent sitting at work, follow‐up short‐term.
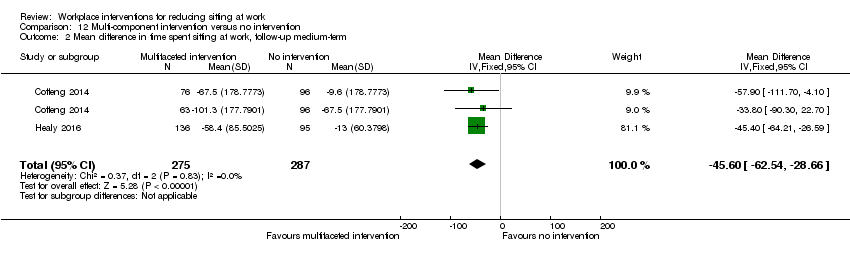
Comparison 12 Multi‐component intervention versus no intervention, Outcome 2 Mean difference in time spent sitting at work, follow‐up medium‐term.
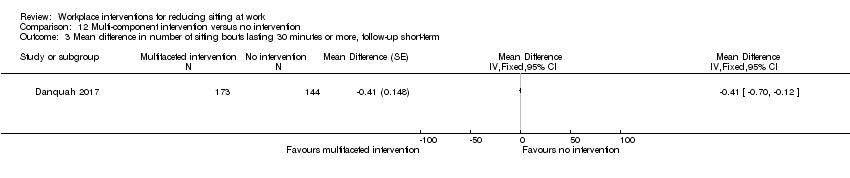
Comparison 12 Multi‐component intervention versus no intervention, Outcome 3 Mean difference in number of sitting bouts lasting 30 minutes or more, follow‐up short‐term.

Comparison 12 Multi‐component intervention versus no intervention, Outcome 4 Mean difference in time in sitting bouts lasting 30 minutes or more, follow‐up short‐term.
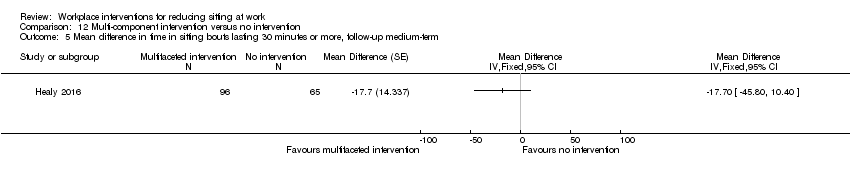
Comparison 12 Multi‐component intervention versus no intervention, Outcome 5 Mean difference in time in sitting bouts lasting 30 minutes or more, follow‐up medium‐term.

Comparison 12 Multi‐component intervention versus no intervention, Outcome 6 Mean difference in total time spent sitting (including sitting at and outside work), follow‐up short‐term.

Comparison 12 Multi‐component intervention versus no intervention, Outcome 7 Mean difference in total time spent sitting (including sitting at and outside work), follow‐up medium‐term.
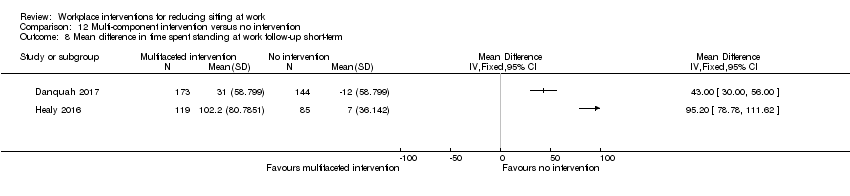
Comparison 12 Multi‐component intervention versus no intervention, Outcome 8 Mean difference in time spent standing at work follow‐up short‐term.
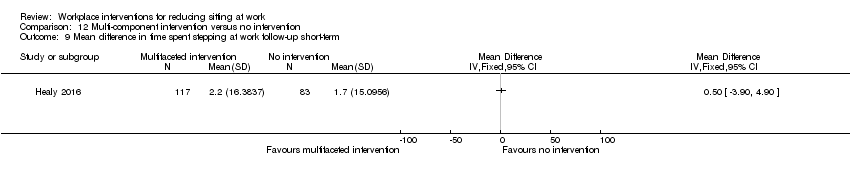
Comparison 12 Multi‐component intervention versus no intervention, Outcome 9 Mean difference in time spent stepping at work follow‐up short‐term.

Comparison 12 Multi‐component intervention versus no intervention, Outcome 10 Mean difference in time spent standing at work follow‐up medium‐term.

Comparison 12 Multi‐component intervention versus no intervention, Outcome 11 Mean difference in time spent stepping at work follow‐up medium‐term.

Comparison 12 Multi‐component intervention versus no intervention, Outcome 12 Work engagement (0‐6 scale), follow‐up short‐term.
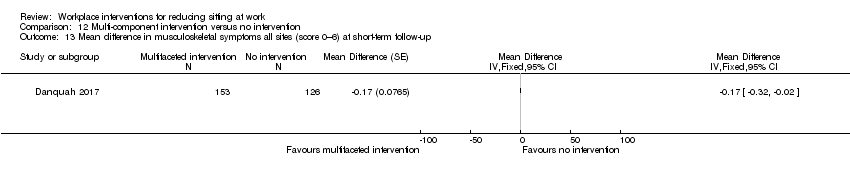
Comparison 12 Multi‐component intervention versus no intervention, Outcome 13 Mean difference in musculoskeletal symptoms all sites (score 0–6) at short‐term follow‐up.
| Alternative desks and workstations compared to sit‐desks for reducing sitting at work | |||||
| Patient or population: employees who sit at work | |||||
| Outcomes | Anticipated absolute effects* (95% CI) | № of participants | Certainty of the evidence | Comments | |
| Risk with sit‐desk | Risk with changes in desk | ||||
| Comparison: sit‐stand desk with or without information and counselling versus sit‐desk | |||||
| Mean difference in time spent sitting at work, short‐term follow‐up (up to 3 months) | The mean difference in time spent sitting at work (short‐term follow‐up) was 364 minutes | MD 100 minutes lower | 323 | ⊕⊕⊝⊝ | Subgroup analysis showed no difference in effect between sit‐stand desks used alone or in combination with information and counselling. Restricting the analysis to RCTs only did not show any difference in effect either. |
| Mean difference in time in sitting bouts lasting 30 minutes or more, short‐term follow‐up | The mean difference in time in sitting bouts lasting 30 minutes or more (short‐term follow‐up) was 167 minutes | MD 53 minutes lower | 74 | ⊕⊝⊝⊝ | |
| Comparison: treadmill desk combined with counselling versus sit‐desk | |||||
| Mean difference in time spent sitting at work, short‐term follow‐up (up to 3 months) | The mean difference in time spent sitting at work (short‐term follow‐up) was 342 minutes | MD 29 minutes lower | 31 | ⊕⊕⊝⊝ | |
| Mean difference in time in sitting bouts lasting 30 minutes or more, short‐term follow‐up — not reported | ‐ | ‐ | ‐ | ‐ | |
| Comparison: cycling desk + information and counselling versus sit‐desk + information and counselling | |||||
| Mean difference in time spent in inactive sitting at work, medium‐term follow‐up (from 3 to 12 months) | The mean difference in time spent in inactive sitting at work (medium‐term follow‐up) was 413 minutes | MD 12 minutes lower | 54 | ⊕⊕⊝⊝ | |
| *The risk in the intervention group (and its 95% confidence interval) is based on the assumed risk in the comparison group and the relative effect of the intervention (and its 95% CI). | |||||
| GRADE Working Group grades of evidence | |||||
| 1 Of the six RCTs, five were at high risk of bias. The non‐randomised controlled before‐and‐after study/studies were also at high risk of bias; downgraded one level 2 Imprecision with wide confidence intervals, small sample size; downgraded one level 3 Unconcealed allocation, unblinded outcome assessment and attrition bias; downgraded two levels 4 Unblinded outcome assessment; downgraded one level 5 Unblinded outcome assessment and attrition bias; downgraded one level | |||||
| Workplace policy changes compared to no intervention for reducing sitting at work | |||||
| Patient or population: employees who sit at work | |||||
| Outcomes | Anticipated absolute effects* (95% CI) | № of participants | Certainty of the evidence | Comments | |
| Risk with no intervention | Risk with Policy changes | ||||
| Comparision: walking strategies versus no intervention | |||||
| Mean difference in time spent sitting at work, short‐term follow‐up | The mean difference in time spent sitting at work (short‐term follow‐up) was 344 minutes | MD 15 minutes lower | 179 | ⊕⊕⊝⊝ | |
| Mean difference in time in sitting bouts lasting 30 minutes or more, short‐term follow‐up — not reported | ‐ | ‐ | ‐ | ‐ | |
| Comparision: short break versus long break | |||||
| Mean difference in time spent sitting at work, short‐term follow‐up | The mean difference in time spent sitting at work (short term follow‐up) was 131 minutes | MD 40 minutes lower | 49 | ⊕⊕⊝⊝ | |
| Mean difference in time in sitting bouts lasting 30 minutes or more, short‐term follow‐up — not reported | ‐ | ‐ | ‐ | ‐ | |
| *The risk in the intervention group (and its 95% confidence interval) is based on the assumed risk in the comparison group and the relative effect of the intervention (and its 95% CI). | |||||
| GRADE Working Group grades of evidence | |||||
| 1 Risk of bias high due to unblinded outcome assessment and lack of allocation concealment; downgraded with one level 2 Imprecision with wide confidence intervals; downgraded with one level 3 Unconcealed allocation and attrition bias | |||||
| Information and counselling compared to information only or no intervention for reducing sitting at work | |||||
| Patient or population: employees who sit at work | |||||
| Outcomes | Anticipated absolute effects* (95% CI) | № of participants | Certainty of the evidence | Comments | |
| Risk with information only or no intervention | Risk with Information and counselling | ||||
| Information, feedback and counselling versus no intervention | |||||
| Mean difference in time spent sitting at work, short‐term follow‐up — information and feedback versus no intervention | The mean difference in time spent sitting at work (short‐term follow‐up) was 550 minutes | MD 19 minutes lower | 63 | ⊕⊕⊝⊝ | |
| Mean difference in time spent sitting at work, medium‐term follow‐up — counselling versus no intervention | The mean difference in time spent sitting at work (medium‐term follow‐up) was 462 minutes | MD 28 minutes lower | 747 | ⊕⊕⊝⊝ | |
| Mean difference in time in sitting bouts lasting 30 minutes or more, short‐term follow‐up ‐ not reported | ‐ | ‐ | ‐ | ‐ | |
| Prompts combined with information versus information alone | |||||
| Mean difference in time spent sitting at work, short‐term follow‐up | The mean difference in time spent sitting at work (short‐term follow‐up) was 349 minutes | MD 10 minutes lower | 75 | ⊕⊕⊝⊝ | |
| Mean difference in time in sitting bouts lasting 30 minutes or more, short‐term follow‐up | The mean difference in time in sitting bouts lasting 30 minutes or more (short‐term follow‐up) was 286 minutes | MD 74 minutes lower | 28 | ⊕⊕⊝⊝ | |
| Mindfulness training versus no intervention | |||||
| Mean difference in time spent sitting at work, medium‐term follow‐up | The mean difference in time spent sitting at work (medium‐term follow‐up) was 316 minutes | MD 23 minutes lower | 257 | ⊕⊕⊝⊝ | |
| Mean difference in time in sitting bouts lasting 30 minutes or more, medium‐term follow‐up — not reported | ‐ | ‐ | ‐ | ‐ | |
| *The risk in the intervention group (and its 95% confidence interval) is based on the assumed risk in the comparison group and the relative effect of the intervention (and its 95% CI). | |||||
| GRADE Working Group grades of evidence | |||||
| 1 Imprecision with wide confidence intervals, small sample size; downgraded with one level 2 Unblinded outcome assessment and attrition bas 3 Risk of bias, allocation not concealed, lack of blinding, high attrition rate; downgraded with one level 4 Lack of blinding of participants and selective reporting 5 Lack of blinding of participants and attrition bias 6 Risk of bias high due to unconcealed allocation and unblinded outcome assessment; downgraded with one level 7 Lack of blinding of participants | |||||
| Multi‐component intervention compared to no intervention for reducing sitting at work | |||||
| Patient or population: employees who sit at work | |||||
| Outcomes | Anticipated absolute effects* (95% CI) | № of participants | Certainty of the evidence | Comments | |
| Risk with no intervention | Risk with Multi‐component intervention | ||||
| Mean difference in time spent sitting at work, short‐term follow‐up | See comment | see comment | 573 | ⊕⊝⊝⊝ | Not pooled |
| Mean difference in time in sitting bouts lasting 30 minutes or more, short‐term follow‐up | See comment | See comment | 518 | ⊕⊝⊝⊝ | Not pooled |
| *The risk in the intervention group (and its 95% confidence interval) is based on the assumed risk in the comparison group and the relative effect of the intervention (and its 95% CI). CI: Confidence interval; RR: Risk ratio; OR: Odds ratio; RCT: randomised controlled trial | |||||
| GRADE Working Group grades of evidence | |||||
| 1 Unconcealed allocation and unblinded outcome assessment 2 Imprecision with wide confidence interval, small sample size 3 Not pooled due to high heterogeneity 3 Small sample size | |||||
| Outcome or subgroup title | No. of studies | No. of participants | Statistical method | Effect size |
| 1 Mean difference in time spent sitting at work follow‐up short‐term Show forest plot | 10 | 323 | Mean Difference (Random, 95% CI) | ‐100.16 [‐115.83, ‐84.48] |
| 1.1 Sit‐stand desk only | 5 | 145 | Mean Difference (Random, 95% CI) | ‐96.72 [‐126.05, ‐67.39] |
| 1.2 Sit‐stand desk + information and counselling | 6 | 178 | Mean Difference (Random, 95% CI) | ‐104.38 [‐122.81, ‐85.96] |
| 2 Mean difference in time spent sitting at work, follow‐up short‐term ‐ sensitivity analysis Show forest plot | 10 | 323 | Mean Difference (Random, 95% CI) | ‐100.16 [‐115.83, ‐84.48] |
| 2.1 Randomised control trials | 4 | 132 | Mean Difference (Random, 95% CI) | ‐105.19 [‐128.13, ‐82.24] |
| 2.2 Cross‐over RCT | 2 | 70 | Mean Difference (Random, 95% CI) | ‐99.11 [‐112.82, ‐85.41] |
| 2.3 Control before after studies | 4 | 121 | Mean Difference (Random, 95% CI) | ‐92.80 [‐133.13, ‐52.47] |
| 3 Mean difference in time spent sitting at work. follow‐up medium‐term (CBA) Show forest plot | 2 | 60 | Mean Difference (Fixed, 95% CI) | ‐57.08 [‐98.76, ‐15.41] |
| 4 Mean difference in time in sitting bouts lasting 30 minutes or more, follow‐up short‐term (CBA) Show forest plot | 2 | 74 | Mean Difference (Fixed, 95% CI) | ‐52.57 [‐78.79, ‐26.35] |
| 4.1 Sit‐stand desk only | 1 | 20 | Mean Difference (Fixed, 95% CI) | ‐13.00 [‐70.80, 40.80] |
| 4.2 Sit‐stand desk + information and counselling | 2 | 54 | Mean Difference (Fixed, 95% CI) | ‐63.22 [‐92.92, ‐33.51] |
| 5 Mean difference in total time spent sitting (including sitting at and outside work), follow‐up short‐term Show forest plot | 2 | 56 | Mean Difference (Fixed, 95% CI) | ‐81.67 [‐123.99, ‐39.36] |
| 6 Mean difference in time spent standing at work, follow‐up short‐term Show forest plot | 9 | 295 | Mean Difference (Fixed, 95% CI) | 89.38 [76.44, 102.32] |
| 6.1 Sit‐stand desk only | 4 | 117 | Mean Difference (Fixed, 95% CI) | 75.78 [57.56, 94.01] |
| 6.2 Sit‐stand desk + information and counselling | 6 | 178 | Mean Difference (Fixed, 95% CI) | 103.20 [84.83, 121.58] |
| 7 Mean difference in time spent standing at work, follow‐up short‐term (RCT only) Show forest plot | 4 | 132 | Mean Difference (Fixed, 95% CI) | 98.65 [74.94, 122.36] |
| 8 Mean difference in time spent stepping at work follow‐up short‐term Show forest plot | 8 | 270 | Mean Difference (Random, 95% CI) | ‐0.52 [‐3.88, 2.85] |
| 9 Mean difference in time spent standng at work, follow‐up medium‐term (CBA) Show forest plot | 2 | 60 | Mean Difference (IV, Fixed, 95% CI) | 53.36 [16.59, 90.14] |
| 10 Work performance (1‐10 scale), follow‐up short‐term (CBA) Show forest plot | 3 | 109 | Mean Difference (Fixed, 95% CI) | 0.35 [‐0.10, 0.79] |
| 10.1 Sit‐stand desk only | 2 | 52 | Mean Difference (Fixed, 95% CI) | 0.82 [0.00, 1.63] |
| 10.2 Sit‐stand desk + information and counselling | 2 | 57 | Mean Difference (Fixed, 95% CI) | 0.15 [‐0.38, 0.68] |
| 11 Proportion with ≥ 1 sick days in the last three months (CBA) Show forest plot | 1 | Risk Ratio (M‐H, Fixed, 95% CI) | Totals not selected | |
| 12 Proportion with ≥ 1 sick days in the last month (CBA) Show forest plot | 2 | 78 | Risk Ratio (M‐H, Fixed, 95% CI) | 0.77 [0.49, 1.21] |
| 12.1 Sit‐stand desk only | 1 | 20 | Risk Ratio (M‐H, Fixed, 95% CI) | 0.94 [0.42, 2.13] |
| 12.2 Sit‐stand desk + information and counselling | 2 | 58 | Risk Ratio (M‐H, Fixed, 95% CI) | 0.72 [0.41, 1.24] |
| 13 Mean difference in musculoskeletal symptoms, follow‐up short‐term Show forest plot | 1 | 46 | Mean Difference (Fixed, 95% CI) | ‐0.51 [‐1.03, ‐0.00] |
| 14 Mean difference in musculoskeletal symptoms, follow‐up Medium‐term Show forest plot | 1 | 45 | Mean Difference (Fixed, 95% CI) | ‐0.54 [‐0.89, ‐0.19] |
| Outcome or subgroup title | No. of studies | No. of participants | Statistical method | Effect size |
| 1 Mean difference in time spent sitting at work, follow‐up short‐term Show forest plot | 1 | Mean Difference (IV, Fixed, 95% CI) | Totals not selected | |
| 2 Mean difference in time spent sitting at work, follow‐up medium‐term Show forest plot | 1 | Mean Difference (IV, Fixed, 95% CI) | Totals not selected | |
| Outcome or subgroup title | No. of studies | No. of participants | Statistical method | Effect size |
| 1 Mean difference in time spent sitting at work, follow‐up short‐term Show forest plot | 1 | Mean Difference (IV, Fixed, 95% CI) | Totals not selected | |
| 1.1 Treadmill desk plus counselling versus sit desk | 1 | Mean Difference (IV, Fixed, 95% CI) | 0.0 [0.0, 0.0] | |
| 2 Mean difference in time spent in inactive sitting at work, follow‐up medium term Show forest plot | 1 | Mean Difference (IV, Fixed, 95% CI) | Totals not selected | |
| 2.1 Cycling desk + information and counselling versus information and counselling only | 1 | Mean Difference (IV, Fixed, 95% CI) | 0.0 [0.0, 0.0] | |
| Outcome or subgroup title | No. of studies | No. of participants | Statistical method | Effect size |
| 1 Mean difference in time spent sitting at work, follow‐up short term Show forest plot | 1 | 179 | Mean Difference (Fixed, 95% CI) | ‐15.49 [‐49.65, 18.67] |
| 1.1 Route versus no intervention | 1 | 90 | Mean Difference (Fixed, 95% CI) | ‐16.0 [‐64.98, 32.98] |
| 1.2 Incidental versus no intervention | 1 | 89 | Mean Difference (Fixed, 95% CI) | ‐15.0 [‐62.66, 32.66] |
| 2 Mean difference in time spent sitting at work, follow‐up medium‐term Show forest plot | 1 | 264 | Mean Difference (IV, Fixed, 95% CI) | ‐16.50 [‐60.55, 27.55] |
| 3 Percentage of lost work productivity (WLQ Index Score) follow‐up medium‐term Show forest plot | 1 | Mean Difference (Fixed, 95% CI) | Totals not selected | |
| Outcome or subgroup title | No. of studies | No. of participants | Statistical method | Effect size |
| 1 Mean difference in time spent sitting at work, follow‐up short‐term Show forest plot | 1 | Mean Difference (IV, Fixed, 95% CI) | Totals not selected | |
| Outcome or subgroup title | No. of studies | No. of participants | Statistical method | Effect size |
| 1 Mean difference in time spent sitting at work, follow‐up short term Show forest plot | 2 | 63 | Mean Difference (IV, Fixed, 95% CI) | ‐19.23 [‐57.05, 18.58] |
| 1.1 Information and feedback versus no intervention | 2 | 63 | Mean Difference (IV, Fixed, 95% CI) | ‐19.23 [‐57.05, 18.58] |
| 2 Mean difference in time spent sitting at work, follow‐up medium‐term Show forest plot | 2 | 747 | Mean Difference (Fixed, 95% CI) | ‐28.38 [‐51.49, ‐5.26] |
| 2.1 Counselling versus no intervention | 2 | 747 | Mean Difference (Fixed, 95% CI) | ‐28.38 [‐51.49, ‐5.26] |
| 3 Mean difference in total time spent sitting (including sitting at and outside work), follow‐up short‐term Show forest plot | 1 | Mean Difference (Fixed, 95% CI) | Subtotals only | |
| 3.1 Information and feedback versus no intervention | 1 | 37 | Mean Difference (Fixed, 95% CI) | ‐16.40 [‐96.85, 64.06] |
| 4 Mean difference in total time spent sitting (including sitting at and outside work), follow‐up medium term Show forest plot | 1 | Mean Difference (Fixed, 95% CI) | Subtotals only | |
| 4.1 Counselling versus no intervention | 1 | 416 | Mean Difference (Fixed, 95% CI) | ‐20.0 [‐85.00, 45.00] |
| 5 Mean difference in time spent standing at work follow‐up short‐term Show forest plot | 1 | Mean Difference (Fixed, 95% CI) | Subtotals only | |
| 5.1 Information and feedback | 1 | 93 | Mean Difference (Fixed, 95% CI) | 10.24 [‐17.17, 37.65] |
| 6 Work engagement (0‐6 scale), follow‐up medium‐term Show forest plot | 1 | Mean Difference (Fixed, 95% CI) | Subtotals only | |
| 6.1 Counseling versus no intervention | 1 | 224 | Mean Difference (Fixed, 95% CI) | 0.1 [‐0.10, 0.30] |
| Outcome or subgroup title | No. of studies | No. of participants | Statistical method | Effect size |
| 1 Mean difference in time spent sitting at work, follow‐up short term Show forest plot | 2 | 75 | Mean Difference (IV, Fixed, 95% CI) | ‐10.48 [‐44.88, 23.92] |
| 2 Mean difference in time spent sitting at work, follow‐up medium‐term Show forest plot | 1 | 34 | Mean Difference (Fixed, 95% CI) | ‐54.92 [‐95.82, ‐14.02] |
| 3 Mean difference in number of sitting bouts lasting 30 minutes or more, follow‐up short‐term Show forest plot | 1 | Mean Difference (Fixed, 95% CI) | Totals not selected | |
| 4 Mean difference in time in sitting bouts lasting 30 minutes or more, follow‐up short‐term Show forest plot | 1 | 28 | Mean Difference (Fixed, 95% CI) | ‐73.92 [‐123.78, ‐24.06] |
| 5 Mean difference in total time spent sitting (including sitting at and outside work), follow‐up short‐term Show forest plot | 1 | Mean Difference (Fixed, 95% CI) | Totals not selected | |
| 6 Mean difference in time spent standing at work follow‐up short‐term Show forest plot | 1 | Mean Difference (Fixed, 95% CI) | Totals not selected | |
| 7 Mean difference in energy expenditure, follow‐up medium‐term Show forest plot | 1 | Mean Difference (Fixed, 95% CI) | Totals not selected | |
| Outcome or subgroup title | No. of studies | No. of participants | Statistical method | Effect size |
| 1 Mean difference in time spent sitting at work, follow‐up short‐term Show forest plot | 1 | Mean Difference (IV, Fixed, 95% CI) | Totals not selected | |
| 2 Mean difference in number of sitting bouts lasting 30 minutes or more, follow‐up short‐term Show forest plot | 1 | Mean Difference (IV, Fixed, 95% CI) | Totals not selected | |
| 3 Mean difference in time spent standing at work, follow‐up short‐term Show forest plot | 1 | Mean Difference (IV, Fixed, 95% CI) | Totals not selected | |
| 4 Mean difference in time spent stepping at work, follow‐up short‐term Show forest plot | 1 | Mean Difference (IV, Fixed, 95% CI) | Totals not selected | |
| Outcome or subgroup title | No. of studies | No. of participants | Statistical method | Effect size |
| 1 Mean difference in time in sitting bouts lasting 30 minutes or more, follow‐up short‐term Show forest plot | 1 | Mean Difference (Fixed, 95% CI) | Totals not selected | |
| Outcome or subgroup title | No. of studies | No. of participants | Statistical method | Effect size |
| 1 Mean difference in time spent sitting at work, follow‐up medium‐term Show forest plot | 1 | 257 | Mean Difference (Fixed, 95% CI) | ‐22.69 [‐62.55, 17.17] |
| 2 Work engagement (0‐6 scale), follow‐up medium‐term Show forest plot | 1 | Mean Difference (Fixed, 95% CI) | Totals not selected | |
| Outcome or subgroup title | No. of studies | No. of participants | Statistical method | Effect size |
| 1 Mean difference in time spent sitting at work, follow‐up short‐term Show forest plot | 1 | Mean Difference (Fixed, 95% CI) | Totals not selected | |
| 2 Mean difference in time spent sitting at work, follow‐up medium‐term Show forest plot | 1 | Mean Difference (Fixed, 95% CI) | Totals not selected | |
| 3 Mean difference in time in sitting bouts lasting 30 minutes or more, follow‐up short‐term Show forest plot | 1 | Mean Difference (IV, Fixed, 95% CI) | Totals not selected | |
| 4 Mean difference in time in sitting bouts lasting 30 minutes or more, follow‐up medium‐term Show forest plot | 1 | Mean Difference (IV, Fixed, 95% CI) | Totals not selected | |
| 5 Mean difference in total time spent sitting (including sitting at and outside work), follow‐up short‐term Show forest plot | 1 | Mean Difference (IV, Fixed, 95% CI) | Totals not selected | |
| 6 Mean difference in total time spent sitting (including sitting at and outside work), follow‐up medium‐term Show forest plot | 1 | Mean Difference (IV, Fixed, 95% CI) | Totals not selected | |
| 7 Mean difference in time spent standing at work follow‐up short‐term Show forest plot | 1 | Mean Difference (Fixed, 95% CI) | Totals not selected | |
| 8 Mean difference in time spent stepping at work, follow‐up short‐term Show forest plot | 1 | Mean Difference (Fixed, 95% CI) | Totals not selected | |
| 9 Mean difference in time spent standing at work follow‐up medium‐term Show forest plot | 1 | Mean Difference (Fixed, 95% CI) | Totals not selected | |
| 10 Mean difference in time spent stepping at work, follow‐up medium‐term Show forest plot | 1 | Mean Difference (Fixed, 95% CI) | Totals not selected | |
| Outcome or subgroup title | No. of studies | No. of participants | Statistical method | Effect size |
| 1 Mean difference in time spent sitting at work, follow‐up short‐term Show forest plot | 3 | Mean Difference (IV, Fixed, 95% CI) | Totals not selected | |
| 2 Mean difference in time spent sitting at work, follow‐up medium‐term Show forest plot | 2 | 562 | Mean Difference (IV, Fixed, 95% CI) | ‐45.60 [‐62.54, ‐28.66] |
| 3 Mean difference in number of sitting bouts lasting 30 minutes or more, follow‐up short‐term Show forest plot | 1 | Mean Difference (Fixed, 95% CI) | Totals not selected | |
| 4 Mean difference in time in sitting bouts lasting 30 minutes or more, follow‐up short‐term Show forest plot | 2 | Mean Difference (Fixed, 95% CI) | Totals not selected | |
| 5 Mean difference in time in sitting bouts lasting 30 minutes or more, follow‐up medium‐term Show forest plot | 1 | Mean Difference (Fixed, 95% CI) | Totals not selected | |
| 6 Mean difference in total time spent sitting (including sitting at and outside work), follow‐up short‐term Show forest plot | 2 | 227 | Mean Difference (Fixed, 95% CI) | ‐72.73 [‐91.87, ‐53.59] |
| 7 Mean difference in total time spent sitting (including sitting at and outside work), follow‐up medium‐term Show forest plot | 1 | Mean Difference (IV, Fixed, 95% CI) | Totals not selected | |
| 8 Mean difference in time spent standing at work follow‐up short‐term Show forest plot | 2 | Mean Difference (IV, Fixed, 95% CI) | Totals not selected | |
| 9 Mean difference in time spent stepping at work follow‐up short‐term Show forest plot | 1 | Mean Difference (IV, Fixed, 95% CI) | Totals not selected | |
| 10 Mean difference in time spent standing at work follow‐up medium‐term Show forest plot | 1 | Mean Difference (IV, Fixed, 95% CI) | Totals not selected | |
| 11 Mean difference in time spent stepping at work follow‐up medium‐term Show forest plot | 1 | Mean Difference (IV, Fixed, 95% CI) | Totals not selected | |
| 12 Work engagement (0‐6 scale), follow‐up short‐term Show forest plot | 1 | Mean Difference (Fixed, 95% CI) | 0.0 [‐0.14, 0.14] | |
| 12.1 Environmental interventions only | 1 | Mean Difference (Fixed, 95% CI) | 0.1 [‐0.10, 0.30] | |
| 12.2 Environmental interventions + counselling | 1 | Mean Difference (Fixed, 95% CI) | ‐0.1 [‐0.30, 0.10] | |
| 13 Mean difference in musculoskeletal symptoms all sites (score 0–6) at short‐term follow‐up Show forest plot | 1 | Mean Difference (Fixed, 95% CI) | Totals not selected | |