Tomografía computarizada de emisión de fotón único del flujo sanguíneo cerebral regional para la detección de la demencia frontotemporal en pacientes con demencia presunta
Información
- DOI:
- https://doi.org/10.1002/14651858.CD010896.pub2Copiar DOI

- Base de datos:
-
- Cochrane Database of Systematic Reviews
- Versión publicada:
-
- 23 junio 2015see what's new
- Tipo:
-
- Diagnostic
- Etapa:
-
- Review
- Grupo Editorial Cochrane:
-
Grupo Cochrane de Demencia y trastornos cognitivos
- Copyright:
-
- Copyright © 2015 The Cochrane Collaboration. Published by John Wiley & Sons, Ltd.
Cifras del artículo
Altmetric:
Citado por:
Autores
Contributions of authors
HAA: designed and drafted protocol; took overall responsibility for study selection and data extraction, and data and analyses tables; checked data entry; assessed QUADAS‐2; updated methods, drafted Results, Findings, Discussion and Authors' conclusions sections, and finalised the review manuscript.
NS: designed and drafted protocol; helped with study selection and data extraction; assessed QUADAS‐2; compiled characteristics of included and excluded studies tables; entered data and checked data entry; set up data and analyses tables; updated Methods section and drafted the Results section; drafted Summary of Findings table; contributed to Discussion section and finalised the review manuscript; managed the review process and produced progress reports, attended progress meetings and worked with all review authors to ensure that the review met publication deadlines.
CJ: helped with study selection and article retrieval, attended progress meetings, drafted manuscript.
RBH: designed and drafted protocol, advised on technical aspects of the review, drafted discussion and finalised review manuscript.
YT: restructured data and analysis tables, constructed analyses to generate forest plots and SROC plots, critically revised and finalised review manuscript.
SC: designed and drafted the protocol, helped with article retrieval and screening, and finalised review manuscript.
EJC: designed and drafted the protocol, helped with article retrieval and screening, took responsibility for study selection, attended progress meetings, drafted discussion and finalised the review manuscript.
Sources of support
Internal sources
-
No sources of support supplied
External sources
-
NIHR, UK.
This review was supported by the National Institute for Health Research, via a Cochrane Programme Grant to the Cochrane Dementia and Cognitive Improvement group. The views and opinions expressed therein are those of the authors and do not necessarily reflect those of the Systematic Reviews Programme, NIHR, NHS or the Department of Health
Declarations of interest
Hilary A Archer ‐ none known
Nadja Smailagic‐ none known
Christeena John‐ none known
Robin B Holmes‐ none known
Yemisi Takwoingi‐ none known
Elizabeth J Coulthard‐ none known
Sarah Cullum‐ none known
Acknowledgements
The authors would like to thank Anna Noel‐Storr, Trials Search Co‐ordinator of the Cochrane Dementia and Cognitive Improvement Group, for her assistance with writing the search strategy, searching and initial screening of search results.
Version history
| Published | Title | Stage | Authors | Version |
| 2015 Jun 23 | Regional Cerebral Blood Flow Single Photon Emission Computed Tomography for detection of Frontotemporal dementia in people with suspected dementia | Review | Hilary A Archer, Nadja Smailagic, Christeena John, Robin B Holmes, Yemisi Takwoingi, Elizabeth J Coulthard, Sarah Cullum | |
| 2013 Dec 23 | rCBF SPECT for detection of frontotemporal dementia in people with suspected dementia | Protocol | Elizabeth J Coulthard, Hilary A Archer, Nadja Smailagic, Christeena John, Antri Giannakou, Robin B Holmes, Sarah Cullum | |
Keywords
MeSH
Medical Subject Headings (MeSH) Keywords
- *Cerebrovascular Circulation;
- Case‐Control Studies;
- Cohort Studies;
- Dementia [diagnostic imaging];
- Diagnosis, Differential;
- Frontal Lobe [blood supply];
- Frontotemporal Dementia [*diagnostic imaging, physiopathology];
- Sensitivity and Specificity;
- Temporal Lobe [blood supply];
- Tomography, Emission‐Computed, Single‐Photon [*methods];
Medical Subject Headings Check Words
Humans;


'Risk of bias' and applicability concerns summary: review authors' judgements about each domain for each included study

'Risk of bias' and applicability concerns graph: review authors' judgements about each domain presented as percentages across included studies

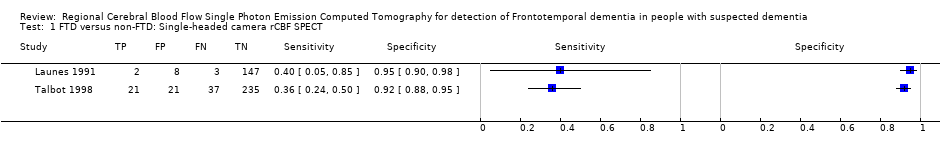
Forest plot of single‐headed and multiple‐headed camera rCBF SPECT for differentiating frontotemporal dementia (FTD) from non‐FTD. The studies are ordered according to study design, reference standard (RS) and sensitivity. TP: true positive; FP: false positive; FN: false negative; TN: true negative; CI: confidence interval.
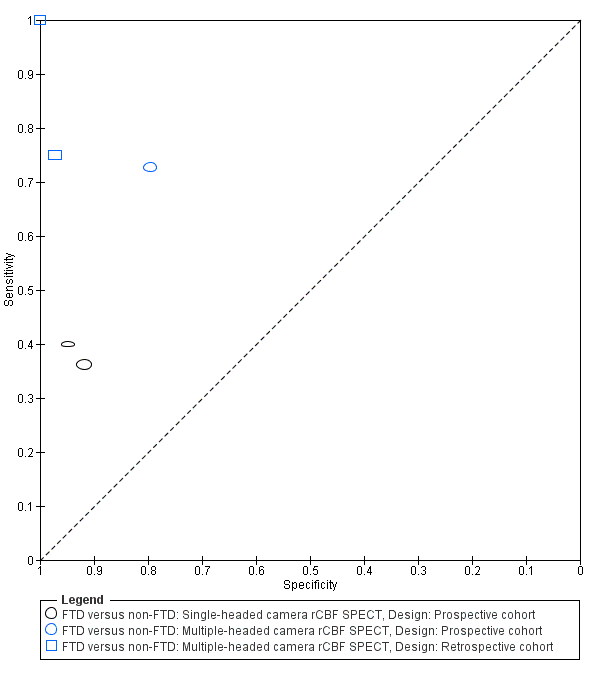
Summary ROC plot of single‐headed and multiple‐headed camera rCBF SPECT for differentiating frontotemporal dementia (FTD) from non‐FTD. Each symbol represents the sensitivity and specificity of a study. Different colours are used to indicate the two camera types and different symbols are used to indicate study design.

Forest plot of single‐headed and multiple‐headed camera rCBF SPECT for differentiating frontotemporal dementia (FTD) from Alzheimer's disease dementia (AD). The studies are ordered according to study design, reference standard (RS) and sensitivity. TP: true positive; FP: false positive; FN: false negative; TN: true negative; CI: confidence interval.
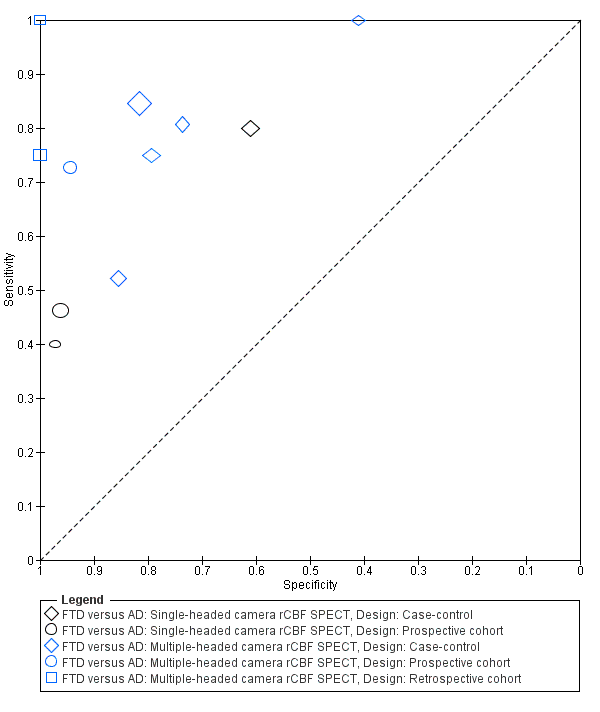
Summary ROC plot of single‐headed and multiple‐headed camera rCBF SPECT for differentiating frontotemporal dementia (FTD) from Alzheimer's disease dementia (AD). Each symbol represents the sensitivity and specificity of a study. Different colours are used to indicate the two camera types and different symbols are used to indicate study design.
FTD versus non‐FTD: Single‐headed camera rCBF SPECT.

FTD versus non‐FTD: Multiple‐headed camera rCBF SPECT.

FTD versus AD: Single‐headed camera rCBF SPECT.

FTD versus AD: Multiple‐headed camera rCBF SPECT.
| Is the SPECT FTD pattern indicative of developing FTD over time in populations with suspected dementia? What is the diagnostic accuracy of rCBF SPECT biomarker for discriminating FTD from non‐FTD, and FTD from Alzheimer's disease dementia and other dementia subtypes? | |||||||
| Population | Participants with suspected dementia and rCBF SPECT administered at baseline (prospective cohort design) (n = 3) Participants with suspected dementia and rCBF SPECT administered at baseline with histopathological confirmation (retrospective cohort design) (n = 2) Participants clinically diagnosed with FTD or other dementia subtypes using standard clinical diagnostic criteria (case‐control design) (n = 6) | ||||||
| Setting | Outpatients from University centres or University memory clinics (n = 7) Outpatients from General Hospital memory clinics (n = 1) Tertiary referral centre (n = 1) Multicentre (different French hospitals) (n = 1) Not reported (n = 1) | ||||||
| Sampling procedure | Consecutive or random (n = 3) Not consecutive or random (n = 4) Not reported (n = 4) | ||||||
| Prior testing | Prior to performing rCBF SPECT scans, diagnostic criteria for identifying dementia subtypes were applied in studies that used a case‐control study design | ||||||
| Index tests | 99mTc‐HMPAO SPECT; 99mTc‐ECD SPECT; Xenon SPECT | ||||||
| Threshold prespecified at baseline | Yes (n = 6) No (n = 3) Unclear (n = 2) | ||||||
| Threshold | Included studies used a range of thresholds | ||||||
| SPECT scan interpretation | Combined visual and semiquantitative interpretation (n = 6) Visual interpretation only (n = 5) | ||||||
| rCBF hypoperfusion region | Authors used brain regions that were expected to be affected by FTD and so frontal and/or temporal lobes were involved in all studies. Two studies also included parietal and occipital lobes in their evaluations. One study used a range of Broadmann areas (BAs) | ||||||
| Target condition | Frontotemporal dementia (FTD): ante‐mortem clinical diagnosis of FTD (n = 7) or neuropathological diagnosis of FTD (n = 4) | ||||||
| Reference standard | For ante‐mortem clinical diagnosis: Neary 1998 criteria (n = 4); Brun 1994 criteria (n = 1); not specified (n = 2) For neuropathological diagnosis: Shi 2005 (n = 1); Cairns 2007 (n = 1); not specified (n = 2) | ||||||
| Diagnostic criteria for dementia subtypes | For AD dementia: NINCDS‐ADRDA criteria (n = 6); not specified (n = 1); histopathological criteria (n = 4) For vascular dementia: NINDS‐AIREN criteria (n = 2); histopathological (n = 1) | ||||||
| Included studies | Eleven studies (n = 1077 participants) assessed rCBF SPECT for differentiating between FTD and AD. Five of these studies (n = 609) also assessed rCBF SPECT for differentiating between FTD and non‐FTD | ||||||
| Reference standard: neuropathological diagnosis. Objective A: rCBF SPECT FTD type pattern (at baseline) indicative of FTD (at follow up) in participants with suspected FTD at baseline; Objective B: The accuracy of rCBF SPECT pattern in differentiating FTD from AD | |||||||
| Objective | Study | N | Confirmed FTD | Sensitivity (95% CI) | Specificity (95% CI) | Quality | Comment |
| A | Read 1995 | 27 | 7 | 100% (0.59, 1.00) | 100% (0.83, 1.00) | Unclear risk of bias was seen in the patient selection QUADAS‐2 domain. The remaining three domains considered to be at low risk of bias. There were no concerns about applicability (Read 1995; Rollin‐Sillaire 2012). High risk of bias was seen in patient selection, index test, and flow and timing QUADAS‐2 domains. The reference standard was strength of the study. There were no concerns about applicability (Lipton 2004) High risk of bias was seen in participant selection and index test domain. The reference standard was strength of the study. There were no concerns about applicability (McNeill 2007) | Objective A: These papers used the gold standard of histopathological diagnosis; however. the methods used in participant selection and image analysis have led to the introduction of a degree of bias Objective B: These papers used the gold standard of histopathological diagnosis. Although the diagnosis is robust, case‐control design, small study numbers, different methodologies with a wide range of sensitivities and specificities mean that it is difficult to make recommendations on the basis of these results |
| A | Rollin‐Sillaire 2012 | 48 | 9 | 75% (0.43, 0.95) | 97% (0.85. 1.00) | ||
| B | Read 1995 | 20 | 7 | 100% (0.59, 1.00) | 100% (0.75, 1.00) | ||
| B | Rollin‐Sillaire 2012 | 35 | 9 | 75% (0.43, 0.95) | 100% (0.85, 1.00) | ||
| B | Lipton 2004 | 23 | 6 | 100% (0.54, 1.00) | 41% (0.18, 0.67) | ||
| B | McNeill 2007 | 56 | 20 | 80% (0.59, 0.93) | 61 % (0.42, 0.78) | ||
| Investigation of heterogeneity | We were not able to formally assess the effect of potential sources of heterogeneity because meta‐analyses were not performed | ||||||
| Conclusion | Further research on the use of rCBF SPECT for differentiating FTD from other dementias is required. In particular, protocols should be standardised, study populations well described, threshold for 'abnormal' scans predefined and clear details given on how scans are analysed | ||||||
| rCBF=regional cerebral blood flow; SPECT=single‐photon emission computerised tomography; FTD=frontotemporal dementia; 99mTc‐HMPAO=Technetium exametazime hexamethylpropyleneamine oxime; 99mTc‐ECD=Technetium exametazime ethyl cysteinate diethylester; AD=Alzheimer's disease; NINCDS‐ADRDA=National Institute of Neurological and Communicative Disorders and Stroke and the Alzheimer's Disease and Related Disorders Association; NINDS‐AIREN=National Institute of Neurological and Communicative Disorders and Stroke and Association Internationale pour la Recherche et l'Enseignement en Neurosciences; QUADAS‐2=Quality Assessment of Diagnostic Accuracy Studies | |||||||
| rCBF SPECT | Reference standard (Lund‐Manchester; NINDS; histopathological criteria) | |
| FTD present (disease positive) | FTD absent (disease negative) | |
| 'FTD pattern' present (test positive) | True positive | False positive |
| 'FTD pattern' absent (test negative) | False negative | True negative |
| Author year (country) | Target population | Study size (number analysed in review) | Sampling procedure | Number of cases (FTD) identified by reference standard | Index test/camera/interpretation/brain hypoperfusion | Reference standard/target condition | Sensitivity | Specificity |
| Prospective cohort studies | ||||||||
| Boutoleau‐ Bretonniere 2012 (France) | Neurological Memory Center attendees with clinically ambiguous dementias | 69 (19, 29 or 60) | Not reported | 11/60 | 99mTc‐HMPAO SPECT/multiple camera visual/frontal ± temporal | Clinical diagnosis FTD vs non‐FTD | 8/11 0.73 [0.39.0.94] | 39/49 0.80 [0.66‐0.90] |
| FTD vs AD | 8/11 0.73 [0.39, 0.94] | 17/18 0.94 [0.73, 1.00] | ||||||
| FTD vs VD | 8/11 0.73 [0.39, 0.94] | 6/8 0.75 [0.35, 0.97] | ||||||
| Talbot 1998* (UK) | Memory clinic attendees with suspected dementia | 363 (158, 212 or 314) | Consecutive | 58 (FTD)/363 80 (FTD & PPA)/363 | 99mTc‐HMPAO SPECT*/single camera/visual/bilateral anterior+ and bilateral anterior & unilateral posterior++ | Clinical diagnosis FTD vs non‐FTD | 21/58 0.36+ [0.24,0.50] | 235/256 0.92+ [0.88, 0.95] |
| FTD vs AD | 37/80 0.46++ [0.35; 0.58] | 127/132 0.96++ [0.91; 0.99] | ||||||
| FTD vs VD | 37/80 0.46++ [0.35, 0.58] | 57/78 0.73++ [0.73, 0.62] | ||||||
| Launes 1991* (Finland) | Memory clinic attendees with suspected dementia | 160 (41 or 160) | Consecutive | 5/160 | 99mTc‐HMPAO* SPECT/single camera/visual/frontal bilateral or frontal‐temporal | Clinical diagnosis FTD vs non‐FTD | 2/5 0.40 [0.05,0.85] | 147/155 0.95 [0.90, 0.98] |
| FTD vs AD | 2/5 0.40 [0.05, 0.85] | 35/36 0.97 [0.85, 1.00] | ||||||
| FTD vs VD | 2/5 0.40 [0.05, 0.58] | 31/33 0.94 [0.80, 0.99] | ||||||
| Retrospective cohort studies with post‐mortem diagnosis | ||||||||
| Read 1995** (USA) | AD/FTD/JCD/MID/LBD/hydrocephalus recruited from a chart review of the University‐based speciality dementia clinic | 27 (20 or 27) | Not reported | 7/27 | 99mTc‐HMPAO SPECT/double camera/visual/bilateral frontal | Pathological diagnosis FTD vs non‐FTD | 7/7 1.0 [0.59, 1.00] | 20/20 1.0 [0.83, 1.00] |
| FTD vs AD | 7/7 1.0 [0.59, 1.00] | 13/13 1.0 [0.75, 1.00] | ||||||
| Rollin‐Sillaire 2012 (France) | AD/DLB/FTD/VD/FTLD/bvFTD/SD/PPA/PSP/ CBD recruited from the caseload database of the University memory clinic | 48 (35 or 48) | Selected from initially consecutive sample | 12/48 | 99mTc‐HMPAO SPECT/multiple camera combined visual and semi‐quantitative/frontal | Pathological diagnosis FTD vs non‐FTD | 9/12 0.75 0.43, 0.95] | 35/36 0.97 [0.85,1.00] |
| FTD vs AD | 9/12 0.75 [0.43, 0.95] | 23/23 1.0 [0.85, 1.00] | ||||||
| Case‐control studies | ||||||||
| Horn 2007 (France) | FTD/AD recruited from a number of hospitals | 173 (173) | Not consecutive or random | 91/173 | Tc‐99m ECD SPECT/multiple camera/visual/automatic classifier for whole brain | Clinical diagnosis FTD vs AD | 77/91 0.85 [0.76, 0.91] | 67/82 0.82 [0.72, 0.89] |
| Lipton 2004 (USA) | FTD/AD. Sources of recruitment not reported | 27 (23) | Not consecutive or random | 6/23 | Xenon or 99mTc‐HMPAO SPECT/multiple camera/combined visual and semiquantitative/global lateralisation | Pathological diagnosis FTD vs AD | 6/6 1.00 [0.54, 1.00] | 7/17 0.41 [0.18, 0.67] |
| McNeill 2007* (UK) | AD /FTD recruited from a tertiary care centre | 56 (56) | Not consecutive or random | 25/56 | 99mTc‐HMPAO SPECT*/single camera/combined visual and semiquantitative/bifrontal | Pathological diagnosis FTD vs AD | 20/25 0.80 [0.59, 0.93] | 19/31 0.61 [0.42, 0.78] |
| Nagao 2003 (Japan) | FTD/AD recruited from the Higher Brain Function Clinic for outpatients of the University Hospital + healthy controls (not included in the analysis) | 42 (42) | From data file of initially consecutive sample | 21/42 | 99mTc‐HMPAO SPECT multiple camera semiquantitative/Bifrontal+++ or bifrontal & posterior++++ | Clinical diagnosis FTD vs AD | 11/21 0.52+++ [0.30; 0.74] | 18/21 0.86+++ [0.64, 0.97] |
| FTD vs AD | 11/21 0.52++++ [0.30, 0.74] | 21/21 1.0++++ [0.62, 0.82] | ||||||
| Pickut 1996 (Belgium) | FTD/AD recruited from a memory clinic | 40 (40) | Not consecutive or random | 21/40 | 99mTc‐HMPAO SPECT multiple camera combined visual and semiquantitative/frontal and temporal | Clinical diagnosis FTD vs AD | 17/21 0.81 [0.58, 0.95] | 14/19 0.74 [0.49, 0.91] |
| Valotassiou 2012 (Greece) | FTLD (bvFTD; lvFTD; PNFA; CBD+PSP)/AD recruited from an outpatient memory clinic of the General Hospital 21 CBD+PSP participants not included in the analysis; they are not the patients with the target condition considered in the review | 112 (59 or 60 or 50) | Consecutive | 20 (bvFTLD)/59 21 (SD)/60 11 (PNFA)/50 | 99mTc‐HMPAO SPECT/multiple camera semiquantitative/brain Broadmann areas | Clinical diagnosis bvFTD vs AD | 15/20 0.75 [0.51, 0.91] | 31/39 0.79 0.64, 0.91] |
| SD vs AD | 17/21 0.81 [0.58, 0.95] | 20/39 0.51 [0.35, 0.68] | ||||||
| PNFA vs AD | 8/11 0.73 [0.39, 0.94] | 25/39 0.64 0.47, 0.79] | ||||||
| N = number of participants in the study; n = number of participants included in the analysis in the review; *Study used a single‐headed camera with no extended acquisition and did not use image analysis; **Study used two cameras but details of total counts can only realistically apply to the brain‐dedicated camera; + bilateral anterior brain hypoperfusion; ++ bilateral anterior & unilateral posterior brain hypoperfusion; +++bifrontal brain hypoperfusion; ++++ bifrontal & posterior brain hypoperfusion; bvFTD = behavioural variant frontotemporal degeneration; CBD = corticobasal degeneration; FTLD = frontotemporal degeneration; JCD = Jakob‐Creutzfeldt Disease; lvFTD = language variant frontotemporal degeneration; MID = mixed dementia; PM = post‐mortem; PPA = primary progressiva aphasia; PNFA = progressive non‐fluent aphasia, PSP = progressive supranuclear palsy; SD = semantic dementia; SPECT = Single photon emission computed tomography; 99mTc‐HMPAO = 99mTc‐hexamethylpropyleneamineoxime | ||||||||
| Test | No. of studies | No. of participants |
| 1 FTD versus non‐FTD: Single‐headed camera rCBF SPECT Show forest plot | 2 | 474 |
| 2 FTD versus non‐FTD: Multiple‐headed camera rCBF SPECT Show forest plot | 3 | 135 |
| 3 FTD versus AD: Single‐headed camera rCBF SPECT Show forest plot | 3 | 309 |
| 4 FTD versus AD: Multiple‐headed camera rCBF SPECT Show forest plot | 8 | 421 |