Liječenje žena koje nakon porođaja imaju anemiju zbog nedostatka željeza
Abstract
Background
Postpartum iron deficiency anaemia is caused by bleeding or inadequate dietary iron intake/uptake. This condition is defined by iron deficiency accompanied by a lower than normal blood haemoglobin concentration, although this can be affected by factors other than anaemia and must be interpreted in the light of any concurrent symptoms. Symptoms include fatigue, breathlessness, and dizziness. Treatment options include oral or intravenous iron, erythropoietin which stimulates red blood cell production, and substitution by red blood cell transfusion.
Objectives
To assess the efficacy and harms of the available treatment modalities for women with postpartum iron deficiency anaemia.
Search methods
The Cochrane Pregnancy and Childbirth Group’s Trials Register (9 April 2015); the WHO International Clinical Trials Registry Portal (ICTRP), and the Latin‐American and Caribbean Health Sciences Literature database (LILACS) (8 April 2015) and reference lists of retrieved studies.
Selection criteria
We included published, unpublished and ongoing randomised controlled trials that compared a treatment for postpartum iron deficiency anaemia with placebo, no treatment, or another treatment for postpartum iron deficiency anaemia, including trials described in abstracts only. Cluster‐randomised trials were eligible for inclusion. We included both open‐label trials and blinded trials, regardless of who was blinded. The participants were women with a postpartum haemoglobin of 120 g per litre (g/L) or less, for which treatment was initiated within six weeks after childbirth.
Non‐randomised trials, quasi‐randomised trials and trials using a cross‐over design were excluded.
Data collection and analysis
Two review authors independently assessed studies for inclusion, quality, and extracted data. We contacted study authors and pharmaceutical companies for additional information.
Main results
We included 22 randomised controlled trials (2858 women), most of which had high risk of bias in several domains. We performed 13 comparisons. Many comparisons are based on a small number of studies with small sample sizes. No analysis of our primary outcomes contained more than two studies.
Intravenous iron was compared to oral iron in 10 studies (1553 women). Fatigue was reported in two studies and improved significantly favouring the intravenously treated group in one of the studies. Other anaemia symptoms were not reported. One woman died from cardiomyopathy (risk ratio (RR) 2.95; 95% confidence interval (CI) 0.12 to 71.96; two studies; one event; 374 women; low quality evidence). One woman developed arrhythmia. Both cardiac complications occurred in the intravenously treated group. Allergic reactions occurred in three women treated with intravenous iron, not statistically significant (average RR 2.78; 95% CI 0.31 to 24.92; eight studies; 1454 women; I² = 0%; low quality evidence). Gastrointestinal events were less frequent in the intravenously treated group (average RR 0.31; 95% CI 0.20 to 0.47; eight studies; 169 events; 1307 women; I² = 0%; very low quality evidence).
One study evaluated red blood cell transfusion versus non‐intervention. General fatigue improved significantly more in the transfusion group at three days (MD ‐0.80; 95% CI ‐1.53 to ‐0.07; women 388; low quality evidence), but no difference between groups was seen at six weeks. Maternal mortality was not reported.
The remaining comparisons evaluated oral iron (with or without other food substances) versus placebo (three studies), intravenous iron with oral iron versus oral iron (two studies) and erythropoietin (alone or combined with iron) versus placebo or iron (seven studies). These studies did not investigate fatigue. Maternal mortality was rarely reported.
Authors' conclusions
The body of evidence did not allow us to reach a clear conclusion regarding the efficacy of the interventions on postpartum iron deficiency anaemia. The quality of evidence was low.
Clinical outcomes were rarely reported. Laboratory values may not be reliable indicators for efficacy, as they do not always correlate with clinical treatment effects. It remains unclear which treatment modality is most effective in alleviating symptoms of postpartum anaemia.
Intravenous iron was superior regarding gastrointestinal harms, however anaphylaxis and cardiac events occurred and more data are needed to establish whether this was caused by intravenous iron.
The clinical significance of some temporarily improved fatigue scores in women treated with blood transfusion is uncertain and this modest effect should be balanced against known risks, e.g. maternal mortality (not reported) and maternal immunological sensitisation, which can potentially harm future pregnancies.
When comparing oral iron to placebo it remains unknown whether efficacy (relief of anaemia symptoms) outweighs the documented gastrointestinal harms.
We could not draw conclusions regarding erythropoietin treatment due to lack of evidence.
Further research should evaluate treatment effect through clinical outcomes, i.e. presence and severity of anaemia symptoms balanced against harms, i.e. survival and severe morbidity.
PICO
Laički sažetak
Liječenje žena koje nakon porođaja imaju anemiju zbog nedostatka željeza
Anemija je stanje u kojem je hemoglobin u krvi manji od normalnih vrijednosti, što se može vidjeti kad se napravi pretraga krvi. Hemoglobin je molekula u crvenim krvnim stanicama koja omogućuje željezu da nosi kisik. Nedovoljan unos željeza i gubitak željeza (krvarenje) može izazvati anemiju zbog manjka željeza. Simptomi anemije su umor, nedostatak daha i vrtoglavica. Žene mogu teško krvariti tijekom poroda i mnoge trudnice već imaju anemiju, koja se može pogoršati kao rezultat krvarenja. Ozbiljna anemija može biti povezana sa smrti majke. Anemija uzrokovana nedostatkom željeza nakon poroda se češće javlja u zemljama s niskim prihodima.
Liječenje anemije uključuje tablete željeza ili se željezo u obliku otopine ubrizgava u venu (intravenski). Druga mogućnost je da se nadoknade crvene krvne stanice kroz transfuziju krvi od darivatelja krvi ili potaknuti stvaranje crvenih krvnih stanica eritropoetinom. Važno je ispitati da li je neka od terapija bolja od neke druge u ublažavanju simptoma anemije, i da li su te mogućnosti liječenja sigurne.
U ovaj Cochrane sustavni pregled uključene su 22 randomizirane kontrolirane studije s 2858 žena, te je statistički provedeno 13 usporedbi, od kojih se mnogi temelje na svega nekoliko studija koje uključuju mali broj žena. Ukupna kvaliteta dokaza bila je niska. Većina ispitivanja su provedena u zemljama s visokim primanjima.
Deset studija, s ukupno 1553 žene, usporedile su uzimanje željeza intravenski i oralno. Samo jedna studija je pokazala privremeni pozitivan učinak na umor kod intravenskog željeza. Ostali simptomi anemije nisu opisani. Jedna žena je umrla od srčanih komplikacija u skupini koja je primala intravensko željezom . Samo dvije studije su prikazale podatke o smrti majki. Alergijske reakcije su se dogodile kod tri žene, a srčane komplikacije u dvije žene u intravenoznoj skupini. Probavni simptomi bili su česti u skupini koja je uzimala željezo na usta, zbog čega je dio ispitanica odustao od sudjelovanja u istraživanju.
Jedna studija usporedila je crvene krvne stanice s transfuzijom ili bez nje. Neki rezultati umora (ali ne svi) su se privremeno poboljšali kod žena koje su dobile transfuziju. Smrtnost majki nije opisana.
Kada je uspoređeno željezo koje se uzima na usta s placebom (tri studije), nisu prikazani simptom anemije. Ostaje nepoznato da li koristi od željeza koje se uzima na usta nadmašuju dokumentirane probavne nuspojave.
Ostale mogućnosti liječenja su uspoređene u drugim studijama koje nisu istražile umor.
Vrlo malo istraživanja je prikazalo podatke o olakšanju simptoma anemije, iako je to možda najvažniji cilj liječenja.
Postojeći dokazi nam nisu omogućili da u potpunosti ocijenimo učinkovitost terapija za anemiju uzrokovanu nedostatkom željeza nakon poroda te su potrebna daljnja istraživanja.
Authors' conclusions
Summary of findings
| Intravenous iron compared with oral iron for women with postpartum iron deficiency anaemia | ||||||
| Patient or population: women with postpartum iron deficiency anaemia | ||||||
| Outcomes | Illustrative comparative risks* (95% CI) | Relative effect | No of Participants | Quality of the evidence | Comments | |
| Assumed risk | Corresponding risk | |||||
| Oral iron | Intravenous iron | |||||
| Maternal mortality | Study population | RR 2.95 | 374 | ⊕⊕⊝⊝ | 1 maternal death was reported across the included studies. | |
| 0 per 1000 | 0 per 1000 | |||||
| Moderate | ||||||
| 0 per 1000 | 0 per 1000 | |||||
| Fatigue at 14, 28, and 42 days | See comment | See comment | Not estimable | 361 | ⊕⊝⊝⊝ | No statistically significant difference was found at days 14 and 42 days. |
| Persistent anaemia symptoms ‐ not reported | See comment | See comment | Not estimable | ‐ | See comment | Not reported. |
| Infections | Study population | RR 1.7 | 718 | ⊕⊝⊝⊝ | ||
| 86 per 1000 | 146 per 1000 | |||||
| Moderate | ||||||
| 34 per 1000 | 58 per 1000 | |||||
| Constipation | Study population | RR 0.21 | 1217 | ⊕⊝⊝⊝ | ||
| 114 per 1000 | 24 per 1000 | |||||
| Moderate | ||||||
| 112 per 1000 | 24 per 1000 | |||||
| All gastrointestinal symptoms | Study population | RR 0.31 | 1307 | ⊕⊝⊝⊝ | ||
| 216 per 1000 | 67 per 1000 | |||||
| Moderate | ||||||
| 261 per 1000 | 81 per 1000 | |||||
| Anaphylaxis or evidence of hypersensitivity | Study population | RR 2.78 | 1454 | ⊕⊕⊝⊝ | 3 cases of allergic reactions all occurred in the group treated with intravenous iron. | |
| 0 per 1000 | 0 per 1000 | |||||
| Moderate | ||||||
| 0 per 1000 | 0 per 1000 | |||||
| *The basis for the assumed risk (e.g. the median control group risk across studies) is provided in footnotes. The corresponding risk (and its 95% confidence interval) is based on the assumed risk in the comparison group and the relative effect of the intervention (and its 95% CI). | ||||||
| GRADE Working Group grades of evidence | ||||||
| 1 The outcome is unlikely to be influenced by risk of bias and so we did not downgrade the evidence for this outcome: open‐label design combined with a objective outcome measure. | ||||||
| Red blood cell transfusion compared with non‐transfusion for postpartum iron deficiency anaemia | ||||||
| Patient or population: patients with postpartum iron deficiency anaemia | ||||||
| Outcomes | Illustrative comparative risks* (95% CI) | Relative effect | No of Participants | Quality of the evidence | Comments | |
| Assumed risk | Corresponding risk | |||||
| Non‐transfusion | RBC transfusion | |||||
| Maternal mortality ‐ not reported | See comment | See comment | Not estimable | ‐ | See comment | Not reported. |
| Fatigue | See comment | See comment | 519 | ⊕⊕⊝⊝ | General fatigue at 3 days was 0.8 lower (1.53 to 0.07) in the transfused group. No statistically significant difference was seen at six weeks. | |
| Persistent anaemia symptoms | Study population | Not estimable | 519 | ⊕⊝⊝⊝ | The outcome was not systematically registered/reported. | |
| See comment | See comment | |||||
| Moderate | ||||||
| Infections | Study population | RR 0.93 | 519 | ⊕⊕⊕⊝ | ||
| 92 per 1000 | 86 per 1000 | |||||
| Moderate | ||||||
| 92 per 1000 | 86 per 1000 | |||||
| Erythrocyte alloantibody formation | Study population | RR 3.03 | 519 | ⊕⊝⊝⊝ | There was no systematical screening for this outcome in the study population. | |
| 0 per 1000 | 0 per 1000 | |||||
| Moderate | ||||||
| 0 per 1000 | 0 per 1000 | |||||
| Thromboembolic events | Study population | RR 1.01 | 519 | ⊕⊕⊝⊝ | ||
| 8 per 1000 | 8 per 1000 | |||||
| Moderate | ||||||
| 8 per 1000 | 8 per 1000 | |||||
| Transfusion reactions | Study population | RR 7.08 | 519 | ⊕⊝⊝⊝ | 3 cases of transfusion reactions occurred in the transfusion group. | |
| 0 per 1000 | 0 per 1000 | |||||
| Moderate | ||||||
| 0 per 1000 | 0 per 1000 | |||||
| *The basis for the assumed risk (e.g. the median control group risk across studies) is provided in footnotes. The corresponding risk (and its 95% confidence interval) is based on the assumed risk in the comparison group and the relative effect of the intervention (and its 95% CI). | ||||||
| GRADE Working Group grades of evidence | ||||||
| 1 Downgraded two levels due to risk of bias: open‐label design combined with a subjective outcome measure. | ||||||
| Oral iron compared with placebo for women with postpartum iron deficiency anaemia | ||||||
| Patient or population: women with postpartum iron deficiency anaemia | ||||||
| Outcomes | Illustrative comparative risks* (95% CI) | Relative effect | No of Participants | Quality of the evidence | Comments | |
| Assumed risk | Corresponding risk | |||||
| Placebo | Oral iron | |||||
| Maternal mortality ‐ not reported | See comment | See comment | Not estimable | ‐ | See comment | Not reported. |
| Fatigue ‐ not reported | See comment | See comment | Not estimable | ‐ | See comment | Not reported. |
| Persistent anaemia symptoms | Study population | Not estimable | (1) | See comment | Symptoms of anaemia were not reported for the anaemic groups separately. | |
| See comment | See comment | |||||
| Moderate | ||||||
| All gastrointestinal symptoms | Study population | RR 1 | 68 | ⊕⊝⊝⊝ | ||
| 176 per 1000 | 176 per 1000 | |||||
| Moderate | ||||||
| 177 per 1000 | 177 per 1000 | |||||
| Constipation ‐ not reported | See comment | See comment | Not estimable | ‐ | See comment | Not reported. |
| *The basis for the assumed risk (e.g. the median control group risk across studies) is provided in footnotes. The corresponding risk (and its 95% confidence interval) is based on the assumed risk in the comparison group and the relative effect of the intervention (and its 95% CI). | ||||||
| GRADE Working Group grades of evidence | ||||||
| 1 Downgraded two levels due to risk of bias: open‐label design combined with a subjective outcome measure. | ||||||
| Intravenous iron with oral iron compared with oral iron for women with postpartum iron deficiency anaemia | ||||||
| Patient or population: women with postpartum iron deficiency anaemia | ||||||
| Outcomes | Illustrative comparative risks* (95% CI) | Relative effect | No of Participants | Quality of the evidence | Comments | |
| Assumed risk | Corresponding risk | |||||
| Oral iron | Intravenous iron with oral iron | |||||
| Maternal mortality | See comment | See comment | Not estimable | ‐ | See comment | In 1 study no maternal deaths were reported. The other study did not report on maternal mortality. |
| Fatigue ‐ not reported | See comment | See comment | Not estimable | ‐ | See comment | Not reported. |
| Persistent anaemia symptoms ‐ 1 week | Study population | RR 1.75 | 72 | ⊕⊝⊝⊝ | ||
| 111 per 1000 | 194 per 1000 | |||||
| Moderate | ||||||
| 111 per 1000 | 194 per 1000 | |||||
| Persistent anaemia symptoms ‐ 2 weeks | Study population | RR 0.6 | 72 | ⊕⊝⊝⊝ | ||
| 139 per 1000 | 83 per 1000 | |||||
| Moderate | ||||||
| 139 per 1000 | 83 per 1000 | |||||
| Persistent anaemia symptoms ‐ 6 weeks | Study population | RR 3 | 72 | ⊕⊝⊝⊝ | ||
| 28 per 1000 | 83 per 1000 | |||||
| Moderate | ||||||
| 28 per 1000 | 84 per 1000 | |||||
| Infections ‐ not reported | See comment | See comment | Not estimable | ‐ | See comment | Not reported. |
| Anaphylaxis or evidence of hypersensitivity | Study population | Not estimable | 0 | ⊕⊕⊝⊝ | 1 study reported 0 events, other study pooled adverse events, not reporting allergic reactions separately. Thus the effect was not estimable. | |
| See comment | See comment | |||||
| Moderate | ||||||
| *The basis for the assumed risk (e.g. the median control group risk across studies) is provided in footnotes. The corresponding risk (and its 95% confidence interval) is based on the assumed risk in the comparison group and the relative effect of the intervention (and its 95% CI). | ||||||
| GRADE Working Group grades of evidence | ||||||
| 1 Downgraded two levels due to risk of bias: the included study had high risk of attrition and reporting bias. | ||||||
| Erythropoietin (regardless of rout) with intravenous iron compared with intravenous iron for women with postpartum iron deficiency anaemia | ||||||
| Patient or population: women with postpartum iron deficiency anaemia | ||||||
| Outcomes | Illustrative comparative risks* (95% CI) | Relative effect | No of Participants | Quality of the evidence | Comments | |
| Assumed risk | Corresponding risk | |||||
| Intravenous iron | EPO (regardless of rout) with IV iron | |||||
| Maternal mortality | See comment | See comment | Not estimable | ‐ | See comment | In 1 study no maternal deaths were reported. The other study did not report on maternal mortality. |
| Fatigue ‐ not reported | See comment | See comment | Not estimable | ‐ | See comment | Not reported. |
| Thromboembolic events ‐ not reported | See comment | See comment | Not estimable | ‐ | See comment | Not reported. |
| Persistent anaemia symptoms ‐ not reported | See comment | See comment | Not estimable | ‐ | See comment | Not reported. |
| *The basis for the assumed risk (e.g. the median control group risk across studies) is provided in footnotes. The corresponding risk (and its 95% confidence interval) is based on the assumed risk in the comparison group and the relative effect of the intervention (and its 95% CI). | ||||||
| GRADE Working Group grades of evidence | ||||||
| Subcutaneous EPO 10,000 U of doses with intravenous iron compared with intravenous iron for women with postpartum iron deficiency anaemia | ||||||
| Patient or population: patients with women with postpartum iron deficiency anaemia | ||||||
| Outcomes | Illustrative comparative risks* (95% CI) | Relative effect | No of Participants | Quality of the evidence | Comments | |
| Assumed risk | Corresponding risk | |||||
| Intravenous iron | Erythropoietin 10,000 U 2 doses with intravenous iron | |||||
| Maternal mortality ‐ not reported | See comment | See comment | Not estimable | ‐ | See comment | Not reported. |
| Fatigue ‐ not reported | See comment | See comment | Not estimable | ‐ | See comment | Not reported. |
| Persistent anaemia symptoms ‐ not reported | See comment | See comment | Not estimable | ‐ | See comment | Not reported. |
| Thromboembolic events ‐ not reported | See comment | See comment | Not estimable | ‐ | See comment | Not reported. |
| *The basis for the assumed risk (e.g. the median control group risk across studies) is provided in footnotes. The corresponding risk (and its 95% confidence interval) is based on the assumed risk in the comparison group and the relative effect of the intervention (and its 95% CI). | ||||||
| GRADE Working Group grades of evidence | ||||||
| Subcutaneous EPO with oral iron compared with oral iron for women with postpartum iron deficiency anaemia | ||||||
| Patient or population: women with postpartum iron deficiency anaemia | ||||||
| Outcomes | Illustrative comparative risks* (95% CI) | Relative effect | No of Participants | Quality of the evidence | Comments | |
| Assumed risk | Corresponding risk | |||||
| Oral iron | Subcutaneous EPO with oral iron | |||||
| Maternal mortality | See comment | See comment | Not estimable | 40 | See comment | No maternal deaths were reported. |
| Fatigue ‐ not reported | See comment | See comment | Not estimable | ‐ | See comment | Not reported. |
| Persistent anaemia symptoms ‐ not reported | See comment | See comment | Not estimable | ‐ | See comment | Not reported. |
| Thromboembolic events ‐ not reported | See comment | See comment | Not estimable | ‐ | See comment | Not reported. |
| *The basis for the assumed risk (e.g. the median control group risk across studies) is provided in footnotes. The corresponding risk (and its 95% confidence interval) is based on the assumed risk in the comparison group and the relative effect of the intervention (and its 95% CI). | ||||||
| GRADE Working Group grades of evidence | ||||||
| Subcutaneous EPO with IV iron and oral iron compared with intravenous iron with oral iron for women with postpartum iron deficiency anaemia | ||||||
| Patient or population: women with postpartum iron deficiency anaemia | ||||||
| Outcomes | Illustrative comparative risks* (95% CI) | Relative effect | No of Participants | Quality of the evidence | Comments | |
| Assumed risk | Corresponding risk | |||||
| Intravenous iron + oral iron | Subcutaneous EPO + IV iron + oral iron | |||||
| Maternal mortality ‐ not reported | See comment | See comment | Not estimable | ‐ | See comment | Not reported. |
| Fatigue ‐ not reported | See comment | See comment | Not estimable | ‐ | See comment | Not reported. |
| Persistent anaemia symptoms ‐ not reported | See comment | See comment | Not estimable | ‐ | See comment | Not reported. |
| Thromboembolic events ‐ not reported | See comment | See comment | Not estimable | ‐ | See comment | Not reported. |
| *The basis for the assumed risk (e.g. the median control group risk across studies) is provided in footnotes. The corresponding risk (and its 95% confidence interval) is based on the assumed risk in the comparison group and the relative effect of the intervention (and its 95% CI). | ||||||
| GRADE Working Group grades of evidence | ||||||
Background
Description of the condition
Women who give birth may develop postpartum anaemia, either because of excessive bleeding or pre‐existing conditions in pregnancy. Severe postpartum anaemia can be a serious problem, being linked to possibly 40% of maternal deaths worldwide (WHO 2001). Anaemia also increases the risk of maternal death from other causes such as infections, malnutrition and bleeding (WHO 2012b). For some women, particularly in resource‐poor countries, postpartum anaemia is a major cause of poor health (Bergmann 2010; Gupta 2010; Khan 2006; WHO 2012a).
Anaemia, including postpartum anaemia, is defined by a lower than normal haemoglobin (Hb) value, but clinical symptoms are essential to the evaluation of its importance. Haemoglobin is the molecule contained within red blood cells (RBCs) that is responsible for transporting oxygen around the body. During pregnancy, most women have a physiologically normal reduction in their Hb concentration due to accumulation of fluid (WHO 2001). Postpartum anaemia may be caused or augmented by low dietary iron intake or uptake, blood loss, or infections (e.g. malaria), and the physiological changes during pregnancy, and bleeding associated with childbirth can aggravate the condition (WHO 1999).
Postpartum anaemia can cause symptoms such as breathlessness, palpitations (a sensation of increased heart rate), tiredness, as well as an increased risk of infections. All of these symptoms may impact a woman’s ability to breastfeed and care for her baby in general (Bergmann 2010; Milman 2011).
In pregnancy, the circulating blood volume increases to prepare the woman for blood loss at delivery. Bleeding and/or resorption of excess fluid from body tissues during and after delivery vary in extent between individuals (Milman 2011), which can have a major impact on maternal Hb concentrations. It is generally accepted that a low Hb concentration ‐ usually less than 120 grams per litre (g/L) ‐ is indicative of anaemia in postpartum women, although there is considerable variation in the precise concentration that defines anaemia, and also the time after birth at which this should be measured (Barroso 2011; Bergmann 2010; Bodnar 2005; Breymann 2010; Milman 2011; Richter 1995). Thus, postpartum anaemia is poorly defined and the Hb level in the postpartum period (six weeks after delivery) depends strongly on how long after delivery it is measured (WHO 2012a). It should be emphasised that even though an association between a low Hb and clinical symptoms has been shown in population‐based observational studies, the normal range of Hb is an arbitrarily defined statistical value derived from the population average, and an individual woman’s Hb level does not necessarily reflect the clinical symptoms she may experience (WHO 2001). Since the correlation between the different clinical symptoms and the level of Hb in postpartum anaemia is not well described, the clinical significance of a change in Hb level as a result of any given treatment remains uncertain. This is why a change in the Hb concentration is a surrogate outcome in trials of interventions for anaemia, In clinical practice however, a low Hb level is the most commonly used laboratory test to support or refute the clinical diagnosis of anaemia and it is generally understood that a major drop in the Hb level within a short time frame is likely to correlate with a large blood loss at delivery, which may lead to acute symptoms of anaemia and shock.
During pregnancy, anaemia is also defined by low Hb levels and is stratified into mild, moderate or severe anaemia (WHO 2002). However, there is no clear correlation between the type and severity of anaemia symptoms and these stratifications. Both anaemia in pregnancy (e.g. due to insufficient dietary intake) and haemorrhage during or after birth are strong predictors for postpartum iron deficiency anaemia (Bodnar 2005; Milman 2011; Reveiz 2011). Iron deficiency anaemia is a condition where the low Hb level is caused by an insufficient amount of iron in the body. To our knowledge, only one study has estimated the incidence of postpartum iron deficiency anaemia, at 4.2% among women in the United States examined within the first six months postpartum (Bodnar 2002).
Postpartum iron deficiency anaemia does not have a specific code in the International Classification of Diseases (ICD‐10), but is included in the more general code 099.0 'Anaemia complicating pregnancy, childbirth and the puerperium' (WHO ICD 2010). At this point all definitions of postpartum anaemia rely on Hb values alone, not symptoms. The classification of different stages of severity is also based on Hb values only (Milman 2012). In the postpartum period as well as in pregnancy, it remains unanswered whether any benefits of treating anaemia outweighs the harms of treatment (Reveiz 2011). Known harms depend on the choice of treatment and include e.g. gastrointestinal symptoms and allergic reactions.
Description of the intervention
There is a number of treatment options for women with postpartum anaemia, and the optimal treatment, dose, and balance between benefits and harms may vary depending on the timing and severity of anaemia, clinical symptoms, harms of the intervention, available resources and factors such as geographic location, socioeconomic status and education. The treatment modalities described in this review include iron supplementation administered either orally or directly into a vein or muscle (parenterally), erythropoietin which stimulates RBC production, and substitution of RBCs by blood transfusion.
How the intervention might work
Oral iron therapy
Oral iron therapy has been used for many years as a treatment for iron deficiency anaemia in general (Dudrick 1986), as well as in pregnancy (Pena‐Rosas 2012). Oral iron is often the recommended treatment for mild to moderate iron deficiency anaemia (Bodnar 2005) because of its low cost and ease of use. The body has a limited capacity to absorb iron from the gut, and prolonged treatment over a period of several months is often required to increase the Hb concentration and relieve symptoms of anaemia (Auerbach 2008; Milman 2012; Van Wyck 2007; Westad 2008). Gastrointestinal (GI) adverse effects, such as constipation and nausea are common in oral iron therapy (al‐Momen 1996; Bhandal 2006). This may affect the women's compliance with treatment and consequently prevent correction of the anaemia.
Folate
Folate, also called folic acid and vitamin B9, is a substance found in many foods and is naturally available in especially high concentrations in green vegetables. Folate is involved in the synthesis of DNA, cell division and growth in human cells. Folate deficiency can cause megaloblastic anaemia, not iron deficiency anaemia. However, folate is often added as an adjunct to oral iron because malnutrition often results in a lack of both iron and folate in the body. The long‐term effect of folate supplementation and continuously high levels of folate in the blood have been associated to an increased risk of certain cancers (Almeida 2010). In this review, we will not consider folate supplementation as an independent treatment of anaemia, but accept studies where it is a part of other types of treatment for postpartum iron deficiency anaemia.
Parenteral iron therapy
Parenteral administration of iron has been shown to produce a more rapid increase in the Hb concentration in iron deficiency anaemia during pregnancy (Milman 2012). Parenterally administered iron has been associated with pain and redness (erythema) at the injection site and, rarely, anaphylactic reactions characterised by itching, redness and in severe cases angioedema (swelling), vascular collapse, bronchospasm (constriction of the airways) and shock (Barish 2012; Breymann 2008; Kochhar 2013; Seid 2008; Wysowski 2010). The use of new low‐molecular iron (such as iron sucrose and ferric carboxymaltose) may lower the risk of anaphylactic reactions but these products are expensive compared with oral iron therapy, which does not have these serious harms (Khalafallah 2012; Kochhar 2013).
Erythropoietin
Erythropoietin (EPO) is a hormone produced in the kidneys when blood oxygen levels are low. It acts to stimulate erythropoiesis (blood formation) in the bone marrow (Oster 2012). Initially, EPO was used for anaemia associated with renal (kidney) disease. Later, EPO was used to treat other forms of anaemia and has been used as an alternative to blood transfusion for the treatment of iron deficiency anaemia, including postpartum iron deficiency anaemia (Bergmann 2010; Oster 2012). Adverse effects of EPO treatment include mild flu‐like symptoms such as sore throat, cough, fever, muscle pains and weakness, headache and fatigue. Uncommon but more serious adverse effects include hypertension, thromboembolic complications, seizures, and pure red‐cell aplasia (Dodd 2004; Kliger 2012). Recent research has shown an association with certain haematological cancers, which led to a Food and Drug Agency (FDA) black box warning (label on the product warning against serious or life‐threatening risks). The use of EPO is now restricted to specific patient groups and is rarely used in postpartum anaemic patients (Bunn 2009; Oster 2012).
Blood transfusion
Transfusion of allogeneic blood can be used in the treatment of postpartum anaemia and may be life‐saving in the case of acute or major bleeding at the time of giving birth (Montufar‐Rueda 2013). However, experimentally depleting healthy volunteers to an Hb of 50 g/L in a controlled setting, elicited cardiac compensatory mechanisms, but did not compromise health (Weiskopf 1998). Adverse reactions rather than clinical benefit has been found when transfusing mixed‐patient populations with mild to moderate anaemia (Carson 2012; Rohde 2014; Salpeter 2014). Thus, transfusion is generally not recommended following small to moderate bleedings in patients with a normal physiologic response to anaemia. Transfusion of one unit of RBC usually increases the Hb by 10 g/L in the non‐bleeding, haemodynamically stable patient (Wiesen 1994). There are associated risks, including donor‐transmitted infections (particularly hepatitis and human immunodeficiency virus (HIV)), transfusion‐associated circulatory overload (TACO), and a variety of immunologic reactions such as fever, urticaria (hives), anaphylaxis, transfusion‐related lung injury (TRALI) or antibody formation which may interfere with future pregnancies (Fuller 2010; Hendrickson 2009; SHOT Report 2011; Villanueva 2013). Blood transfusion may rarely cause acute haemolysis (breakdown of RBCs) if incompatible blood is administered by mistake (Fuller 2010). Blood transfusions are expensive, as costs include screening for infection, cross‐matching, storage and sterile and safe administration of blood products (Shander 2010). In low‐income countries or during disasters, blood for transfusion may not be readily available.
Why it is important to do this review
Postpartum anaemia caused by insufficient iron intake and/or bleeding (postpartum iron deficiency anaemia) is a common condition affecting women after childbirth and may be associated with symptoms that can influence survival, health and the ability to care for the baby. The treatment modalities available for postpartum iron deficiency anaemia have harms, some of which are serious. Since all women bleed at delivery, it is a common practice to administer treatment for postpartum iron deficiency anaemia, to enable the women to synthesise new RBCs effectively. Some populations may benefit more than others, and in some populations and categories of disease severity, treatment may be unnecessary, ineffective or even harmful. Women and care givers need reliable estimates of the benefits and harms of the available treatments for postpartum anaemia so that they can be balanced for each individual patient.
This review is an update of an earlier review by Dodd 2004.
Objectives
To assess the efficacy and harms of the available treatment modalities for women with postpartum iron deficiency anaemia. These include oral and parenteral iron, erythropoietin, and blood transfusion.
Methods
Criteria for considering studies for this review
Types of studies
We included published, unpublished and ongoing randomised controlled trials that compared a treatment for postpartum iron deficiency anaemia with placebo, no treatment, or another treatment for postpartum iron deficiency anaemia, including trials described in abstracts only. Cluster‐randomised trials were eligible for inclusion. We included both open‐label trials and blinded trials, regardless of who was blinded. Non‐randomised trials, quasi‐randomised trials and trials using a cross‐over design were excluded.
Types of participants
Women with a postpartum Hb value of 120 g/L (7.4 millimoles per litre) or less, with treatment initiated up to six weeks after giving birth. We distinguished between socioeconomic population groups whenever possible, as this factor may affect the response to treatment, but included all.
Types of interventions
Treatment for postpartum iron deficiency anaemia started within the first six weeks after giving birth compared with placebo, no treatment or another treatment.
Currently, accepted treatment for iron deficiency anaemia includes blood transfusion or iron supplementation administered orally or parenterally, either alone or in combination with folate and/or erythropoietin.
Folate supplementation was not considered as an independent treatment of iron deficiency anaemia, but was accepted as a part of other types of treatment for postpartum iron deficiency anaemia.
New treatment modalities appropriate for iron deficiency anaemia will be included in future updates.
Types of outcome measures
Primary outcomes
-
Maternal mortality: We considered that no women died only if: a) this was stated explicitly, or b) no dropouts occurred during follow‐up, or c) contact authors provided this information on request. Mortality was considered present only if: a) stated explicitly in a published report or b) contact authors provided this information on request. Mortality was assessed as not reported if a) no mention of dropouts or their causes, b) all dropouts not accounted for, c) dropouts not explicitly reported to be alive at the end of the follow‐up period.
-
Fatigue: as reported by the women ‐ verbalisation of fatigue or lack of energy and inability to maintain usual routines; measured by a scale or questionnaire; or as defined by the trial authors. Short‐term and long‐term results, thus the minimal and maximal time from baseline.
Secondary outcomes
-
Persistent anaemia symptoms during treatment. Any of the following symptoms: dyspnoea, tachypnoea, tachycardia, palpitations, orthostatic dizziness, syncopation, paleness.
-
Psychological well being, including cognitive performance, measured by the 'Blues Questionnaire' (Kennerley 1989), 'Self‐report symptom inventory 90 [SCL‐90‐R]' (Schmitz 1999), 'SF36 [Medical Outcomes Study Short Form]' (Ware 2000) or similar questionnaire; or as defined by the trial authors. Only short‐term results, thus the minimal time from baseline.
-
Urinary tract infection, endometritis, or other infections (as defined by the trial authors).
-
Compliance to treatment (as defined by the trial authors).
-
Breastfeeding (at hospital discharge; six weeks postpartum; six months postpartum).
-
Length of hospital stay.
-
Any adverse events during treatment (each type of harm analysed individually, when possible).
-
Number of RBC transfusions (number of transfused women and number of RBC units per woman).
For outcomes of other psychological well being we did not apply any restrictions regarding follow‐up periods to avoid excluding data on any long‐term benefits or harms. We did not apply language restrictions.
We planned to include the following outcomes in the 'Summary of findings' tables of the review, using the Grade Profiler programme (GRADEpro 2014).
-
Maternal mortality.
-
Fatigue.
-
Constipation (for oral iron substitution).
-
Allergic reactions (for intravenous iron).
The comparisons included in the 'Summary of findings' tables were chosen based on relevance to current treatment standards according to clinical experts. Therefore we chose not to include treatment with intravenous (IV) erythropoietin (EPO) or yeast extract in the 'Summary of findings' tables, as these methods are no longer practiced. For the treatment‐specific outcomes listed above (constipation and allergic reactions), the results were included in the 'Summary of findings' tables if the specific treatment was present in only one of the study arms.
We chose to include additional outcomes in the 'Summary of findings' tables, which we found important for clinical decision making for each individual treatment modality, when this treatment was present in only one of the study arms. For comparisons with IV iron this outcome was infections. For comparisons with oral iron we included all GI symptoms combined. For comparisons with RBC transfusions we included infections, thromboembolic events and transfusion‐specific adverse events, such as alloantibody formation and transfusion reactions. For comparisons with EPO, thromboembolic events were essential. For all comparisons which met the above mentioned criteria, we found it important to include anaemia symptoms.
Search methods for identification of studies
The following methods section of this review is based on a standard template used by the Cochrane Pregnancy and Childbirth Group.
Electronic searches
We contacted the Trials Search Co‐ordinator to search the Cochrane Pregnancy and Childbirth Group’s Trials Register (9 April 2015).
The Cochrane Pregnancy and Childbirth Group’s Trials Register is maintained by the Trials Search Co‐ordinator and contains trials identified from:
-
monthly searches of the Cochrane Central Register of Controlled Trials (CENTRAL);
-
weekly searches of MEDLINE (Ovid);
-
weekly searches of Embase (Ovid);
-
monthly searches of CINAHL (EBSCO);
-
handsearches of 30 journals and the proceedings of major conferences;
-
weekly current awareness alerts for a further 44 journals plus monthly BioMed Central email alerts.
Details of the search strategies for CENTRAL, MEDLINE, Embase and CINAHL, the list of handsearched journals and conference proceedings, and the list of journals reviewed via the current awareness service can be found in the ‘Specialized Register’ section within the editorial information about the Cochrane Pregnancy and Childbirth Group.
Trials identified through the searching activities described above are each assigned to a review topic (or topics). The Trials Search Co‐ordinator searches the register for each review using the topic list rather than keywords.
In addition to the search carried out by the Trials Search Co‐ordinator, we searched the following trial registers for planned, ongoing or unpublished trials (8 April 2015):
-
WHO ICTRP (http://apps.who.int/trialsearch/);
-
LILACS (www.bireme.br).
The search strategy is described in Appendix 1.
Searching other resources
We searched the citation lists of relevant publications, review articles and included studies and contacted manufacturers of parenteral iron pharmaceuticals for knowledge of any ongoing trials.
We did not apply any language or date restrictions.
Data collection and analysis
Selection of studies
Two review authors (Veronika Markova (VM) and Astrid Norgaard (AN)) independently assessed for inclusion all the studies identified. All disagreements were resolved through discussion.
Data extraction and management
We designed a form to extract data. The form contained information on bias assessment, inclusion and exclusion criteria, number of participants and dropouts, demographic data, treatment regimens, and available information on the outcome measures pre‐specified for this review.
For eligible studies, VM and AN extracted the data using the agreed form, blinded to each others results. We resolved discrepancies through discussion or, when required, we consulted Karsten Juhl Jørgensen (KJ) at the Nordic Cochrane Centre. We entered the data into Review Manager software (RevMan 2014) and checked for accuracy. When information regarding any of the above information items was unclear, we attempted to contact authors of the original reports to provide further details.
When we identified trials with more than two study arms, we included only the relevant arms in our meta‐analysis. The remaining arm(s) was described and compared with the control arm. If comparisons in the trial could not be included in a meta‐analysis, but the trial otherwise fulfilled our inclusion criteria, we described the results in separate comparisons.
Assessment of risk of bias in included studies
Two review authors (VM and AN) independently assessed risk of bias for each study using the criteria outlined in the Cochrane Handbook for Systematic Reviews of Interventions and a 'Risk of bias' table (Higgins 2011). As per Cochrane standards, we assessed selection bias, performance bias, detection bias, attrition bias, reporting bias, and other bias. Each type of bias was assessed as low, high, or unclear. All disagreements were resolved by discussion, or by involving a third assessor (KJ or Jens Langhoff‐Roos (JLR)).
We made explicit judgements about whether studies were at high risk of bias, according to the criteria given in the Cochrane Handbook (Higgins 2011). Where possible, we assessed the likely magnitude and direction of the bias and whether we considered if it was likely to impact the findings. We explored the impact of bias through Sensitivity analysis.
We used Grade Profiler (GRADEpro 2014) to make 'Summary of findings' tables. We included our primary outcomes, constipation (when treated with oral iron), and allergic reactions (when treated with intravenous (IV) iron). We also included additional outcomes, which we considered important for the decision‐making process.
Measures of treatment effect
Dichotomous data
For dichotomous data, we presented results as a summary risk ratio with 95% confidence intervals from a meta‐analysis, if possible.
Continuous outcome data
For continuous outcome data we used the mean difference if outcomes were measured in the same way between trials. We planned to use the standardised mean difference to combine trial results that measured the same outcome, but used different methods.
Unit of analysis issues
Cluster‐randomised trials
We planned to include cluster‐randomised trials in the analyses along with individually‐randomised trials, but none were found. In future updates, if included, we will adjust the standard error of any cluster‐randomised trials using the methods described in the Cochrane Handbook section 16.3.6, if relevant. We will use an estimate of the intra‐cluster correlation co‐efficient (ICC) derived from the trial (if possible), from a similar trial or from a study of a similar population. If we use ICCs from other sources, we will report this and conduct sensitivity analyses to investigate the effect of variation in the ICC. If we identify both cluster‐randomised trials and individually‐randomised trials, we plan to synthesise the relevant information from both types of studies if there is little heterogeneity between the results from trials using the two types of study design, and if the interaction between the effect of the intervention and the choice of randomisation unit is considered to be unlikely. We also plan to perform a subgroup analysis to investigate the effects of the randomisation unit (cluster or individual).
Dealing with missing data
For each included study, we noted the level of attrition. We planned to explore the impact of including studies with high levels of missing data (more than 10%) in the overall assessment of treatment effect through sensitivity analysis, using our primary outcomes (maternal mortality and fatigue).
For all outcomes, we carried out analyses, as far as possible, on an intention‐to‐treat basis, i.e. we attempted to include all participants randomised to each group in the analyses, and all participants were analysed in the group to which they were allocated, regardless of whether or not they received the allocated intervention. The denominator for each outcome in each trial was the number randomised minus the number of participants whose outcome data were known to be missing.
Assessment of heterogeneity
We assessed statistical heterogeneity in each meta‐analysis using the T², I² and Chi² statistics. We regarded heterogeneity as substantial if an I² was greater than 30% and either a T² was greater than zero, or if there was a low P value (less than 0.10) in the Chi² test for heterogeneity.
Assessment of reporting biases
We planned to investigate reporting biases (such as publication bias) if there were 10 or more studies in a meta‐analysis, using funnel plots and to assess the funnel plot asymmetry visually. In future updates, if asymmetry is suggested by a visual assessment, we will perform exploratory analyses.
Data synthesis
Statistical analysis was performed with Review Manager software (RevMan 2014). We used fixed‐effect meta‐analysis for data where it was reasonable to assume that the studies were estimating the same underlying treatment effect: i.e. where trials were examining the same intervention, and the trials’ populations and methods were judged sufficiently similar.
If clinical heterogeneity was sufficient to expect that the underlying treatment effects differed between trials, we used random‐effects meta‐analysis to produce an overall summary, if an average treatment effect across trials was considered clinically meaningful. The random‐effects summary was treated as the average range of possible treatment effects and we discussed the clinical implications of treatment effects differing between trials. If the estimated treatment effect in the included trials was not clinically meaningful, we did not combine trials.
When we used random‐effects meta‐analyses, the results were presented as the average treatment effect with 95% confidence intervals, and the estimates of T² and I².
Subgroup analysis and investigation of heterogeneity
We planned to investigate heterogeneity (if substantial), using subgroup analyses and sensitivity analyses. In future updates, if more data become available and heterogeneity is identified, we will consider whether an overall summary is meaningful, and if it is, use random effects meta‐analysis to produce it.
We planned to carry out the following subgroup analyses, if necessary.
-
Study setting: low‐ versus high‐income populations; high‐ versus low‐education status.
-
Type of intravenous iron therapy: iron sucrose versus iron carboxymaltose.
-
Dose administered: high versus low dose.
-
Duration of treatment: four weeks versus longer.
-
Presence of an adjunct to iron supplementation: folate versus no folate.
-
Source of funding: public versus corporate.
We planned to assess potential subgroup differences by interaction tests available within RevMan (RevMan 2014) and to report the results of subgroup analyses quoting the χ2 statistic and P value, and the interaction test I² value.
Sensitivity analysis
We planned to carry out a sensitivity analysis based on trial design, thus excluding trials with a high risk of selection, performance, and detection bias.
We also planned to carry out sensitivity analyses to explore the effects of random‐effects analyses for outcomes with statistical heterogeneity and the effects of any assumptions made such as the value of the ICC used for cluster‐randomised trials.
We planned sensitivity analyses only for our primary outcomes (maternal mortality and fatigue). Provided that enough data become available, we will attempt to carry out sensitivity analyses for all comparisons in future updates.
Results
Description of studies
For an individual description of the studies please see Characteristics of included studies, Characteristics of excluded studies, Characteristics of studies awaiting classification, and Characteristics of ongoing studies.
Results of the search
We retrieved 57 (9 April 2015) articles from the Pregnancy and Childbirth Group's Trials Register, 16 (8 April 2015) from the WHO International Clinical Trials Registry Portal (ICTRP), and 154 (8 April 2015) from LILACS. After excluding duplicates, 178 records remained. We screened these records for relevance by title and abstracts, and excluded 118. One discontinued study is awaiting classification and four studies based on five reports are ongoing. The remaining 54 full text articles were assessed for eligibility. Of these, 17 studies based on 19 reports were excluded (Figure 1, Study flow diagram). In addition, we assessed seven studies that were excluded by the previous authors of this review, and agreed with their assessment. Of these, one trial also appeared in our electronic search, resulting in 17 excluded studies.

Study flow diagram.
No additional randomised controlled trials (RCTs) were found through screening of the citation lists of relevant publications.
We attempted to contact the trial authors (contact information from articles or of the Internet) for additional information or clarification of methods used for all included trials and trials with an unclear assessment for eligibility. We received the additional information from 10 individual studies (Backe 2009;Daniilidis 2011; Froessler 2013; Giannoulis 2009; Guerra 2012; Krafft 2011; Prick 2014; Van Wyck 2007; Wagstrom 2007; Westad 2008).
The remaining authors did not respond (Bhandal 2006; Breymann 1996; Breymann 2000; Jain 2013; Makrydimas 1998; Mumtaz 2011; Perello 2014; Seid 2008; Tam 2005; Verma 2011), were not possible to contact due to lack of contact information (Beard 2005; Krauss 1972; Lebrecht 1995; Meyer 1995), or did not have resources to provide the requested information (Breymann 2008).
Included studies
Design and sample sizes
We included 22 RCTs with 2858 women (Beard 2005; Bhandal 2006; Breymann 1996; Breymann 2000; Breymann 2008; Froessler 2013; Guerra 2012; Jain 2013; Krafft 2011; Krauss 1972; Lebrecht 1995; Makrydimas 1998; Meyer 1995; Mumtaz 2011; Perello 2014; Prick 2014; Seid 2008; Tam 2005; Van Wyck 2007; Verma 2011; Wagstrom 2007; Westad 2008).
Participants
All the participants were women with postpartum anaemia who received treatment within six weeks postpartum.
Interventions
Itravenous iron versus oral iron
Intravenous (IV) iron (either iron carboxymaltose or iron sucrose) was compared with oral ferrous sulphate in 10 studies including a total of 1553 women (Bhandal 2006; Breymann 2008; Froessler 2013; Guerra 2012; Jain 2013; Mumtaz 2011; Seid 2008; Van Wyck 2007; Verma 2011; Westad 2008). One study added oral iron to those originally assigned to receive IV iron after four weeks (Westad 2008).
The follow‐up periods varied from 14 to 84 days between the studies. Socioeconomic status was clearly stated as being low in only one study (Froessler 2013). We did not make assumptions regarding socioeconomic status based on the name of the country.
Red blood cell transfusion
Red blood cell (RBC) transfusion was compared with non‐intervention (standard of care) in one study with 519 women (Prick 2014). The treatment of the non‐intervention arm was decided by the clinicians. This trial reported on all pre‐defined outcomes for this review, except maternal mortality. Follow‐up was six weeks.
Oral iron
Oral iron was compared with either placebo or no treatment in three studies with a total of 315 women (Beard 2005; Krauss 1972; Tam 2005). The preparations used in each trial contained various additives, such as vitamin C, vitamin B, and folic acid. Follow‐up varied from 30 days to nine months among studies. One RCT only included women of low socioeconomic status (Beard 2005). The remaining studies did not specify this. The trial by Krauss 1972 included three study arms. The trial by Tam 2005 was based on two anaemic study groups (one treated and one given placebo) and one non‐anaemic group. The study was included based on intervention, which fulfilled our criteria. However, the majority of the results were combined for both anaemic groups, thus not distinguishing between the treated and untreated group.
Inravenous iron and oral iron versus oral iron
Intravenous iron with oral iron was compared with IV placebo and active oral iron treatment in two studies (Breymann 2000; Perello 2014), including a total of 112 women. Follow‐up was two and six weeks, respectively.
Erythropoietin
Erythropoietin and IV iron was compared with IV iron alone in two studies with a total of 100 women (Krafft 2011; Wagstrom 2007). In the trial by Wagstrom 2007, EPO was given subcutaneously (SC) in two different doses in two different EPO groups (total of 40,000 U and 20,000 U). The EPO group with a total dose of 20,000 U was analysed separately. In Krafft 2011, EPO was given IV. Follow‐up was two weeks in both studies.
Erythropoietin combined with IV iron followed by oral iron was compared with IV iron alone followed by oral iron in three studies with a total of 186 women (Breymann 1996; Breymann 2000; Lebrecht 1995). Two of the studies had three study arms (Breymann 1996; Breymann 2000). In one study EPO was given either SC or IV (Breymann 1996), and one study also had a study arm that only received oral iron (Breymann 2000). We compared study arms with similar treatment across studies.
Subcutaneous EPO and oral iron were compared with oral iron in one study with 40 women (Makrydimas 1998). Follow‐up was 40 days.
Intravenous EPO was compared with placebo, without iron supplementation in one study with 71 women (Meyer 1995). Follow‐up was five days.
Outcomes
All of the included publications reported at least one clinical outcome measure that was preplanned for this review. These 22 publications also reported laboratory values such as Hb, ferritin or others.
Of all included studies, six reported on maternal mortality (Breymann 2000; Guerra 2012; Krafft 2011; Lebrecht 1995; Makrydimas 1998; Van Wyck 2007), three on fatigue (Prick 2014; Van Wyck 2007; Westad 2008), three on anaemia symptoms (Perello 2014; Prick 2014; Tam 2005), seven on psychological well being (Beard 2005; Meyer 1995; Perello 2014; Prick 2014; Van Wyck 2007; Wagstrom 2007; Westad 2008), six on infections (Breymann 2008; Guerra 2012; Krafft 2011; Prick 2014; Van Wyck 2007; Wagstrom 2007), nine on compliance (Bhandal 2006; Breymann 2008; Guerra 2012; Jain 2013; Krafft 2011; Prick 2014; Van Wyck 2007; Verma 2011; Westad 2008), four on breastfeeding (Krafft 2011; Makrydimas 1998; Prick 2014; Tam 2005), four on length of hospital stay (Makrydimas 1998; Perello 2014; Prick 2014; Verma 2011), and 20 on adverse events during treatment. The studies that did not report on adverse events were Beard 2005 and Meyer 1995. Eleven studies reported on the use of blood transfusions as a rescue treatment (Bhandal 2006; Breymann 1996; Breymann 2000; Breymann 2008; Froessler 2013; Krafft 2011; Makrydimas 1998; Perello 2014; Prick 2014; Wagstrom 2007; Westad 2008).
We chose not to consider placebo treatment as a type of intervention, based on the lack of evidence for a substantial placebo effect (Hróbjartsson 2010). Groups with inactive placebo were therefore considered comparable with groups not receiving treatment. Also, we chose not to distinguish between SC and IV EPO administration, as we did not expect the effect to be influenced by the route of administration.
This allowed five comparisons based on interventions with more than one study. The rest of the studies and the remaining study arms were analysed separately. Thus, a total of 13 comparisons were conducted in this review.
The included studies are described in detail in the Characteristics of included studies tables. Only our preplanned outcomes chosen for this review were described and analysed.
Excluded studies
We excluded 17 studies. Reasosns for exclusion were inadequate randomisation methods, mixed anaemic and non‐anaemic population without subgroup analysis, summary of two included and one excluded study, analyses based on both antepartum and postpartum anaemia, no definition of the postpartum period (thus including women enrolled more than six weeks postpartum), lack of a control arm, investigation of differences in screening strategies rather than different interventions, and interventions found as not appropriate for treatment of iron deficiency anaemia. For further details, please see Characteristics of excluded studies.
Risk of bias in included studies
The 'Risk of bias' assessment is summarised in Figure 2 and Figure 3.

'Risk of bias' graph: review authors' judgements about each risk of bias item presented as percentages across all included studies.

'Risk of bias' summary: review authors' judgements about each risk of bias item for each included study.
Allocation
Random sequence generation
Low risk of bias was found in 12 studies (Bhandal 2006; Froessler 2013; Guerra 2012; Jain 2013; Krafft 2011; Perello 2014; Prick 2014; Seid 2008; Tam 2005; Van Wyck 2007; Wagstrom 2007; Westad 2008). Ten studies had unclear risk of bias, as the random sequence generation method was not described (Beard 2005; Breymann 1996; Breymann 2000; Breymann 2008; Krauss 1972; Lebrecht 1995; Makrydimas 1998; Meyer 1995; Mumtaz 2011; Verma 2011).
Allocation concealment
Allocation concealment was adequately described in 13 studies (Beard 2005; Bhandal 2006; Breymann 1996; Breymann 2000; Froessler 2013; Guerra 2012; Krafft 2011; Perello 2014; Prick 2014; Tam 2005;Van Wyck 2007;Wagstrom 2007; Westad 2008). The method was not described and thus the risk of bias was unclear in the remaining nine studies (Breymann 2008; Jain 2013; Krauss 1972; Lebrecht 1995; Makrydimas 1998; Meyer 1995; Mumtaz 2011; Seid 2008; Verma 2011).
Blinding
Performance bias
In one study, the method of blinding was adequately described and it was clear who was blinded (Perello 2014).
Six studies had an unclear risk of bias: two placebo‐controlled studies described the blinding method as double‐blind, but it was unclear who was blinded (Lebrecht 1995; Meyer 1995). In the study reported by Beard 2005 it was unclear if all treatment components (iron, folate, vitamin C) were prepared in a single tablet and whether this tablet resembled the placebo tablet. In Tam 2005 it was reported that although the trial was double‐blinded, the participants reported stool discolorations when receiving active treatment.
The majority of studies were open‐label due to different non‐blinded administration routes and thus considered at high risk (Bhandal 2006; Breymann 1996; Breymann 2000; Breymann 2008; Froessler 2013; Guerra 2012; Jain 2013; Krafft 2011; Krauss 1972; Makrydimas 1998; Mumtaz 2011; Prick 2014; Seid 2008; Van Wyck 2007; Verma 2011; Wagstrom 2007; Westad 2008).
Detection bias
Seven studies were rated as having unclear risk of bias: in two studies described as double‐blinded it was not described who was blinded (Lebrecht 1995; Meyer 1995). In Perello 2014, it was not clear whether personnel who handled self‐rated questionnaires were blinded. In Tam 2005 it was unclear whether the women were able to guess their treatment based on the change in stool colour. The outcomes in this trial were subjective and reported by the women. The risk of detection bias therefore depends on the women's knowledge of the correlation between iron treatment and stool discolouration and the clinician's knowledge of the discolouration at the time when the remaining outcomes were registered. This was not described and the risk of bias was therefore rated as unclear.
In the study reported by Beard 2005, it was not clear from study description who exactly was blinded during the trial and whether the placebo tablet and treatment were sufficiently similar to prevent the patients from guessing the group. Thus the subjective (patient registered) outcome of psychological well being may have been affected by insufficient blinding.
High risk of bias was found in seventeen studies due to open‐label trial design (Bhandal 2006; Breymann 1996; Breymann 2000; Breymann 2008; Froessler 2013; Guerra 2012; Jain 2013; Krafft 2011; Krauss 1972; Makrydimas 1998; Mumtaz 2011; Prick 2014; Seid 2008; Van Wyck 2007; Verma 2011; Wagstrom 2007; Westad 2008). Maternal mortality is one of the few outcome measures which is most probably not affected by a lack of blinding. However, this outcome was rarely reported.
Incomplete outcome data
Information on dropouts and withdrawals after randomisation was reported in 19 studies (Beard 2005; Bhandal 2006; Breymann 2000; Breymann 2008; Froessler 2013; Guerra 2012; Jain 2013; Krafft 2011; Krauss 1972; Lebrecht 1995; Makrydimas 1998; Mumtaz 2011; Perello 2014; Prick 2014; Seid 2008; Tam 2005; Van Wyck 2007; Wagstrom 2007; Westad 2008). Three trial authors provided additional information on dropout rates (Froessler 2013; Van Wyck 2007; Wagstrom 2007).
Dropout varied greatly across studies. Dropout rates after randomisation were lower than 5% in six studies (Bhandal 2006; Breymann 2000; Krafft 2011; Lebrecht 1995; Makrydimas 1998; Seid 2008), between 5% and 9.9% in three studies (Krauss 1972;Mumtaz 2011; Van Wyck 2007), between 10% and 19.9% in six studies (Froessler 2013; Guerra 2012; Jain 2013; Perello 2014; Tam 2005; Wagstrom 2007), and 20% or more in four studies (Beard 2005; Breymann 2008; Prick 2014; Westad 2008). However, for Beard 2005, the missing data were given as lost to follow‐up, not as discontinuation of treatment. The numbers are therefore very high and probably overestimate the actual dropout rate. Three studies did not report sufficient information to calculate the dropout rate after randomisation (Breymann 1996; Meyer 1995; Verma 2011).
Low risk of bias was found in nine studies with a low dropout rate or an equal distribution of dropouts across groups (Bhandal 2006; Breymann 2000; Jain 2013; Krafft 2011; Krauss 1972; Lebrecht 1995; Makrydimas 1998; Mumtaz 2011; Seid 2008).
High risk of bias was found in 10 studies, due to a high dropout rate and/or unequal distribution across groups (Beard 2005; Breymann 2008; Froessler 2013; Meyer 1995; Perello 2014; Prick 2014; Tam 2005; Van Wyck 2007; Wagstrom 2007; Westad 2008).
An unclear risk of attrition bias was found in three studies. In one study it was not possible to assess if the dropouts were in fact not related to the trial (Guerra 2012). In three studies it was not mentioned whether or not any patients dropped out after randomisation (Breymann 1996; Verma 2011).
Selective reporting
We applied strict criteria when evaluating reporting bias because we consider mortality and adverse events as extremely important outcomes, and as per our method section we rated the studies as high risk if the study failed to include results of a key outcome that would have been expected to be reported (i.e. mortality). Therefore, only two studies were rated as having low risk of reporting bias (Krafft 2011; Van Wyck 2007).
Often the trial authors stated that the objectives of their trial were efficacy and safety, but did not specify which preplanned outcome measures were going to be used to evaluate efficacy. Two studies were rated as having unclear risk of bias because no preplanned outcomes were specified (Breymann 2000; Guerra 2012).
High risk of bias was found in 18 studies: 16 of these did not report on adverse events and/or maternal mortality (Beard 2005; Bhandal 2006; Breymann 1996; Breymann 2008; Froessler 2013; Jain 2013; Krauss 1972; Meyer 1995; Mumtaz 2011; Perello 2014; Prick 2014; Seid 2008; Tam 2005; Verma 2011; Wagstrom 2007; Westad 2008), and in two studies there was a lack of data to support their conclusions on quality of life (Lebrecht 1995; Makrydimas 1998). The study by Verma 2011 did not report on the following preplanned outcomes which were stated in the 'aims and objectives' section of the published report: patient satisfaction, quality of life, cost of treatment, length of hospital stay, use of blood transfusion, impact on stress, depression, cognitive function, and breastfeeding.
Other potential sources of bias
One study was found to have unclear risk of bias because the Hb level for inclusion was not stated (Krauss 1972). Three studies were found to have a high risk of bias because of significant errors in the published reports (Mumtaz 2011; Van Wyck 2007; Verma 2011). For further description, please see Characteristics of included studies.
Effects of interventions
See: Summary of findings for the main comparison Intravenous iron compared with oral iron for women with postpartum iron deficiency anaemia (Comparison 1); Summary of findings 2 Red blood cell transfusion compared with non‐transfusion (Comparison 2); Summary of findings 3 Oral iron compared with placebo (Comparison 3); Summary of findings 4 Intravenous iron with oral iron compared with oral iron (Comparison 6); Summary of findings 5 Erythropoietin (regardless of rout) with intravenous iron compared with intravenous iron (Comparison 7); Summary of findings 6 Subcutaneous EPO 10,000 U of doses with intravenous iron compared with intravenous iron (Comparison 8); Summary of findings 7 Subcutaneous EPO with oral iron compared with oral iron (Comparison 10); Summary of findings 8 Subcutaneous EPO with intravenous iron and oral iron compared with intravenous iron with oral iron (Comparison 12)
Comparison 1: IV iron versus oral iron
Intravenous (IV) iron treatment was compared with oral iron in 10 studies with a total of 1553 women (Bhandal 2006; Breymann 2008; Froessler 2013; Guerra 2012; Jain 2013; Mumtaz 2011; Seid 2008; Van Wyck 2007; Verma 2011; Westad 2008). IV iron was in the form of either iron sucrose (seven studies) or iron‐carboxymaltose (three studies). Doses differed across the trials with a range of 300 mg to 2500 mg in total dose. In several studies doses were individually calculated using the Ganzoni formula, estimating the iron deficit in each patient. Oral iron was given as ferrous sulphate typically using a fixed dose. The content of elemental iron (the dose of the pure iron ion in the iron sulphate tablet) was rarely reported. Treatment regimens differed between studies with regard to doses, number of tablet per day and number of days of treatment. Non‐elemental iron doses ranged from 100 mg to 325 mg per tablet.
Primary outcomes
Maternal mortality
Maternal mortality was only reported by two studies. There was one maternal death in the group receiving IV iron caused by peripartum cardiomyopathy 13 days postpartum, thus it is not clear whether this death was directly caused by the study medication (Van Wyck 2007). A corresponding author from one other study reported that no women died (Guerra 2012) (risk ratio (RR) 2.95; 95% confidence interval (CI) 0.12 to 71.96; two RCTs; one event; 374 women; low quality evidence; Analysis 1.1). In the remaining studies this information was not clear as per our definition in the Primary outcomes section.
Fatigue
Fatigue was reported by two studies, and a meta‐analysis was not possible due to lack of data. One study reported a statistically significant improvement in fatigue in the group receiving IV treatment (see below) (Westad 2008). The other study showed no difference in fatigue (see below) (Van Wyck 2007).
Van Wyck 2007 used the Fatigue Linear Analog Scale Assessment (Portenoy 2006) for a mean total fatigue score. Westad 2008 used the Fatigue Score (Chalder 1993), where the scores were reported as mean change from baseline for physical, mental and total fatigue. It was not possible to obtain standard deviations from Westad 2008 (standard deviations were only available for baseline data), and thus we could not perform a meta‐analysis. In both studies the higher score indicated higher level of fatigue.
In the trial by Westad 2008, all women received oral iron after four weeks. Results by weeks eight and 12 are described in Comparison 5.
In the published paper by Westad 2008, the authors state that they found a statistically significant improvement in the 'physical fatigue' and 'total fatigue' scores favouring the IV iron group at four weeks with a P value of 0.02 for both scores. They found no between‐group difference in the 'mental fatigue' score.
Van Wyck 2007 provided raw means data on our request. There was no statistically significant differences between groups at 14 days (short term) or 42 days (long term) (very low quality evidence; Analysis 1.2; Analysis 1.3).
Secondary outcomes
Anaemia symptoms
Anaemia symptoms (other than fatigue) were not reported.
Psychological well being
Psychological well being was reported by two studies (Van Wyck 2007; Westad 2008). Both used the SF‐36 questionnaire, where higher scores indicate better health state (Ware 2000). There was no overall difference in psychological well being (see below).
It was not possible to carry out a meta‐analyses as standard deviations were only available for baseline data for the study by Westad 2008. This study reported only on four out of eight SF‐36 items. In the published report the authors found no significant between‐group difference at week four.
Van Wyck 2007 provided raw means on all eight items of the SF‐36, thus 'physical function', 'physical role', 'bodily pain', 'social function', 'mental health', 'general health', 'vitality', and 'emotional role'. From the additional data provided, we found no statistically significant difference between the groups at 14 days (Analysis 1.4 to Analysis 1.11).
There was no difference in the occurrence of depression (Analysis 1.12).
Infections
Infections were analysed as a total for each group based on the assumption that if anaemia can cause immune deficiency, and bioavailable iron can supply microorganisms with nutrition, infections could occur anywhere in body. The results were divergent: In the study by Breymann 2008 infections were more frequent in the IV iron group, whereas there was no difference in the study by Van Wyck 2007. Our analysis found no statistically significant difference in infections (RR 1.70; 95% CI 0.58 to 5.03; three RCTs; 718 women; I² 72 %; T² 0.45; Chi² 3.56; P 0.06; very low quality evidence; Analysis 1.13). We conducted a sensitivity analysis to investigate the high level of heterogeneity in which the difference remained statistically non‐significant after we subtracted the study causing heterogeneity (Analysis 14.1), and when we used fixed‐effect meta‐analysis (Analysis 14.2).
Compliance
Compliance was reported in seven studies (Bhandal 2006; Breymann 2008; Guerra 2012; Jain 2013; Van Wyck 2007; Verma 2011; Westad 2008). Bhandal 2006 and Guerra 2012 reported 100% compliance in both groups. However, Guerra 2012 did not count the remaining pills. In the study by Breymann 2008, compliance in the group receiving IV iron was 99% and over 90% in the group receiving oral iron. Westad 2008 reported a compliance of 95% specifically for IV injections in the group receiving IV iron. The mean daily intake of oral iron was 99 mg by week four, resulting in 50% compliance in the oral group. Van Wyck 2007 reported a compliance of 98% in the group receiving IV iron and 83.9% in the group receiving oral iron. Jain 2013 reported the group receiving oral iron to have a 100% compliance confirmed by pill count, but compliance for the group receiving IV iron was not specified. Verma 2011 mentioned that compliance was better in the group receiving IV iron than in the group receiving oral iron, but data were not available. Thus, compliance was 95% to 100% for IV iron, and 50% to 100% for oral iron (RR 1.17; 95% CI 1.01 to 1.35; five RCTs; 890 women, I² 90 %; T² 0.02; Chi² 38.44; P < 0.00001; Analysis 1.14).
Breastfeeding
Breastfeeding was not reported.
Length of hospital stay
Length of hospital stay was generally not reported. Verma 2011 noted that hospital stays were longer in the IV group, but data were not available.
Adverse events during treatment
Three women experienced anaphylaxis or hypersensitivity, all of whom received IV iron. However, there were few events and a reliable absolute risk estimate could therefore not be calculated (RR 2.78; 95% CI 0.31 to 24.92; eight RCTs; three events; 1454 women (767 in the IV arm versus 687 in the oral arm); I² = 0%; low quality evidence; Analysis 1.32.
One woman who received IV iron developed an arrhythmia during iron infusion (Analysis 1.33).
There was a statistically significant difference in the risk of all combined gastrointestinal (GI) adverse events favouring the group receiving IV iron (RR 0.31; 95% CI 0.20 to 0.47; eight RCTs; 169 events; 1307 women; I² = 0%; very low quality evidence; Analysis 1.15).
The GI symptoms that were significantly less frequent in the IV iron group were: constipation (RR 0.21; 95% CI 0.11 to 0.39; six RCTs; 74 events; 1217 women; I² = 0%; very low quality evidence; Analysis 1.16), nausea (RR 0.30; 95% CI 0.11 to 0.81; four RCTs; 22 events; 745 women; I² = 0%; Analysis 1.17), GI pain (RR 0.18; 95% CI 0.04 to 0.83; four RCTs; 13 events; 543 women; I² = 0%; Analysis 1.18), and diarrhoea (RR 0.11; 95% CI 0.02 to 0.59; three RCTs; 14 events; 569 women; I² = 0%; Analysis 1.19).
There was no difference for the occurrence of vomiting (RR 0.40; 95% CI 0.02 to 9.66; one RCT, 128 women; Analysis 1.20) or dyspepsia (RR 0.36; 95% CI 0.04 to 3.20; two RCTs; 93 women; Analysis 1.21).
In the group receiving IV iron we found an increased risk of dysgeusia (distortion of the sense of taste) (RR 7.20; 95% CI 1.63 to 31.76; four RCTs; 13 events; 543 women; I² = 0%; Analysis 1.22), injection site discomfort (RR 4.72; 95% CI 1.03 to 21.54; four RCTs; 10 events; 702 women; I² = 0%; Analysis 1.25), and flush (RR 9.00; 95% CI 1.18 to 68.81; two RCTs, eight events; 124 women; I² = 0%; Analysis 1.28).
There was no statistically significant difference between IV iron and oral iron regarding other adverse events including headache (RR 1.93; 95% CI 0.87 to 4.29; four RCTs; 1124 women; I² = 0%; Analysis 1.23), skin rash (RR 2.34; 95% CI 0.79 to 6.97; two RCTs; 489 women; I² = 0%; Analysis 1.26), muscle cramps (RR 6.05; 95% CI 0.74 to 49.68; two RCTs, 371 women; I² = 0%; Analysis 1.29), and hepatic involvement (RR 0.45; 95% CI 0.12 to 1.71; three RCTs; 996 women; I² = 51%; T² 0.70; Chi² 4.07; P 0.13; Analysis 1.24). In the analyses for hepatic involvement there was high heterogeneity, therefore we conducted a sensitivity analysis. The difference between groups became statistically significant in favour of the IV group when we removed the study causing heterogeneity (Breymann 2008) (RR 0.22; 95% CI 0.06 to 0.75; two RCTs; 652 women; I² = 0%; Analysis 14.3). The difference was statistically non‐significant when we changed to fixed‐effect meta‐analysis (Analysis 14.4).
Some adverse events were rare and reported only by one study. We found no difference in these outcomes, which were urticaria (reported as an isolated symptom and not as part of an allergic reaction) (Analysis 1.27), unspecified pain (Analysis 1.30), and unspecified serious adverse events (Analysis 1.31).
Red blood cell transfusions
There was no difference between groups the frequency of women receiving blood transfusion as a "rescue treatment" (blood transfusion rates) (RR 0.48; 95% CI 0.19 to 1.23; four RCTs; 18 events; 606 women; I² = 0%; Analysis 1.34). For the trial by Westad 2008, we assumed that the reported number of blood transfusions were received within the first four weeks of treatment, which is clinically most probable. However, this is not specified in the published report. The number of units of RBCs transfused was not reported.
Discontinued study
One trial by Backe 2009 entitled 'A 6‐week randomised, open comparative, multi‐centre study of IV ferric carboxymaltose (Ferinject) and oral iron (Duroferon) for treatment of post partum anaemia' with the trial identification number NCT00929409 was identified. Based on the type of intervention this trial should have been included in Comparison 1.
However, we were informed by the contact person for the trial that "Our controlled trial “A 6‐week randomised, open comparative, multi‐centre study of IV ferric carboxymaltose (Ferinject) and oral iron (Duroferon) for treatment of post partum anemia” was stopped because of slow progress, and the sponsor (Renapharma Vifor) then unfortunately decided to terminate the trial".
We then repeatedly attempted to contract the sponsors for preliminary results and the trial report made after discontinuation. We never received a response from the company. This indicates a high risk of publication bias (Bassler 2010).
Comparison 2: RBC transfusion versus non‐intervention
Prick 2014 was the only trial comparing RBC transfusion to non‐intervention, i.e. other treatment at the clinician's discretion. The trial included 519 women.
Primary outcomes
Maternal mortality
Mortality was not reported.
Fatigue
There was a small and transient, but statistically significant between‐groups difference in fatigue during the first week favouring the group receiving RBC transfusions (see below).
Fatigue was measured by the Multidimentional Fatigue Inventrory (MFI) (Smets 1995). We chose to report only on 'general fatigue', which summarises the remaining domains domains: 'physical fatigue', 'reduced activity', 'reduced motivation', and 'mental fatigue'. High score indicates higher level of fatigue.
The authors provided raw means and standard deviations on our request. However, they pointed out, that it would not be correct to enter the results as raw means while not correcting for baseline differences and mode of delivery. We chose to quote the data from the manuscript, but also import and analyse the data provided by the authors.
In the published report's table S1 (data corrected for baseline differences), the authors found a statistically significant between‐groups difference in mean general fatigue at three days. There was no significant difference between groups at six weeks.
The additionally provided data showed that the group receiving RBC transfusions had significantly better scores than the non‐intervention group in general fatigue at three days (mean difference (MD) ‐0.80; 95% CI ‐1.53 to ‐0.07; women 388; low quality evidence; Analysis 2.1), but not at six weeks (low quality evidence; Analysis 2.2).
Secondary outcomes
Anaemia symptoms
Anaemia symptoms eliciting a RBC transfusion occurred in 28 women in the non‐intervention group. However, the frequency of anaemia symptoms (besides fatigue) was not systematically reported for the remaining, non‐transfused members of the non‐intervention group or for the RBC transfusion group (very low quality evidence).
Psychological well being
Psychological well being improved significantly more in the group receiving RBC transfusions (see below).
Psychological well being was registered using the SF‐36 questionnaires (high score indicates better health state). We chose to quote the SF‐36 data from the manuscript, as well as to report the additionally provided data at one week of follow‐up.The published report (Table S1) showed a statistically significant between‐groups difference in 'physical functioning', where scores were 5.5 points lower at one week of follow‐up in the non‐intervention group, thus favouring the group receiving RBC transfusions. When we entered the additionally provided data we found a statistically significant difference in physical functioning favouring the group receiving RBC transfusions at one week (MD 5.67; 95% CI 0.84 to 10.50; 368 women; Analysis 2.3).
For social function there was a borderline statistically significant difference at one week favouring the group receiving RBC transfusions (MD 5.34; 95% CI 0.11 to 10.57; 369 women; Analysis 2.4). For the remaining items there was no statistically significant difference at one week of follow‐up (Analysis 2.5 to Analysis 2.10). Thus, there was a discrepancy between the reported results and our calculations of additionally provided data, but both sources find effect in favour of RBC transfusions.
Infections
Infection rates were similar (RR 0.93; 95% CI 0.53 to 1.61; 519 women; moderate quality evidence; Analysis 2.11).
Compliance
Compliance to treatment was lower in the non‐intervention group, where 33 women did not comply with allocated treatment versus seven in the RBC group (RR 1.11; 95% CI 1.06 to 1.17; 519 women; Analysis 2.12).
Breastfeeding
Breastfeeding rate at randomisation was 77% in both groups. There was no statistically significant difference in breastfeeding rate between groups at six weeks of follow‐up (RR 0.91; 95% CI 0.78 to 1.07; 297 women; Analysis 2.13).
Length of hospital stay
Length of hospital stay was a median of two days in both groups.
Adverse events during treatment
There was no statistically significant difference in reported adverse events, which were alloantibody formation (very low quality evidence), rash, fever, thromboembolic events (low quality evidence), parenteral iron intolerance, and transfusion reactions (very low quality evidence) (Analysis 2.14 to Analysis 2.19). Transfusion reactions (alloantibodies, fever) only occurred in transfused participants, however, there was no systematical investigation for the presence of new alloantibodies.
Red blood cell transfusions
In the RBC transfusion group, 251 women received transfusion, seven refused. The total number of RBC units given was 517 (median: 2 units per woman; interquartile range 2‐2). In the non‐intervention group 33 women received RBC transfusion and 88 RBC units were given (median: 0 units per woman; interquartile range 0‐0).
Comparison 3: Oral iron versus placebo
Oral iron was compared with placebo by three studies (Beard 2005; Krauss 1972; Tam 2005). The study by Krauss 1972 had three study arms. For this comparison we chose the study arm that received tablet Eryfer containing ferrous sulphate, ascorbic acid and sodium bicarbonate as the intervention arm (group S) and the placebo arm (empty preparation) as the control arm. The remaining arm received oral iron, magnesium oxide, yeast extract (see Comparison 4). The follow‐up periods for the three studies were 30, 42, and 145 days and the trials did not report results at comparable time points. The trials also reported on different outcomes, as a result it was not possible to perform meta‐analyses for this comparison.
Primary outcomes
None of our primary outcomes were reported.
Secondary outcomes
Anaemia symptoms
Only one study, Tam 2005, reported on persistent anaemia symptoms, but for both study groups combined. These were dyspnoea (n = 6), palpitations (n = 6), chest discomfort (n = 3), dizziness (n = 12), headache (n = 10).
Psychological well being
Psychological well being was significantly better in the placebo group, shown by two different tools (see below).
Psychological well being was reported by Beard 2005. The tools used for the assessment were Digit Symbol Substitution test (high score indicates better cognitive performance) (Hoyer 2004), Edinburgh Postnatal Depression Scale (EPDS), where high scores are associated with depression (Cox 1987), Spielberger State Trait Anxiety Inventory (STAI), where high scores indicate higher anxiety (Marteau 1992), and the Perceived Stress questionnaires, where high scores indicate more stress (Cohen 1983). The Digit Symbol Substitution evaluating cognitive performance showed no difference between groups at 10 weeks (MD 0.0; 95% CI ‐2.76 to 2.76; 51 women, one RCT; Analysis 3.1). The EPDS test did not show any statistical difference between groups at 10 weeks (MD 0.10; 95% CI ‐0.86 to 1.06; 51 women, one RCT; Analysis 3.2). The STAI tool showed no difference at 10 weeks (MD ‐0.40; 95% CI ‐3.18 to 2.38; 51 women, one RCT; Analysis 3.3). The Perceived Stress questionnaire showed a statistically significant difference favouring the placebo group at 10 weeks (MD 4.10; 95% CI 1.70 to 6.50; 51 women, one RCT; Analysis 3.4).
In the published report, the authors do not acknowledge the findings listed above.
Infections
Infections were not reported.
Compliance
Compliance was not reported.
Breastfeeding
Tam 2005 reported on breastfeeding rates at two days postpartum, with no statistically significant difference between groups (RR 0.82; 95% CI 0.58 to 1.17; 122 women; one RCT; Analysis 3.5).
Length of hospital stay
Length of hospital stay was not reported.
Adverse events
Adverse events were reported in two studies (Krauss 1972; Tam 2005). Tam 2005 reported only on one type of adverse events (back pain) for each study group individually, with no difference between groups (RR 0.66; 95% CI 0.42 to 1.03; one RCT, 53 events; 150 women; Analysis 3.6). The remaining adverse events were given for both study groups combined. The authors stated that there was no difference regarding nausea, vomiting, or constipation (Tam 2005). Krauss 1972 reported that six women in each group had GI adverse events such as constipation, low appetite, and morning sickness, but the numbers of each adverse event were not reported (very low quality evidence) (Analysis 3.7). No serious adverse events were reported.
Red blood cell transfusions
Red blood cell transfusions were not reported.
Comparison 4: Oral iron, magnesium oxide and yeast extract versus placebo
One study was included (67 women) in this comparison (Krauss 1972).
Primary outcomes
None of our primary outcomes were reported.
Secondary outcomes
Anaemia symptoms, psychological well being, infections, compliance, breastfeeding, length of hospital stay, blood transfusions
Not reported.
Adverse events
Different types of GI adverse events were not reported separately. Therefore, we analysed all GI symptoms as a whole for each group and found a statistically significant difference favouring the placebo group. Sixteen women in the intervention group had constipation, anorexia, bloating and vomiting. Six women in placebo group had constipation, low appetite and morning sickness (RR 2.75; 95% CI 1.23 to 6.16; one RCT; 22 events; 67 women; Analysis 4.1). No serious adverse events were reported.
Comparison 5: IV iron and oral iron after four weeks versus oral iron (week five to 12)
One study was included (117 women) (Westad 2008). Group A received IV iron immediately after giving birth and started oral iron after four weeks. Group B started receiving oral iron immediately after delivery.
Primary outcomes
Maternal mortality
Maternal mortality was not reported.
Fatigue
In the published report, the authors state that 'physical fatigue' improved significantly more in group A compared to group B. The improvement was seen at week eight (P = 0.02) and at week 12 (P = 0.03). There was no difference between the groups in their 'mental fatigue' score. The 'total fatigue' score was significantly better in group A at eight and 12 weeks (P = 0.02 at both time points). Standard deviations were not available for fatigue at eight and 12 weeks; therefore we could not carry out a statistical analysis.
Secondary outcomes
Anaemia symptoms
Anaemia symptoms were not reported.
Psychological well being
There was no difference between groups in the SF‐36 scores at week eight according to the published report. Standard deviations were not available for analysis.
Infections
Infections were not reported.
Compliance
Compliance to treatment with oral iron was assessed by counting returned pills. Compliance was reported as less than 50% of the recommended dose in both groups.
Breastfeeding
Breastfeeding was not reported.
Length of hospital stay
Length of hospital stay was not reported.
Adverse events
Adverse events did not differ significantly between groups. These were all GI symptoms, GI pain, constipation, diarrhoea, nausea, dysgeusia (distortion of the sense of taste), flatulence, melena, or headache (Analysis 5.1 to Analysis 5.9).
Red blood cell transfusions
We assumed that the RBC transfusions reported in this study were given within the first four weeks (see Comparison 1).
Comparison 6: IV iron and oral iron versus oral iron
Two studies (112 women) were included (Breymann 2000; Perello 2014). One study administered placebo EPO in the intervention arm (Breymann 2000) and the other study administered placebo IV iron in the comparator arm (Perello 2014). Thus, as per the lack of evidence for a substantial placebo effect (Hróbjartsson 2010) and the similar active treatments in these two studies, we found them comparable. Length of follow‐up was two and six weeks, respectively.
Primary outcomes
None of our primary outcomes were reported.
Secondary outcomes
Anaemia symptoms
One study evaluated anaemia symptoms by the number of patients who scored the severity as being equal to or more than seven on the Visual Analoge Scale (VAS) (higher score indicates higher severity) (Perello 2014). There was no statistically significant difference between groups at any time point (very low quality evidence; Analysis 6.1 to Analysis 6.3).
Psychological well being
Psychological well being was measured using the EPDS (Cox 1987) and the STAI (Marteau 1992) tools by Perello 2014. A clinically significant EPDS score was defined as being equal to or more than 11. There was no statistical difference between groups at one week of follow‐up (Analysis 6.4).
Infections
Infections were not reported.
Lenght of hospitalisation
Lenght of hospitalisation was reported by Perello 2014 and did not differ between groups (Analysis 6.5).
Adverse events
Adverse events were given as the number of patients who scored severity as being equal to or more than seven on the VAS in one study (Perello 2014). There was no statistically significant difference between groups at any time point (Analysis 6.6 to Analysis 6.8). The other study reported that there were no serious adverse events, including hypersensitivity or thromboembolic events (very low quality evidence). Five cases of dysgeusia, three cases of warm flushes and five cases of GI complaints were reported, but not by group (Breymann 2000).
Red blood cell transfusions
Blood transfusion rates did not differ between groups (Analysis 6.9).
Comparison 7: Erythropoietin (regardless of route) and IV iron versus IV iron
Two studies were included (80 women) (Krafft 2011; Wagstrom 2007). For the study by Wagstrom 2007, which had three study arms, we chose to compare group one (SC EPO 40,000 U + IV iron) and three (IV iron), for optimal resemblance to the study by Krafft 2011. Arm two received SC EPO 20,000 U + IV iron (Comparison 8).
Primary outcomes
None of our primary outcomes were reported.
Secondary outcomes
Anaemia symptoms
Anaemia symptoms were not reported
Psychological well being
One woman developed postpartum depression (RR 0.33; 95% CI 0.01 to 7.72; one RCT; 40 women; Analysis 7.1)
Infections
Infection rates were similar (RR 2.00; 95% CI 0.72 to 5.59; two RCTs; 80 women; Analysis 7.2).
Compliance
Compliance was reported as 100% in both groups since no women refused injections (Krafft 2011; Analysis 7.3).
Breastfeeding
All women in both groups of one study breast fed (Analysis 7.4) (Krafft 2011).
Length of hospital stay
Length of hospital stay was not reported.
Adverse events
Adverse events did not differ significantly between groups. These were dysgeusia, flush, diarrhoea, headache, itching including increased liver enzymes, dizziness, or thrombophlebitis (Analysis 7.5 to Analysis 7.11). There were no thromboembolic events.
Red blood cell transfusions
There was no difference between groups regarding blood transfusion rate (RR 3.00; 95% CI 0.13 to 69.52; two RCTs; 80 women; Analysis 7.12).
Comparison 8: Subcutaneous EPO 10,000 U two doses and IV iron versus IV iron
We included one study (40 women) Wagstrom 2007, with three study arms. For this comparison we used the arm that received SC EPO 20,000 U + IV iron (group two) and IV iron (group three). The last arm received SC EPO 40,000 U + IV iron (Comparison 7).
Primary outcomes
None of our primary outcomes were reported.
Secondary outcomes
Anaemia symptoms
Anaemia symptoms were not reported
Psychological well being
One woman developed postpartum depression (RR 0.33; 95% CI 0.01 to 7.72; one RCT; 40 women; Analysis 8.1)
Infection
Infection rates were similar (RR 0.75; 95% CI 0.19 to 2.93; Analysis 8.2).
Compliance, breastfeeding, length of hospital stay
Not reported.
Adverse events
There was no between‐group difference for other adverse events including headache, low blood pressure, diarrhoea, dizziness, or itching with increased liver enzymes (Analysis 8.3 to Analysis 8.7). There was no thromboembolic events.
Red blood cell transfusions
No women received RBC transfusions (Analysis 8.8).
Comparison 9: IV EPO, IV iron and oral iron versus IV iron and oral iron
Three studies were included (Breymann 1996; Breymann 2000; Lebrecht 1995). Two of them had three study arms. For the study by Breymann 1996, we chose the groups receiving IV EPO + IV iron + oral iron (group three) and IV iron + oral iron (group one) for this comparison. The remaining group received SC EPO + IV iron + oral iron (Comparison 12). For the study by Breymann 2000, we chose the group that received IV EPO + IV iron + oral iron (group one) and the group that received IV placebo‐EPO + IV iron + oral iron (group two) for this comparison. The last group received oral iron alone (Comparisons 6 and 13). The follow‐up periods for the three studies were between 14 and 42 days, with no common time point.
Primary outcomes
None of our primary outcomes were reported.
Secondary outcomes
Anaemia symptoms, psychological well being, infections, compliance, breastfeeding, length of hospital stay
Not reported
Adverse events
All three studies reported that there were no serious adverse events such as anaphylactic reactions or thromboembolic events. Leg paraesthesia was the only adverse event reported by group, with no statistically significant difference (RR 0.72; 95% CI 0.08 to 6.65; two RCTs; two events; 76 women; I² = 0%; Analysis 9.1). Two women experienced a warm sensation during iron infusion, dysgeusia was observed in 27 women and 10 women complained of a burning sensation during EPO injection (Breymann 1996). There were five cases of GI adverse events, five cases of dysgeusia and three cases of warm flushes (Breymann 2000). However, these numbers were not given for each group, but were combined, thus it is unknown to which study arm these women were randomised.
Red blood cell transfusions
No women RBC received blood transfusions (Breymann 1996; Breymann 2000; Analysis 9.2).
Comparison 10: Subcutaneous EPO and oral iron versus oral iron
One study was included (40 women) (Makrydimas 1998).
Primary outcomes
None of our primary outcomes were reported.
Secondary outcomes
Anaemia symptoms, psychological well being, infections, compliance
Not reported.
Breastfeeding
More women were breastfeeding in the EPO group (RR 1.90; 95% CI 1.21 to 2.98; Analysis 10.1). The time point for this observation was not stated.
Length of hospital stay
Length of hospital stay was reported as a median with 11 days (range six to 11) for 'EPO + oral iron' group and 14 days (range 11 to 19) for the oral group. The reason for the prolonged hospitalisation was not given. The available data were not sufficient to perform a statistical analysis.
Adverse events
Adverse events including GI symptoms were not reported.
Red blood cell transfusions
Two women in the oral group showed haemodynamic instability and received blood transfusions (RR 0.20; 95% 0.01 to 3.92; Analysis 10.2).
Comparison 11: IV EPO versus IV placebo
One study was included (71 women) (Meyer 1995).
Primary outcomes
None of our primary outcomes were reported.
Secondary outcomes
Anaemia symptoms
Anaemia symptoms were not reported
Psychological well being
According to the study authors, there was no statistically significant difference between the groups regarding psychological well being, which was measured using selected items from the 'Blues Questionnaire' (low score indicates absence of blues) (Kennerley 1989) and the 'Self‐report symptom inventory 90 [SCL‐90‐R]' (high scores indicate high levels of unfavourable symptoms) (Schmitz 1999). Data were not eligible for analysis.
Infections, compliance, breastfeeding, length of hospital stay, adverse events, red blood cell transfusions
Not reported
Comparison 12: Subcutaneous EPO, IV iron and oral iron versus IV iron and oral iron
One study was included (60 women) (Breymann 1996). The study had three study arms. For this comparison, we chose the arm receiving SC EPO + IV iron + oral iron (group two) and IV iron + oral iron (group 1). The remaining study arm received IV EPO + IV iron + oral iron (Comparison 9).
Primary outcomes
None of our primary outcomes were reported.
Secondary outcomes
Anaemia symptoms, psychological well being, infections, compliance, breastfeeding, length of hospital stay
Not reported
Adverse events
The study authors reported that there were no GI events, anaphylactic reactions or serious adverse events. Two women felt a warm sensation during iron infusion, 27 women experienced dysgeusia and 10 women experienced a burning sensation during EPO injection. However, these numbers were not provided per group.
Red blood cell transfusions
No women received blood transfusions.
Comparison 13: IV EPO, IV iron and oral iron versus oral iron
One study was included (40 women) (Breymann 2000). The study had three study arms. For this comparison, we used the arm that received IV EPO + IV iron + oral iron (group one) and oral iron (group three). The remaining study arm received IV placebo‐EPO + IV iron + oral iron (Comparisons 6 and 9).
Primary outcomes
None of our primary outcomes were reported.
Secondary outcomes
Anaemia symptoms, psychological well being, infections, compliance, breastfeeding, length of hospital stay
Not reported
Adverse events
The study reported that there were no serious adverse events, including hypersensitivity or thromboembolic events. Five cases of dysgeusia, three cases of warm flushes and five cases of GI complaints were reported, but not by group.
Red blood cell transfusions
No women received blood transfusions.
Planned analyses
We used random‐effects meta‐analyses for all dichotomous outcomes due to variation in length of treatment and dosages.
We found important statistical heterogeneity in two meta‐analyses in Comparison 1, and therefore we performed a sensitivity analyses for these, although the meta‐analyses were based on secondary outcomes.
Sensitivity analyses regarding trial design could not be performed due to lack of blinding throughout the main comparison and the other comparisons did not include enough studies for a meaningful sensitivity analysis.
It was not meaningful to perform subgroup analyses as planned, due to few included studies.
We did not produce a funnel plot as we had a maximum of eight studies in any single meta‐analysis.
'Summary of findings' tables
Please see summary of findings Table for the main comparison; summary of findings Table 2; summary of findings Table 3; summary of findings Table 4; summary of findings Table 5; summary of findings Table 6; summary of findings Table 7; summary of findings Table 8.
Discussion
Summary of main results
This review included 22 studies with a total of 2858 women. The majority of our analyses are based on a small number of studies. Very few studies report on our primary outcomes of maternal mortality and fatigue. The main results are summarised in the ‘summary of findings Table for the main comparison; summary of findings Table 2; summary of findings Table 3; summary of findings Table 4; summary of findings Table 5; summary of findings Table 6; summary of findings Table 7; summary of findings Table 8’.
Overview
For intravenous (IV) iron compared with oral iron, fatigue significantly improved in the IV iron group in one of two studies. There were no data on other anaemia symptoms. Psychological well being was not significantly different between groups. There were very little or no data on breastfeeding and length of hospital stay. Infection rates were not significantly different between groups. Maternal mortality was insufficiently reported; however there was one reported death due to cardiomyopathy in the IV iron group. Also, one woman in the IV iron group developed arrhythmia. Allergic reactions only occurred in the IV iron group, but there was no statistically significant difference. Dysgeusia, injection site discomfort, and flushes were only seen in women treated with IV iron. Gastrointestinal symptoms such as constipation, nausea, gastrointestinal (GI) pain and diarrhoea were far more frequent with oral iron. Hepatic involvement was more frequent in the orally treated group, however only after sensitivity analysis. Compliance with treatment was lower in women treated orally, possibly associated with the high frequency of GI symptoms. Blood transfusion rates did not differ significantly.
For red blood cell (RBC) transfusion compared with non‐intervention, there were no data on mortality. For fatigue and psychological well being there was a transient, small but statistically significant improvement favouring the RBC transfused group. There was no difference in infection rates. More women in the RBC transfusion group complied with the allocated treatment. No difference was seen for breastfeeding, length of hospital stay or reported adverse events, including transfusion reactions. One woman developed erythrocyte alloantibodies as a result of transfusion.
For oral iron compared with placebo, none of our primary outcomes were reported. Psychological well being did not improve in the treatment group. There was no difference in breastfeeding or adverse events. No serious events were reported. Treatment with oral iron with magnesium oxide and yeast extract showed significantly more GI adverse events compared with placebo.
For IV iron with oral iron versus oral iron (weeks five to 12), mortality was not reported. Fatigue improved more in the group initially treated with IV iron. Compliance was equally poor in both groups. There was no difference in reported adverse events. No serious events were reported. We assumed that the RBC transfusions took place within the first four weeks of this study.
For IV iron and oral iron versus oral iron, none of our primary outcomes were reported. There were no serious adverse events. Overall, there was no difference between groups.
For erythropoietin (EPO) with IV iron versus IV iron, none of our primary outcomes were reported. There was no difference regarding infections. All women breast fed. There was no difference regarding adverse events. No serious events were reported. No difference was seen regarding blood transfusions.
For IV EPO with IV iron and oral iron versus IV iron with oral iron, none of our primary outcomes were reported. No serious adverse events occurred. There was no difference in other adverse events. No women received transfusions.
For subcutaneous (SC) EPO with oral iron versus oral iron alone, none of our primary outcomes were reported. Significantly more women breast fed in the EPO‐treated group. The duration of hospital stay was quite long in both groups. There was no difference in transfusion rates.
For IV EPO versus IV placebo, none of our primary outcomes were reported. There was no statistically significant differences regarding psychological well being.
For SC EPO, IV iron and oral iron versus IV iron with oral iron, none of our primary outcomes were reported. There were no serious adverse events. No women received transfusions. Some women felt a burning sensation during EPO injection.
For IV EPO, IV iron and oral iron versus oral iron, none of our primary outcomes were reported. There were no serious adverse events. No women received transfusions.
Across all our included studies, data on allergic reactions were available from 1003 women who received IV iron treatment (alone or combined with other treatment). Three of these women developed an anaphylactic reaction.
Interpretation of study methods and results
Main comparison: IV iron versus oral iron
Efficacy
Intravenous iron is perhaps more effective in reducing fatigue than oral iron, but this beneficial effect was only shown in one small study, thus the amount of evidence is very limited and therefore the clinical significance remains uncertain. Other anaemia symptoms were not evaluated. Thus, overall efficacy of treatment can not be concluded upon.
Harms of treatment
One maternal death occurred in the IV group due to peripartum cardiomyopathy. Also, one woman developed arrhythmia during IV iron infusion. Thus, two cases of serious cardiac adverse events were observed. This has not previously been described as an adverse effect of IV iron treatment, and no conclusions can be drawn regarding a causal relationship. However, we suggest that cardiac events be carefully monitored and described in all future studies.
Anaphylaxis was reported in three women, all of whom had received IV iron. Due to the low number of events, and the lack of statistical power, our data do not prove that anaphylaxis or any other serious adverse events are more frequently caused by IV iron than by oral iron. However, a very high number of study participants would be needed to rule out an association between IV iron and anaphylaxis. Since anaphylaxis is a known side effect to IV iron, and a dangerous and potentially fatal reaction, concerns were raised by the French Medicines Agency due to a number of observed cases. The European Medicines Agency therefore issued a safety report (European Medicines Agency 2013) and a risk management recommendation (European Medicines Agency 2013a) regarding allergic reactions to IV iron. It was concluded that treatment with IV iron carries a small risk of allergic reactions which can be life‐threatening.
Urticaria can be a manifestation of an allergic reaction and thus the reported urticarial reactions may be included in the anaphylaxis or evidence of hypersensitivity outcome with the proviso that urticaria also can be caused by other factors.
Taste distortion (dysgeusia), injection site discomfort, and flushing were symptoms associated with IV iron treatment. These reactions are unpleasant but transient and not considered harmful. However, it cannot be excluded that flushing and injection site discomfort could be prodromes heralding more severe hypersensitivity reactions, and they should be observed closely.
Gastrointestinal adverse events were far more frequent with oral iron, both combined and specifically for constipation, nausea, GI pain, and diarrhoea. This corresponds well with the general knowledge and concern among clinicians that GI symptoms are frequent, bothersome and may negatively affect compliance. This means that the patients, who can not handle the adverse effects of treatment are often not treated sufficiently. However, these are the patients who probably are in most need of treatment and it is up to the clinicians to trace this less tolerant subgroup of patients and consider alternative treatment methods. The high compliance for IV iron treatment may be explained by the fact that IV treatment was administered in few doses by clinicians, in contrast to several self‐administered daily doses of oral iron over a period of several weeks.
For hepatic involvement, the results became statistically significant in favour of IV treatment, when we performed a sensitivity analysis. It is surprising that hepatic involvement was shown in the oral group. We could not find any literature that supports the association between oral iron and liver toxicity in humans. However, this effect of oral ferrous sulphate is described in rats (Toblli 2008; Toblli 2013). It should be noted, that the two studies included in the sensitivity analysis for hepatic involvement had an almost five times higher weekly dose of oral iron, than the study which caused heterogeneity. These findings suggest a dose‐response relationship between oral ferrous sulphate and toxic liver effect. This was a rare finding, however it may be more frequent since liver function was not measured in all studies. Also. most studies with an IV iron arm excluded participants with known liver disease. Therefore, there is a population selection favouring women with a healthy liver also in the oral arm of these studies. Further research is needed to investigate the effect of ferrous sulphate on liver function.
We found high heterogeneity for infection suggesting uncertainty of the result. For infections it was not possible to predict with certainty which study was more likely to cause the heterogeneity. However, we know that the study by Breymann 2008 caused heterogeneity in the meta‐analysis for hepatic involvement, and that it had a high level of attrition bias and that the randomisation method was not described. The results for infections remained statistically non‐significant in the sensitivity analysis.
Other treatment modalities
For RBC transfusions compared with non‐intervention data (Comparison 2), a small and transient, but statistically significant improvement was shown in fatigue and SF‐36 data in favour of the RBC treatment. The SF‐36 data provided had very broad standard deviations and our analysis of the raw means differed from what was stated in the published report. However, both sources found a statistically significant effect in favour of the RBC transfusions. Whether the effect of RBC transfusion on fatigue and psychological well being is clinically significant in haemodynamically stable women with no severe anaemia symptoms is debatable, as the small and transient gain in fatigue and psychological well being scores must be balanced against potential severe side effects of RBC transfusions. Also, alleviating relatively mild subjective symptoms with an expensive treatment is not cost‐effective (Prick 2014).
This study did not systematically report all anaemia symptoms in the two groups. However, severe anaemia symptoms led to RBC transfusion in 28 women randomised to the non‐intervention group. This illustrates the importance of registration and reporting of anaemia symptoms as an outcome and the need to evaluate them as an indication for transfusion, because the consequence of these symptoms can trigger a potentially harmful treatment.
The trial was conducted in The Netherlands where the procedure for blood transfusion, including screening and cross‐matching and administration is highly developed and thus safe. The same lack of difference regarding infections, breastfeeding, length of hospital stay, or adverse events may not be the same in a different setting, i.e. in low‐income countries. One woman developed alloantibodies after transfusion. Since there was no systematic post‐transfusion examination for newly formed alloantibodies in all transfused participants, and since these antibodies often have subtle or delayed clinical consequences in the weeks following transfusion, the frequency is most likely underestimated. Generally, the incidence of newly generated alloantibodies is heavily dependent on the patient population, and the precise incidence of antibodies elicited by postpartum transfusion is not known. A recent study showed unexpected alloantibodies occur in 3% of obstetric patients, and approximately one‐third of these cases were associated with haemolytic (breaking down of RBCs) disease of the newborn (Smith 2013). Even though antibodies as a consequence of transfusion may only represent some of these cases, they may potentially harm a future foetus, and thus have significant consequences (Klein 2014).There was low compliance in the non‐intervention group which can be explained by the trial design: If women allocated to the non‐intervention group received transfusion, e.g. due to secondary postpartum haemorrhage, they automatically failed to comply with the allocated treatment, whereas the women allocated to the RBC transfusion group had no obvious reason to refuse transfusion after giving consent to participate in the trial.
When comparing oral iron with placebo, it was not possible to perform a meta‐analysis due to insufficient data. Also, the follow‐up periods were very different and there were no common time points. In assessment of psychological well being one test showed that treatment actually reduced psychological well being compared with placebo. However, the trial authors did not reach the same conclusion. When evaluating measures such as psychological well being it is important to use validated tools for the specific population (i.e. postpartum women).
The women who started their postpartum period with an IV iron infusion and were then supplemented with oral iron at four weeks had significantly less fatigue than women who received oral iron only from the beginning of the postpartum period. However, by the end of this study the dropout rate was very high, and the population was highly exposed to attrition bias, thus potentially selecting the stronger and more healthy patients.
Data from one small study (Makrydimas 1998), indicated that women were able to breastfeed more in the group treated with EPO and oral iron compared with the oral iron group. This effect of EPO has not been reported elsewhere. On the contrary, the study of equal sample size by Krafft 2011 showed that women treated with EPO and IV iron had the same high breastfeeding rate as those treated with IV iron alone. Thus, the difference in lactation rate seen in Makrydimas 1998 was probably coincidental due to small study material.
Handling fatigue and quality of life data
Fatigue and psychological well being are concepts very difficult to define and delimit from one another. Fatigue can be perceived as a uni‐dimensional phenomenon (Visual Analoge Scale (VAS)), it can be subdivided into mental and physical aspects (Fatigue Score), and it may even consist of additional dimensions (reduced motivation and reduced activity), as seen in the Multidimentional Fatigue Inventrory (MFI). These additional aspects of fatigue have certain similarities to items in tools used to measure psychological well being. Psychological well being as measured by SF‐36 may be influenced by a postpartum depression. As defined in the International Classification of Diseases (ICD‐10), one of the core symptoms of depression is 'reduction of energy or increased tiredness', or what is commonly understood as 'fatigue'. In fact, the SF‐36 contains questions specifically targeting disclosure of fatigue symptoms summarised in the 'vitality' item. Thus, although we defined fatigue and psychological well being as separate outcomes, we acknowledge the complexity of these symptoms and the tools developed to measure them. It is therefore in our opinion not advisable to dissect the questionnaire data in an attempt to extract purely fatigue‐related results.
The assessment of health‐related quality of life is highly subjective and the tools developed to measure quality of life merely translate feelings in to numbers which only approximate reality, and statistical significance in calculation of scores does not necessarily equal clinical significance. Therefore, it is perhaps more informative and useful to establish a minimal clinically relevant difference or threshold in scores above or below which a person is confirmed to be experiencing a given condition or emotion (e.g. Perello 2014).
For quality of life outcomes, we reported only the most relevant time points. The intention was to limit the number of analyses to a manageable amount of information and to avoid reporting on time points too close to each other.
For psychological well being, we found the short‐term time points most important when comparing two treatment regiments, as it is clinically relevant how quickly a given treatment can relieve symptoms, and long‐term differences are likely to be affected by an unknown number of confounders and the anaemia would often resolve over time due to physiological factors.
Discrepancy in statistical significance between raw means entered into RevMan 2014 and the findings in the published reports can be explained by the lack of adjustment calculations for additionally provided data (Prick 2014). However, for published data this explanation does not apply (e.g. Beard 2005).
Overall completeness and applicability of evidence
After including 22 studies, we had expected sufficient data to perform a comprehensive meta‐analysis on clinically relevant outcomes for the efficacy of different treatment methods of postpartum iron deficiency anaemia. In terms of treatment efficacy, the available literature provided surprisingly little information on clinical outcomes. Instead, there was focus on surrogate outcomes, such as laboratory values. We were surprised that only three studies investigated fatigue, which we chose as a primary outcome, because of its commonness in anaemic patients.
The identified studies provide an overall acceptable insight on various harmful symptoms, although the reporting was heterogeneous, the symptoms were some times difficult to pool and maternal mortality was rarely reported. We have learned that anaphylaxis, the most feared complications of IV iron, is rare, and we have confirmed that GI adverse events associated with oral iron were common.
It might be difficult to distinguish between symptoms of a condition and adverse effects of a treatment. In theory, anaemia symptoms should decrease over time, while adverse events increase due to drug exposure. Researchers usually did not report the time at which a symptom occurred. It is however important to report the time point at which the patient experiences discomfort of any kind (e.g. headache), to distinguish between symptoms of anaemia and harmful effects of treatment. The studies did not agree on common clinically relevant time points to collect data, which is important in a meta‐analyses.
Surprisingly, only three small studies investigated the effect of oral iron versus placebo, one of which was conducted more than 40 years ago. Cost of different drugs and treatment vary depending on the setting and thus can not be generalised. However, it is certain that IV iron costs substantially more than oral iron (Khalafallah 2012) and infusion often require hospitalisation. When investigating treatment of a condition, which is most likely to occur in low‐income settings where nutritional factors, longer periods of breastfeeding and the number of pregnancies per woman may differ from those of high‐income countries, special attention must be drawn to types of treatment options available in these particular settings, i.e. oral iron.
The majority of trials were conducted in high‐income countries and only in two reports was it specifically stated that the participants derived from a low‐income setting. This questions the external validity of the results and clinicians should bear in mind that women from different settings may respond differently to the same treatment. Women who live in low‐income settings may be more prone to malnutrition and infections. They may have a lower degree of education and according to social standards they may be expected to have more children. These factors may affect compliance, adverse effects of treatment, management of the adverse events (seeking help) and response to treatment.
Among the randomised studies eligible for inclusion in this review, there was a substantial variation in trial design, and many trials were small. This, along with the lack of clinical outcomes made it very difficult to pool data in meta‐analyses.
Quality of the evidence
The body of evidence in this review does not allow a robust conclusion on clinical efficacy. The conclusion on harms is more comprehensive, however, with serious limitations, especially regarding maternal mortality.
When using the 'Risk of bias' tool, we found that the majority of the included studies had high risk of bias in at least two domains. Also, 11 studies did not describe the randomisation method. In our experience this may disguise a serious selection bias (see Characteristics of excluded studies for examples). Many contact authors did not respond to our letters and potential violation of research ethics remains undisclosed.
Using the GRADE approach, we downgraded the quality level of the body of evidence based on the following reasons. The majority of the studies were open‐label and in some of the blinded studies it was unclear whether the blinding was successful. Clinical outcome measures, such as self‐reported health and most adverse events, are highly subjected to performance and detection bias. Some outcomes are however less or not affected by the subjectivity of the patient, for example infections with a rise in body temperature, elevated liver enzymes and mortality. A large proportion of the included studies had a high dropout rate (especially with oral iron), suggesting an increased risk of attrition bias. Thus, the study populations may have been selected if those who dropped out represented a more vulnerable part of the population. In such cases, it is important to report why the participants dropped out and to perform intention‐to‐treat analyses.
Inconsistency was only substantial for two outcomes (hepatic involvement and infections, Comparison 1) due to a high level of heterogeneity, which was addressed through sensitivity analyses.
We did not experience difficulties regarding indirectness.
Imprecision was however a common problem due to small sample sizes and broad confidence intervals, which naturally lowers our confidence in the effects.
Risk of reporting bias was high. Many studies did not report harmful effects, i.e. maternal mortality or survival even though this must be considered a fundamental knowledge, when testing the safety of drugs. The lack of reporting on harms raises serious concern that unfavourable events may have occurred, but not reported. In several trials there was discrepancy between preplanned and reported outcomes, which also indicates high risk of selective reporting. Also, we are aware of one trial suitable for inclusion, which was terminated prematurely by trial sponsors. This adds to the high risk of reporting bias.
Potential biases in the review process
Our inclusion criteria was based on haemoglobin (Hb) values, although we stated that inclusion criteria should be based on the presence and severely of anaemia symptoms. However, because the included studies chose to include patients based on Hb values as inclusion criteria, we could not use anaemia symptoms as inclusion criteria, as these were almost never systematically screened for.
Due to a lack of details in the method sections of the included studies, we may have pooled partly incompatible data, i.e. data from different time points during follow‐up and different dosages. Also, we could not clearly distinguish adverse events of treatment from anaemia symptoms.
We only reported outcomes prespecified for this review. Thus, the effect of the interventions on laboratory values are not reported.
Some data were provided graphically in the published reports. We consistently requested such data in numerical form along with corresponding standard deviations. When authors did not respond, we read the values from the graphs. However, the lack of data, such as standard deviation, prevented us from carrying out certain analyses.
Agreements and disagreements with other studies or reviews
We only reported outcomes that we found clinically relevant. The original version of this review (Dodd 2004) also reported on laboratory outcomes (Hb and haematocrit (HCT)). The previous review had the limitation that there were very few included studies. In our review we tried to establish the clinical effect of treatment, however this was hampered by the majority of the studies focusing on laboratory values.
We identified several other review articles on treatment of anaemia, including postpartum iron deficiency anaemia (Breymann 2010; Khalafallah 2012; Milman 2011; Milman 2011a; Milman 2012). Overall, the severity of anaemia, evaluation of treatment effect, and the proposed treatments were all based on laboratory values only. The search methods were not clearly described and thus we assumed that the search was not systematic.
We identified one systematic review on safety and efficacy of IV iron therapy, which included some clinical outcome measures in addition to Hb values (Litton 2013). However, this review was based on all types of patients and did not perform a subgroup analysis on postpartum women. Their results may therefore not be applicable for this specific population. The results showed an increased risk of infections in the IV treated group, but no difference in mortality, adverse events, or blood transfusions. The results on infections could not be confirmed by our meta‐analysis, but a similar trend was seen and the lack of significance may be due to the lower number of participants in our analysis.
One systematic review addressed prevention and treatment of maternal anaemia and showed a lack of evidence regarding treatment of anaemia in the postnatal period and poor reporting of clinical outcome measures (Parker 2012).

Study flow diagram.

'Risk of bias' graph: review authors' judgements about each risk of bias item presented as percentages across all included studies.

'Risk of bias' summary: review authors' judgements about each risk of bias item for each included study.
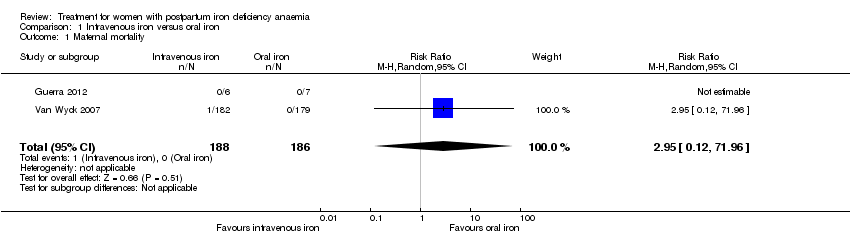
Comparison 1 Intravenous iron versus oral iron, Outcome 1 Maternal mortality.

Comparison 1 Intravenous iron versus oral iron, Outcome 2 Fatigue ‐ 14 days.

Comparison 1 Intravenous iron versus oral iron, Outcome 3 Fatigue ‐ 42 days.
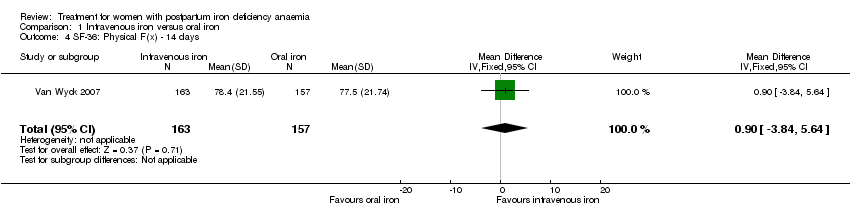
Comparison 1 Intravenous iron versus oral iron, Outcome 4 SF‐36: Physical F(x) ‐ 14 days.
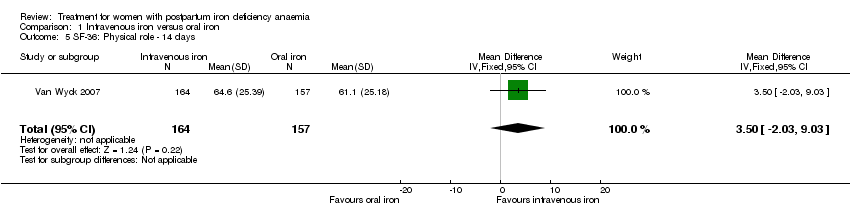
Comparison 1 Intravenous iron versus oral iron, Outcome 5 SF‐36: Physical role ‐ 14 days.
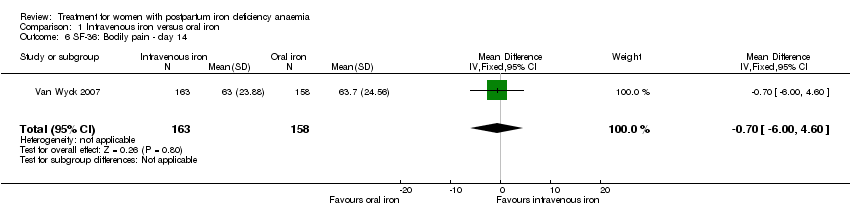
Comparison 1 Intravenous iron versus oral iron, Outcome 6 SF‐36: Bodily pain ‐ day 14.

Comparison 1 Intravenous iron versus oral iron, Outcome 7 SF‐36: General health ‐ 14 days.

Comparison 1 Intravenous iron versus oral iron, Outcome 8 SF‐36: Vitality ‐ 14 days.
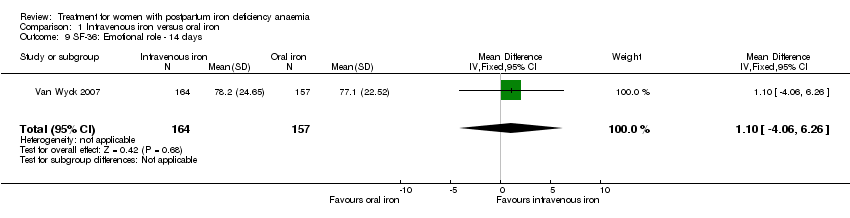
Comparison 1 Intravenous iron versus oral iron, Outcome 9 SF‐36: Emotional role ‐ 14 days.

Comparison 1 Intravenous iron versus oral iron, Outcome 10 SF‐36: Social function ‐ 14 days.
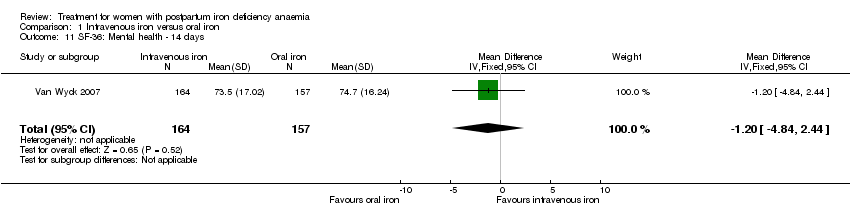
Comparison 1 Intravenous iron versus oral iron, Outcome 11 SF‐36: Mental health ‐ 14 days.

Comparison 1 Intravenous iron versus oral iron, Outcome 12 Depression.

Comparison 1 Intravenous iron versus oral iron, Outcome 13 Infections.

Comparison 1 Intravenous iron versus oral iron, Outcome 14 Compliance to treatment.

Comparison 1 Intravenous iron versus oral iron, Outcome 15 All gastrointestinal symptoms.
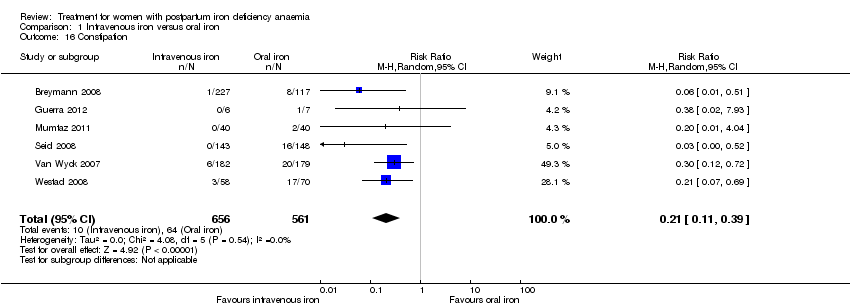
Comparison 1 Intravenous iron versus oral iron, Outcome 16 Constipation.
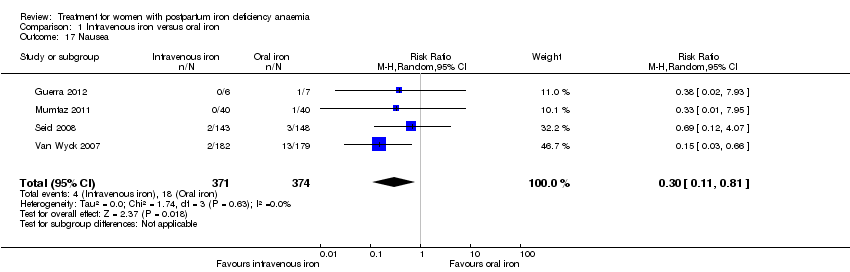
Comparison 1 Intravenous iron versus oral iron, Outcome 17 Nausea.

Comparison 1 Intravenous iron versus oral iron, Outcome 18 Gastrointestinal pain.

Comparison 1 Intravenous iron versus oral iron, Outcome 19 Diarrhoea.

Comparison 1 Intravenous iron versus oral iron, Outcome 20 Vomiting.

Comparison 1 Intravenous iron versus oral iron, Outcome 21 Dyspepsia.

Comparison 1 Intravenous iron versus oral iron, Outcome 22 Dysgeusia.
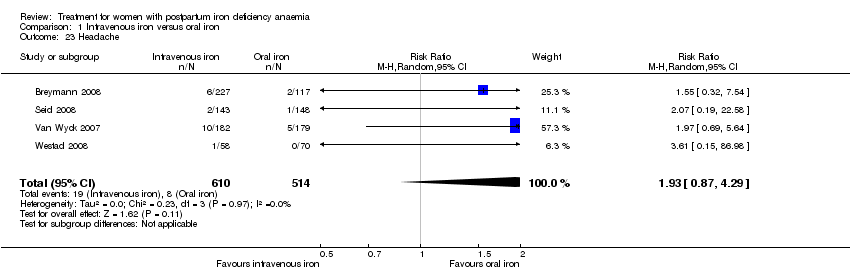
Comparison 1 Intravenous iron versus oral iron, Outcome 23 Headache.

Comparison 1 Intravenous iron versus oral iron, Outcome 24 Hepatic involvement.
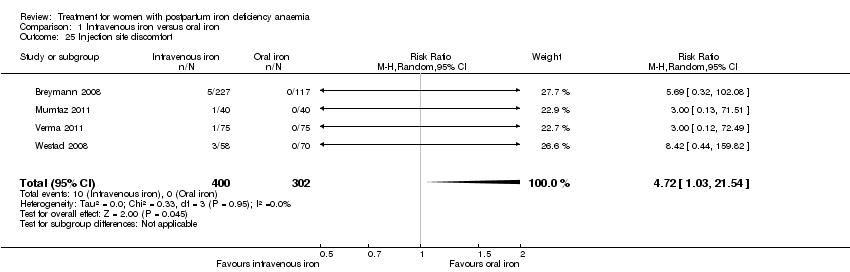
Comparison 1 Intravenous iron versus oral iron, Outcome 25 Injection site discomfort.
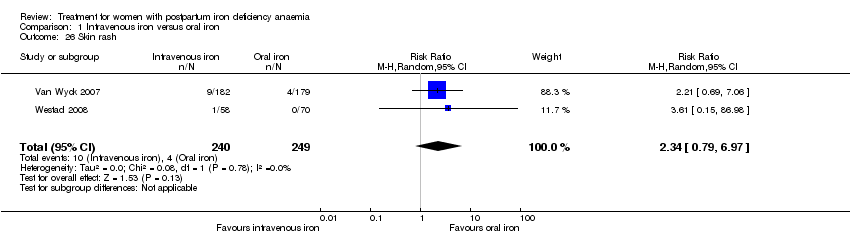
Comparison 1 Intravenous iron versus oral iron, Outcome 26 Skin rash.

Comparison 1 Intravenous iron versus oral iron, Outcome 27 Urticaria.

Comparison 1 Intravenous iron versus oral iron, Outcome 28 Flush.
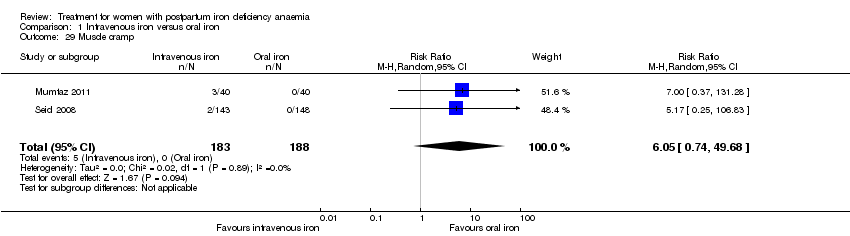
Comparison 1 Intravenous iron versus oral iron, Outcome 29 Muscle cramp.

Comparison 1 Intravenous iron versus oral iron, Outcome 30 Pain (not specified).

Comparison 1 Intravenous iron versus oral iron, Outcome 31 Seriouse adverse events (not specified).

Comparison 1 Intravenous iron versus oral iron, Outcome 32 Anaphylaxis or evidence of hypersensitivity.
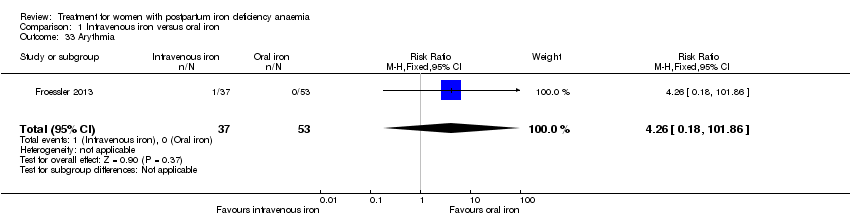
Comparison 1 Intravenous iron versus oral iron, Outcome 33 Arythmia.

Comparison 1 Intravenous iron versus oral iron, Outcome 34 Red blood cell transfusion.
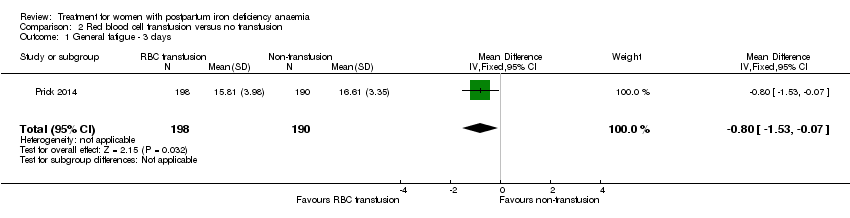
Comparison 2 Red blood cell transfusion versus no transfusion, Outcome 1 General fatigue ‐ 3 days.

Comparison 2 Red blood cell transfusion versus no transfusion, Outcome 2 General fatigue ‐ 6 weeks.

Comparison 2 Red blood cell transfusion versus no transfusion, Outcome 3 SF‐36: Physical functioning ‐ 1 week.
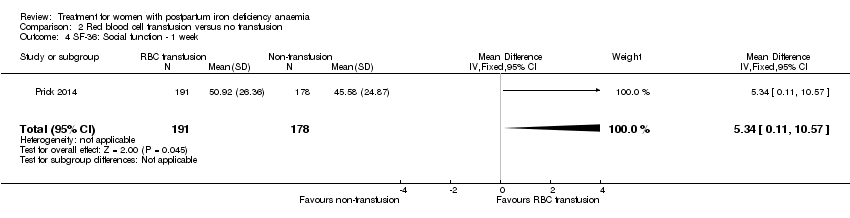
Comparison 2 Red blood cell transfusion versus no transfusion, Outcome 4 SF‐36: Social function ‐ 1 week.

Comparison 2 Red blood cell transfusion versus no transfusion, Outcome 5 SF‐36: Physical role ‐ 1 week.

Comparison 2 Red blood cell transfusion versus no transfusion, Outcome 6 SF‐36: Bodily pain ‐ 1 week.
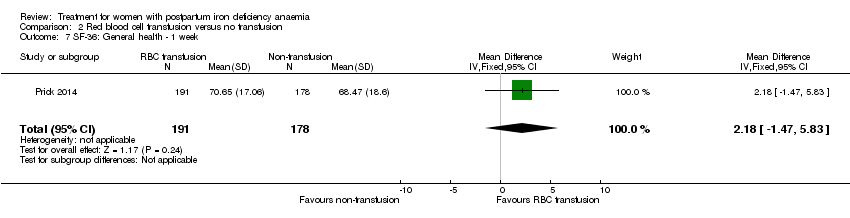
Comparison 2 Red blood cell transfusion versus no transfusion, Outcome 7 SF‐36: General health ‐ 1 week.
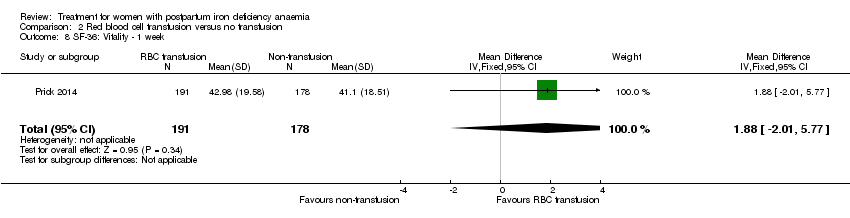
Comparison 2 Red blood cell transfusion versus no transfusion, Outcome 8 SF‐36: Vitality ‐ 1 week.

Comparison 2 Red blood cell transfusion versus no transfusion, Outcome 9 SF‐36: Emotional role ‐ 1 week.

Comparison 2 Red blood cell transfusion versus no transfusion, Outcome 10 SF‐36: Mental health ‐ 1 week.

Comparison 2 Red blood cell transfusion versus no transfusion, Outcome 11 Infections.
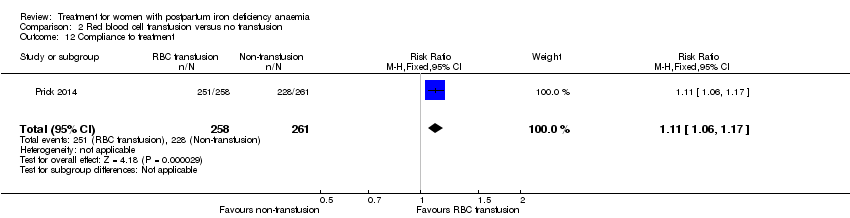
Comparison 2 Red blood cell transfusion versus no transfusion, Outcome 12 Compliance to treatment.

Comparison 2 Red blood cell transfusion versus no transfusion, Outcome 13 Breastfeeding at six weeks.

Comparison 2 Red blood cell transfusion versus no transfusion, Outcome 14 Erythrocyte alloantibody formation.

Comparison 2 Red blood cell transfusion versus no transfusion, Outcome 15 Rash.

Comparison 2 Red blood cell transfusion versus no transfusion, Outcome 16 Fever.
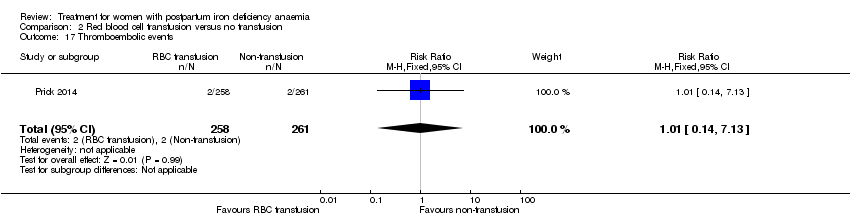
Comparison 2 Red blood cell transfusion versus no transfusion, Outcome 17 Thromboembolic events.

Comparison 2 Red blood cell transfusion versus no transfusion, Outcome 18 Parenteral iron intolerance.

Comparison 2 Red blood cell transfusion versus no transfusion, Outcome 19 Transfusion reactions.

Comparison 3 Oral iron versus placebo, Outcome 1 Digit Symbol Substitution test ‐ 10 weeks.

Comparison 3 Oral iron versus placebo, Outcome 2 EPDS ‐ 10 weeks.

Comparison 3 Oral iron versus placebo, Outcome 3 STAI ‐ 10 weeks.

Comparison 3 Oral iron versus placebo, Outcome 4 Percieved Stress ‐ 10 weeks.

Comparison 3 Oral iron versus placebo, Outcome 5 Breastfeeding at two days postpartum.

Comparison 3 Oral iron versus placebo, Outcome 6 Back pain.

Comparison 3 Oral iron versus placebo, Outcome 7 All gastrointestinal symptoms.
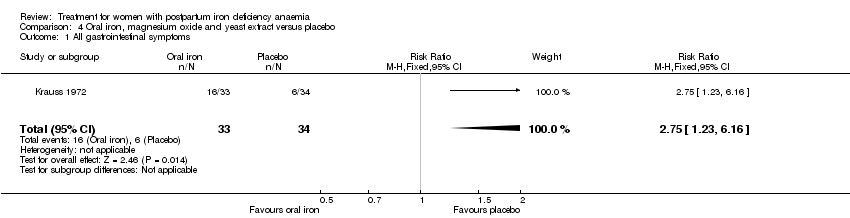
Comparison 4 Oral iron, magnesium oxide and yeast extract versus placebo, Outcome 1 All gastrointestinal symptoms.

Comparison 5 Intravenous iron and oral iron after 4 weeks versus oral iron (week 5‐12), Outcome 1 All gastrointestinal symptoms.
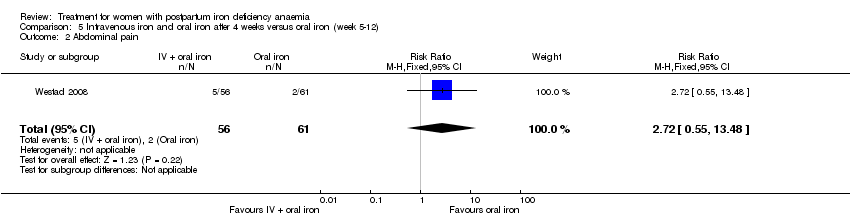
Comparison 5 Intravenous iron and oral iron after 4 weeks versus oral iron (week 5‐12), Outcome 2 Abdominal pain.

Comparison 5 Intravenous iron and oral iron after 4 weeks versus oral iron (week 5‐12), Outcome 3 Constipation.

Comparison 5 Intravenous iron and oral iron after 4 weeks versus oral iron (week 5‐12), Outcome 4 Diarrhoea.
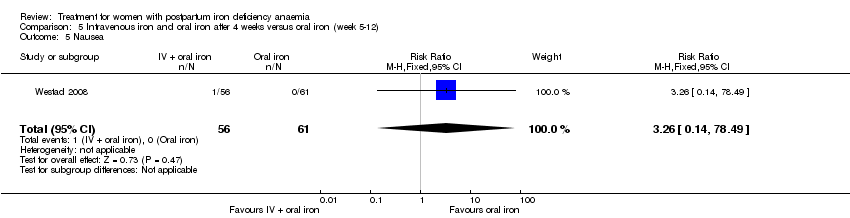
Comparison 5 Intravenous iron and oral iron after 4 weeks versus oral iron (week 5‐12), Outcome 5 Nausea.

Comparison 5 Intravenous iron and oral iron after 4 weeks versus oral iron (week 5‐12), Outcome 6 Dysgeusia.

Comparison 5 Intravenous iron and oral iron after 4 weeks versus oral iron (week 5‐12), Outcome 7 Flatulence.

Comparison 5 Intravenous iron and oral iron after 4 weeks versus oral iron (week 5‐12), Outcome 8 Melaena.
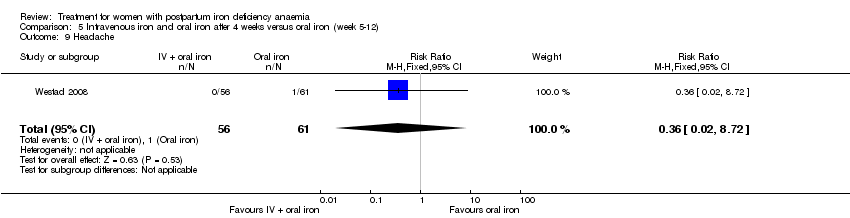
Comparison 5 Intravenous iron and oral iron after 4 weeks versus oral iron (week 5‐12), Outcome 9 Headache.

Comparison 6 Intravenous iron and oral iron versus oral iron, Outcome 1 Persistent anaemia symptoms on a VAS scale: 1 week.

Comparison 6 Intravenous iron and oral iron versus oral iron, Outcome 2 Persistent anaemia symptoms on a VAS scale: 2 week.
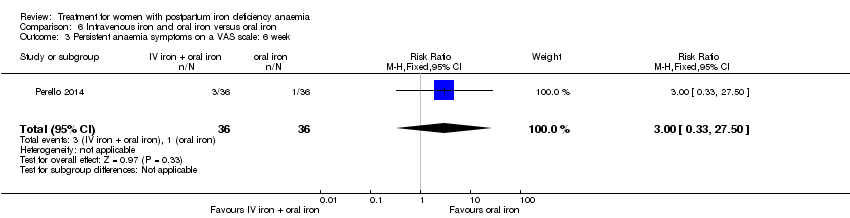
Comparison 6 Intravenous iron and oral iron versus oral iron, Outcome 3 Persistent anaemia symptoms on a VAS scale: 6 week.
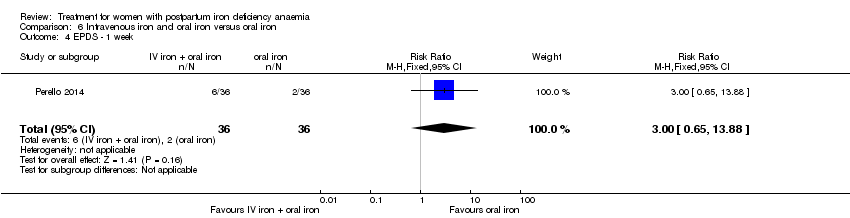
Comparison 6 Intravenous iron and oral iron versus oral iron, Outcome 4 EPDS ‐ 1 week.

Comparison 6 Intravenous iron and oral iron versus oral iron, Outcome 5 Length of hospital stay.
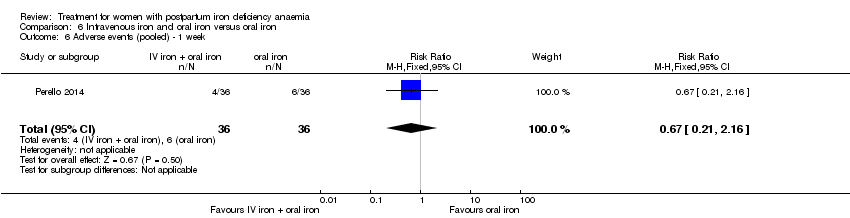
Comparison 6 Intravenous iron and oral iron versus oral iron, Outcome 6 Adverse events (pooled) ‐ 1 week.
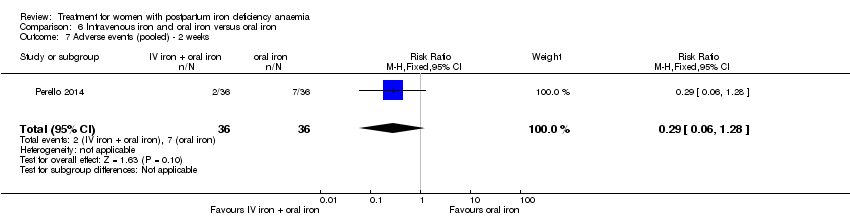
Comparison 6 Intravenous iron and oral iron versus oral iron, Outcome 7 Adverse events (pooled) ‐ 2 weeks.
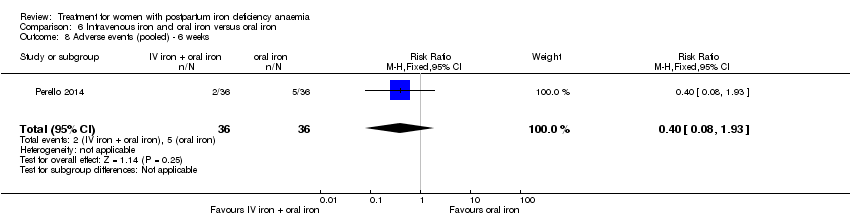
Comparison 6 Intravenous iron and oral iron versus oral iron, Outcome 8 Adverse events (pooled) ‐ 6 weeks.

Comparison 6 Intravenous iron and oral iron versus oral iron, Outcome 9 Red blood cell transfusion.

Comparison 6 Intravenous iron and oral iron versus oral iron, Outcome 10 Anaphylaxis or evidence of hypersensitivity.

Comparison 7 Erythropoietin (regardless of route) and intravenous iron versus intravenous iron, Outcome 1 Postpartum depression.
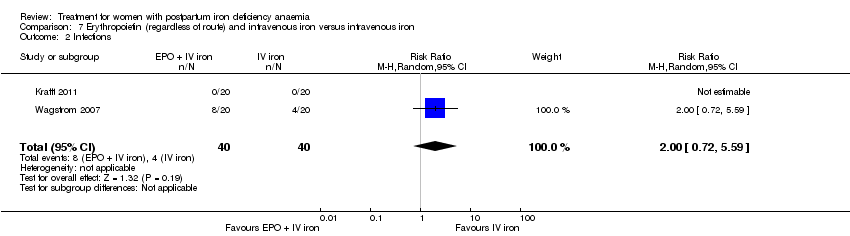
Comparison 7 Erythropoietin (regardless of route) and intravenous iron versus intravenous iron, Outcome 2 Infections.
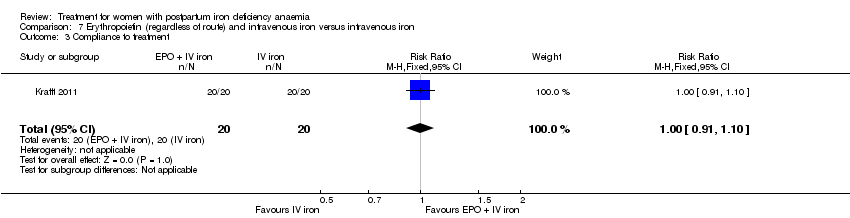
Comparison 7 Erythropoietin (regardless of route) and intravenous iron versus intravenous iron, Outcome 3 Compliance to treatment.

Comparison 7 Erythropoietin (regardless of route) and intravenous iron versus intravenous iron, Outcome 4 Breasfeeding.

Comparison 7 Erythropoietin (regardless of route) and intravenous iron versus intravenous iron, Outcome 5 Dysgeusia.
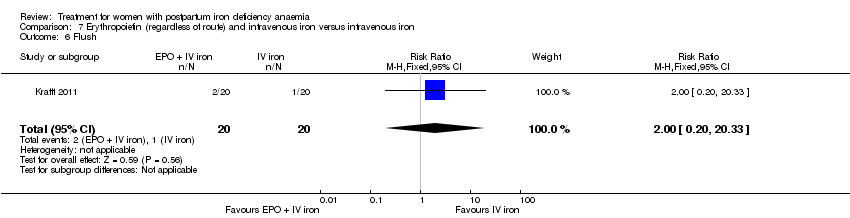
Comparison 7 Erythropoietin (regardless of route) and intravenous iron versus intravenous iron, Outcome 6 Flush.
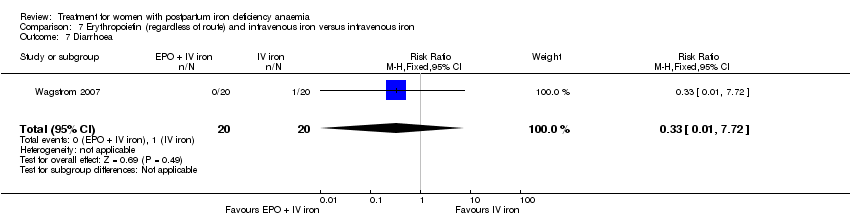
Comparison 7 Erythropoietin (regardless of route) and intravenous iron versus intravenous iron, Outcome 7 Diarrhoea.

Comparison 7 Erythropoietin (regardless of route) and intravenous iron versus intravenous iron, Outcome 8 Headache.

Comparison 7 Erythropoietin (regardless of route) and intravenous iron versus intravenous iron, Outcome 9 Itching (including elevated liver enzymes).

Comparison 7 Erythropoietin (regardless of route) and intravenous iron versus intravenous iron, Outcome 10 Dizziness.
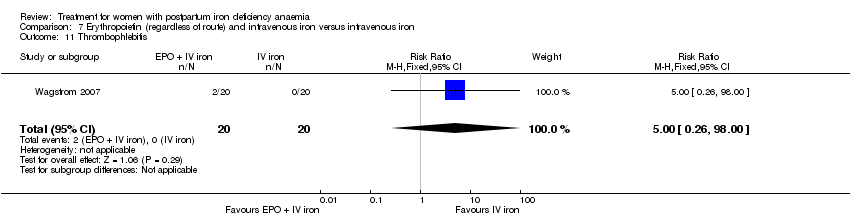
Comparison 7 Erythropoietin (regardless of route) and intravenous iron versus intravenous iron, Outcome 11 Thrombophlebitis.

Comparison 7 Erythropoietin (regardless of route) and intravenous iron versus intravenous iron, Outcome 12 Red blood cell transfusion.
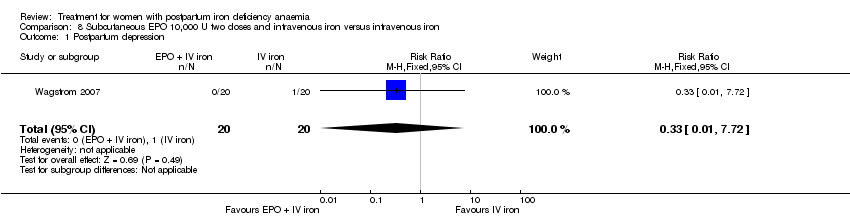
Comparison 8 Subcutaneous EPO 10,000 U two doses and intravenous iron versus intravenous iron, Outcome 1 Postpartum depression.
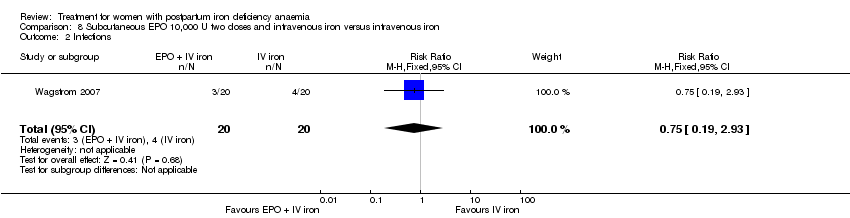
Comparison 8 Subcutaneous EPO 10,000 U two doses and intravenous iron versus intravenous iron, Outcome 2 Infections.
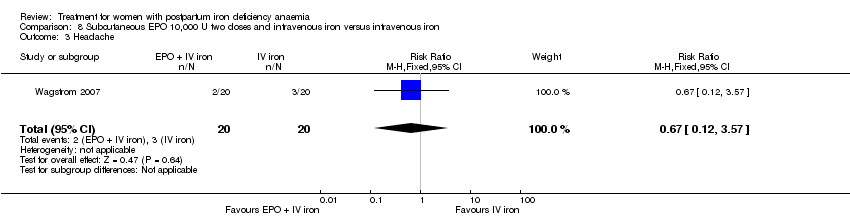
Comparison 8 Subcutaneous EPO 10,000 U two doses and intravenous iron versus intravenous iron, Outcome 3 Headache.

Comparison 8 Subcutaneous EPO 10,000 U two doses and intravenous iron versus intravenous iron, Outcome 4 Low blood pressure.

Comparison 8 Subcutaneous EPO 10,000 U two doses and intravenous iron versus intravenous iron, Outcome 5 Diarrhoea.

Comparison 8 Subcutaneous EPO 10,000 U two doses and intravenous iron versus intravenous iron, Outcome 6 Dizziness.
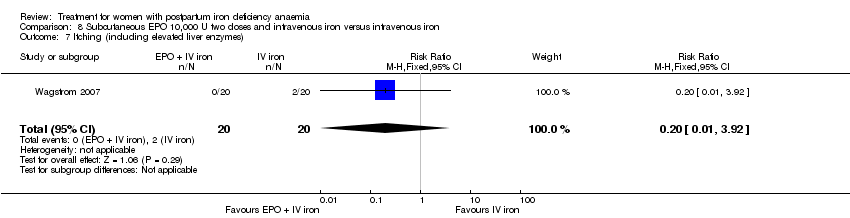
Comparison 8 Subcutaneous EPO 10,000 U two doses and intravenous iron versus intravenous iron, Outcome 7 Itching (including elevated liver enzymes).

Comparison 8 Subcutaneous EPO 10,000 U two doses and intravenous iron versus intravenous iron, Outcome 8 Red blood cell transfusion.

Comparison 9 Intravenous EPO, intravenous iron and oral iron versus intravenous iron and oral iron, Outcome 1 Leg paraesthesia.
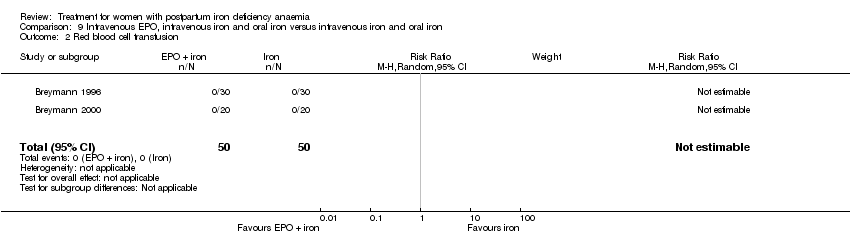
Comparison 9 Intravenous EPO, intravenous iron and oral iron versus intravenous iron and oral iron, Outcome 2 Red blood cell transfusion.

Comparison 10 Subcutaneous EPO and oral iron versus oral iron, Outcome 1 Breastfeeding.
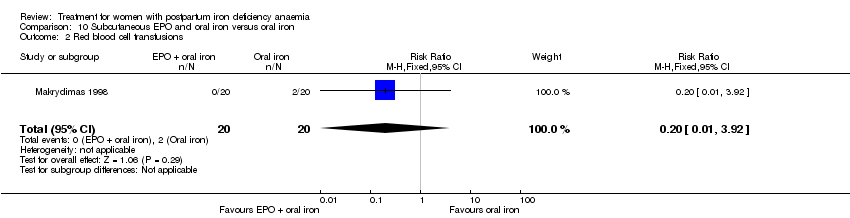
Comparison 10 Subcutaneous EPO and oral iron versus oral iron, Outcome 2 Red blood cell transfusions.
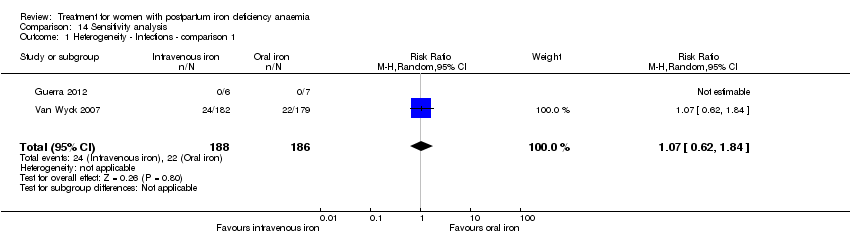
Comparison 14 Sensitivity analysis, Outcome 1 Heterogeneity ‐ Infections ‐ comparison 1.

Comparison 14 Sensitivity analysis, Outcome 2 Heterogeneity, fixed effect ‐ Infections ‐ comparison 1.
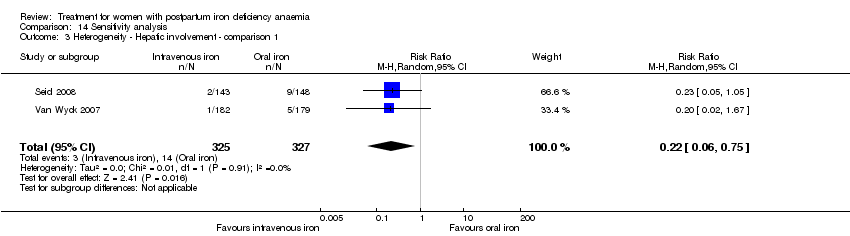
Comparison 14 Sensitivity analysis, Outcome 3 Heterogeneity ‐ Hepatic involvement ‐ comparison 1.

Comparison 14 Sensitivity analysis, Outcome 4 Heterogeneity, fixed effect ‐ Hepatic involvement ‐ comparison 1.
| Intravenous iron compared with oral iron for women with postpartum iron deficiency anaemia | ||||||
| Patient or population: women with postpartum iron deficiency anaemia | ||||||
| Outcomes | Illustrative comparative risks* (95% CI) | Relative effect | No of Participants | Quality of the evidence | Comments | |
| Assumed risk | Corresponding risk | |||||
| Oral iron | Intravenous iron | |||||
| Maternal mortality | Study population | RR 2.95 | 374 | ⊕⊕⊝⊝ | 1 maternal death was reported across the included studies. | |
| 0 per 1000 | 0 per 1000 | |||||
| Moderate | ||||||
| 0 per 1000 | 0 per 1000 | |||||
| Fatigue at 14, 28, and 42 days | See comment | See comment | Not estimable | 361 | ⊕⊝⊝⊝ | No statistically significant difference was found at days 14 and 42 days. |
| Persistent anaemia symptoms ‐ not reported | See comment | See comment | Not estimable | ‐ | See comment | Not reported. |
| Infections | Study population | RR 1.7 | 718 | ⊕⊝⊝⊝ | ||
| 86 per 1000 | 146 per 1000 | |||||
| Moderate | ||||||
| 34 per 1000 | 58 per 1000 | |||||
| Constipation | Study population | RR 0.21 | 1217 | ⊕⊝⊝⊝ | ||
| 114 per 1000 | 24 per 1000 | |||||
| Moderate | ||||||
| 112 per 1000 | 24 per 1000 | |||||
| All gastrointestinal symptoms | Study population | RR 0.31 | 1307 | ⊕⊝⊝⊝ | ||
| 216 per 1000 | 67 per 1000 | |||||
| Moderate | ||||||
| 261 per 1000 | 81 per 1000 | |||||
| Anaphylaxis or evidence of hypersensitivity | Study population | RR 2.78 | 1454 | ⊕⊕⊝⊝ | 3 cases of allergic reactions all occurred in the group treated with intravenous iron. | |
| 0 per 1000 | 0 per 1000 | |||||
| Moderate | ||||||
| 0 per 1000 | 0 per 1000 | |||||
| *The basis for the assumed risk (e.g. the median control group risk across studies) is provided in footnotes. The corresponding risk (and its 95% confidence interval) is based on the assumed risk in the comparison group and the relative effect of the intervention (and its 95% CI). | ||||||
| GRADE Working Group grades of evidence | ||||||
| 1 The outcome is unlikely to be influenced by risk of bias and so we did not downgrade the evidence for this outcome: open‐label design combined with a objective outcome measure. | ||||||
| Red blood cell transfusion compared with non‐transfusion for postpartum iron deficiency anaemia | ||||||
| Patient or population: patients with postpartum iron deficiency anaemia | ||||||
| Outcomes | Illustrative comparative risks* (95% CI) | Relative effect | No of Participants | Quality of the evidence | Comments | |
| Assumed risk | Corresponding risk | |||||
| Non‐transfusion | RBC transfusion | |||||
| Maternal mortality ‐ not reported | See comment | See comment | Not estimable | ‐ | See comment | Not reported. |
| Fatigue | See comment | See comment | 519 | ⊕⊕⊝⊝ | General fatigue at 3 days was 0.8 lower (1.53 to 0.07) in the transfused group. No statistically significant difference was seen at six weeks. | |
| Persistent anaemia symptoms | Study population | Not estimable | 519 | ⊕⊝⊝⊝ | The outcome was not systematically registered/reported. | |
| See comment | See comment | |||||
| Moderate | ||||||
| Infections | Study population | RR 0.93 | 519 | ⊕⊕⊕⊝ | ||
| 92 per 1000 | 86 per 1000 | |||||
| Moderate | ||||||
| 92 per 1000 | 86 per 1000 | |||||
| Erythrocyte alloantibody formation | Study population | RR 3.03 | 519 | ⊕⊝⊝⊝ | There was no systematical screening for this outcome in the study population. | |
| 0 per 1000 | 0 per 1000 | |||||
| Moderate | ||||||
| 0 per 1000 | 0 per 1000 | |||||
| Thromboembolic events | Study population | RR 1.01 | 519 | ⊕⊕⊝⊝ | ||
| 8 per 1000 | 8 per 1000 | |||||
| Moderate | ||||||
| 8 per 1000 | 8 per 1000 | |||||
| Transfusion reactions | Study population | RR 7.08 | 519 | ⊕⊝⊝⊝ | 3 cases of transfusion reactions occurred in the transfusion group. | |
| 0 per 1000 | 0 per 1000 | |||||
| Moderate | ||||||
| 0 per 1000 | 0 per 1000 | |||||
| *The basis for the assumed risk (e.g. the median control group risk across studies) is provided in footnotes. The corresponding risk (and its 95% confidence interval) is based on the assumed risk in the comparison group and the relative effect of the intervention (and its 95% CI). | ||||||
| GRADE Working Group grades of evidence | ||||||
| 1 Downgraded two levels due to risk of bias: open‐label design combined with a subjective outcome measure. | ||||||
| Oral iron compared with placebo for women with postpartum iron deficiency anaemia | ||||||
| Patient or population: women with postpartum iron deficiency anaemia | ||||||
| Outcomes | Illustrative comparative risks* (95% CI) | Relative effect | No of Participants | Quality of the evidence | Comments | |
| Assumed risk | Corresponding risk | |||||
| Placebo | Oral iron | |||||
| Maternal mortality ‐ not reported | See comment | See comment | Not estimable | ‐ | See comment | Not reported. |
| Fatigue ‐ not reported | See comment | See comment | Not estimable | ‐ | See comment | Not reported. |
| Persistent anaemia symptoms | Study population | Not estimable | (1) | See comment | Symptoms of anaemia were not reported for the anaemic groups separately. | |
| See comment | See comment | |||||
| Moderate | ||||||
| All gastrointestinal symptoms | Study population | RR 1 | 68 | ⊕⊝⊝⊝ | ||
| 176 per 1000 | 176 per 1000 | |||||
| Moderate | ||||||
| 177 per 1000 | 177 per 1000 | |||||
| Constipation ‐ not reported | See comment | See comment | Not estimable | ‐ | See comment | Not reported. |
| *The basis for the assumed risk (e.g. the median control group risk across studies) is provided in footnotes. The corresponding risk (and its 95% confidence interval) is based on the assumed risk in the comparison group and the relative effect of the intervention (and its 95% CI). | ||||||
| GRADE Working Group grades of evidence | ||||||
| 1 Downgraded two levels due to risk of bias: open‐label design combined with a subjective outcome measure. | ||||||
| Intravenous iron with oral iron compared with oral iron for women with postpartum iron deficiency anaemia | ||||||
| Patient or population: women with postpartum iron deficiency anaemia | ||||||
| Outcomes | Illustrative comparative risks* (95% CI) | Relative effect | No of Participants | Quality of the evidence | Comments | |
| Assumed risk | Corresponding risk | |||||
| Oral iron | Intravenous iron with oral iron | |||||
| Maternal mortality | See comment | See comment | Not estimable | ‐ | See comment | In 1 study no maternal deaths were reported. The other study did not report on maternal mortality. |
| Fatigue ‐ not reported | See comment | See comment | Not estimable | ‐ | See comment | Not reported. |
| Persistent anaemia symptoms ‐ 1 week | Study population | RR 1.75 | 72 | ⊕⊝⊝⊝ | ||
| 111 per 1000 | 194 per 1000 | |||||
| Moderate | ||||||
| 111 per 1000 | 194 per 1000 | |||||
| Persistent anaemia symptoms ‐ 2 weeks | Study population | RR 0.6 | 72 | ⊕⊝⊝⊝ | ||
| 139 per 1000 | 83 per 1000 | |||||
| Moderate | ||||||
| 139 per 1000 | 83 per 1000 | |||||
| Persistent anaemia symptoms ‐ 6 weeks | Study population | RR 3 | 72 | ⊕⊝⊝⊝ | ||
| 28 per 1000 | 83 per 1000 | |||||
| Moderate | ||||||
| 28 per 1000 | 84 per 1000 | |||||
| Infections ‐ not reported | See comment | See comment | Not estimable | ‐ | See comment | Not reported. |
| Anaphylaxis or evidence of hypersensitivity | Study population | Not estimable | 0 | ⊕⊕⊝⊝ | 1 study reported 0 events, other study pooled adverse events, not reporting allergic reactions separately. Thus the effect was not estimable. | |
| See comment | See comment | |||||
| Moderate | ||||||
| *The basis for the assumed risk (e.g. the median control group risk across studies) is provided in footnotes. The corresponding risk (and its 95% confidence interval) is based on the assumed risk in the comparison group and the relative effect of the intervention (and its 95% CI). | ||||||
| GRADE Working Group grades of evidence | ||||||
| 1 Downgraded two levels due to risk of bias: the included study had high risk of attrition and reporting bias. | ||||||
| Erythropoietin (regardless of rout) with intravenous iron compared with intravenous iron for women with postpartum iron deficiency anaemia | ||||||
| Patient or population: women with postpartum iron deficiency anaemia | ||||||
| Outcomes | Illustrative comparative risks* (95% CI) | Relative effect | No of Participants | Quality of the evidence | Comments | |
| Assumed risk | Corresponding risk | |||||
| Intravenous iron | EPO (regardless of rout) with IV iron | |||||
| Maternal mortality | See comment | See comment | Not estimable | ‐ | See comment | In 1 study no maternal deaths were reported. The other study did not report on maternal mortality. |
| Fatigue ‐ not reported | See comment | See comment | Not estimable | ‐ | See comment | Not reported. |
| Thromboembolic events ‐ not reported | See comment | See comment | Not estimable | ‐ | See comment | Not reported. |
| Persistent anaemia symptoms ‐ not reported | See comment | See comment | Not estimable | ‐ | See comment | Not reported. |
| *The basis for the assumed risk (e.g. the median control group risk across studies) is provided in footnotes. The corresponding risk (and its 95% confidence interval) is based on the assumed risk in the comparison group and the relative effect of the intervention (and its 95% CI). | ||||||
| GRADE Working Group grades of evidence | ||||||
| Subcutaneous EPO 10,000 U of doses with intravenous iron compared with intravenous iron for women with postpartum iron deficiency anaemia | ||||||
| Patient or population: patients with women with postpartum iron deficiency anaemia | ||||||
| Outcomes | Illustrative comparative risks* (95% CI) | Relative effect | No of Participants | Quality of the evidence | Comments | |
| Assumed risk | Corresponding risk | |||||
| Intravenous iron | Erythropoietin 10,000 U 2 doses with intravenous iron | |||||
| Maternal mortality ‐ not reported | See comment | See comment | Not estimable | ‐ | See comment | Not reported. |
| Fatigue ‐ not reported | See comment | See comment | Not estimable | ‐ | See comment | Not reported. |
| Persistent anaemia symptoms ‐ not reported | See comment | See comment | Not estimable | ‐ | See comment | Not reported. |
| Thromboembolic events ‐ not reported | See comment | See comment | Not estimable | ‐ | See comment | Not reported. |
| *The basis for the assumed risk (e.g. the median control group risk across studies) is provided in footnotes. The corresponding risk (and its 95% confidence interval) is based on the assumed risk in the comparison group and the relative effect of the intervention (and its 95% CI). | ||||||
| GRADE Working Group grades of evidence | ||||||
| Subcutaneous EPO with oral iron compared with oral iron for women with postpartum iron deficiency anaemia | ||||||
| Patient or population: women with postpartum iron deficiency anaemia | ||||||
| Outcomes | Illustrative comparative risks* (95% CI) | Relative effect | No of Participants | Quality of the evidence | Comments | |
| Assumed risk | Corresponding risk | |||||
| Oral iron | Subcutaneous EPO with oral iron | |||||
| Maternal mortality | See comment | See comment | Not estimable | 40 | See comment | No maternal deaths were reported. |
| Fatigue ‐ not reported | See comment | See comment | Not estimable | ‐ | See comment | Not reported. |
| Persistent anaemia symptoms ‐ not reported | See comment | See comment | Not estimable | ‐ | See comment | Not reported. |
| Thromboembolic events ‐ not reported | See comment | See comment | Not estimable | ‐ | See comment | Not reported. |
| *The basis for the assumed risk (e.g. the median control group risk across studies) is provided in footnotes. The corresponding risk (and its 95% confidence interval) is based on the assumed risk in the comparison group and the relative effect of the intervention (and its 95% CI). | ||||||
| GRADE Working Group grades of evidence | ||||||
| Subcutaneous EPO with IV iron and oral iron compared with intravenous iron with oral iron for women with postpartum iron deficiency anaemia | ||||||
| Patient or population: women with postpartum iron deficiency anaemia | ||||||
| Outcomes | Illustrative comparative risks* (95% CI) | Relative effect | No of Participants | Quality of the evidence | Comments | |
| Assumed risk | Corresponding risk | |||||
| Intravenous iron + oral iron | Subcutaneous EPO + IV iron + oral iron | |||||
| Maternal mortality ‐ not reported | See comment | See comment | Not estimable | ‐ | See comment | Not reported. |
| Fatigue ‐ not reported | See comment | See comment | Not estimable | ‐ | See comment | Not reported. |
| Persistent anaemia symptoms ‐ not reported | See comment | See comment | Not estimable | ‐ | See comment | Not reported. |
| Thromboembolic events ‐ not reported | See comment | See comment | Not estimable | ‐ | See comment | Not reported. |
| *The basis for the assumed risk (e.g. the median control group risk across studies) is provided in footnotes. The corresponding risk (and its 95% confidence interval) is based on the assumed risk in the comparison group and the relative effect of the intervention (and its 95% CI). | ||||||
| GRADE Working Group grades of evidence | ||||||
| Outcome or subgroup title | No. of studies | No. of participants | Statistical method | Effect size |
| 1 Maternal mortality Show forest plot | 2 | 374 | Risk Ratio (M‐H, Random, 95% CI) | 2.95 [0.12, 71.96] |
| 2 Fatigue ‐ 14 days Show forest plot | 1 | 322 | Mean Difference (IV, Fixed, 95% CI) | ‐3.30 [‐8.04, 1.44] |
| 3 Fatigue ‐ 42 days Show forest plot | 1 | 329 | Mean Difference (IV, Fixed, 95% CI) | ‐2.10 [‐6.77, 2.57] |
| 4 SF‐36: Physical F(x) ‐ 14 days Show forest plot | 1 | 320 | Mean Difference (IV, Fixed, 95% CI) | 0.90 [‐3.84, 5.64] |
| 5 SF‐36: Physical role ‐ 14 days Show forest plot | 1 | 321 | Mean Difference (IV, Fixed, 95% CI) | 3.50 [‐2.03, 9.03] |
| 6 SF‐36: Bodily pain ‐ day 14 Show forest plot | 1 | 321 | Mean Difference (IV, Fixed, 95% CI) | ‐0.70 [‐6.00, 4.60] |
| 7 SF‐36: General health ‐ 14 days Show forest plot | 1 | 321 | Mean Difference (IV, Fixed, 95% CI) | 0.70 [‐3.09, 4.49] |
| 8 SF‐36: Vitality ‐ 14 days Show forest plot | 1 | 321 | Mean Difference (IV, Fixed, 95% CI) | 0.90 [‐3.64, 5.44] |
| 9 SF‐36: Emotional role ‐ 14 days Show forest plot | 1 | 321 | Mean Difference (IV, Fixed, 95% CI) | 1.10 [‐4.06, 6.26] |
| 10 SF‐36: Social function ‐ 14 days Show forest plot | 1 | 321 | Mean Difference (IV, Fixed, 95% CI) | 1.0 [‐4.08, 6.08] |
| 11 SF‐36: Mental health ‐ 14 days Show forest plot | 1 | 321 | Mean Difference (IV, Fixed, 95% CI) | ‐1.20 [‐4.84, 2.44] |
| 12 Depression Show forest plot | 1 | 361 | Risk Ratio (M‐H, Fixed, 95% CI) | 0.33 [0.01, 8.00] |
| 13 Infections Show forest plot | 3 | 718 | Risk Ratio (M‐H, Random, 95% CI) | 1.70 [0.58, 5.03] |
| 14 Compliance to treatment Show forest plot | 5 | 890 | Risk Ratio (M‐H, Random, 95% CI) | 1.17 [1.01, 1.35] |
| 15 All gastrointestinal symptoms Show forest plot | 8 | 1307 | Risk Ratio (M‐H, Random, 95% CI) | 0.31 [0.20, 0.47] |
| 16 Constipation Show forest plot | 6 | 1217 | Risk Ratio (M‐H, Random, 95% CI) | 0.21 [0.11, 0.39] |
| 17 Nausea Show forest plot | 4 | 745 | Risk Ratio (M‐H, Random, 95% CI) | 0.30 [0.11, 0.81] |
| 18 Gastrointestinal pain Show forest plot | 4 | 543 | Risk Ratio (M‐H, Random, 95% CI) | 0.18 [0.04, 0.83] |
| 19 Diarrhoea Show forest plot | 3 | 569 | Risk Ratio (M‐H, Random, 95% CI) | 0.11 [0.02, 0.59] |
| 20 Vomiting Show forest plot | 1 | 128 | Risk Ratio (M‐H, Fixed, 95% CI) | 0.40 [0.02, 9.66] |
| 21 Dyspepsia Show forest plot | 2 | 93 | Risk Ratio (M‐H, Random, 95% CI) | 0.36 [0.04, 3.20] |
| 22 Dysgeusia Show forest plot | 4 | 543 | Risk Ratio (M‐H, Random, 95% CI) | 7.20 [1.63, 31.76] |
| 23 Headache Show forest plot | 4 | 1124 | Risk Ratio (M‐H, Random, 95% CI) | 1.93 [0.87, 4.29] |
| 24 Hepatic involvement Show forest plot | 3 | 996 | Risk Ratio (M‐H, Random, 95% CI) | 0.45 [0.12, 1.71] |
| 25 Injection site discomfort Show forest plot | 4 | 702 | Risk Ratio (M‐H, Random, 95% CI) | 4.72 [1.03, 21.54] |
| 26 Skin rash Show forest plot | 2 | 489 | Risk Ratio (M‐H, Random, 95% CI) | 2.34 [0.79, 6.97] |
| 27 Urticaria Show forest plot | 1 | 291 | Risk Ratio (M‐H, Fixed, 95% CI) | 4.14 [0.47, 36.59] |
| 28 Flush Show forest plot | 2 | 124 | Risk Ratio (M‐H, Random, 95% CI) | 9.00 [1.18, 68.81] |
| 29 Muscle cramp Show forest plot | 2 | 371 | Risk Ratio (M‐H, Random, 95% CI) | 6.05 [0.74, 49.68] |
| 30 Pain (not specified) Show forest plot | 1 | 128 | Risk Ratio (M‐H, Fixed, 95% CI) | 8.42 [0.44, 159.82] |
| 31 Seriouse adverse events (not specified) Show forest plot | 1 | 291 | Risk Ratio (M‐H, Fixed, 95% CI) | 1.03 [0.26, 4.06] |
| 32 Anaphylaxis or evidence of hypersensitivity Show forest plot | 8 | 1454 | Risk Ratio (M‐H, Random, 95% CI) | 2.78 [0.31, 24.92] |
| 33 Arythmia Show forest plot | 1 | 90 | Risk Ratio (M‐H, Fixed, 95% CI) | 4.26 [0.18, 101.86] |
| 34 Red blood cell transfusion Show forest plot | 4 | 606 | Risk Ratio (M‐H, Random, 95% CI) | 0.48 [0.19, 1.23] |
| Outcome or subgroup title | No. of studies | No. of participants | Statistical method | Effect size |
| 1 General fatigue ‐ 3 days Show forest plot | 1 | 388 | Mean Difference (IV, Fixed, 95% CI) | ‐0.80 [‐1.53, ‐0.07] |
| 2 General fatigue ‐ 6 weeks Show forest plot | 1 | 318 | Mean Difference (IV, Fixed, 95% CI) | ‐0.25 [‐1.22, 0.72] |
| 3 SF‐36: Physical functioning ‐ 1 week Show forest plot | 1 | 368 | Mean Difference (IV, Fixed, 95% CI) | 5.67 [0.84, 10.50] |
| 4 SF‐36: Social function ‐ 1 week Show forest plot | 1 | 369 | Mean Difference (IV, Fixed, 95% CI) | 5.34 [0.11, 10.57] |
| 5 SF‐36: Physical role ‐ 1 week Show forest plot | 1 | 366 | Mean Difference (IV, Fixed, 95% CI) | 4.56 [‐1.41, 10.53] |
| 6 SF‐36: Bodily pain ‐ 1 week Show forest plot | 1 | 368 | Mean Difference (IV, Fixed, 95% CI) | ‐2.0 [‐5.90, 1.90] |
| 7 SF‐36: General health ‐ 1 week Show forest plot | 1 | 369 | Mean Difference (IV, Fixed, 95% CI) | 2.18 [‐1.47, 5.83] |
| 8 SF‐36: Vitality ‐ 1 week Show forest plot | 1 | 369 | Mean Difference (IV, Fixed, 95% CI) | 1.88 [‐2.01, 5.77] |
| 9 SF‐36: Emotional role ‐ 1 week Show forest plot | 1 | 368 | Mean Difference (IV, Fixed, 95% CI) | 4.37 [‐4.51, 13.25] |
| 10 SF‐36: Mental health ‐ 1 week Show forest plot | 1 | 369 | Mean Difference (IV, Fixed, 95% CI) | 1.21 [‐2.29, 4.71] |
| 11 Infections Show forest plot | 1 | 519 | Risk Ratio (M‐H, Fixed, 95% CI) | 0.93 [0.53, 1.61] |
| 12 Compliance to treatment Show forest plot | 1 | 519 | Risk Ratio (M‐H, Fixed, 95% CI) | 1.11 [1.06, 1.17] |
| 13 Breastfeeding at six weeks Show forest plot | 1 | 297 | Risk Ratio (M‐H, Fixed, 95% CI) | 0.91 [0.78, 1.07] |
| 14 Erythrocyte alloantibody formation Show forest plot | 1 | 519 | Risk Ratio (M‐H, Fixed, 95% CI) | 3.03 [0.12, 74.15] |
| 15 Rash Show forest plot | 1 | 519 | Risk Ratio (M‐H, Fixed, 95% CI) | 3.03 [0.12, 74.15] |
| 16 Fever Show forest plot | 1 | 519 | Risk Ratio (M‐H, Fixed, 95% CI) | 5.06 [0.24, 104.84] |
| 17 Thromboembolic events Show forest plot | 1 | 519 | Risk Ratio (M‐H, Fixed, 95% CI) | 1.01 [0.14, 7.13] |
| 18 Parenteral iron intolerance Show forest plot | 1 | 519 | Risk Ratio (M‐H, Fixed, 95% CI) | 0.34 [0.01, 8.24] |
| 19 Transfusion reactions Show forest plot | 1 | 519 | Risk Ratio (M‐H, Fixed, 95% CI) | 7.08 [0.37, 136.41] |
| Outcome or subgroup title | No. of studies | No. of participants | Statistical method | Effect size |
| 1 Digit Symbol Substitution test ‐ 10 weeks Show forest plot | 1 | 51 | Mean Difference (IV, Fixed, 95% CI) | 0.0 [‐2.76, 2.76] |
| 2 EPDS ‐ 10 weeks Show forest plot | 1 | 51 | Mean Difference (IV, Fixed, 95% CI) | 0.10 [‐0.86, 1.06] |
| 3 STAI ‐ 10 weeks Show forest plot | 1 | 51 | Mean Difference (IV, Fixed, 95% CI) | ‐0.40 [‐3.18, 2.38] |
| 4 Percieved Stress ‐ 10 weeks Show forest plot | 1 | 51 | Mean Difference (IV, Fixed, 95% CI) | 4.1 [1.70, 6.50] |
| 5 Breastfeeding at two days postpartum Show forest plot | 1 | 122 | Risk Ratio (M‐H, Fixed, 95% CI) | 0.82 [0.58, 1.17] |
| 6 Back pain Show forest plot | 1 | 150 | Risk Ratio (M‐H, Fixed, 95% CI) | 0.66 [0.42, 1.03] |
| 7 All gastrointestinal symptoms Show forest plot | 1 | 68 | Risk Ratio (M‐H, Fixed, 95% CI) | 1.0 [0.36, 2.79] |
| Outcome or subgroup title | No. of studies | No. of participants | Statistical method | Effect size |
| 1 All gastrointestinal symptoms Show forest plot | 1 | 67 | Risk Ratio (M‐H, Fixed, 95% CI) | 2.75 [1.23, 6.16] |
| Outcome or subgroup title | No. of studies | No. of participants | Statistical method | Effect size |
| 1 All gastrointestinal symptoms Show forest plot | 1 | 117 | Risk Ratio (M‐H, Fixed, 95% CI) | 1.43 [0.83, 2.45] |
| 2 Abdominal pain Show forest plot | 1 | 117 | Risk Ratio (M‐H, Fixed, 95% CI) | 2.72 [0.55, 13.48] |
| 3 Constipation Show forest plot | 1 | 117 | Risk Ratio (M‐H, Fixed, 95% CI) | 1.20 [0.55, 2.60] |
| 4 Diarrhoea Show forest plot | 1 | 117 | Risk Ratio (M‐H, Fixed, 95% CI) | 3.27 [0.35, 30.51] |
| 5 Nausea Show forest plot | 1 | 117 | Risk Ratio (M‐H, Fixed, 95% CI) | 3.26 [0.14, 78.49] |
| 6 Dysgeusia Show forest plot | 1 | 117 | Risk Ratio (M‐H, Fixed, 95% CI) | 3.26 [0.14, 78.49] |
| 7 Flatulence Show forest plot | 1 | 117 | Risk Ratio (M‐H, Fixed, 95% CI) | 0.36 [0.02, 8.72] |
| 8 Melaena Show forest plot | 1 | 117 | Risk Ratio (M‐H, Fixed, 95% CI) | 0.36 [0.02, 8.72] |
| 9 Headache Show forest plot | 1 | 117 | Risk Ratio (M‐H, Fixed, 95% CI) | 0.36 [0.02, 8.72] |
| Outcome or subgroup title | No. of studies | No. of participants | Statistical method | Effect size |
| 1 Persistent anaemia symptoms on a VAS scale: 1 week Show forest plot | 1 | 72 | Risk Ratio (M‐H, Fixed, 95% CI) | 1.75 [0.56, 5.46] |
| 2 Persistent anaemia symptoms on a VAS scale: 2 week Show forest plot | 1 | 72 | Risk Ratio (M‐H, Fixed, 95% CI) | 0.6 [0.15, 2.33] |
| 3 Persistent anaemia symptoms on a VAS scale: 6 week Show forest plot | 1 | 72 | Risk Ratio (M‐H, Fixed, 95% CI) | 3.0 [0.33, 27.50] |
| 4 EPDS ‐ 1 week Show forest plot | 1 | 72 | Risk Ratio (M‐H, Fixed, 95% CI) | 3.0 [0.65, 13.88] |
| 5 Length of hospital stay Show forest plot | 1 | 72 | Mean Difference (IV, Fixed, 95% CI) | ‐0.30 [‐1.02, 0.42] |
| 6 Adverse events (pooled) ‐ 1 week Show forest plot | 1 | 72 | Risk Ratio (M‐H, Fixed, 95% CI) | 0.67 [0.21, 2.16] |
| 7 Adverse events (pooled) ‐ 2 weeks Show forest plot | 1 | 72 | Risk Ratio (M‐H, Fixed, 95% CI) | 0.29 [0.06, 1.28] |
| 8 Adverse events (pooled) ‐ 6 weeks Show forest plot | 1 | 72 | Risk Ratio (M‐H, Fixed, 95% CI) | 0.4 [0.08, 1.93] |
| 9 Red blood cell transfusion Show forest plot | 2 | 112 | Risk Ratio (M‐H, Random, 95% CI) | 1.0 [0.15, 6.72] |
| 10 Anaphylaxis or evidence of hypersensitivity Show forest plot | 1 | 40 | Risk Ratio (M‐H, Fixed, 95% CI) | 0.0 [0.0, 0.0] |
| Outcome or subgroup title | No. of studies | No. of participants | Statistical method | Effect size |
| 1 Postpartum depression Show forest plot | 1 | 40 | Risk Ratio (M‐H, Fixed, 95% CI) | 0.33 [0.01, 7.72] |
| 2 Infections Show forest plot | 2 | 80 | Risk Ratio (M‐H, Random, 95% CI) | 2.0 [0.72, 5.59] |
| 3 Compliance to treatment Show forest plot | 1 | 40 | Risk Ratio (M‐H, Fixed, 95% CI) | 1.0 [0.91, 1.10] |
| 4 Breasfeeding Show forest plot | 1 | 40 | Risk Ratio (M‐H, Fixed, 95% CI) | 1.0 [0.91, 1.10] |
| 5 Dysgeusia Show forest plot | 1 | 40 | Risk Ratio (M‐H, Fixed, 95% CI) | 0.71 [0.27, 1.88] |
| 6 Flush Show forest plot | 1 | 40 | Risk Ratio (M‐H, Fixed, 95% CI) | 2.0 [0.20, 20.33] |
| 7 Diarrhoea Show forest plot | 1 | 40 | Risk Ratio (M‐H, Fixed, 95% CI) | 0.33 [0.01, 7.72] |
| 8 Headache Show forest plot | 1 | 40 | Risk Ratio (M‐H, Fixed, 95% CI) | 0.14 [0.01, 2.60] |
| 9 Itching (including elevated liver enzymes) Show forest plot | 1 | 40 | Risk Ratio (M‐H, Fixed, 95% CI) | 0.2 [0.01, 3.92] |
| 10 Dizziness Show forest plot | 1 | 40 | Risk Ratio (M‐H, Fixed, 95% CI) | 0.33 [0.01, 7.72] |
| 11 Thrombophlebitis Show forest plot | 1 | 40 | Risk Ratio (M‐H, Fixed, 95% CI) | 5.0 [0.26, 98.00] |
| 12 Red blood cell transfusion Show forest plot | 2 | 80 | Risk Ratio (M‐H, Random, 95% CI) | 3.0 [0.13, 69.52] |
| Outcome or subgroup title | No. of studies | No. of participants | Statistical method | Effect size |
| 1 Postpartum depression Show forest plot | 1 | 40 | Risk Ratio (M‐H, Fixed, 95% CI) | 0.33 [0.01, 7.72] |
| 2 Infections Show forest plot | 1 | 40 | Risk Ratio (M‐H, Fixed, 95% CI) | 0.75 [0.19, 2.93] |
| 3 Headache Show forest plot | 1 | 40 | Risk Ratio (M‐H, Fixed, 95% CI) | 0.67 [0.12, 3.57] |
| 4 Low blood pressure Show forest plot | 1 | 40 | Risk Ratio (M‐H, Fixed, 95% CI) | 3.0 [0.13, 69.52] |
| 5 Diarrhoea Show forest plot | 1 | 40 | Risk Ratio (M‐H, Fixed, 95% CI) | 0.33 [0.01, 7.72] |
| 6 Dizziness Show forest plot | 1 | 40 | Risk Ratio (M‐H, Fixed, 95% CI) | 0.33 [0.01, 7.72] |
| 7 Itching (including elevated liver enzymes) Show forest plot | 1 | 40 | Risk Ratio (M‐H, Fixed, 95% CI) | 0.2 [0.01, 3.92] |
| 8 Red blood cell transfusion Show forest plot | 1 | 40 | Risk Ratio (M‐H, Fixed, 95% CI) | 0.0 [0.0, 0.0] |
| Outcome or subgroup title | No. of studies | No. of participants | Statistical method | Effect size |
| 1 Leg paraesthesia Show forest plot | 2 | 76 | Risk Ratio (M‐H, Random, 95% CI) | 0.72 [0.08, 6.65] |
| 2 Red blood cell transfusion Show forest plot | 2 | 100 | Risk Ratio (M‐H, Random, 95% CI) | 0.0 [0.0, 0.0] |
| Outcome or subgroup title | No. of studies | No. of participants | Statistical method | Effect size |
| 1 Breastfeeding Show forest plot | 1 | 40 | Risk Ratio (M‐H, Fixed, 95% CI) | 1.9 [1.21, 2.98] |
| 2 Red blood cell transfusions Show forest plot | 1 | 40 | Risk Ratio (M‐H, Fixed, 95% CI) | 0.2 [0.01, 3.92] |
| Outcome or subgroup title | No. of studies | No. of participants | Statistical method | Effect size |
| 1 Heterogeneity ‐ Infections ‐ comparison 1 Show forest plot | 2 | 374 | Risk Ratio (M‐H, Random, 95% CI) | 1.07 [0.62, 1.84] |
| 2 Heterogeneity, fixed effect ‐ Infections ‐ comparison 1 Show forest plot | 3 | 718 | Risk Ratio (M‐H, Fixed, 95% CI) | 1.49 [0.93, 2.38] |
| 3 Heterogeneity ‐ Hepatic involvement ‐ comparison 1 Show forest plot | 2 | 652 | Risk Ratio (M‐H, Random, 95% CI) | 0.22 [0.06, 0.75] |
| 4 Heterogeneity, fixed effect ‐ Hepatic involvement ‐ comparison 1 Show forest plot | 3 | 996 | Risk Ratio (M‐H, Fixed, 95% CI) | 0.47 [0.21, 1.07] |