Water fluoridation for the prevention of dental caries
Abstract
Background
Dental caries is a major public health problem in most industrialised countries, affecting 60% to 90% of school children. Community water fluoridation was initiated in the USA in 1945 and is currently practised in about 25 countries around the world; health authorities consider it to be a key strategy for preventing dental caries. Given the continued interest in this topic from health professionals, policy makers and the public, it is important to update and maintain a systematic review that reflects contemporary evidence.
Objectives
To evaluate the effects of water fluoridation (artificial or natural) on the prevention of dental caries.
To evaluate the effects of water fluoridation (artificial or natural) on dental fluorosis.
Search methods
We searched the following electronic databases: The Cochrane Oral Health Group's Trials Register (to 19 February 2015); The Cochrane Central Register of Controlled Trials (CENTRAL; Issue 1, 2015); MEDLINE via OVID (1946 to 19 February 2015); EMBASE via OVID (1980 to 19 February 2015); Proquest (to 19 February 2015); Web of Science Conference Proceedings (1990 to 19 February 2015); ZETOC Conference Proceedings (1993 to 19 February 2015). We searched the US National Institutes of Health Trials Registry (ClinicalTrials.gov) and the World Health Organization's WHO International Clinical Trials Registry Platform for ongoing trials. There were no restrictions on language of publication or publication status in the searches of the electronic databases.
Selection criteria
For caries data, we included only prospective studies with a concurrent control that compared at least two populations ‐ one receiving fluoridated water and the other non‐fluoridated water ‐ with outcome(s) evaluated at at least two points in time. For the assessment of fluorosis, we included any type of study design, with concurrent control, that compared populations exposed to different water fluoride concentrations. We included populations of all ages that received fluoridated water (naturally or artificially fluoridated) or non‐fluoridated water.
Data collection and analysis
We used an adaptation of the Cochrane 'Risk of bias' tool to assess risk of bias in the included studies.
We included the following caries indices in the analyses: decayed, missing and filled teeth (dmft (deciduous dentition) and DMFT (permanent dentition)), and proportion caries free in both dentitions. For dmft and DMFT analyses we calculated the difference in mean change scores between the fluoridated and control groups. For the proportion caries free we calculated the difference in the proportion caries free between the fluoridated and control groups.
For fluorosis data we calculated the log odds and presented them as probabilities for interpretation.
Main results
A total of 155 studies met the inclusion criteria; 107 studies provided sufficient data for quantitative synthesis.
The results from the caries severity data indicate that the initiation of water fluoridation results in reductions in dmft of 1.81 (95% CI 1.31 to 2.31; 9 studies at high risk of bias, 44,268 participants) and in DMFT of 1.16 (95% CI 0.72 to 1.61; 10 studies at high risk of bias, 78,764 participants). This translates to a 35% reduction in dmft and a 26% reduction in DMFT compared to the median control group mean values. There were also increases in the percentage of caries free children of 15% (95% CI 11% to 19%; 10 studies, 39,966 participants) in deciduous dentition and 14% (95% CI 5% to 23%; 8 studies, 53,538 participants) in permanent dentition. The majority of studies (71%) were conducted prior to 1975 and the widespread introduction of the use of fluoride toothpaste.
There is insufficient information to determine whether initiation of a water fluoridation programme results in a change in disparities in caries across socioeconomic status (SES) levels.
There is insufficient information to determine the effect of stopping water fluoridation programmes on caries levels.
No studies that aimed to determine the effectiveness of water fluoridation for preventing caries in adults met the review's inclusion criteria.
With regard to dental fluorosis, we estimated that for a fluoride level of 0.7 ppm the percentage of participants with fluorosis of aesthetic concern was approximately 12% (95% CI 8% to 17%; 40 studies, 59,630 participants). This increases to 40% (95% CI 35% to 44%) when considering fluorosis of any level (detected under highly controlled, clinical conditions; 90 studies, 180,530 participants). Over 97% of the studies were at high risk of bias and there was substantial between‐study variation.
Authors' conclusions
There is very little contemporary evidence, meeting the review's inclusion criteria, that has evaluated the effectiveness of water fluoridation for the prevention of caries.
The available data come predominantly from studies conducted prior to 1975, and indicate that water fluoridation is effective at reducing caries levels in both deciduous and permanent dentition in children. Our confidence in the size of the effect estimates is limited by the observational nature of the study designs, the high risk of bias within the studies and, importantly, the applicability of the evidence to current lifestyles. The decision to implement a water fluoridation programme relies upon an understanding of the population's oral health behaviour (e.g. use of fluoride toothpaste), the availability and uptake of other caries prevention strategies, their diet and consumption of tap water and the movement/migration of the population. There is insufficient evidence to determine whether water fluoridation results in a change in disparities in caries levels across SES. We did not identify any evidence, meeting the review's inclusion criteria, to determine the effectiveness of water fluoridation for preventing caries in adults.
There is insufficient information to determine the effect on caries levels of stopping water fluoridation programmes.
There is a significant association between dental fluorosis (of aesthetic concern or all levels of dental fluorosis) and fluoride level. The evidence is limited due to high risk of bias within the studies and substantial between‐study variation.
PICO
Plain language summary
Water fluoridation to prevent tooth decay
Background
Tooth decay is a worldwide problem affecting most adults and children. Untreated decay may cause pain and lead to teeth having to be removed. In many parts of the world, tooth decay is decreasing. Children from poorer backgrounds still tend to have greater levels of decay. Fluoride is a mineral that prevents tooth decay. It occurs naturally in water at varying levels. Fluoride can also be added to the water with the aim of preventing tooth decay. Fluoride is present in most toothpastes and available in mouthrinses, varnishes and gels. If young children swallow too much fluoride while their permanent teeth are forming, there is a risk of marks developing on those teeth. This is called ‘dental fluorosis’. Most fluorosis is very mild, with faint white lines or streaks visible only to dentists under good lighting in the clinic. More noticeable fluorosis, which is less common, may cause people concern about how their teeth look.
Review question
We carried out this review to evaluate the effects of fluoride in water (added fluoride or naturally occurring) on the prevention of tooth decay and markings on teeth (dental fluorosis).
Study characteristics
We reviewed 20 studies on the effects of fluoridated water on tooth decay and 135 studies on dental fluorosis. The evidence is up to date at 19 February 2015.
Nineteen studies assessed the effects of starting a water fluoridation scheme. They compared tooth decay in two communities around the time fluoridation started in one of them. After several years, a second survey was done to see what difference it made. Around 70% of these studies were conducted before 1975. Other, more recent studies comparing fluoridated and non‐fluoridated communities have been conducted. We excluded them from our review because they did not carry out initial surveys of tooth decay levels around the time fluoridation started so were unable to evaluate changes in those levels since then. We reviewed one study that compared tooth decay in two fluoridated areas before fluoridation was stopped in one area. Again, after several years, a second survey was done to see what difference it made.
Around 73% of dental fluorosis studies were conducted in places with naturally occurring – not added – fluoride in their water. Some had levels of up to 5 parts per million (ppm).
Key results
Our review found that water fluoridation is effective at reducing levels of tooth decay among children. The introduction of water fluoridation resulted in children having 35% fewer decayed, missing and filled baby teeth and 26% fewer decayed, missing and filled permanent teeth. We also found that fluoridation led to a 15% increase in children with no decay in their baby teeth and a 14% increase in children with no decay in their permanent teeth. These results are based predominantly on old studies and may not be applicable today.
Within the ‘before and after’ studies we were looking for, we did not find any on the benefits of fluoridated water for adults.
We found insufficient information about the effects of stopping water fluoridation.
We found insufficient information to determine whether fluoridation reduces differences in tooth decay levels between children from poorer and more affluent backgrounds.
Overall, the results of the studies reviewed suggest that, where the fluoride level in water is 0.7 ppm, there is a chance of around 12% of people having dental fluorosis that may cause concern about how their teeth look.
Quality of the evidence
We assessed each study for the quality of the methods used and how thoroughly the results were reported. We had concerns about the methods used, or the reporting of the results, in the vast majority (97%) of the studies. For example, many did not take full account of all the factors that could affect children’s risk of tooth decay or dental fluorosis. There was also substantial variation between the results of the studies, many of which took place before the introduction of fluoride toothpaste. This makes it difficult to be confident of the size of the effects of water fluoridation on tooth decay or the numbers of people likely to have dental fluorosis at different levels of fluoride in the water.
Authors' conclusions
Summary of findings
| Initiation of water fluoridation compared with low/non‐fluoridated water for the prevention of dental caries | ||||||
| Patient or population: people of all ages Settings: community setting Intervention: initiation of water fluoridation Comparison: low/non‐fluoridated water | ||||||
| Outcomes | Illustrative comparative risks* (95% CI) | Relative effect | No of participants | Quality of the evidence | Comments | |
| Risk in area with low/non‐fluoridated water | Risk in area with initiation of water fluoridation | |||||
| Caries in deciduous teeth (dmft)1 Scale from: 0 to 20 (lower = better) Follow‐up: range from 3‐12 years | The mean dmft at follow‐up in the low/non‐fluoridated areas ranged from 1.21 to 7.8 (median 5.1) | The mean dmft in the areas with water fluoridation was 1.81 lower (1.31 lower to 2.31 lower) | 44,2682 (9 observational studies) | ⊕⊕⊝⊝3,4,5,6 | This indicates a reduction in dmft of 35% in the water fluoridation groups over and above that for the control groups We have limited confidence in the size of this effect due to the high risk of bias within the studies and the lack of contemporary evidence | |
| Caries score in permanent teeth (DMFT)7 Scale from: 0 to 32 (lower better) Follow‐up: range from 8‐11 years | The mean DMFT at follow‐up in the low/non‐fluoridated areas ranged from 0.7 to 5.5 (median 4.4) | The mean DMFT in the areas with water fluoridation was 1.16 lower (0.72 lower to 1.61 lower) | 78,7642 (10 observational studies) | ⊕⊕⊝⊝3,4,5,6 | This indicates a reduction in DMFT of 26% in the water fluoridation groups over and above that for the control groups We have limited confidence in the size of this effect due to the high risk of bias within the studies and the lack of contemporary evidence | |
| Change in proportion of caries‐free children (deciduous teeth) Scale: 0 to 1 Follow‐up: range 3‐12 years | The proportion of caries‐free children at follow‐up in the low/non‐fluoridated areas ranged from 0.06 to 0.67 (median 0.22) | The proportion of caries‐free children increased in the areas with water fluoridation 0.15 (0.11 to 0.19) | 39,9662 (10 observational studies) | ⊕⊕⊝⊝3,4,5,6 | We have limited confidence in the size of this effect due to the high risk of bias within the studies and the lack of contemporary evidence | |
| Change in proportion of caries‐free children (permanent teeth) Scale: 0 to 1 Follow‐up: range 8‐12 years | The proportion of caries‐free children at follow‐up in the low/non‐fluoridated areas ranged from 0.01 to 0.67 (median 0.14) | The proportion of caries‐free children increased in the areas with water fluoridation 0.14 (0.05 to 0.23) | 53,5382 (8 observational studies) | ⊕⊕⊝⊝3,4,5,6 | We have limited confidence in the size of this effect due to the high risk of bias within the studies and the lack of contemporary evidence. | |
| Disparities in caries by socioeconomic status (SES)8 | > 35,3999 (3 observational studies) | ⊕⊕⊝⊝3 | There is insufficient information to determine whether initiation of a water fluoridation programme results in a change in disparities in caries levels across SES | |||
| Adverse effects Dental fluorosis of aesthetic concern10 (measured by Dean's Index, TFI, TSIF)11 | For a fluoride level of 0.7 ppm the percentage of participants with dental fluorosis of aesthetic concern was estimated to be 12% (95% CI 8% to 17%). Controlling for study effects, we would expect the odds of dental fluorosis to increase by a factor of 2.90 (95% CI 2.05 to 4.10) for each one unit increase in fluoride level (1 ppm F). | 59,630 (40 observational studies) | ⊕⊕⊝⊝3,12 | The estimate for any level of dental fluorosis at 0.7ppm was 40% (95% CI 35% to 44%; 90 studies). This includes dental fluorosis that can only be detected under clinical conditions and other enamel defects We have limited confidence in the size of this effect due to the high risk of bias and substantial between‐study variation. | ||
| ⊕⊕⊕⊕: We are very confident that the true effect lies close to that of the estimate of the effect. Further research is very unlikely to change the estimate of effect. | ||||||
|
| ||||||
| Cessation of water fluoridation compared with fluoridated water for the prevention of dental caries | |||
| Patient or population: people of all ages Settings: community setting Intervention: cessation of water fluoridation Comparison: fluoridated water | |||
| Outcomes | No of participants | Quality of the evidence | Comments |
| Caries in permanent teeth (DMFS)1 Follow‐up: 3 years | 92492 (1 observational study) | ⊕⊝⊝⊝ 3 | Insufficient evidence to determine the effect of the cessation of water fluoridation on caries |
| Caries in deciduous teeth (dmft/dmfs)4 | No evidence to determine the effect of the cessation of water fluoridation on caries | ||
| Change in proportion of caries‐free children (deciduous or permanent teeth) | No evidence to determine the effect of the cessation of water fluoridation on caries | ||
| Disparities in caries by socioeconomic status (SES)5 | No evidence to determine the effect of the cessation of water fluoridation on disparities | ||
| Adverse effects | No evidence to determine whether cessation of a water fluoridation programme is associated with any harms | ||
| ⊕⊕⊕⊕: We are very confident that the true effect lies close to that of the estimate of the effect. Further research is very unlikely to change the estimate of effect. | |||
|
| |||
Background
Description of the condition
Dental caries is a chronic and progressive disease of the mineralised and soft tissues of the teeth. Its aetiology is multifactorial and is related to the interactions over time between tooth substance and certain micro‐organisms and dietary carbohydrates, producing plaque acids. Demineralisation of the tooth enamel (non‐cavitated dental caries) follows and in the absence of successful treatment, can extend into the dentine and the dental pulp, impairing its function (Ten Cate 1991). Despite reductions in the prevalence and severity of dental caries over time (CDC 2005), social inequalities in dental health persist (OECD 2011), with significant numbers of individuals and communities having a clinically significant burden of preventable dental disease. Dental caries is associated with pain, infection, tooth loss and reduced quality of life (Sheiham 2005). In children, the burden of dental disease also includes lost school time and restricted activity days, as well as problems in eating, speaking and learning. This especially affects those from lower income families owing to their higher prevalence of caries (Feitosa 2005). Given the progressive nature of the condition and widespread prevalence in adulthood, most children are at risk of dental caries.
Dental caries is a major public health problem in most industrialised countries, affecting 60% to 90% of school children (Petersen 2003). It has been estimated that in the USA 42% of children aged between two to 11 years have caries experience in their primary teeth and 59% of those aged 12 to 19 years have caries experience in their permanent teeth (Dye 2007). Prevalence studies in South America, Asia and Europe have indicated that caries may affect between 20% and 100% of the population (Bagramian 2009). Increasing levels of dental caries are observed in some developing countries, especially those where community‐based preventive oral care programmes are not established (Petersen 2004). Studies also suggest that the growing retention of teeth has also been accompanied by a rise in dental caries among ageing adults in different parts of the world (Selwitz 2007). This has major implications especially in high‐income countries experiencing an increase in life expectancy.
The link between fluoride and the prevention of dental caries dates back to the 1930s. There are many ways in which fluoride can be provided, including toothpastes, gels, varnishes, milk and water. An adverse effect associated with the use of fluoride is the development of dental fluorosis due to the ingestion of excessive fluoride by young children with developing teeth. Dental fluorosis occurs due to the hypomineralisation of the dental enamel caused by the chronic ingestion of sufficiently high concentrations of fluoride while the dentition is still forming (Pendrys 2001). Clinically, the appearance of teeth with fluorosis depends on the severity of the condition. In its mildest form, there are faint white lines or streaks visible only to trained examiners under controlled examination conditions. In more involved cases, fluorosis manifests as mottling of the teeth in which noticeable white lines or streaks often have coalesced into larger opaque areas. In the more severe forms, brown staining or pitting of the tooth enamel may be present and actual breakdown of the enamel may occur (Rozier 1994).
Description of the intervention
Water can be artificially fluoridated (also known as community water fluoridation) through the controlled addition of a fluoride compound to a public water supply (Department of Health and Human Services 2000). Water that is artificially fluoridated is set at the 'optimum level', considered to be around 1 ppm (Dean 1941; WHO 2011). The European Union water quality directive specifies 1.5 ppm as the maximum level for human consumption (European Union 1998). Community water fluoridation was initiated in the USA in 1945 and is currently practiced in about 25 countries around the world (The British Fluoridation Society 2012). Health authorities consider it to be a key strategy for preventing dental caries. In Western Europe around 3% of the population receive water with added fluoride (Cheng 2007), mainly in England, Ireland, and Spain. In the USA, over 70% of the population on public water systems receive fluoridated water (CDC 2008), as do a similar proportion of Australians (NHMRC 2007). The rationale behind the role of community water fluoridation is that it benefits both children and adults by effectively preventing caries, regardless of socioeconomic status or access to care. It is believed to have played an important role in the reductions in tooth decay (40% to 70% in children) and of tooth loss in adults (40% to 60%) in the USA (Burt 1999). Fluoridation is an intervention that occurs at the environmental level, meaning that individual compliance is not relied upon. Interventions at this level can have greater impact upon populations than those at the individual and clinical levels (Frieden 2010), although concerns have been raised around the ethics of 'mass intervention' (Cheng 2007).
Fluoride is also naturally present in the soil, in water and the atmosphere at varying levels depending on geographic location. In areas of Africa, Asia, the Middle East, Southern Europe and the Southern USA, ground waters have been found to contain particularly high concentrations of fluoride, well above the 'optimum level' of 1 ppm. However, while ground waters in some areas can contain high concentrations of fluoride, fluoride content in drinking water in many locations is too low to prevent and control tooth decay.
How the intervention might work
Fluoride impedes the demineralisation of the enamel and also enhances its remineralisation, if it is present in high enough concentrations in the saliva (Ten Cate 1991). This function is very important in caries prevention as the progression of cavities depends on the balance of the demineralisation and remineralisation processes (Selwitz 2007). The presence of fluoride in drinking water therefore confers the advantage of providing a constant exposure to fluoride ions in the oral cavity. The effectiveness of fluoridated water (McDonagh 2000; Truman 2002), and other fluoride sources, such as toothpastes and varnishes, have previously been documented (Marinho 2013; Walsh 2010). Some adverse effects of fluoridated water that have been explored are widely perceived to be dependent on dose, duration and/or time of exposure (Browne 2005). Within community water fluoridation programmes, maximum fluoride concentrations are set to prevent other harms related to very high fluoride concentrations. Supra‐optimal levels of fluoride (occurring naturally) have been linked to severe dental fluorosis and skeletal fluorosis. There is a lack of evidence for other postulated harms such as cancer and bone fractures; no evidence of a strong association with water fluoridation has been shown for these conditions (McDonagh 2000).
Why it is important to do this review
Water fluoridation was identified as a priority topic in the Cochrane Oral Health Group's international priority setting exercise, incorporating views from clinicians, guideline developers and members of the public.
The use of water fluoridation as a means of improving dental health has been endorsed by many national and international health institutions, including the World Health Organization (MRC 2002). It has been hailed by the US Surgeon General as "one of the most effective choices communities can make to prevent health problems while actually improving the oral health of their citizens" (ADA 2013). Opponents have raised concerns about ethical issues and its potential harms (Cheng 2007), as a result of which the practice has remained controversial. A comprehensive systematic review of water fluoridation has previously been published (McDonagh 2000). The review showed a benefit in terms of a reduction in caries as well as an increased risk of dental fluorosis. However, there was insufficient evidence to draw conclusions regarding other potential harms or health disparities. The review findings have often been misinterpreted and have been used to support arguments on both sides of the water fluoridation debate (Cheng 2007). In addition, little comment has been made on the applicability of the evidence to today's society. Many of the caries studies presented in the McDonagh 2000 review were conducted prior to the widespread use of fluoride toothpastes in the late 1970s, and the introduction and uptake of other preventative strategies, such as fluoride varnish. The McDonagh 2000 review was conducted 15 years ago. Given the continued interest in this topic, from both health professionals, policy makers and the public, it is important to update and maintain a systematic review that reflects any emerging, contemporary evidence.
This review updates the McDonagh 2000 review. It aims to contextualise the evidence to inform current national and international guidelines.
It should be noted, the original systematic review had a broader remit and aimed to evaluate the differential effects of natural and artificial fluoridation as well as adverse effects other than dental fluorosis (McDonagh 2000). The inclusion criteria for the objectives covered in this review follow those stated in McDonagh 2000.
Objectives
To evaluate the effects of water fluoridation (artificial or natural) on the prevention of dental caries.
To evaluate the effects of water fluoridation (artificial or natural) on dental fluorosis.
Methods
Criteria for considering studies for this review
Types of studies
Water fluoridation for the prevention of dental caries
For caries data, we included only prospective studies with a concurrent control, comparing at least two populations, one receiving fluoridated water and the other non‐fluoridated water, with at least two points in time evaluated. Groups had to be comparable in terms of fluoridated water at baseline. For studies assessing the initiation of water fluoridation the groups had to be from non‐fluoridated areas at baseline, with one group subsequently having fluoride added to the water. For studies assessing the cessation of water fluoridation, groups had to be from fluoridated areas at baseline, with one group subsequently having fluoride removed from the water.
For the purposes of this review, water with a fluoride concentration of 0.4 parts per million (ppm) or less (arbitrary cut‐off defined a priori) was classified as non‐fluoridated.
Water fluoridation and dental fluorosis
For the assessment of dental fluorosis, we included any study design, with concurrent control, comparing populations exposed to different water fluoride concentrations.
It should be noted that, due to the nature of the research question, randomised controlled trials are unfeasible.
Types of participants
Populations of all ages receiving fluoridated water (naturally or artificially) and populations receiving non‐fluoridated water.
Types of interventions
Water fluoridation for the prevention of dental caries
Caries data: a change in the level of fluoride in the water supply of at least one of the study areas within three years of the baseline survey. Exposure to fluoridated water or non‐fluoridated water (less than 0.4 ppm) could be in conjunction with other sources of fluoride (e.g. fluoridated toothpaste), provided the other sources were similar across groups. Where specific information on the use of other sources of fluoride was not supplied, we assumed that populations in studies conducted after 1975 in industrialised countries had been exposed to fluoridated toothpaste.
Water fluoridation and dental fluorosis
Fluoride at any concentration present in drinking water.
Types of outcome measures
Primary outcomes
Any measure of dental caries including the following.
-
Change in the number of decayed, missing and filled deciduous, and permanent teeth, (dmft and DMFT, respectively).
-
Change in the number of decayed, missing and filled deciduous, and permanent, tooth surfaces (dmfs and DMFS, respectively).
-
Incidence of dental caries.
-
Percentage of caries‐free children.
We also recorded data on disparities in dental caries across different groups of people, as reported in the included studies.
An a priori set of rules regarding the prioritisation of caries measures has been developed previously (Marinho 2013). We would have adopted these, if the data had required.
Secondary outcomes
Dental fluorosis, as measured by the following.
-
Percentage of children with fluorosis (any level of fluorosis, or fluorosis of aesthetic concern).
-
Dean's Fluorosis Index.
-
Tooth Surface Index of Fluorosis (TSIF).
-
Thylstrup and Fejerskov index (TFI).
-
Modified Developmental Defects of Enamel (DDE).
We aimed to record the prevalence of dental fluorosis for each dentition if reported in the studies. In measuring the percentage prevalence of dental fluorosis, we classified children with dental fluorosis according to the index used in the individual studies. As measured by the common epidemiologic indices for dental fluorosis (Rozier 1994), we classified children with a DDE, TSIF, TFI score greater than zero or Dean's classification of 'questionable' or higher as having dental fluorosis. If other indices had been used, we would have considered and adopted the percentage prevalence of dental fluorosis as reported by the original investigators using other methods (e.g. photographic method or other index). Any dental fluorosis scoring ≥ 3 (TFI), ≥ 2 (TSIF) and 'mild' or worse (Dean's) were considered to be of aesthetic concern. We restricted analysis on dental fluorosis of aesthetic concern to TFI, TSIF and Dean's indices as it is not easily determined from the modified DDE index.
Within the context of this review dental fluorosis is referred to as an 'adverse effect'. However, it should be acknowledged that moderate fluorosis may be considered an 'unwanted effect' rather than an adverse effect. In addition, mild fluorosis may not even be considered an unwanted effect.
We also recorded data on any other adverse effects (e.g. skeletal fluorosis, hip fractures, cancer, congenital malformations, mortality) reported in the included studies. However, this review did not aim to provide a comprehensive systematic review of adverse effects other than dental fluorosis.
Search methods for identification of studies
The original review involved searching a wide range of databases from their starting date to June/October 1999 (Appendix 1). Full details of all the strategies initially used have been published previously (McDonagh 2000).
For the identification of studies included or considered for this updated review, we developed detailed search strategies combining controlled vocabulary and free text terms for each database searched. These were based on the search strategy developed for MEDLINE (Appendix 4) but revised appropriately for each database to take account of differences in controlled vocabulary and syntax rules.
Electronic searches
We searched the following electronic databases (from inception):
-
The Cochrane Oral Health Group's Trials Register (to 19 February 2015; see Appendix 2);
-
The Cochrane Central Register of Controlled Trials (CENTRAL; The Cochrane Library 2015, Issue 1; see Appendix 3);
-
MEDLINE via OVID (1946 to 19 February 2015; see Appendix 4);
-
EMBASE via OVID (1980 to 19 February 2015; see Appendix 5);
-
Proquest (all databases; to 19 February 2015; Appendix 6);
-
Web of Science Conference Proceedings (1990 to 19 February 2015; see Appendix 7);
-
ZETOC Conference Proceedings (1993 to 19 February 2015; see Appendix 8).
There were no restrictions on language of publication and non‐English studies were translated, unless a translator could not be found through Cochrane.
Searching other resources
We searched the following databases for ongoing trials (see Appendix 9):
-
US National Institutes of Health Trials Register (clinicaltrials.gov to 19 February 2015);
-
The WHO Clinical Trials Registry Platform (apps.who.int/trialsearch/default.aspx to 19 February 2015).
Only handsearching conducted as part of the Cochrane Worldwide Handsearching Programme and uploaded to CENTRAL was included (see the Cochrane Masterlist for the details of journals searched to date). We reviewed the reference lists of identified trials and review articles for additional appropriate studies.
Data collection and analysis
Selection of studies
Two review authors independently and in duplicate screened the titles and abstracts (when available) of all reports identified through the electronic search update. We obtained the full report for all studies that appeared to meet the inclusion criteria, or for which there were insufficient data in the title and abstract to make a clear decision. Two review authors independently assessed the full reports obtained from the electronic and other methods of searching to establish whether or not the studies met the inclusion criteria. Disagreements were resolved by discussion. Where resolution was not possible, a third review author was consulted. Studies rejected at this or subsequent stages were recorded in the 'Characteristics of excluded studies' table, and reasons for their exclusion recorded.
Data extraction and management
Two review authors extracted data independently using specially designed data extraction forms (produced in Excel). We piloted the data extraction forms on several papers and modified them as required before use. Any disagreements were discussed and a third review author consulted where necessary.
For each study we aimed to record the following data.
-
Year of publication, country of origin and source of study funding.
-
Details of the participants including demographic characteristics (socioeconomic status (SES), ethnicity), age, deciduous/permanent dentition and criteria for inclusion and exclusion.
-
Details of the type of intervention, comparator and co‐interventions.
-
Details of the outcomes reported, including method of assessment, and time intervals.
-
Details of confounding factors considered (potential confounders of relevance to this review include sugar consumption/dietary habits, SES, ethnicity and the use of other fluoride sources).
-
Details on comparability of groups with regard to confounding factors.
-
Details on methods used to control for confounding.
-
Details regarding both unadjusted and adjusted effect estimates.
Assessment of risk of bias in included studies
McDonagh 2000 used specially designed validity assessment checklists that provided a 'validity score' and assigned a 'level of evidence' for each study. In this update, we aimed to assess all included studies (including those from the previous review by McDonagh 2000) for risk of bias using the Cochrane 'Risk of bias' assessment tool adapted for non‐randomised controlled studies (Higgins 2011). The domains assessed for each included study included: sampling, confounding, blinding of outcome assessment, completeness of outcome data, risk of selective outcome reporting and risk of other potential sources of bias. We did not include random sequence generation or allocation concealment, as these were not relevant for the study designs included and are covered by the domain for confounding. We had identified the following factors as important confounders for the primary and secondary outcomes: sugar consumption/dietary habits, SES, ethnicity and the use of other fluoride sources.
We tabulated a description of the 'Risk of bias' domains for each included trial, along with a judgement of low, high or unclear risk of bias.
We undertook a summary assessment of the risk of bias for the primary outcome (across domains) across studies (Higgins 2011). Within a study, we gave a summary assessment of low risk of bias when there was a low risk of bias for all key domains, unclear risk of bias when there was an unclear risk of bias for one or more key domains, and high risk of bias when there was a high risk of bias for one or more key domains.
Measures of treatment effect
We included the following caries indices in the analyses: dmft, DMFT, and proportion caries free in both dentitions. For dmft and DMFT analyses we calculated the difference in mean change scores between fluoridated and control groups. For the proportion caries free, we calculated the difference in the proportion caries free between the fluoridated and control groups.
For dental fluorosis data we calculated the log odds and presented them as probabilities for interpretation.
We have presented data on other adverse effects, reported in the included studies, as a narrative.
We intended to present data on both adjusted and unadjusted results, but the data allowed only for unadjusted values.
Dealing with missing data
Where outcome data were missing from the published report, or could not be calculated from the information presented in the report of a trial, we attempted to contact the authors to obtain the data and clarify any uncertainty. The analyses generally included only the available data (ignoring missing data). When the number of participants evaluated was not reported, we did not include outcome data in the analyses. Where standard deviations were missing for DMFT and dmft data we used the equation: log(SD) = 0.17 + 0.56 x log(mean) to estimate the standard deviations for both the before and after mean caries values. This equation was estimated from available data where the standard deviations were given (R² = 0.91; Appendix 10). We undertook no other imputations.
We undertook sensitivity analyses to determine the effect of the imputed standard deviations.
Assessment of heterogeneity
We planned to explore differences in fluoridation technique, fluoride concentration, outcome measurement index and technique as possible sources of heterogeneity. Initial consideration of heterogeneity would be via the DerSimonian‐Laird model (commonly referred to as a random‐effects meta‐analysis). When between study variance was deemed to be both robustly estimated and substantial (judged as the estimate being larger than twice its standard error), we favoured the random‐effects model over a fixed‐effect approach. We would have investigated any heterogeneity further via Baujat and normal quantile‐quantile (Q‐Q) plots, alongside influence diagnostics (for example difference in fitted values (DFFITS), Cook's distance, hat values and leave‐one‐out methods) as appropriate. However, due to the limited data and lack of clarity in reporting we were unable to undertake any of these analyses for the caries data. Fluoride concentration was explored as part of the fluorosis analysis.
Assessment of reporting biases
If more than 10 trials had been identified for any meta‐analysis of the primary outcome caries, we would have assessed publication bias according to the recommendations described in the Cochrane Handbook for Systematic Reviews of Interventions (Higgins 2011). Had asymmetry been identified in the contour‐enhanced funnel plots, we would have investigated possible causes. The number of studies presented in each caries meta‐analyses precluded this.
Data synthesis
The primary analyses was based on all included studies, irrespective of risk of bias.
Caries
For the analyses of mean dmft and DMFT severity data, we used Review Manager (RevMan 2014; not shown) to calculate weighted (for age) mean change score for water fluoridation and control group separately, and the summary effect estimates across all age groups for each study (we only analysed data for dmft for children eight years and younger). The resulting effect estimates for the water fluoridation and control groups were then entered into RevMan for each study to calculate the mean difference in change scores for the review (see Analysis 1.1; Analysis 1.2). We decided to display this data using the average n for the before and after data for each study to give an indication of the size of the studies. The raw data and summary statistics are shown in Table 1; Table 2.
| Study ID | Age | Fluoridated area | Non/low fluoridated area | |||||||||||
| Baseline (before/at initiation) | Follow‐up | Baseline | Follow‐up | |||||||||||
| MEAN | SD | N | MEAN | SD | N | MEAN | SD | N | MEAN | SD | N | |||
| ADRIASOLA 1959 | 5 | 8.9 | 5.03 | 186 | 6.4 | 4.18 | 340 | 8.1 | 4.77 | 174 | 7.8 | 4.67 | 140 | |
| 5 | Mean (SD) change in dmft: 2.5 (7.04) | Mean (SD) change in dmft: 0.3 (6.72) | ||||||||||||
| ARNOLD 1956a | 4 | 4.19 | 3.30 | 323 | 2.13 | 2.26 | 168 | 5.05 | 3.66 | 20 | 4.46 | 3.42 | 63 | |
| 5 | 5.37 | 3.79 | 1633 | 2.27 | 2.34 | 853 | 6.82 | 4.33 | 402 | 5.25 | 3.74 | 351 | ||
| 6 | 6.43 | 4.19 | 1789 | 2.98 | 2.73 | 750 | 7.17 | 4.46 | 462 | 5.67 | 3.91 | 294 | ||
| 7 | 6.29 | 4.14 | 1806 | 4.03 | 3.23 | 423 | 6.66 | 4.28 | 408 | 5.77 | 3.95 | 223 | ||
| 8 | 5.78 | 3.95 | 1647 | 4.12 | 3.27 | 470 | 6.06 | 4.06 | 376 | 5.32 | 3.77 | 275 | ||
| 4‐8 | Mean (SD) change in dmft: 2.75 (4.99) | Mean (SD) change in dmft: 1.18 (5.8) | ||||||||||||
| BEAL 1971 | 5 | 4.91 | 4.86 | 182 | 2.45 | 3.24 | 182 | 4.97 | 4.12 | 217 | 5.09 | 4.84 | 229 | |
| 5 | Mean (SD) change in dmft: 2.46 (5.8) | Mean (SD) change in dmft: ‐0.12 (6.27) | ||||||||||||
| BEAL 1981 | 5 | 4.29 | 3.50 | 196 | 1.8 | 2.48 | 170 | 4.28 | 3.58 | 205 | 3.49 | 3.62 | 180 | |
| 8 | 5 | 2.89 | 189 | 3.42 | 2.84 | 167 | 5.36 | 3.06 | 163 | 4.97 | 3.00 | 186 | ||
| 5/8 | Mean (SD) change in dmft: 2.02 (4.18) | Mean (SD) change in dmft: 0.57 (4.6) | ||||||||||||
| BLINKHORN 2015 | 5‐7 | 2.02 | 3.13 | 781 | 0.72 | 1.63 | 844 | 2.09 | 2.91 | 523 | 1.21 | 2.27 | 612 | |
| 5‐7 | Mean (SD) change in dmft: 1.3 (3.56) | Mean (SD) change in dmft: 0.88 (3.74) | ||||||||||||
| DHSS 1969 (Eng)a | 3 | 2.7 | 2.58 | 43 | 0.6 | 1.11 | 133 | 1.4 | 1.79 | 44 | 1.2 | 1.64 | 144 | |
| 4 | 3.6 | 3.03 | 66 | 1.3 | 1.71 | 131 | 2.6 | 2.53 | 47 | 1.8 | 2.06 | 162 | ||
| 5 | 5.4 | 3.80 | 148 | 1.6 | 1.92 | 111 | 5 | 3.64 | 110 | 2.8 | 2.63 | 119 | ||
| 6 | 5.7 | 3.92 | 182 | 2.5 | 2.47 | 130 | 5.4 | 3.80 | 127 | 4.1 | 3.26 | 107 | ||
| 7 | 6.4 | 4.18 | 192 | 2.7 | 2.58 | 172 | 6 | 4.03 | 121 | 4.3 | 3.35 | 133 | ||
| 3‐7 | Mean (SD) change in dmft: 3.09 (4.3) | Mean (SD) change in dmft: 1.04 (4.22) | ||||||||||||
| DHSS 1969 (Wales)a,b | 3 | 3.9 | 3.17 | 310 | 1.4 | 1.79 | 171 | 4 | 3.21 | 146 | 3.3 | 2.89 | 105 | |
| 4 | 5.54 | 3.86 | 413 | 2.6 | 2.53 | 267 | 5.8 | 3.96 | 210 | 4.8 | 3.56 | 122 | ||
| 5 | 5.5 | 3.84 | 556 | 2.9 | 2.69 | 284 | 5.5 | 3.84 | 256 | 4.8 | 3.56 | 138 | ||
| 6 | 6.3 | 4.15 | 603 | 3.1 | 2.79 | 310 | 6.2 | 4.11 | 331 | 5.9 | 4.00 | 133 | ||
| 7 | 6.85 | 4.35 | 640 | 3.65 | 3.05 | 266 | 7.3 | 4.50 | 346 | 6.8 | 4.33 | 130 | ||
| 3‐7 | Mean (SD) change in dmft: 2.87 (4.68) | Mean (SD) change in dmft: 0.64 (5.54) | ||||||||||||
| GUO 1984 | 3 | 3 | 3.4 | 202 | 2.6 | 3.3 | 79 | 1.3 | 3.2 | 205 | 3.7 | 3.9 | 128 | |
| 4 | 4.6 | 4 | 354 | 4.5 | 4.7 | 164 | 5.6 | 4.6 | 246 | 7.1 | 4.6 | 164 | ||
| 5 | 6.5 | 4.4 | 589 | 5.5 | 4.3 | 345 | 6.4 | 4.2 | 218 | 8.5 | 4.6 | 387 | ||
| 6 | 6.7 | 4.4 | 695 | 6.2 | 4.8 | 297 | 5.8 | 4.2 | 309 | 9 | 4.3 | 354 | ||
| 7 | 5.5 | 3.7 | 399 | 5.6 | 3.7 | 240 | 5.4 | 3.7 | 335 | 7.9 | 3.6 | 352 | ||
| 8 | 4.2 | 3 | 392 | 4.4 | 2.9 | 279 | 3.5 | 2.7 | 343 | 6 | 3.1 | 350 | ||
| 3‐8 | Mean (SD) change in dmft: 0.23 (5.39) | Mean (SD) change in dmft: ‐2.47 (5.35) | ||||||||||||
| KUNZEL 1992a | 5 | 2.4 | 2.415006452 | 688 | 1.4 | 1.7857954 | 1306 | 3.3 | 2.886475039 | 172 | 2.9 | 2.684991275 | 597 | |
| 8 | 4.9 | 3.601718817 | 2438 | 2.8 | 2.632743187 | 3020 | 4.9 | 3.601718817 | 777 | 4.9 | 3.601718817 | 1078 | ||
| 5‐8 | Mean (SD) change in dmft: 2.1 (5.01) | Mean (SD) change in dmft: 0.13 (5.0) | ||||||||||||
Note: Only data up to the age of 8 years included for the deciduous dentition
a. Imputed standard deviation
b. 2 fluoridated areas combined
| Study ID | Age | FLuoridated area | Non/low fluoridated area | |||||||||||
| B aseline (before/at initiation) | Follow‐up | Baseline | Follow‐up | |||||||||||
| MEAN | SD | N | MEAN | SD | N | MEAN | SD | N | MEAN | SD | N | |||
| ARNOLD 1956a | 6 | 0.78 | 1.29 | 1789 | 0.26 | 0.70 | 750 | 0.81 | 1.31 | 462 | 0.8 | 1.31 | 294 | |
| 7 | 1.89 | 2.11 | 1806 | 0.84 | 1.34 | 423 | 1.99 | 2.17 | 408 | 1.88 | 2.11 | 223 | ||
| 8 | 2.95 | 2.71 | 1647 | 1.58 | 1.91 | 470 | 2.81 | 2.64 | 376 | 2.63 | 2.54 | 275 | ||
| 9 | 3.9 | 3.17 | 1639 | 2.04 | 2.21 | 582 | 3.81 | 3.13 | 357 | 3.52 | 2.99 | 277 | ||
| 10 | 4.92 | 3.61 | 1626 | 2.93 | 2.70 | 141 | 4.91 | 3.61 | 359 | 4.32 | 3.36 | 62 | ||
| 11 | 6.41 | 4.19 | 1556 | 3.67 | 3.06 | 151 | 6.32 | 4.15 | 293 | 5.34 | 3.78 | 139 | ||
| 12 | 8.07 | 4.76 | 1685 | 5.89 | 3.99 | 176 | 8.66 | 4.95 | 328 | 7.71 | 4.64 | 48 | ||
| 13 | 9.73 | 5.29 | 1668 | 6.6 | 4.26 | 497 | 9.98 | 5.36 | 377 | 9.36 | 5.18 | 225 | ||
| 14 | 10.95 | 5.65 | 1690 | 8.21 | 4.81 | 128 | 12 | 5.95 | 369 | 11.36 | 5.77 | 59 | ||
| 15 | 12.48 | 6.08 | 1511 | 8.91 | 5.03 | 53 | 12.86 | 6.18 | 292 | 12.38 | 6.05 | 21 | ||
| 16 | 13.5 | 6.35 | 1107 | 11.06 | 5.68 | 198 | 14.07 | 6.50 | 248 | 13.16 | 6.26 | 155 | ||
| 6‐16 | Mean (SD) change in DMFT: 0.90 (3.20) | Mean (SD) change in DMFT: 0.15 (3.51) | ||||||||||||
| BEAL 1981 | 8 | 1.48 | 1.51 | 189 | 0.65 | 1.16 | 167 | 1.55 | 1.40 | 163 | 1.34 | 1.50 | 186 | |
| 12 | 3.53 | 3.32 | 192 | 2.74 | 2.33 | 189 | 4.28 | 2.47 | 188 | 4.11 | 2.95 | 197 | ||
| 8/12 | Mean (SD) change in DMFT: 0.82 (2.50) | Mean (SD) change in DMFT: 0.20 (2.64) | ||||||||||||
| BLINKHORN 2015a | 0.59 | 1.10 | 777 | 0.45 | 0.95 | 642 | 0.99 | 1.47 | 436 | 0.72 | 1.23 | 455 | ||
| Mean (SD) change in DMFT: 0.14 (1.44) | Mean (SD) change in DMFT: 0.28 (1.92) | |||||||||||||
| BROWN 1960 | 9‐11 | 4.07 | 2.20 | 595 | 1.52 | 1.80 | 502 | 4.21 | 2.63 | 571 | 3.68 | 2.35 | 521 | |
| 12‐14 | 7.68 | 3.90 | 593 | 3.23 | 2.92 | 503 | 7.94 | 4.41 | 486 | 7.46 | 4.40 | 485 | ||
| 9‐14 | Mean (SD) change in DMFT: 3.03 (3.31) | Mean (SD) change in DMFT: 0.52 (4.18) | ||||||||||||
| DHSS 1969 (Eng)a | 8 | 2.4 | 2.42 | 199 | 1.08 | 1.54 | 95 | 2.4 | 2.42 | 148 | 1.85 | 2.09 | 79 | |
| 9 | 3.1 | 2.79 | 227 | 1.5 | 1.86 | 135 | 2.9 | 2.68 | 166 | 2.4 | 2.42 | 95 | ||
| 10 | 3.6 | 3.03 | 134 | 2 | 2.18 | 115 | 3.8 | 3.12 | 160 | 3.1 | 2.79 | 80 | ||
| 11 | 4.6 | 3.48 | 145 | 3 | 2.74 | 200 | 4.7 | 3.52 | 126 | 3.9 | 3.17 | 122 | ||
| 12 | 5.6 | 3.88 | 111 | 3.52 | 2.99 | 134 | 6.1 | 4.07 | 51 | 4.99 | 3.64 | 99 | ||
| 13 | 7.1 | 4.43 | 91 | 4.9 | 3.60 | 132 | 6.6 | 4.26 | 52 | 6.1 | 4.07 | 127 | ||
| 14 | 8.4 | 4.87 | 70 | 5.77 | 3.95 | 90 | 7.9 | 4.71 | 36 | 6.74 | 4.31 | 108 | ||
| 8‐14 | Mean (SD) change in DMFT: 1.62 (3.92) | Mean (SD) change in DMFT: 0.65 (4.39) | ||||||||||||
| DHSS 1969 (Wales)a,b | 8 | 2.00 | 2.18 | 607 | 1.31 | 1.72 | 283 | 1.95 | 2.15 | 351 | 2.16 | 2.28 | 125 | |
| 9 | 2.65 | 2.55 | 553 | 1.98 | 2.17 | 260 | 2.6 | 2.53 | 325 | 2.9 | 2.68 | 134 | ||
| 10 | 3.35 | 2.91 | 502 | 2.59 | 2.52 | 241 | 3.2 | 2.84 | 308 | 3.6 | 3.03 | 133 | ||
| 11 | 3.83 | 3.14 | 278 | 2.99 | 2.73 | 126 | 3.3 | 2.89 | 270 | 4.1 | 3.26 | 42 | ||
| 12 | 4.65 | 3.50 | 186 | 4.38 | 3.38 | 108 | 3.95 | 3.19 | 265 | 6.16 | 4.09 | 108 | ||
| 13 | 6 | 4.03 | 178 | 5.9 | 4.00 | 93 | 5.2 | 3.72 | 274 | 7.6 | 4.61 | 105 | ||
| 14 | 6.95 | 4.38 | 158 | 6.73 | 4.30 | 93 | 5.6 | 3.88 | 243 | 7.64 | 4.62 | 96 | ||
| 8‐14 | Mean (SD) change in DMFT: 0.66 (3.72) | Mean (SD) change in DMFT: ‐0.73 (4.95) | ||||||||||||
| GUO 1984 | 6 | 0.2 | 0.6 | 695 | 0.2 | 0.5 | 297 | 0.1 | 0.4 | 309 | 0.5 | 0.9 | 354 | |
| 7 | 0.4 | 0.8 | 399 | 0.4 | 0.9 | 240 | 0.3 | 0.7 | 335 | 1.2 | 1.4 | 352 | ||
| 8 | 0.5 | 1 | 392 | 0.5 | 1 | 279 | 0.4 | 0.8 | 343 | 1.6 | 1.5 | 350 | ||
| 9 | 0.7 | 1.1 | 388 | 0.8 | 1.4 | 275 | 0.7 | 1.1 | 310 | 2.2 | 2 | 352 | ||
| 10 | 0.7 | 1.3 | 346 | 1.1 | 1.5 | 310 | 0.8 | 1.5 | 323 | 2.4 | 2 | 436 | ||
| 11 | 0.8 | 1.5 | 330 | 1.6 | 1.9 | 307 | 0.9 | 1.4 | 451 | 3 | 2.7 | 365 | ||
| 12 | 1.1 | 1.7 | 468 | 1.7 | 2.4 | 208 | 0.9 | 1.5 | 841 | 3.4 | 3 | 493 | ||
| 13 | 1.4 | 2 | 469 | 2.1 | 2.9 | 232 | 1.2 | 1.6 | 801 | 3.8 | 3.3 | 504 | ||
| 14 | 1.2 | 1.8 | 322 | 2.6 | 2.9 | 221 | 1 | 1.5 | 795 | 4.4 | 3.8 | 490 | ||
| 15 | 1.7 | 2.5 | 164 | 2.2 | 2.3 | 38 | 1.2 | 1.7 | 121 | 4.2 | 4 | 63 | ||
| 6‐15 | Mean (SD) change in DMFT: ‐0.11 (1.69) | Mean (SD) change in DMFT: ‐1.14 (2.59) | ||||||||||||
| HARDWICK 1982 | 12 | Mean (SD) increment in DMFT: ‐3.76 (2.86) | Mean (SD) increment in DMFT: ‐4.85 (3.39) | |||||||||||
| KUNZEL 1997c,d | 6 | 0.3 | 0.7 | 0.2 | 0.5 | 0.8 | 0.4 | 0.89 | ||||||
| 7 | 0.7 | 1.1 | 0.3 | 0.9 | 1.2 | 1 | 1.48 | |||||||
| 8 | 1.3 | 1.4 | 2419 | 0.5 | 1.00 | 3016 | 1.3 | 1.4 | 777 | 1.8 | 2.06 | 1076 | ||
| 9 | 1.9 | 1.5 | 0.9 | 1.8 | 1.6 | 2.4 | 2.42 | |||||||
| 10 | 2.4 | 1.8 | 1.2 | 2.4 | 1.8 | 3.2 | 2.84 | |||||||
| 11 | 3 | 2 | 1.6 | 2.8 | 1.8 | 3.9 | 3.17 | |||||||
| 12 | 3.7 | 2.3 | 1626 | 2 | 2.18 | 2426 | 3.5 | 2.1 | 563 | 4.8 | 3.56 | 925 | ||
| 13 | 4.3 | 2.7 | 2.6 | 4.1 | 2.6 | 5.5 | 3.84 | |||||||
| 14 | 5.3 | 3.1 | 3.4 | 4.7 | 2.5 | 6.5 | 4.22 | |||||||
| 15 | 5.8 | 3.5 | 1995 | 4 | 3.22 | 1897 | 5.2 | 3.1 | 744 | 7.4 | 4.54 | 756 | ||
| 8/12/15 | Mean (SD) change in DMFT: 1.02 (2.94) | Mean (SD) change in DMFT: ‐0.85 (3.26) | ||||||||||||
| LOH 1996 | 1.6 | 1.8 | 2 | 1.9 | 3.1 | |||||||||
| 4.4 | 2.1 | 3.7 | 4.5 | |||||||||||
| Insufficient data to include in further analysis | ||||||||||||||
| TESSIER 1987a | 6‐7 | 8.28 | 56 | 3.16 | 96 | 8.23 | 85 | 5.4 | 93 | |||||
| 6‐7 | Mean (SD) change in DMFT: 5.12 (6.16) | Mean (SD) change in DMFT: 2.83 (6.18) | ||||||||||||
a. Imputed standard deviation
b. 2 fluoridated areas combined
c. Imputed standard deviation for follow‐up data only
d. N values only available for ages 8, 12 and 15 years
Where standard deviations (SDs) are missing for the dmft, DMFT data we used the equation: log(SD) = 0.17 + 0.56 x log(mean) to estimate the SDs for both before and after mean caries values. We undertook a sensitivity analysis omitting all the data for studies/age groups where the standard deviation was imputed.
For the caries free data for both dentitions, we calculated the risk differences in RevMan (not shown) for water fluoridation and control groups separately, for each study, undertaking a meta‐analyses across age groups. These summary effect estimates and standard deviations were then combined in a meta‐analysis in RevMan (not shown) as continuous data to provide summary estimates of the change in the proportion caries free for both groups. For each dentition (rather than age group), we then combined the resulting data as a meta‐analysis in the review. Once again we decided to display this data using the average n for the before and after data for each study to give an indication of the size of the studies. Table 3 and Table 4 provide the raw data and summary estimates of the risk differences for each water fluoridation and control group separately, for each study, across age groups.
| Study ID | Age | Fluoridated area | Non/low fluoridated area | ||||||
| Baseline (before/at initiation) | Follow‐up | Baseline | Follow‐up | ||||||
| n | N | n | N | n | N | n | N | ||
| Adriasola 1959a | 3 | 26 | 151 | 82 | 216 | 9 | 77 | 26 | 135 |
| 4 | 12 | 156 | 55 | 216 | 11 | 76 | 11 | 110 | |
| 5 | 4 | 186 | 45 | 340 | 7 | 174 | 14 | 140 | |
| 8 | 21 | 493 | 11 | 458 | 17 | 223 | 2 | 226 | |
| Ast 1951 | 5 | 63 | 274 | 108 | 217 | 73 | 259 | 107 | 324 |
| Beal 1971b | 5 | 62 | 297 | 138 | 314 | 35 | 217 | 55 | 229 |
| Beal 1981 | 5 | 41 | 196 | 78 | 170 | 43 | 205 | 54 | 180 |
| 8 | 18 | 189 | 31 | 167 | 12 | 163 | 18 | 186 | |
| Blinkhorn 2015 | 5‐7 | 397 | 781 | 632 | 844 | 254 | 523 | 412 | 612 |
| DHSS 1969 (Eng) | 3 | 16 | 43 | 96 | 133 | 27 | 44 | 97 | 144 |
| 4 | 23 | 66 | 84 | 131 | 16 | 47 | 89 | 162 | |
| 5 | 12 | 148 | 51 | 111 | 15 | 110 | 42 | 119 | |
| 6 | 16 | 182 | 47 | 130 | 13 | 127 | 18 | 107 | |
| 7 | 13 | 192 | 55 | 172 | 7 | 121 | 24 | 133 | |
| DHSS 1969 (Wales) | 3 | 89 | 310 | 100 | 171 | 39 | 146 | 21 | 105 |
| 4 | 78 | 413 | 114 | 267 | 32 | 210 | 27 | 122 | |
| 5 | 56 | 556 | 90 | 284 | 18 | 256 | 19 | 138 | |
| 6 | 29 | 603 | 78 | 310 | 20 | 331 | 15 | 133 | |
| 7 | 17 | 640 | 53 | 266 | 14 | 346 | 5 | 130 | |
| Gray 2001b | 5 | 1465 | 2462 | 1903 | 2524 | 345 | 466 | 273 | 419 |
| Guo 1984 | 3 | 67 | 202 | 31 | 79 | 54 | 205 | 39 | 128 |
| 4 | 74 | 354 | 39 | 164 | 32 | 246 | 14 | 164 | |
| 5 | 61 | 589 | 47 | 345 | 18 | 218 | 19 | 387 | |
| 6 | 53 | 695 | 56 | 397 | 27 | 309 | 12 | 354 | |
| 7 | 41 | 399 | 21 | 240 | 29 | 335 | 11 | 352 | |
| 8 | 53 | 392 | 24 | 279 | 50 | 343 | 16 | 350 | |
| 8 | 278 | 392 | 204 | 279 | 273 | 343 | 104 | 350 | |
| Kunzel 1997 | 5 | 231 | 688 | 682 | 1306 | 39 | 172 | 192 | 597 |
| 8 | 117 | 2438 | 746 | 3020 | 40 | 777 | 61 | 1078 | |
Note: Only data up to the age of 8 years included for the deciduous dentition
a. Baseline data not available for ages 6 and 7 years
b. Data from all fluoridated areas combined
| Study ID | Age | Fluoridated area | Non/low fluoridated area | ||||||
| B aseline (before/at initiation) | Follow‐up | Baseline | Follow‐up | ||||||
| n | N | n | N | n | N | n | N | ||
| ADRIASOLA 1959a | 8 | 21 | 493 | 11 | 458 | 17 | 223 | 2 | 226 |
| 12 | 7 | 292 | 8 | 419 | 3 | 197 | 9 | 211 | |
| BEAL 1981 | 8 | 77 | 189 | 115 | 167 | 56 | 163 | 82 | 186 |
| 12 | 51 | 192 | 41 | 189 | 13 | 188 | 14 | 197 | |
| BLINKHORN 2015 | 10 to 12 | 525 | 777 | 486 | 642 | 272 | 436 | 307 | 455 |
| BROWN 1960b | 9 to 11 | 34 | 595 | 220 | 502 | 35 | 571 | 42 | 521 |
| 12 to 14 | 7 | 593 | 94 | 503 | 3 | 486 | 11 | 485 | |
| DHSS 1969 (Eng) | 8 | 40 | 199 | 50 | 95 | 33 | 148 | 29 | 79 |
| 9 | 25 | 227 | 57 | 135 | 20 | 166 | 20 | 95 | |
| 10 | 13 | 134 | 36 | 115 | 14 | 160 | 10 | 80 | |
| 11 | 12 | 145 | 12 | 200 | 3 | 126 | 12 | 122 | |
| 12 | 3 | 111 | 20 | 134 | 0 | 51 | 4 | 99 | |
| 13 | 3 | 91 | 9 | 132 | 2 | 52 | 8 | 127 | |
| 14 | 0 | 70 | 4 | 90 | 2 | 36 | 9 | 180 | |
| DHSS 1969 (Wales) | 8 | 143 | 607 | 112 | 283 | 88 | 351 | 26 | 125 |
| 9 | 73 | 553 | 78 | 260 | 49 | 325 | 15 | 134 | |
| 10 | 63 | 502 | 44 | 241 | 25 | 308 | 8 | 133 | |
| 11 | 30 | 278 | 15 | 126 | 35 | 270 | 0 | 42 | |
| 12 | 15 | 186 | 10 | 108 | 27 | 265 | 2 | 108 | |
| 13 | 7 | 178 | 0 | 93 | 14 | 274 | 1 | 105 | |
| 14 | 8 | 158 | 3 | 93 | 15 | 243 | 1 | 96 | |
| Guo 1984 | 5 | 575 | 589 | 338 | 345 | 214 | 218 | 358 | 387 |
| 6 | 616 | 695 | 266 | 297 | 284 | 309 | 249 | 354 | |
| 7 | 305 | 399 | 189 | 240 | 272 | 335 | 162 | 352 | |
| 8 | 278 | 392 | 204 | 279 | 273 | 343 | 104 | 350 | |
| 9 | 242 | 388 | 167 | 275 | 195 | 310 | 98 | 352 | |
| 10 | 215 | 346 | 161 | 310 | 199 | 323 | 84 | 436 | |
| 11 | 213 | 330 | 133 | 307 | 245 | 451 | 65 | 365 | |
| 12 | 240 | 468 | 90 | 208 | 475 | 841 | 91 | 493 | |
| 13 | 227 | 469 | 88 | 232 | 434 | 801 | 77 | 504 | |
| 14 | 161 | 322 | 69 | 221 | 455 | 795 | 73 | 490 | |
| 15 | 78 | 164 | 11 | 38 | 66 | 121 | 11 | 63 | |
| Kunzel 1997 | 8 | 1021 | 2419 | 2147 | 3016 | 334 | 777 | 333 | 1076 |
| 12 | 120 | 1626 | 801 | 2426 | 42 | 563 | 50 | 925 | |
| 15 | 118 | 1995 | 249 | 1897 | 27 | 744 | 18 | 756 | |
a. Baseline data not available for ages 11 and 15 years
b. Data for 16‐17‐year olds presented but no N
Fluorosis
In line with the previous systematic review (McDonagh 2000), the primary analysis was carried out on data where fluoride exposure was 5 ppm or less, for reasons of applicability and robustness of evidence (the concentration of most naturally occurring fluoride will be below than this threshold, and the paucity of information from higher exposures leads to less precise estimates). We analysed two aspects of fluorosis: aesthetic concerns of fluorosis (as defined in Types of outcome measures), and any level of fluorosis. We used random‐effects models with random intercept and random slope to model the log odds of fluorosis as a function of fluoride exposure. In this model we allowed the intercept and slope to vary from study to study. The slope of the linear relationship between fluoride level (the predictor) and the log odds of fluorosis is the value of the coefficient for fluoride level plus the study specific random effect for that specific study. Fluoride exposure was centred upon the grand mean, and results presented as probabilities to aid interpretation.
Subgroup analysis and investigation of heterogeneity
We undertook subgroup analyses according to whether data were collected prior to the widespread use of fluoride toothpaste, or after: we used a cut‐off of 1975 for this purpose. We made the decision to undertake subgroup analyses by date of study conduct post hoc, following peer review comments.
We had planned to use meta‐regression to investigate and explain sources of heterogeneity among studies where possible (potential confounders of relevance to this review include sugar consumption/dietary habits, SES, ethnicity and the use of other fluoride sources). Dental caries results were to be analysed using meta‐regression in order to assess the impact of potential sources of heterogeneity and estimate the underlying effect of water fluoridation. We also planned to conduct subgroup analyses by study design. However, due to the small number of studies and lack of clarity in the reporting within the caries studies, we did not undertake these sub‐group analyses
Sensitivity analysis
We would have undertaken sensitivity analyses based on risk of bias if sufficient trials had been included. We had planned to undertake further sensitivity analyses to determine if the results of the meta‐analysis were influenced by the timing of baseline measurement, as appropriate. We did undertake sensitivity analyses to determine the effect of the imputed standard deviations.
Presentation of main results
We assessed the quality of the evidence for the primary and secondary outcomes for this review using GRADE methods (gdt.guidelinedevelopment.org). Due to the observational nature of the studies included in the review, GRADE stipulates that the quality of the body of evidence starts at 'low'. We considered susbequent downgrading of the quality of the body of evidence with reference to the overall risk of bias of the included studies, the directness of the evidence, the inconsistency of the results and the precision of the estimates. We considered upgrading the quality of the evidence on the basis of an assessment of the risk of publication bias, the magnitude of the effect and whether or not there was evidence of a dose response.
We presented the results and quality of evidence for each outcome in a 'Summary of findings' table. We made a post hoc decision not to use the GRADE terminology of high, moderate, low and very low to describe the quality of the evidence (see Quality of the evidence).
Results
Description of studies
Results of the search
The search for literature produced a total of 4677 records after de‐duplication. Two reviewers in duplicate screened these records independently. Any disagreements were resolved by a third reviewer. After this initial screening, we obtained 158 articles, combined with 120 articles from additional sources (including McDonagh 2000; NHMRC 2007 and an unpublished paper, Blinkhorn (unpublished)) and read them in detail. We assessed 277 of these 278 articles for eligibility; 155 studies (162 publications) met the inclusion criteria for the review. However, only 107 studies (15 caries studies; 92 studies reporting data on either all fluorosis severities or fluorosis of aesthetic concern) presented sufficient data for inclusion in the quantitative syntheses. One study awaits classification. The search, screening results and selection of included studies are illustrated in the PRISMA flow diagram (Figure 1).

Figure 1. Study flow diagram.
Included studies
A total of 20 prospective observational studies provided data on caries or disparities in caries, or both (Adriasola 1959; Arnold 1956; Ast 1951; Backer‐Dirks 1961; Beal 1971; Beal 1981; Blinkhorn (unpublished); Brown 1965; DHSS England 1969; DHSS Scotland 1969; DHSS Wales 1969; Gray 2001; Guo 1984; Hardwick 1982; Holdcroft 1999; Kunzel 1997; Loh 1996; Maupome 2001; Pot 1974; Tessier 1987).
Caries
Nineteen prospective observational studies (22 publications) published between 1951 and 2015 met the inclusion criteria for the caries outcome. Eighteen of these studies looked at the effect of the initiation of water fluoridation programme on dental caries (Adriasola 1959; Arnold 1956; Ast 1951; Backer‐Dirks 1961; Beal 1971; Beal 1981; Blinkhorn (unpublished); Brown 1965; DHSS England 1969; DHSS Scotland 1969; DHSS Wales 1969; Gray 2001; Guo 1984; Hardwick 1982; Kunzel 1997; Loh 1996; Pot 1974; Tessier 1987), and one study focused on the effect of cessation of fluoridation on caries (Maupome 2001). Only one study followed the same participants over time (Hardwick 1982), evaluating 12‐year old children in a fluoridated and a non‐fluoridated area and following them for four years. All other studies evaluated specific age groups within three years of a change in fluoridation status and undertook a follow‐up evaluation of the same age groups (different children) at at least one other time point. A low/non‐fluoridated area was used as a control. These have been analysed as controlled before‐and‐after studies.
The studies were conducted in multiple centres in Europe (Backer‐Dirks 1961; Beal 1971; Beal 1981; DHSS England 1969; DHSS Scotland 1969; DHSS Wales 1969; Gray 2001; Hardwick 1982; Kunzel 1997; Pot 1974), North America (Arnold 1956; Ast 1951; Brown 1965; Maupome 2001; Tessier 1987), South America (Adriasola 1959), Australia (Blinkhorn (unpublished)) and Asia (Guo 1984; Loh 1996). Five studies were funded by research grants from research organisations, health authorities and government organisations (Beal 1971; Blinkhorn (unpublished); Booth 1991; Kunzel 1997; Maupome 2001), one study was funded in collaboration with members of the committee pro‐fluoridation (Adriasola 1959), while the other studies did not state their funding sources.
Participants, aged from three to 16 years, were mostly recruited from schools; the period of time between baseline and final measurement ranged from two to 12 years.
The intervention groups in all 'fluoride initiation' studies were exposed to naturally low fluoride at baseline and artificially fluoridated water at follow‐up, while the control groups were exposed to naturally low fluoride at both time points. In studies where it was not stated clearly, fluoride concentration was reported as 'high' or 'fluoridated' for the intervention group and 'low' or 'non‐fluoridated' for the control group. For the 'fluoride cessation' study that met our inclusion criteria, the intervention group was exposed to artificially fluoridated water at baseline and naturally low fluoride at follow‐up, while the control group remained artificially fluoridated at both time points.
Measures of dental caries reported were dmft (decayed missing and filled deciduous teeth), DMFT (decayed missing and filled permanent teeth), DMFS (decayed missing and filled surfaces in permanent teeth), and proportion of caries‐free children (deciduous and permanent dentition).
Disparities in caries
Three prospective observational studies (four publications) met the inclusion criteria for disparities in caries but did not provide data suitable for analysis (Beal 1971; Gray 2001; Holdcroft 1999). They all assessed the effect of the initiation of water fluoridation on caries in different SES groups receiving fluoridated and non‐fluoridated water. All three studies evaluated specific age groups within three years of a change in fluoridation status and undertook a follow‐up evaluation of the same age groups (different children) at a least one other time point. A low/non‐fluoridated area was used as a control. All these studies were conducted in the UK. Caries measures reported were decayed, extracted and filled deciduous teeth (deft; Beal 1971), dmft (Gray 2001; Holdcroft 1999), and percentage of caries‐free children (Beal 1971; Gray 2001).
Dental fluorosis
For dental fluorosis, 135 studies were included. These were published between 1941 and 2014. Of these studies, 28% were conducted in Europe, 23% in Asia, 19% in North America, 13% in South America, 10% in Africa, 5% in Australia and 2% in multiple centres in Europe and Asia. Forty‐four studies were supported by research grants from government organisations and health authorities, non‐governmental organisations, research organisations, universities or a combination of these sources (Adair 1999; Alarcon‐Herrera 2001; AlDosari 2010; Angelillo 1999; Awadia 2000; Azcurra 1995; Bao 2007; Butler 1985; Chen 1989; Clark 1993; Correia Sampaio 1999; de Crousaz 1982; Garcia‐Perez 2013; Hernandez‐Montoya 2003; Ibrahim 1995; Indermitte 2007; Indermitte 2009; Kanagaratnam 2009; Kumar 1999; Kumar 2007; Mackay 2005; Mandinic 2010; Milsom 1990; Nanda 1974; Narwaria 2013; Nunn 1992; Pontigo‐Loyola 2008; Ray 1982; Riordan 2002; Ruan 2005; Rwenyonyi 1999; Skinner 2013; Stephen 2002; Szpunar 1988; Tsutsui 2000; Vilasrao 2014; Villa 1998; Vuhahula 2009; Wang 1999; Wang 2012; Warren 2001; Whelton 2004; Whelton 2006; Wondwossen 2004); six studies were funded by: a sugar association (McInnes 1982), a water company (Firempong 2013; Warnakulasuriya 1992), the dental industry (Machiulskiene 2009; Wenzel 1982), or associated with a dental industry through authorship (McGrady 2012). Sources of support were not explicitly stated in 86 studies. One study explicitly stated that no funding had been obtained (Shanthi 2014).
Out of the 135 studies that met the inclusion criteria for fluorosis we aimed to extract cross‐sectional data. Ninety studies reported sufficient data for inclusion in the analysis for all severities of dental fluorosis (Appendix 11). Forty studies were included in the analysis for fluorosis of aesthetic concern (Appendix 11). The remaining studies did not report sufficient data for inclusion in the analysis, typically due to failure to indicate water fluoride concentration of the study areas or reporting inappropriate measure of fluorosis (e.g. mean value or Community Fluorosis Index (CFI)). Where studies reported fluorosis outcomes as CFI only, we could not use the data. The CFI is a composite score calculated by summing the scores of Dean's Index and dividing the total by the sample size. This gives an indication of the experience and severity of fluorosis at a population level, but individual level data cannot be derived from it alone.
Dean's index, TFI, TSIF, DDE were reported in 41%, 19%, 10%, 6% of the included studies, respectively, while 23% of the studies either reported on other indices, specific enamel defects, or did not state the index used at all.
Other adverse effects
Five studies that reported on the dental fluorosis outcome also presented data on other adverse effects associated with water fluoridation (Table 5). The outcomes reported were skeletal fluorosis (Chen 1993; Jolly 1971; Wang 2012), bone fracture (Alarcon‐Herrera 2001), and skeletal maturity (Wenzel 1982). Outcomes were assessed in participants using radiographs (Chen 1993; Jolly 1971; Wenzel 1982), the diagnostic criteria of endemic skeletal fluorosis (WS 192‐2008; Wang 2012), or methods that were not clearly stated (Alarcon‐Herrera 2001).
| Study ID | Outcome | Age | Fluoride level | Assigned F level | Number of subjects | Proportion with outcome |
| Chen 1993 | Skeletal fluorosis | 16 to 65 | 5.5 | 5.5 | 28 | 82.1 |
| 3.1 | 3.1 | 114 | 71.1 | |||
| 0.4 | 0.4 | 50 | 46 | |||
| 3.1 | 3.1 | 50 | 86 | |||
| Wang 2012a | Skeletal fluorosis | ≥16 | 2.2 | 2.2 | 406,298 | 10.8 |
| 0.5 | 0.5 | 188,400 | 4.8 | |||
| Wenzel 1982b | Skeletal maturity | 12 to 14 | 2.4 | 2.4 | 122 | 0.59 (0.1)c |
| < 0.2 | 0.1 | 113 | 0.59 (0.09)c | |||
| Alarcon‐Herrera | Bone fracture | 6 to 12 | < 1.5 | 0.75 | 97 | 5.2 |
| 1.51‐4.99 | 3.25 | 112 | 8.9 | |||
| 5‐8.49 | 6.75 | 38 | 2.6 | |||
| 8.5‐11.99 | 10.25 | 27 | 11.1 | |||
| 12‐16 | 14 | 59 | 8.5 | |||
| 13 to 60 | < 1.5 | 0.75 | 192 | 3.1 | ||
| 1.51‐4.99 | 3.25 | 330 | 7.9 | |||
| 5‐8.49 | 6.75 | 146 | 8.9 | |||
| 8.5‐11.99 | 10.25 | 138 | 7.2 | |||
| 12‐16 | 14 | 96 | 6.3 | |||
| Jolly 1971b | Skeletal fluorosis | Not stated | 0.7 | 0.7 | Not stated | 3.6 |
| 1.4 | 1.4 | Not stated | 2.4 | |||
| 2.4 | 2.4 | Not stated | 17 | |||
| 2.4 | 2.4 | Not stated | 23 | |||
| 2.5 | 2.5 | Not stated | 33 | |||
| 3 | 3 | Not stated | 19.6 | |||
| 3 | 3 | Not stated | 42.2 | |||
| 3.3 | 3.3 | Not stated | 10 | |||
| 3.3 | 3.3 | Not stated | 45 | |||
| 3.6 | 3.6 | Not stated | 33.1 | |||
| 4.3 | 4.3 | Not stated | 19.4 | |||
| 5 | 5 | Not stated | 60 | |||
| 5.1 | 5.1 | Not stated | 44.5 | |||
| 5.5 | 5.5 | Not stated | 31.3 | |||
| 7 | 7 | Not stated | 47.4 | |||
| 8.5 | 8.5 | Not stated | 58.9 | |||
| 9.4 | 9.4 | Not stated | 70.1 |
a. Participants were diagnosed on the basis of diagnostic criteria for endemic skeletal fluorosis (WS 192‐2008)
b. Participants were examined radiologically
c. Reported outcome was mean (standard error) skeletal maturity
Excluded studies
Of the 277 studies that were assessed for eligibility, we excluded 112 studies (115 publications; see Characteristics of excluded studies). The reasons for exclusion were most frequently due to inappropriate study design, including:
-
absence of data from two time points for one or both study groups (Agarwal 2014; Ajayi 2008; Aldosari 2004; Antunes 2004; Archila 2003; ARCPOH 2008; Armfield 2004; Armfield 2005; Arora 2010; Bailie 2009; Baldani 2002; Baldani 2004; Binbin 2005; Blagojevic 2004; Bradnock 1984; Carmichael 1980; Carmichael 1984; Carmichael 1989; Evans 1995; Gillcrist 2001; Gushi 2005; Han 2011; Jones 1997; Jones 2000a; Jones 2000b; Kirkeskov 2010; Kumar 2001; Lee 2004; Peres 2006; Provart 1995; Rihs 2008; Riley 1999; Rugg‐Gun 1977; Sagheri 2007; Sales‐Peres 2002; Saliba 2008; Sampaio 2000; Slade 2013; Tagliaferro 2004; Tiano 2009; Tickle 2003; Zimmermann 2002);
-
unsuitable control group (Attwood 1988; Hobbs 1994; Kalsbeek 1993; Seppa 1998; Wragg 1999; Murray 1984; Murray 1991);
-
absence of concurrent control group (Buscariolo 2006; Kunzel 2000a; Wong 2006).
Risk of bias in included studies
The review authors' judgements about each risk of bias item for each included study is summarised in Figure 2.

Risk of bias summary: review authors' judgements about each risk of bias item for each included study.
Caries outcome
We judged that all the 20 studies included for the caries outcome (including disparities in caries) were at high risk of bias overall. The bias may occur in either direction.
Sampling
We judged 13 of the studies as being at low risk of bias in terms of sampling (Arnold 1956; Ast 1951; Backer‐Dirks 1961; Beal 1981; Blinkhorn (unpublished); Brown 1965; DHSS England 1969; DHSS Scotland 1969; Gray 2001; Guo 1984; Hardwick 1982; Pot 1974; Tessier 1987). For these studies, sampling was achieved either randomly or by including the entire eligible population of the study area. We judged seven studies to be at unclear risk of bias for sampling (Adriasola 1959; Beal 1971; DHSS Wales 1969; Holdcroft 1999; Kunzel 1997; Loh 1996; Maupome 2001). This judgement was based on insufficient or unavailable information in most cases, however in the study by Kunzel 1997, there was an unexplained exclusion of disabled children. In the DHSS Scotland 1969 study, different age criteria were used for each group resulting in an imbalance between the groups; the reason for this was not explained. No studies were found to be at high risk for selection bias for this outcome.
Confounding
We found all studies to be at high risk of bias for confounding. We considered confoundng factors for this outcome to be sugar consumption/dietary habits, SES, ethnicity and the use of other fluoride sources. We would have judged studies to be at low risk of confounding bias only if they had successfully controlled for all factors. Six of the studies attempted to control for none of these factors (Adriasola 1959; Ast 1951; Brown 1965; Guo 1984; Loh 1996; Pot 1974). Eight controlled for SES, but not for other sources of fluoride or for dietary habits (Arnold 1956; Backer‐Dirks 1961; Beal 1971; Beal 1981; DHSS England 1969; DHSS Scotland 1969; DHSS Wales 1969; Gray 2001). Hardwick 1982 matched for SES and reported the use of fluoride from other sources to be broadly similar across groups, but did not report on dietary habits. Maupome 2001 reported on dietary habits and the use of fluoride from other sources; this study showed that dietary habits did not confound the relationship between water fluoridation and caries.
Detection bias
The majority of the studies did not blind outcome assessors. This is perhaps unsurprising when considering the efforts that may be required to blind assessors for this type of study. We judged only two studies to be at low risk of bias for this domain (Backer‐Dirks 1961; Hardwick 1982). Backer‐Dirks 1961 utilised radiographs in order to blind assessors, and in the Hardwick 1982 study children were brought to a central examination centre for assessment.
Incomplete outcome data
Eight studies were judged as being at low risk of bias (Beal 1971; Beal 1981; Brown 1965; Gray 2001; Guo 1984; Hardwick 1982; Kunzel 1997; Maupome 2001), or unclear risk of bias for the domain of incomplete outcome data (Adriasola 1959; Arnold 1956; Backer‐Dirks 1961; Beal 1971; Blinkhorn (unpublished); Holdcroft 1999; Loh 1996; Pot 1974). We found four studies to be at high risk. In two studies (Ast 1951; Maupome 2001), the outcome data for participants was substantially lower than at baseline. The Brown 1965 study, which ran from 1948 to 1959, sampled and examined children aged six to eight years up until 1957, but ceased this activity after 1957 as no significant differences were found to exist in that age group. The DHSS Scotland 1969 study did not present data for all children examined.
Selective reporting
We found 11 of the studies to be at high risk of bias for selective reporting. Four studies recorded data on dental fluorosis, but this was not reported (Arnold 1956; DHSS England 1969; DHSS Scotland 1969; DHSS Wales 1969). Six studies did not report standard deviations (Arnold 1956; Blinkhorn (unpublished); DHSS England 1969; DHSS Wales 1969; Kunzel 1997; Tessier 1987), and Adriasola 1959 did not report complete baseline data for the proportion of caries‐free children aged six, seven, 11 and 15 years. Eight studies were found to be at low risk of bias for this domain with all expected data having been reported (Beal 1971; Beal 1981; Brown 1965; Gray 2001; Guo 1984; Hardwick 1982; Kunzel 1997; Maupome 2001). For one study the risk of bias remains unclear (Holdcroft 1999).
Other bias
We found 12 studies to be at high risk of other bias; for ten of these studies this was due to an apparent lack of reliability or consistency of the outcome assessments in terms of either calibration of examiners or tests for inter‐ and intra‐rater reliability (Arnold 1956; Ast 1951; Beal 1971; DHSS England 1969; DHSS Scotland 1969; DHSS Wales 1969; Gray 2001; Guo 1984; Pot 1974; Tessier 1987). In the Gray 2001 study the baseline fluoridation status of the children was determined by the location of the school they attended, which may not have taken into account any children attending schools in fluoridated areas who residede outside those areas. We assessed four studies as being at unclear risk of bias (Beal 1981; Brown 1965; Holdcroft 1999; Maupome 2001). The remaining six studies were not assessed as having any other apparent risk of bias.
Dental fluorosis outcome
Of the 135 studies included for this outcome, we found 131 to be at high risk of bias and four to be at unclear risk overall (Ellwood 1995; Levine 1989; Milsom 1990; Stephen 2002). We judged no studies as being at low risk.
We assessed five studies as being at high risk for sampling bias, 60 as being at low risk of bias and the remainder as 'unclear'. We found the majority of studies (114) to be at high risk for confounding; we assessed 11 as being at low risk of bias for this domain. For detection bias, we assessed 103 as being at high risk of detection bias, and 15 at low risk of bias. Overall, we found studies to be at low risk of bias for incomplete outcome data (92), with only 12 assessed as being at high risk of bias. For selective reporting, we assessed 42 as being at high risk of bias, with 82 at low risk of bias. With regard to other bias, we assessed 48 studies as being at high risk, 66 at low risk and all others at unclear risk. In most cases the reason for studies having high risk of other bias was that they did not report on the reliability or consistency of the outcome assessments.
Effects of interventions
See: Summary of findings for the main comparison ; Summary of findings 2
Caries
Nineteen studies met the inclusion criteria (18 fluoride initiation studies and one fluoride cessation studies), with 15 providing sufficient data for analysis of caries levels following a change in fluoridation status. Only one of these studies examined the effect of water fluoridation on adults (Pot 1974); the reported outcome for this study was the percentage of participants with dentures. There are no data to determine the effect of water fluoridation on caries levels in adults.
Four studies provided insufficient data for analysis (Backer‐Dirks 1961; DHSS Scotland 1969; Loh 1996; Pot 1974).
Initiation of water fluoridation
The caries studies are presented in forest plots, sub‐grouped according to when they were conducted (those conducted in 1975 or before, and those conducted after 1975; Figure 3; Figure 4; Figure 5; Figure 6). Given the limited data post‐1975 and this being a post‐hoc analysis, the results presented below are for the overall body of evidence for each outcome.

Initiation of water fluoridation compared with low/non‐fluoridated water: change in dmft

Initiation of water fluoridation compared with low/non‐fluoridated water: change in DMFT
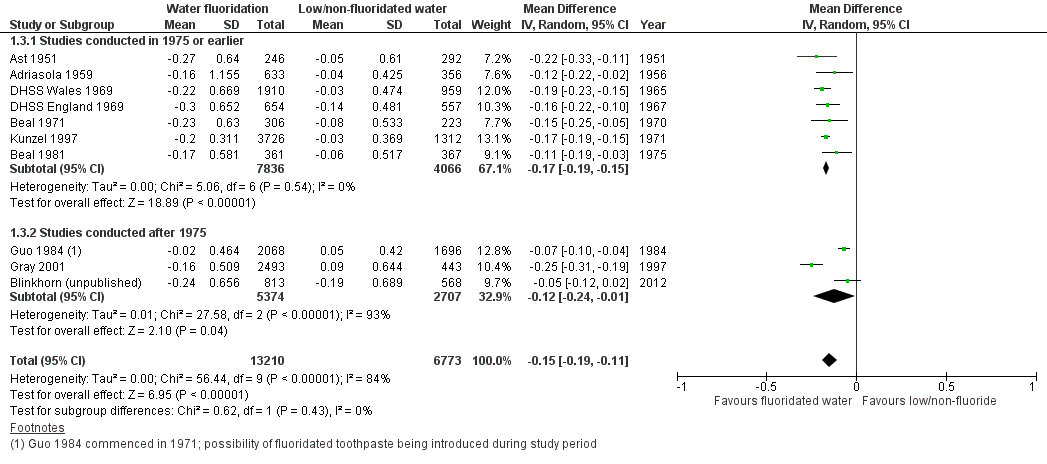
Initiation of water fluoridation compared with low/non‐fluoridated water: change in proportion of caries‐free children (deciduous teeth)

Initiation of water fluoridation compared with low/non‐fluoridated water: change in proportion of caries‐free children (permanent teeth)
Change in dmft/dmfs
Nine studies, with data from 44,268 participants, provided data for dmft (Adriasola 1959; Arnold 1956; Beal 1971; Beal 1981; Blinkhorn (unpublished); DHSS England 1969; DHSS Wales 1969; Guo 1984; Kunzel 1997). We judged all studies to be at high risk of bias and only two (22%) studies were conducted post‐1975. Data collection following initiation of water fluoridation ranged from two to 12 years. Data did not allow for an evaluation of effect by duration of exposure to fluoridated water.
The mean difference in change in dmft was 1.81 (95% CI 1.31 to 2.31; P value < 0.00001; Figure 3). At final assessment, the dmft means for the control groups ranged from 1.21 to 7.8, with a median of 5.1. A mean reduction of 1.81 indicates a 35% reduction in dmft in the water fluoridation groups over and above that for the control groups. Although there was considerable heterogeneity (P value < 0.00001; I² = 91%), we decided to pool the data as all the mean difference estimates were in the same direction. Some of the heterogeneity is expected due to the large size of the studies ensuring narrow confidence intervals.
Sensitivity analysis, excluding studies with imputed standard deviations gave rise to a similar effect estimate, mean difference in change score 1.83 (95% CI 0.68 to 2.98; 5 studies).
There were no data for dmfs.
Change in DMFT/DMFS
Ten studies, with data from 78,764 participants, provided data for DMFT (Arnold 1956; Beal 1981; Blinkhorn (unpublished); Brown 1965; DHSS England 1969; DHSS Wales 1969; Guo 1984; Hardwick 1982; Kunzel 1997; Tessier 1987). We judged all the studies to be at high risk of bias and only three studies (30%) were conducted post‐1975. Data collection following initiation of water fluoridation ranged from two to 11 years. Data did not allow for an evaluation of effect by duration of exposure to fluoridated water.
The mean difference in change in DMFT was 1.16 (95% CI 0.72 to 1.61; P value < 0.00001;Figure 4). At final assessment, the DMFT means for the control groups ranged from 0.71 to 5.5, with a median of 4.4. A mean reduction of 1.16 indicates a 26% reduction in DMFT in the water fluoridation groups over and above that for the control groups. It should be noted that in Guo 1984 the before mean DMFT values for both the control and water fluoridation groups were low at 0.8, and this increased in both groups, however the increase was greater for the control group. This explains why the changes are both negative. The data for Hardwick 1982 are mean DMFT increment data for both groups from the paper, following the same children over time. A lower increment was observed for the water fluoridation group and, as they are caries increments, they have been entered as negative values.
Although there was considerable heterogeneity (P value < 0.00001; I² = 97%), once again we decided to pool the data as all but one of the mean difference estimates were in the same direction (ranging from ‐0.14 to 2.51). Some of the heterogeneity is expected due to the large numbers in the studies ensuring narrow confidence intervals.
Sensitivity analysis in which we excluded studies with imputed standard deviations gave rise to a slightly larger effect estimate; mean difference in change score 1.32 (95% CI 0.53 to 2.11; 4 studies).
Only one study, with data from 343 participants, presented data on DMFS (Hardwick 1982). The study presented increment data for both groups, with a lower increment being observed for the water fluoridation group; mean difference 2.46 (95% CI 1.11 to 3.81).
Change in proportion of children caries free: deciduous dentition
Ten studies, with data from 39,966 children, provided data for the proportion of caries‐free children for deciduous dentition (Adriasola 1959; Ast 1951; Beal 1971; Beal 1981; Blinkhorn (unpublished); DHSS England 1969; DHSS Wales 1969; Gray 2001; Guo 1984; Kunzel 1997). We judged all studies to be at high risk of bias. Three studies (30%) were published post‐1975. For all studies combined, there was a 0.15 absolute increase in the proportion of caries‐free children in fluoridated areas with mean difference 0.15 (95% CI 0.11 to 0.19; Figure 5). At final assessment, the proportion of caries‐free children in the low/non‐fluoridated areas ranged from 0.06 to 0.67, with a median of 0.22; an increase of 0.15 in the proportion of caries‐free children could be considered substantial. There was considerable heterogeneity (P value < 0.00001; I² = 84%), but the value of Tau² from the random‐effects analysis was low (< 0.001; mean differences ranged from 0.05 to 0.25). Therefore we decided to pool the data.
Change in proportion of children caries free: permanent dentition
Eight studies, with data from 53,538 participants, provided data for the proportion of caries‐free children for permanent dentition (Adriasola 1959; Beal 1981; Blinkhorn (unpublished); Brown 1965; DHSS England 1969; DHSS Wales 1969; Guo 1984; Kunzel 1997). We judged all studies to be at high risk of bias and only two (25%) were conducted post‐1975. There was a 0.14 absolute increase in the proportion of caries‐free children in fluoridated areas with mean difference 0.14 (95% CI 0.05 to 0.23; Figure 6). At final assessment, the proportion of caries‐free children in the low/non‐fluoridated areas ranged from 0.01 to 0.67, with a median of 0.14; the increase of 0.14 doubles this. There was considerable heterogeneity (P value < 0.00001; I² = 98%), but the value of Tau from the random‐effects analysis was low at 0.02 (mean differences ranged from ‐0.03 to 0.30). Therefore we decided to pool the data.
Other caries measures
We did not include four studies that met the inclusion criteria in the quantitative analysis (Backer‐Dirks 1961; DHSS Scotland 1969; Loh 1996; Pot 1974). We judged all studies to be at high risk of bias and excluded them from the analysis due to insufficient data (e.g. no data on number of participants evaluated) or different measures of caries, or both. The Backer‐Dirks 1961 study reported dentinal approximal lesions as the caries measure, while Pot 1974 reported the percentage with false teeth. The other two studies did not report on the number of participants (DHSS Scotland 1969; Loh 1996). Three of the studies assessing children between the ages of four and 15 years showed a reduction in caries following the initiation of water fluoridation (Backer‐Dirks 1961; DHSS Scotland 1969; Loh 1996). Pot 1974 assessed participants between five and 55 years of age and showed an increase in percentage with dentures following fluoridation.
Cessation of water fluoridation
Change in DMFT/DMFS
Only one study, at high risk of bias, presented data on DMFS: the Maupome 2001 fluoride cessation study was conducted over three years. The study was conducted in a population with "generally low caries experience, living in an affluent setting with widely accessible dental services". The results did not demonstrate an increase in caries in the children in the fluoride‐ended group compared with the still‐fluoridated group, in fact there was a statistically significant decrease in caries severity (including incipient and cavitated lesions) for the fluoride‐ended group, which was not found in the still‐fluoridated group, for both of the age groups examined. A complex pattern of disease was found when different caries indices were examined.
No studies that met the inclusion criteria reported on change in dmft or proportion of caries‐free children (deciduous/permanent dentition) following the cessation of water fluoridation.
Disparities across social class
Three included studies' reported on the effect of water fluoridation on disparities in caries across social class (Beal 1971; Gray 2001; Holdcroft 1999; Table 6). The number of participants was reported in only two of the studies (Beal 1971; Gray 2001). The total number of participants measured for caries in these studies was 35,399. The studies focused on the initiation of water fluoridation in study areas that were reasonably comparable. Measures of caries reported in the studies were dmft, deft and percentage caries‐free subjects. All three studies were judged to be at high risk of bias.
| Study ID | Age | Group | Measure | Social class | Baseline | Final | ||||||
| F level | N | % caries free | dmft (SD) | F level | N | % caries free | dmft (SD) | |||||
| Beal 1971a | 5 | Balsall Heath | Descriptive | Poor area | Low | 115 | 9 | 5.16 (0.44) | 1 | 132 | 48 | 1.94 (0.22) |
| Northfield | Industrial area | Low | 182 | 29 | 4.91 (0.36) | 1 | 182 | 41 | 2.45 (0.24) | |||
| Dudley | Industrial area | < 0.1 | 217 | 16 | 4.97 (0.28) | < 0.1 | 229 | 24 | 5.09 (0.32) | |||
| Gray 2000b | 5 | South east Staffordshire | Jarman score | ‐23.09 | Low | 3435 | 66 | 1.21 (0.59) | 1 | 3120 | 75 | 0.64 (1.46) |
| Sandwell | 18.1 | Low | 3950 | 51 | 1.93 (2.88) | 1 | 3598 | 69 | 0.83 (1.68) | |||
| Walsall | 1.67 | Low | 3120 | 54 | 1.85 (2.31) | 1 | 363 | 67 | 0.94 (1.77) | |||
| Dudley | ‐13.68 | Low | 3657 | 58 | 1.6 (2.54) | 1 | 3474 | 73 | 0.78 (1.75) | |||
| North Birmingham | 21.57 | Low | 1965 | 72 | 0.88 (1.97) | 1 | 1904 | 74 | 0.71 (1.65) | |||
| North Staffordshire | ‐3.59 | Low | 464 | 47 | 2.24 (3.04) | Low | 1947 | 59 | 1.49 (2.46) | |||
| Herefordshire | ‐13.01 | Low | 406 | 57 | 1.61 (2.55) | Low | 305 | 50 | 1.79 (2.68) | |||
| Shropshire | ‐12.34 | Low | 366 | 61 | 1.29 (2.22) | Low | 311 | 60 | 1.33 (2.33) | |||
| Kidderminster | ‐13.13 | Low | 904 | 58 | 1.74 (2.81) | Low | 1053 | 61 | 1.4 (2.52) | |||
| Holdcroft 1999b | Not stated | North Birmingham | Jarman score | ‐7.85 | Not stated | Not stated | 2.18 | High | Not stated | 0.68 | ||
| Sandwell | 15.03 | Not stated | Not stated | 2.55 | High | Not stated | 1.13 | |||||
| North Staffordshire | ‐4.07 | Not stated | Not stated | 2.24 | Not stated | Not stated | 1.48 | |||||
| Shropshire | ‐11.73 | Not stated | Not stated | 1.76 | Not stated | Not stated | 1.29 | |||||
| Herefordshire | ‐11.97 | Not stated | Not stated | 2.56 | Not stated | Not stated | 1.53 | |||||
a. Caries data reported as deft (SE)
b. Caries data reported as dmft (SD)
Beal 1971 studied three areas, in two of which water fluoridation was initiated (one classed as 'poor' and the other 'industrial'). The control group was classed as 'industrial'. Given the lack of a validated measure of deprivation, and without knowing the composition of the groups under comparison, it is not possible to draw conclusions from this study.
Holdcroft 1999 and Gray 2001 both used the Jarman score (an index to measure socioeconomic variation across small geographical areas, originally developed as a measure of General Practice workload; a positive score equates to deprivation). The Holdcroft 1999 study contained insufficient information about fluoride levels at baseline or follow‐up and the number of participants measured at each time point was unclear. In both studies the Jarman scores at baseline for the control (non‐fluoridated areas) were all less than zero. The Jarman scores at baseline in the fluoridated areas ranged from ‐7.85 to 15.03 in the Holdcroft 1999 study, and from ‐23.09 to 21.57 in the Gray 2001 study.
Given the reasons above we are unable to draw robust conclusions about the initiation of water fluoridation and its effect on disparities in caries across social class.
Dental fluorosis
Aesthetic concern
Fluoride levels of 5 ppm or less
We included 40 studies, at high risk of bias, that reported data from 59,630 participants in the analysis of dental fluorosis of aesthetic concern. The reported fluoride exposure ranged from 0 to 4.9 ppm with a mean of 0.80 ppm (SD 0.90).
In order to assess the assumption of linearity we plotted the log odds of the prevalence of dental fluorosis with fluoride level and with log of fluoride level (not shown). A positive linear relationship could be assumed in both cases, indicating that as fluoride levels increase so does the prevalence of dental fluorosis. The reported fluoride level was used as a predictor rather than the log of reported fluoride exposure. This was then centred by taking away the grand mean (0.80) from the reported fluoride level.
Caterpillar plots (not shown) of the residuals for slope and intercept indicated that many of the studies differed significantly from the average (random effects at zero) at the 0.05 level of significance. The effect of fluoride exposure was positive and statistically significant; a higher prevalence of dental fluorosis is associated with increased fluoride exposure (OR 2.90, 95% CI 2.05 to 4.10). When controlling for study effects, we would expect the odds of dental fluorosis to increase by a factor of 2.90 for each one unit increase in fluoride exposure.
The random intercept and random slope model indicated that the effect of fluoride exposure differed across studies. The statistically significant negative covariance of ‐0.82 implies that studies with a higher than average probability of dental fluorosis tend to have a more shallow slope.
The results presented so far have been based on study‐specific values. This is indicated in the following graphic, where the random effects of intercept and slope are set to zero, in effect the plotted prevalence of dental fluorosis in an 'average' study. An alternative approach is to calculate the prevalence of dental fluorosis in all studies combined, to obtain the marginal probability of dental fluorosis. The study‐specific values indicate the probability of dental fluorosis in terms of 'any given participant' whereas the marginal probabilities indicate the probability of dental fluorosis 'among the participants' (Figure 7).

Proportion of the population with dental fluorosis of aesthetic concern by water fluoride level together with 95% confidence limits for the proportion (studies reporting up to and including 5ppm).
The marginal probabilities of dental fluorosis of aesthetic concern at different fluoride levels are given below.
| Fluoride exposure (ppm) | Probability of dental fluorosis of aesthetic concern (95% CI) |
| 0.1 | 0.08 (0.05 to 0.12) |
| 0.2 | 0.09 (0.06 to 0.13) |
| 0.4 | 0.10 (0.06 to 0.15) |
| 0.7 | 0.12 (0.08 to 0.17) |
| 1 | 0.15 (0.11 to 0.21) |
| 1.2 | 0.18 (0.13 to 0.24) |
| 2 | 0.31 (0.23 to 0.40) |
| 4 | 0.59 (0.46 to 0.71) |
All fluoride levels
The analysis of dental fluorosis of aesthetic concern at all reported fluoride exposure was based on 60,030 observations from 40 studies. The reported fluoride levels ranged from 0 to 7.6 ppm with a mean of 0.85 ppm (SD 1.03).There was very little difference in the results from the analysis restricted to 5 ppm or less. The effect of fluoride exposure is positive and statistically significant; a higher prevalence of dental fluorosis is associated with increased fluoride exposure (OR 2.84, 95% CI 2.00 to 4.03). When controlling for study effects, we would expect the odds of dental fluorosis to increase by a factor of 2.84 for each one unit increase in fluoride level (1 ppm F).
Any dental fluorosis
Fluoride levels of 5 ppm or less
We included 90 studies, at high risk of bias, that reported data from 180,530 participants in this analysis. The reported fluoride levels in the studies ranged from 0 to 5 ppm, with a mean of 1.22 ppm (SD 0.92). When restricted to studies reporting fluoride exposure of 5 ppm or less, there is a clearer positive relationship between the proportion of children with dental fluorosis and fluoride level.
The relationship between the log odds of dental fluorosis and fluoride level and log fluoride level were both approximately linear. Consequently the reported fluoride exposure was used as a predictor rather than the log of reported fluoride exposure. This was then centred by taking away the grand mean (1.22) from the reported fluoride exposure level.
The effect of fluoride exposure is positive and statistically significant; a higher prevalence of dental fluorosis is associated with increased fluoride exposure (OR 3.60, 95% CI 2.86 to 4.53). Controlling for study effects, we would expect the odds of dental fluorosis to increase by a factor of 3.60 for each one unit increase in fluoride exposure (1 ppm F).
The random intercept and random slope model indicated that the effect of fluoride exposure differed across studies. The statistically significant negative covariance of ‐1.05 implies that studies with a higher than average probability of dental fluorosis tend to have a more shallow slope.
The results presented so far have been based on study‐specific values. This is indicated in the following graph, where the random effects of intercept and slope are set to zero, in effect the plotted prevalence of dental fluorosis in an 'average' study
(Figure 8).
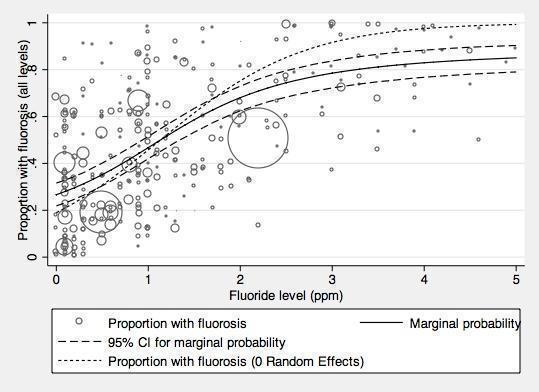
Proportion of the population with dental fluorosis of any level by water fluoride level together with 95% confidence limits for the proportion (studies reporting up to and including 5ppm F)
The marginal probabilities of any dental fluorosis are presented in the table below.
| Fluoride exposure (ppm) | Probability of any dental fluorosis (95% CI) |
| 0.1 | 0.28 (0.23 to 0.33) |
| 0.2 | 0.30 (0.25 to 0.34) |
| 0.4 | 0.33 (0.28 to 0.38) |
| 0.7 | 0.40 (0.35 to 0.44) |
| 1 | 0.47 (0.42 to 0.52) |
| 1.2 | 0.52 (0.47 to 0.56) |
| 2 | 0.68 (0.62 to 0.73) |
| 4 | 0.83 (0.77 to 0.88) |
All fluoride levels
We included 90 studies that reported data from 182,233 participants in this analysis. The reported fluoride levels ranged from 0 to 14 ppm with a mean fluoride level of 1.28 ppm (SD 1.11). There was little change in the pooled estimates when all fluoride levels were included in the analysis. The effect of fluoride exposure is positive and statistically significant; a higher prevalence of dental fluorosis is associated with increased fluoride exposure (OR 3.13, 95% CI 2.55 to 3.85). When controlling for study effects, we would expect the odds of dental fluorosis to increase by a factor of 3.13 for each one unit increase in fluoride exposure (1 ppm F).
The statistically significant negative covariance of ‐0.87 implies that studies with a higher than average probability of dental fluorosis tend to have a shallower slope. The between study variance increases as fluoride level increases.
Post hoc analysis
We used a multivariate analysis to investigate possible sources of heterogeneity in the model. We explored the effects of source of fluoride and its interaction with fluoride concentration by including them as fixed covariates in the models above. Source of fluoride was classed as natural or artificial. We excluded studies that reported mixed sources of fluoridation, or where the source of fluoridation was not reported, from the analysis. This analysis was carried out separately for the outcomes of fluorosis and fluorosis of aesthetic concern, and for studies reporting fluoride concentrations at any level and restricted to 5 ppm or less.
The results from the models with the additional covariates and the ones containing fluoride concentration only as a covariate are not directly comparable, as the additional covariate analyses included fewer studies due to missing data (source of fluoride). For fluorosis of aesthetic concern at all concentrations, fluoride concentration and source of fluoride explain a proportion of the variation between estimates, whereas the interaction between these estimates does not (the OR for fluorosis due to fluoridation becomes 3.16 (95% CI 2.12 to 4.71) when controlling for source of fluoride (OR 0.25, 95% CI 0.09 to 0.70) and interaction (OR 1.89, 95% CI 0.74 to 4.82). The conclusions are the same for fluorosis of aesthetic concern at fluoride concentrations of 5 ppm or less (the OR for fluorosis due to fluoridation becomes 3.22 (95% CI 2.16 to 4.79) when controlling for source of fluoride (OR 0.25, 95% CI 0.10 to 0.70) and interaction (OR 1.82, 95% CI 0.71 to 4.62)).
For the outcome of fluorosis at all levels, the additional covariates do not contribute significantly to the model.
Other dental fluorosis studies
Approximately one third of the dental fluorosis studies that met the review's inclusion criteria did not report data in a way that allowed for further analysis (Appendix 11).
Other adverse effects reported in the included studies
Five studies that reported on dental fluorosis also presented data on the association of water fluoridation with skeletal fluorosis (Chen 1993; Jolly 1971; Wang 2012), bone fracture (Alarcon‐Herrera 2001), and skeletal maturity (Wenzel 1982), in participants between the ages of six and over 66 years. Four of the studies included a total of 596,410 participants (Alarcon‐Herrera 2001; Chen 1993; Wang 2012; Wenzel 1982), and fluoride concentration in all four studies ranged from less than 0.2 ppm to 14 ppm. The studies were all at high risk of bias and we did not analyse their results further (Table 5).
Discussion
Summary of main results
Of the 155 studies that met the inclusion criteria, 107 studies provided sufficient data for quantitative synthesis. Fourteen studies provided adequate data for the assessment of the effect of the initiation of a water fluoridation programme on dental caries, one study focused on the effect of the cessation of water fluoridation. Although three studies evaluated disparities in dental caries across social class, no data were suitable for further analysis. Ninety studies provided sufficient data for inclusion in the analysis of dental fluorosis of any level (40 in the analysis of dental fluorosis of aesthetic concern).
Our confidence in the size of the effect estimates obtained for the prevention of caries is limited (see Quality of the evidence and summary of findings Table for the main comparison; summary of findings Table 2 ).
The results from the caries severity data indicate that the initiation of water fluoridation results in reductions in the order of 1.8 dmft and 1.2 DMFT for deciduous and permanent dentitions. This translates to reductions of 35% and 26% compared to the median control group mean values. In addition, there was an increase in the percentage of children who were caries free (15% increase when evaluating deciduous dentition and 14% in the permanent dentition).
There is insufficient information to determine whether initiation of a water fluoridation programme results in a change in disparities in caries levels across SES.
There is insufficient information to determine the effect of stopping water fluoridation programmes on caries levels.
There were no studies that met the review's inclusion criteria that investigated the effectiveness of water fluoridation for preventing caries in adults.
With regard to dental fluorosis, the percentage of participants with dental fluorosis of aesthetic concern was estimated to be approximately 12% for a fluoride level of 0.7 ppm. This increases to 40% when considering dental fluorosis of any level, however, this includes fluorosis that can only be detected under very controlled, clinical conditions and other enamel defects.
Adverse effects, other than dental fluorosis, were rarely reported in the included studies.
Overall completeness and applicability of evidence
The applicability of the evidence on water fluoridation to today’s societies is unclear and highly likely to vary according to setting.
The evidence included in the review pertains to caries in children only. Only one study, that met the review's inclusion criteria, examined the effect of water fluoridation on adults (Pot 1974); the reported outcome for this study was the percentage of participants with dentures. There are no data to determine the effect of water fluoridation on caries levels in adults. Research, utilising data from 26 countries, indicates that dental caries levels in permanent dentition in adults are significantly higher than in children (Bernabe 2014). It has been suggested that greater attention needs to be directed at preventing caries at all stages of life, not just childhood.
Approximately 71% of the included caries studies that evaluated the initiation of water fluoridation were conducted prior to 1975.
In developed countries, the widespread use of fluoride toothpastes from the mid to late 1970s, along with increased access to other caries‐preventive strategies of proven effectiveness, such as fluoride varnishes (Marinho 2013), and dental sealants (Ahovuo‐Saloranta 2013), may mean that the benefit of water fluoridation is reduced in such populations. However, the Marinho 2003a review evaluated the effect of topical fluorides for preventing dental caries in children and adolescents, and found no evidence that the effect of topical fluoride was dependent on background exposure to other fluoride sources. The reviewers did find evidence that the relative effect of topical fluoride may be greater in those who have higher baseline levels of caries.
Globally, caries levels have been reducing. In 1980 the global DMFT for 12 year olds was estimated to be 2.43 (Leclercq 1987). In 2011, this global estimate had reduced to 1.67 DMFT (although there is variation by World Health Organisation region; Table 7). Within the studies included in the review, the mean values for DMFT at follow‐up in the non‐fluoridated areas were higher, ranging from 0.7 to 5.5.
| WHO regions | DMFT |
| 2011 | |
| Africa | 1.19 |
| Americas | 2.35 |
| Eastern Mediteranean | 1.63 |
| Europe | 1.95 |
| South East Asia | 1.87 |
| Western Pacific | 1.39 |
| GLOBAL | 1.67 |
http://www.mah.se/CAPP/Country‐Oral‐Health‐Profiles/According‐to‐Alphabetical/Global‐DMFT‐for‐12‐year‐olds‐2011/
Figure 9 shows global dental caries levels (DMFT) among 12 year olds. Out of the 189 countries that provided data, 148 (78%) have a DMFT of 3 or less. Areas where a large percentage of the population (more than 60%) receive fluoridated water (either natural or artificial fluoridation) include: North America, Australasia, parts of South America (namely Brazil, Columbia and Chile), the Republic of Ireland, and Malaysia. Whilst these areas tend to have low to very low DMFT (Figure 9), there are many other parts of the world where fluoridated water is not widespread that also have low caries levels. Equally, there are areas with relatively high distribution of water fluoridation and moderate caries levels (e.g. Brazil).
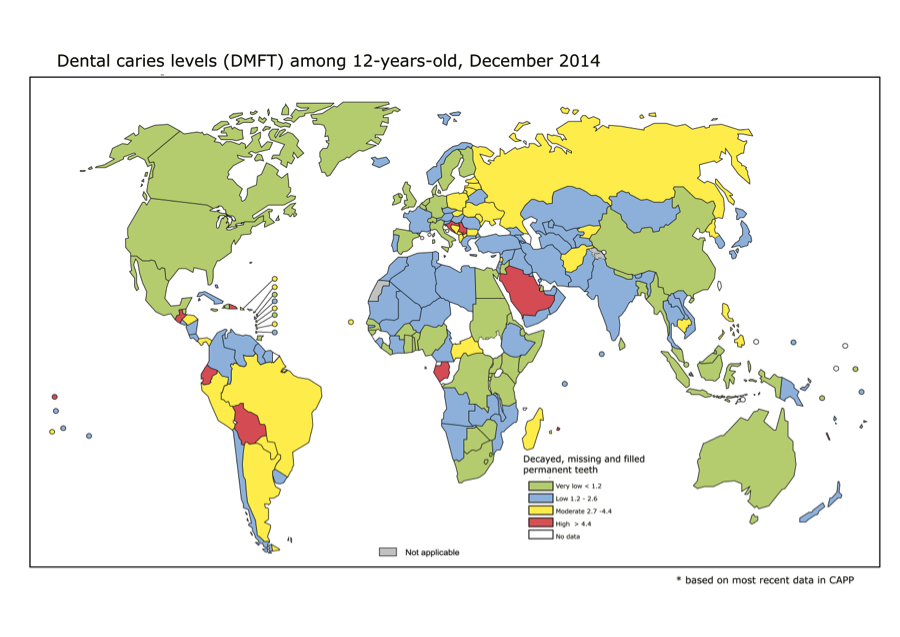
The applicability of the evidence around water fluoridation has to be considered in the context of reductions in caries levels over time, the uptake of other strategies proven to prevent caries, and global changes in patterns of food consumption (Kearney 2010). Annual sugar consumption, specifically, has risen dramatically since the start of the 20th century when it was approximately 5.1 kg per capita. The consumption of sugar continues to rise with the average sugar consumption now estimated at 23 kg per capita; the greatest rates of growth are currently seen in Asia, the Middle East and Africa (SucDen 2015). In addition, in many parts of the world more industrially processed foods are consumed, with less food being prepared and cooked in the home using locally sourced water (Slimani 2009). Variation in fluoride concentrations in water across regions and countries, and the increase in processed foods and beverages and their transportation, make it difficult to assess dietary fluoride intake. Such changes may mean that, although the tap water is fluoridated in a particular area, some members of the population do not consume a sufficient volume, either through beverages or foods prepared with tap water, to provide a benefit to their oral health.
Ten of the 14 studies used in the analysis of water fluoridation initiation schemes included lifetime residents only. Whilst this is a valid approach it evaluates the absolute effect rather than the benefit to the whole population. The effect size shown in the review may, therefore, be larger than that found in the population, depending on population movement/migration.
There was limited reporting of adverse effects, other than dental fluorosis, in the included studies. The broader literature speculates about harms associated with higher levels of fluoride in water (e.g. cancer, lowered intelligence, endocrine dysfunction), however, there has been insufficient evidence to draw conclusions (MRC 2002).
Quality of the evidence
The GRADE approach was used to assess the quality of the evidence within the review. GRADE has developed over recent years as an internationally recognised framework for systematically evaluating the quality of evidence within both systematic reviews and guidelines. It aims to overcome the confusion that arises from having multiple systems for grading evidence and recommendations, and, because of this key aim, the GRADE working group discourages the use of modified GRADE approaches. However, there has been much debate around the appropriateness of GRADE when applied to public health interventions, particularly for research questions where evidence from randomised controlled trials is never going to be available due to the unfeasibility of conducting such trials. Community water fluoridation is one such area.
When applying GRADE to non‐randomised studies, the quality of the evidence automatically starts at 'low', as opposed to 'high' for RCTs. There has been some criticism of GRADE with regard to its inability to discriminate between stronger and weaker observational designs (Rehfuess 2013). It has been proposed that certain designs, such as quasi‐experimental designs and interrupted‐time‐series studies should begin at 'moderate' quality. Indeed, WHO have previously employed such a modified approach (Bruce 2014). Others suggest that starting non‐randomised studies at 'low' simply acknowledges our reduced certainty that observed effects are actually due to the intervention itself. With regard to the current review, using a modified approach to differentiate between stronger and weaker study designs would have no impact on the overall quality assessment as the study designs would still not merit commencing at 'moderate'.
Another concern about applying GRADE is the limited possibilities for 'upgrading' the quality of evidence from observational studies. Modified approaches to GRADE have incorporated the option to upgrade for consistency in findings (Bruce 2014). Within the current review, it was not felt appropriate to upgrade for consistency as there was statistically significant heterogeneity present in all four caries analyses. However, given that the direction of effect was the same for all but one of the outcomes in one of the studies, we have not downgraded with regard to inconsistency.
In our review protocol we stated that we would produce a 'Summary of findings' table, applying the GRADE criteria. We have attempted to be transparent in our decisions regarding the downgrading/upgrading of the quality of the evidence, and feel our decisions are justified. The quality of the evidence, when GRADE criteria are applied, is judged to be low. However, we accept that the terminology of 'low quality’ for evidence may appear too judgmental. We acknowledge that studies on water fluoridation, as for many public health interventions, are complex to undertake and that researchers are often constrained in their study design by practical considerations. For many public health interventions, the GRADE framework will always result in a rating of low or very low quality. Decision makers need to recognise that for some areas of research, the quality of the evidence will never be 'high' and that, as for any intervention, the recommendation for its use depends not just upon the quality of the evidence but also on factors such as acceptability and cost‐effectiveness (Burford 2012). In order to overcome some of the concerns around the use of GRADE within this review, a decision was made to omit the GRADE terminology of 'low quality' and discuss the findings in terms of our confidence in the results.
With regard to the caries outcomes, all included studies were observational and our confidence in the effect estimate is limited. We downgraded the quality of the evidence due to an overall high risk of bias in the included studies (excluding domains associated with randomisation, allocation concealment, blinding of participants). The main areas of concern were confounding and lack of blind outcome assessment. The evidence was additionally downgraded for indirectness due to the fact that about 71% of the caries studies that evaluated the initiation of water fluoridation were conducted prior to 1975 (Overall completeness and applicability of evidence). Present day reductions in caries may be of a smaller magnitude in developed countries. Also, there were no included studies evaluating caries levels in adults. There was statistically significant heterogeneity present in all four caries analyses (Analysis 1.1; Analysis 1.2; Analysis 1.3; Analysis 1.4), with I² statistics of 84% or more. However, given that the direction of effect was the same for all but one of the outcomes in one of the studies, we have not downgraded with regard to inconsistency. The study showing an effect in the opposite direction was the most recently conducted study, with low baseline caries levels, and, as yet, the shortest duration of follow‐up (Blinkhorn (unpublished)); both these factors could influence the effect estimate. It is also possible, given the widespread coverage of fluoridated water in Australia, that the low baseline caries reflects diffusion of fluoride from other areas through commercial foods and beverages.
With regard to dental fluorosis, again, all studies were observational and we downgraded the quality of the evidence due to an overall high risk of bias and inconsistency due to substantial between‐study variation. Our confidence in the effect estimate is limited.
Potential biases in the review process
Within the review, water with a fluoride concentration of 0.4 ppm or less was classified as non‐fluoridated. This cut‐off was arbitrary, based on a priori clinical judgement. It is acknowledged that that this cut‐off might be high for equivalence of non‐fluoridation in hot climates. In practice, only one of the 15 studies that provided sufficient data for analysis of caries levels following a change in fluoridation status had a fluoride concentration greater than 0.2 ppm in the non‐fluoridated area.
We imputed the standard deviation for four studies included in the analysis of water fluoridation for preventing caries (dmft and DMFT). This was not prespecified in the protocol. The equation for imputing the standard deviations was estimated from available data where the standard deviations were given (Appendix 10). Sensitivity analysis, excluding those studies for which the standard deviation had been imputed gave similar results.
An arbitrary cut‐off date of 1975 was used as an indication of when fluoridated toothpaste use became widespread in industrialised countries. There is no indication in the included studies of the extent to which this is true.
We only reported on dmft in children eight years old and younger. This decision was based on clinical judgement, but was not prespecified in the protocol. The cut‐off is unlikely to alter the review's findings as very little data was excluded due to this cut‐off.
When analysing the dental fluorosis data, our primary analysis focused on fluoride concentrations of 5 ppm or less. Again, this was an arbitrary cut‐off; there was little difference in the results obtained when all fluoride concentrations were examined.
Agreements and disagreements with other studies or reviews
The most widely recognised systematic review of water fluoridation was published in 2000 (McDonagh 2000). Our review aimed to update this review, but has adopted different methods in certain areas. Importantly, these included changes to the evaluation of the cessation of water fluoridation programmes and the evaluation of disparities in caries levels.
The McDonagh 2000 review included 26 studies that looked at the effect of water fluoridation on oral health. No pooling of data was undertaken. The mean difference in change in dmft/DMFT and increase in proportion of caries‐free children were presented for selected ages/age groups. The range of mean reduction in dmft/DMFT score was from 0.5 to 4.4, with a median of 2.25 dmft/DMFT. In our review, we did undertake statistical pooling, imputing standard deviations where necessary. Rather than selecting specific ages from the data provided in the included studies, we undertook the analyses by dentition, utilising all data for deciduous teeth for children aged eight years and younger, and all available data for permanent teeth. The analyses showed mean reductions of 1.81 in dmft and 1.16 in DMFT, due to water fluoridation.
In terms of the proportion of caries‐free children following water fluoridation, the McDonagh 2000 review reported a range of mean differences from ‐0.05 to an increase of 0.64, with a median of 0.15. The pooled estimate obtained in our review demonstrates an increase in proportion of caries‐free children in the areas with water fluoridation of 0.15 for deciduous teeth and 0.14 for permanent teeth.
With regard to the cessation of water fluoridation programmes, the McDonagh 2000 review included eight studies, whereas our review included only one (Maupome 2001). This difference is due to the inappropriate choice of control group in the cessation studies. In a controlled before‐and‐after study, the groups should be comparable at baseline. Therefore, in the water fluoridation cessation studies, the two groups should both be fluoridated areas, one of which (the 'intervention' group) subsequently has the fluoride removed from the water. The area that remains fluoridated acts as the control. In the majority of the cessation studies, a non‐fluoridated area was used as the control at baseline. The intervention and control groups, therefore, were not comparable at the start of the study. Whilst the McDonagh 2000 review suggested that caries prevalence increases following the withdrawal of water fluoridation, this result was not confirmed in the study included in our review.
Neither the McDonagh 2000 review nor our review included studies that evaluated the effectiveness of water fluoridation for preventing caries in adults. However, Griffin 2007 undertook a comprehensive systematic review evaluating the effectiveness of fluoride in preventing caries in adults, including nine studies that examined the effectiveness of water fluoridation. The studies included fell outside the scope of both the McDonagh 2000 review and our review. One of the nine studies they included was a prospective cohort trial, and the remaining eight were cross‐sectional studies, with single time‐point data. In our review, we only included studies that reported caries data if they had a concurrent control, with at least two points in time evaluated. In the analyses, Griffin 2007 demonstrated a prevented fraction of 34.6% (95% CI 12.6% to 51.0%), when pooling data from seven studies of lifelong residents of control or fluoridated‐water communities (5409 participants). When the analysis was limited to studies published after 1979 the prevented fraction was 27.2% (95% CI 19.4% to 34.3%; 5 studies; 2530 participants). The most recent of these post‐1979 papers was published in 1992. The fluoride concentration evaluated in these more recent studies was not reported in two studies and was above what is considered the 'optimal level' in a further two studies. Griffin and colleagues acknowledge that the paucity of studies and the quality of the included studies limits their review.
A more recent evaluation of the effects of fluoridated drinking water on dental caries in adults has been conducted in Australia (Slade 2013). A comparison in caries levels was made between a cohort of adults born before the widespread implementation of fluoridation (before 1960; n = 2270) and a cohort born after widespread implementation (n = 1509). Greater lifetime exposure to water fluoridation was associated with lower levels of caries experience in both cohorts. In the study, 31% of participants were excluded from the complete‐case analysis due to missing data. The authors report that imputation to account for missing data "did not markedly alter estimated associations between fluoride exposure and caries experience" (Slade 2013).
When addressing the issue of whether water fluoridation results in a reduction in disparities in caries levels across different groups of people, the McDonagh 2000 review included 15 studies, all except two of which were cross‐sectional surveys. The authors concluded that, based on a small number of low quality, heterogeneous studies, there was "some evidence that water fluoridation reduces the inequalities in dental health across social classes in five and 12 year‐olds, using the dmft/DMFT measure. This effect was not seen in the proportion of caries‐free children among five year‐olds. The data for the effects in children of other ages did not show an effect." They suggested caution in interpreting these results due to the small number of studies and their low quality rating (McDonagh 2000). There were no data for disparities in caries levels amongst adults.
The cross‐sectional studies, whilst able to provide information on whether water fluoridation is associated with a reduction in disparities, are not able to address the question of whether water fluoridation results in a reduction in disparities in caries levels. There were insufficient data to determine whether initiation of a water fluoridation programme results in a change in disparities in caries levels across different groups of people.
In the past 20 years, the majority of research evaluating the effectiveness of water fluoridation for the prevention of dental caries has been undertaken using cross‐sectional studies with concurrent control, with improved statistical handling of confounding factors (Rugg‐Gunn 2012). We acknowledge that there may be concerns regarding the exclusion of these studies from the current review. A previous review of these cross‐sectional studies has shown a smaller measured effect in studies post‐1990 than was seen in earlier studies, although the effect remains significant. It is suggested that this reduction in size of effect may be due to the diffusion effect (Rugg‐Gunn 2012); this is likely to only occur in areas where a high proportion of the population already receive fluoridated water. The authors of the review conclude that "There is need for further thought to strengthen study design" (Rugg‐Gunn 2012).
The results from our review of the dental fluorosis data are fairly comparable with those of the McDonagh 2000 review. The McDonagh 2000 review fluorosis analysis excluded areas with natural fluoride levels above 5 ppm. It was acknowledged that this is significantly above the level recommended for artificial fluoridation, however the range of concentration of 0 ppm to 5 ppm allowed exploration of a dose‐response relationship. In the current review, we also conducted analyses of studies of fluoride concentrations of 5 ppm or lower, in addition to an analyses of all studies irrespective of fluoride concentrations. In the McDonagh 2000 review, the estimated percentage of the population with dental fluorosis of aesthetic concern at a fluoride concentration of 0.7 ppm was 9% (95% CI 4% to 17%; based on studies with fluoride concentration of 5 ppm or lower); in our review this was slightly higher at 12% (95% CI 8% to 17%). There was little change in the pooled estimates when all fluoride levels were included in the analysis.
The broader literature speculates about harms associated with higher levels of fluoride in water (e.g. cancer, lowered intelligence, endocrine dysfunction). These harms have not been systematically evaluated in this review, however, previous reviews suggest there is insufficient evidence to draw conclusions about them (MRC 2002; NHMRC 2007).
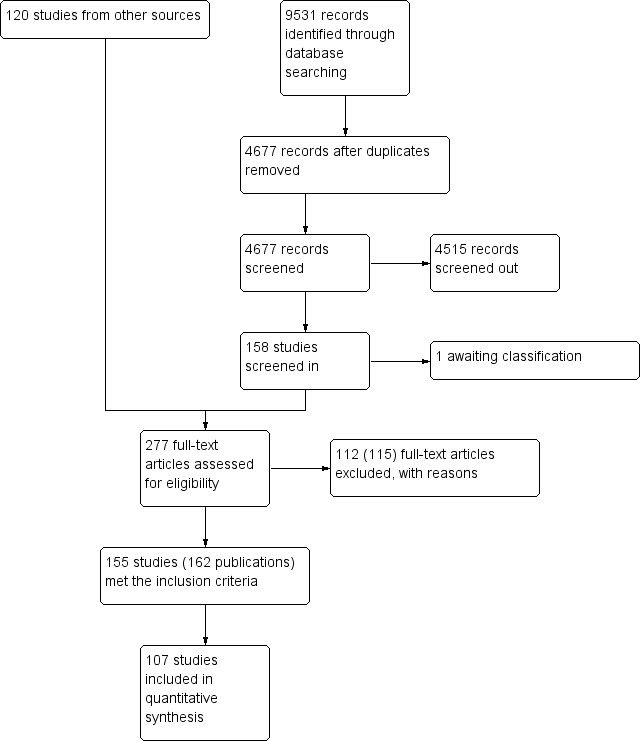
Figure 1. Study flow diagram.

Risk of bias summary: review authors' judgements about each risk of bias item for each included study.

Initiation of water fluoridation compared with low/non‐fluoridated water: change in dmft
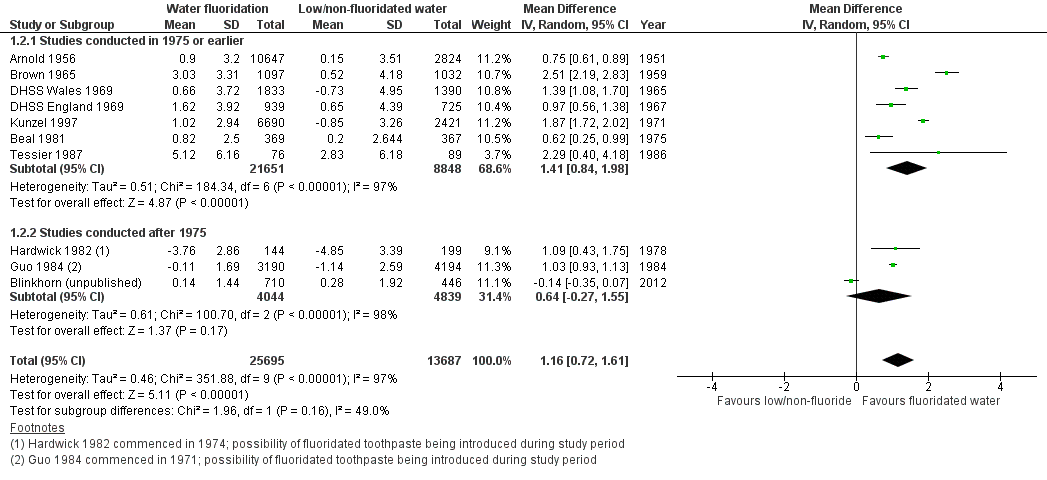
Initiation of water fluoridation compared with low/non‐fluoridated water: change in DMFT

Initiation of water fluoridation compared with low/non‐fluoridated water: change in proportion of caries‐free children (deciduous teeth)

Initiation of water fluoridation compared with low/non‐fluoridated water: change in proportion of caries‐free children (permanent teeth)
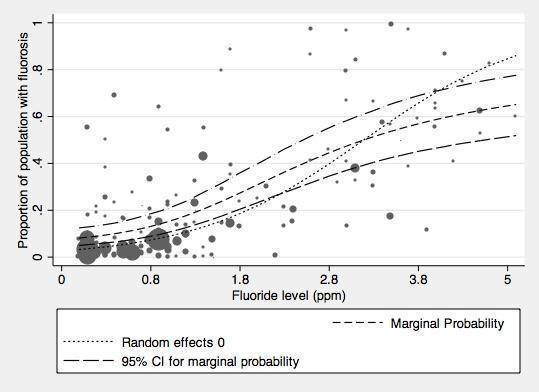
Proportion of the population with dental fluorosis of aesthetic concern by water fluoride level together with 95% confidence limits for the proportion (studies reporting up to and including 5ppm).

Proportion of the population with dental fluorosis of any level by water fluoride level together with 95% confidence limits for the proportion (studies reporting up to and including 5ppm F)

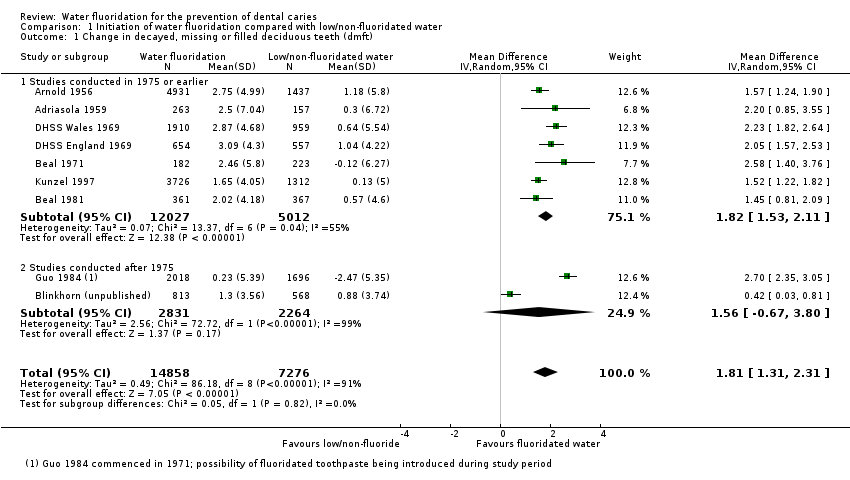
Comparison 1 Initiation of water fluoridation compared with low/non‐fluoridated water, Outcome 1 Change in decayed, missing or filled deciduous teeth (dmft).

Comparison 1 Initiation of water fluoridation compared with low/non‐fluoridated water, Outcome 2 Change in decayed, missing or filled permanent teeth (DMFT).
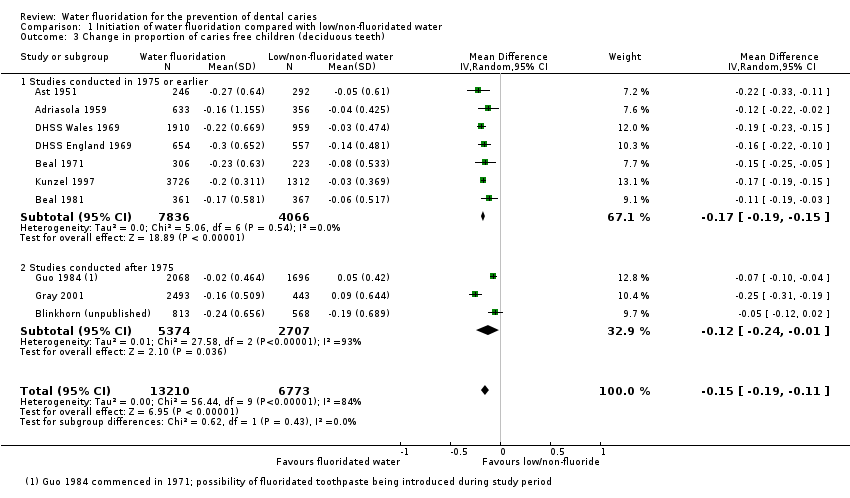
Comparison 1 Initiation of water fluoridation compared with low/non‐fluoridated water, Outcome 3 Change in proportion of caries free children (deciduous teeth).

Comparison 1 Initiation of water fluoridation compared with low/non‐fluoridated water, Outcome 4 Change in proportion of caries free children (permanent teeth).
| Initiation of water fluoridation compared with low/non‐fluoridated water for the prevention of dental caries | ||||||
| Patient or population: people of all ages Settings: community setting Intervention: initiation of water fluoridation Comparison: low/non‐fluoridated water | ||||||
| Outcomes | Illustrative comparative risks* (95% CI) | Relative effect | No of participants | Quality of the evidence | Comments | |
| Risk in area with low/non‐fluoridated water | Risk in area with initiation of water fluoridation | |||||
| Caries in deciduous teeth (dmft)1 Scale from: 0 to 20 (lower = better) Follow‐up: range from 3‐12 years | The mean dmft at follow‐up in the low/non‐fluoridated areas ranged from 1.21 to 7.8 (median 5.1) | The mean dmft in the areas with water fluoridation was 1.81 lower (1.31 lower to 2.31 lower) | 44,2682 (9 observational studies) | ⊕⊕⊝⊝3,4,5,6 | This indicates a reduction in dmft of 35% in the water fluoridation groups over and above that for the control groups We have limited confidence in the size of this effect due to the high risk of bias within the studies and the lack of contemporary evidence | |
| Caries score in permanent teeth (DMFT)7 Scale from: 0 to 32 (lower better) Follow‐up: range from 8‐11 years | The mean DMFT at follow‐up in the low/non‐fluoridated areas ranged from 0.7 to 5.5 (median 4.4) | The mean DMFT in the areas with water fluoridation was 1.16 lower (0.72 lower to 1.61 lower) | 78,7642 (10 observational studies) | ⊕⊕⊝⊝3,4,5,6 | This indicates a reduction in DMFT of 26% in the water fluoridation groups over and above that for the control groups We have limited confidence in the size of this effect due to the high risk of bias within the studies and the lack of contemporary evidence | |
| Change in proportion of caries‐free children (deciduous teeth) Scale: 0 to 1 Follow‐up: range 3‐12 years | The proportion of caries‐free children at follow‐up in the low/non‐fluoridated areas ranged from 0.06 to 0.67 (median 0.22) | The proportion of caries‐free children increased in the areas with water fluoridation 0.15 (0.11 to 0.19) | 39,9662 (10 observational studies) | ⊕⊕⊝⊝3,4,5,6 | We have limited confidence in the size of this effect due to the high risk of bias within the studies and the lack of contemporary evidence | |
| Change in proportion of caries‐free children (permanent teeth) Scale: 0 to 1 Follow‐up: range 8‐12 years | The proportion of caries‐free children at follow‐up in the low/non‐fluoridated areas ranged from 0.01 to 0.67 (median 0.14) | The proportion of caries‐free children increased in the areas with water fluoridation 0.14 (0.05 to 0.23) | 53,5382 (8 observational studies) | ⊕⊕⊝⊝3,4,5,6 | We have limited confidence in the size of this effect due to the high risk of bias within the studies and the lack of contemporary evidence. | |
| Disparities in caries by socioeconomic status (SES)8 | > 35,3999 (3 observational studies) | ⊕⊕⊝⊝3 | There is insufficient information to determine whether initiation of a water fluoridation programme results in a change in disparities in caries levels across SES | |||
| Adverse effects Dental fluorosis of aesthetic concern10 (measured by Dean's Index, TFI, TSIF)11 | For a fluoride level of 0.7 ppm the percentage of participants with dental fluorosis of aesthetic concern was estimated to be 12% (95% CI 8% to 17%). Controlling for study effects, we would expect the odds of dental fluorosis to increase by a factor of 2.90 (95% CI 2.05 to 4.10) for each one unit increase in fluoride level (1 ppm F). | 59,630 (40 observational studies) | ⊕⊕⊝⊝3,12 | The estimate for any level of dental fluorosis at 0.7ppm was 40% (95% CI 35% to 44%; 90 studies). This includes dental fluorosis that can only be detected under clinical conditions and other enamel defects We have limited confidence in the size of this effect due to the high risk of bias and substantial between‐study variation. | ||
| ⊕⊕⊕⊕: We are very confident that the true effect lies close to that of the estimate of the effect. Further research is very unlikely to change the estimate of effect. | ||||||
|
| ||||||
| Cessation of water fluoridation compared with fluoridated water for the prevention of dental caries | |||
| Patient or population: people of all ages Settings: community setting Intervention: cessation of water fluoridation Comparison: fluoridated water | |||
| Outcomes | No of participants | Quality of the evidence | Comments |
| Caries in permanent teeth (DMFS)1 Follow‐up: 3 years | 92492 (1 observational study) | ⊕⊝⊝⊝ 3 | Insufficient evidence to determine the effect of the cessation of water fluoridation on caries |
| Caries in deciduous teeth (dmft/dmfs)4 | No evidence to determine the effect of the cessation of water fluoridation on caries | ||
| Change in proportion of caries‐free children (deciduous or permanent teeth) | No evidence to determine the effect of the cessation of water fluoridation on caries | ||
| Disparities in caries by socioeconomic status (SES)5 | No evidence to determine the effect of the cessation of water fluoridation on disparities | ||
| Adverse effects | No evidence to determine whether cessation of a water fluoridation programme is associated with any harms | ||
| ⊕⊕⊕⊕: We are very confident that the true effect lies close to that of the estimate of the effect. Further research is very unlikely to change the estimate of effect. | |||
|
| |||
| Study ID | Age | Fluoridated area | Non/low fluoridated area | |||||||||||
| Baseline (before/at initiation) | Follow‐up | Baseline | Follow‐up | |||||||||||
| MEAN | SD | N | MEAN | SD | N | MEAN | SD | N | MEAN | SD | N | |||
| ADRIASOLA 1959 | 5 | 8.9 | 5.03 | 186 | 6.4 | 4.18 | 340 | 8.1 | 4.77 | 174 | 7.8 | 4.67 | 140 | |
| 5 | Mean (SD) change in dmft: 2.5 (7.04) | Mean (SD) change in dmft: 0.3 (6.72) | ||||||||||||
| ARNOLD 1956a | 4 | 4.19 | 3.30 | 323 | 2.13 | 2.26 | 168 | 5.05 | 3.66 | 20 | 4.46 | 3.42 | 63 | |
| 5 | 5.37 | 3.79 | 1633 | 2.27 | 2.34 | 853 | 6.82 | 4.33 | 402 | 5.25 | 3.74 | 351 | ||
| 6 | 6.43 | 4.19 | 1789 | 2.98 | 2.73 | 750 | 7.17 | 4.46 | 462 | 5.67 | 3.91 | 294 | ||
| 7 | 6.29 | 4.14 | 1806 | 4.03 | 3.23 | 423 | 6.66 | 4.28 | 408 | 5.77 | 3.95 | 223 | ||
| 8 | 5.78 | 3.95 | 1647 | 4.12 | 3.27 | 470 | 6.06 | 4.06 | 376 | 5.32 | 3.77 | 275 | ||
| 4‐8 | Mean (SD) change in dmft: 2.75 (4.99) | Mean (SD) change in dmft: 1.18 (5.8) | ||||||||||||
| BEAL 1971 | 5 | 4.91 | 4.86 | 182 | 2.45 | 3.24 | 182 | 4.97 | 4.12 | 217 | 5.09 | 4.84 | 229 | |
| 5 | Mean (SD) change in dmft: 2.46 (5.8) | Mean (SD) change in dmft: ‐0.12 (6.27) | ||||||||||||
| BEAL 1981 | 5 | 4.29 | 3.50 | 196 | 1.8 | 2.48 | 170 | 4.28 | 3.58 | 205 | 3.49 | 3.62 | 180 | |
| 8 | 5 | 2.89 | 189 | 3.42 | 2.84 | 167 | 5.36 | 3.06 | 163 | 4.97 | 3.00 | 186 | ||
| 5/8 | Mean (SD) change in dmft: 2.02 (4.18) | Mean (SD) change in dmft: 0.57 (4.6) | ||||||||||||
| BLINKHORN 2015 | 5‐7 | 2.02 | 3.13 | 781 | 0.72 | 1.63 | 844 | 2.09 | 2.91 | 523 | 1.21 | 2.27 | 612 | |
| 5‐7 | Mean (SD) change in dmft: 1.3 (3.56) | Mean (SD) change in dmft: 0.88 (3.74) | ||||||||||||
| DHSS 1969 (Eng)a | 3 | 2.7 | 2.58 | 43 | 0.6 | 1.11 | 133 | 1.4 | 1.79 | 44 | 1.2 | 1.64 | 144 | |
| 4 | 3.6 | 3.03 | 66 | 1.3 | 1.71 | 131 | 2.6 | 2.53 | 47 | 1.8 | 2.06 | 162 | ||
| 5 | 5.4 | 3.80 | 148 | 1.6 | 1.92 | 111 | 5 | 3.64 | 110 | 2.8 | 2.63 | 119 | ||
| 6 | 5.7 | 3.92 | 182 | 2.5 | 2.47 | 130 | 5.4 | 3.80 | 127 | 4.1 | 3.26 | 107 | ||
| 7 | 6.4 | 4.18 | 192 | 2.7 | 2.58 | 172 | 6 | 4.03 | 121 | 4.3 | 3.35 | 133 | ||
| 3‐7 | Mean (SD) change in dmft: 3.09 (4.3) | Mean (SD) change in dmft: 1.04 (4.22) | ||||||||||||
| DHSS 1969 (Wales)a,b | 3 | 3.9 | 3.17 | 310 | 1.4 | 1.79 | 171 | 4 | 3.21 | 146 | 3.3 | 2.89 | 105 | |
| 4 | 5.54 | 3.86 | 413 | 2.6 | 2.53 | 267 | 5.8 | 3.96 | 210 | 4.8 | 3.56 | 122 | ||
| 5 | 5.5 | 3.84 | 556 | 2.9 | 2.69 | 284 | 5.5 | 3.84 | 256 | 4.8 | 3.56 | 138 | ||
| 6 | 6.3 | 4.15 | 603 | 3.1 | 2.79 | 310 | 6.2 | 4.11 | 331 | 5.9 | 4.00 | 133 | ||
| 7 | 6.85 | 4.35 | 640 | 3.65 | 3.05 | 266 | 7.3 | 4.50 | 346 | 6.8 | 4.33 | 130 | ||
| 3‐7 | Mean (SD) change in dmft: 2.87 (4.68) | Mean (SD) change in dmft: 0.64 (5.54) | ||||||||||||
| GUO 1984 | 3 | 3 | 3.4 | 202 | 2.6 | 3.3 | 79 | 1.3 | 3.2 | 205 | 3.7 | 3.9 | 128 | |
| 4 | 4.6 | 4 | 354 | 4.5 | 4.7 | 164 | 5.6 | 4.6 | 246 | 7.1 | 4.6 | 164 | ||
| 5 | 6.5 | 4.4 | 589 | 5.5 | 4.3 | 345 | 6.4 | 4.2 | 218 | 8.5 | 4.6 | 387 | ||
| 6 | 6.7 | 4.4 | 695 | 6.2 | 4.8 | 297 | 5.8 | 4.2 | 309 | 9 | 4.3 | 354 | ||
| 7 | 5.5 | 3.7 | 399 | 5.6 | 3.7 | 240 | 5.4 | 3.7 | 335 | 7.9 | 3.6 | 352 | ||
| 8 | 4.2 | 3 | 392 | 4.4 | 2.9 | 279 | 3.5 | 2.7 | 343 | 6 | 3.1 | 350 | ||
| 3‐8 | Mean (SD) change in dmft: 0.23 (5.39) | Mean (SD) change in dmft: ‐2.47 (5.35) | ||||||||||||
| KUNZEL 1992a | 5 | 2.4 | 2.415006452 | 688 | 1.4 | 1.7857954 | 1306 | 3.3 | 2.886475039 | 172 | 2.9 | 2.684991275 | 597 | |
| 8 | 4.9 | 3.601718817 | 2438 | 2.8 | 2.632743187 | 3020 | 4.9 | 3.601718817 | 777 | 4.9 | 3.601718817 | 1078 | ||
| 5‐8 | Mean (SD) change in dmft: 2.1 (5.01) | Mean (SD) change in dmft: 0.13 (5.0) | ||||||||||||
| Note: Only data up to the age of 8 years included for the deciduous dentition a. Imputed standard deviation b. 2 fluoridated areas combined | ||||||||||||||
| Study ID | Age | FLuoridated area | Non/low fluoridated area | |||||||||||
| B aseline (before/at initiation) | Follow‐up | Baseline | Follow‐up | |||||||||||
| MEAN | SD | N | MEAN | SD | N | MEAN | SD | N | MEAN | SD | N | |||
| ARNOLD 1956a | 6 | 0.78 | 1.29 | 1789 | 0.26 | 0.70 | 750 | 0.81 | 1.31 | 462 | 0.8 | 1.31 | 294 | |
| 7 | 1.89 | 2.11 | 1806 | 0.84 | 1.34 | 423 | 1.99 | 2.17 | 408 | 1.88 | 2.11 | 223 | ||
| 8 | 2.95 | 2.71 | 1647 | 1.58 | 1.91 | 470 | 2.81 | 2.64 | 376 | 2.63 | 2.54 | 275 | ||
| 9 | 3.9 | 3.17 | 1639 | 2.04 | 2.21 | 582 | 3.81 | 3.13 | 357 | 3.52 | 2.99 | 277 | ||
| 10 | 4.92 | 3.61 | 1626 | 2.93 | 2.70 | 141 | 4.91 | 3.61 | 359 | 4.32 | 3.36 | 62 | ||
| 11 | 6.41 | 4.19 | 1556 | 3.67 | 3.06 | 151 | 6.32 | 4.15 | 293 | 5.34 | 3.78 | 139 | ||
| 12 | 8.07 | 4.76 | 1685 | 5.89 | 3.99 | 176 | 8.66 | 4.95 | 328 | 7.71 | 4.64 | 48 | ||
| 13 | 9.73 | 5.29 | 1668 | 6.6 | 4.26 | 497 | 9.98 | 5.36 | 377 | 9.36 | 5.18 | 225 | ||
| 14 | 10.95 | 5.65 | 1690 | 8.21 | 4.81 | 128 | 12 | 5.95 | 369 | 11.36 | 5.77 | 59 | ||
| 15 | 12.48 | 6.08 | 1511 | 8.91 | 5.03 | 53 | 12.86 | 6.18 | 292 | 12.38 | 6.05 | 21 | ||
| 16 | 13.5 | 6.35 | 1107 | 11.06 | 5.68 | 198 | 14.07 | 6.50 | 248 | 13.16 | 6.26 | 155 | ||
| 6‐16 | Mean (SD) change in DMFT: 0.90 (3.20) | Mean (SD) change in DMFT: 0.15 (3.51) | ||||||||||||
| BEAL 1981 | 8 | 1.48 | 1.51 | 189 | 0.65 | 1.16 | 167 | 1.55 | 1.40 | 163 | 1.34 | 1.50 | 186 | |
| 12 | 3.53 | 3.32 | 192 | 2.74 | 2.33 | 189 | 4.28 | 2.47 | 188 | 4.11 | 2.95 | 197 | ||
| 8/12 | Mean (SD) change in DMFT: 0.82 (2.50) | Mean (SD) change in DMFT: 0.20 (2.64) | ||||||||||||
| BLINKHORN 2015a | 0.59 | 1.10 | 777 | 0.45 | 0.95 | 642 | 0.99 | 1.47 | 436 | 0.72 | 1.23 | 455 | ||
| Mean (SD) change in DMFT: 0.14 (1.44) | Mean (SD) change in DMFT: 0.28 (1.92) | |||||||||||||
| BROWN 1960 | 9‐11 | 4.07 | 2.20 | 595 | 1.52 | 1.80 | 502 | 4.21 | 2.63 | 571 | 3.68 | 2.35 | 521 | |
| 12‐14 | 7.68 | 3.90 | 593 | 3.23 | 2.92 | 503 | 7.94 | 4.41 | 486 | 7.46 | 4.40 | 485 | ||
| 9‐14 | Mean (SD) change in DMFT: 3.03 (3.31) | Mean (SD) change in DMFT: 0.52 (4.18) | ||||||||||||
| DHSS 1969 (Eng)a | 8 | 2.4 | 2.42 | 199 | 1.08 | 1.54 | 95 | 2.4 | 2.42 | 148 | 1.85 | 2.09 | 79 | |
| 9 | 3.1 | 2.79 | 227 | 1.5 | 1.86 | 135 | 2.9 | 2.68 | 166 | 2.4 | 2.42 | 95 | ||
| 10 | 3.6 | 3.03 | 134 | 2 | 2.18 | 115 | 3.8 | 3.12 | 160 | 3.1 | 2.79 | 80 | ||
| 11 | 4.6 | 3.48 | 145 | 3 | 2.74 | 200 | 4.7 | 3.52 | 126 | 3.9 | 3.17 | 122 | ||
| 12 | 5.6 | 3.88 | 111 | 3.52 | 2.99 | 134 | 6.1 | 4.07 | 51 | 4.99 | 3.64 | 99 | ||
| 13 | 7.1 | 4.43 | 91 | 4.9 | 3.60 | 132 | 6.6 | 4.26 | 52 | 6.1 | 4.07 | 127 | ||
| 14 | 8.4 | 4.87 | 70 | 5.77 | 3.95 | 90 | 7.9 | 4.71 | 36 | 6.74 | 4.31 | 108 | ||
| 8‐14 | Mean (SD) change in DMFT: 1.62 (3.92) | Mean (SD) change in DMFT: 0.65 (4.39) | ||||||||||||
| DHSS 1969 (Wales)a,b | 8 | 2.00 | 2.18 | 607 | 1.31 | 1.72 | 283 | 1.95 | 2.15 | 351 | 2.16 | 2.28 | 125 | |
| 9 | 2.65 | 2.55 | 553 | 1.98 | 2.17 | 260 | 2.6 | 2.53 | 325 | 2.9 | 2.68 | 134 | ||
| 10 | 3.35 | 2.91 | 502 | 2.59 | 2.52 | 241 | 3.2 | 2.84 | 308 | 3.6 | 3.03 | 133 | ||
| 11 | 3.83 | 3.14 | 278 | 2.99 | 2.73 | 126 | 3.3 | 2.89 | 270 | 4.1 | 3.26 | 42 | ||
| 12 | 4.65 | 3.50 | 186 | 4.38 | 3.38 | 108 | 3.95 | 3.19 | 265 | 6.16 | 4.09 | 108 | ||
| 13 | 6 | 4.03 | 178 | 5.9 | 4.00 | 93 | 5.2 | 3.72 | 274 | 7.6 | 4.61 | 105 | ||
| 14 | 6.95 | 4.38 | 158 | 6.73 | 4.30 | 93 | 5.6 | 3.88 | 243 | 7.64 | 4.62 | 96 | ||
| 8‐14 | Mean (SD) change in DMFT: 0.66 (3.72) | Mean (SD) change in DMFT: ‐0.73 (4.95) | ||||||||||||
| GUO 1984 | 6 | 0.2 | 0.6 | 695 | 0.2 | 0.5 | 297 | 0.1 | 0.4 | 309 | 0.5 | 0.9 | 354 | |
| 7 | 0.4 | 0.8 | 399 | 0.4 | 0.9 | 240 | 0.3 | 0.7 | 335 | 1.2 | 1.4 | 352 | ||
| 8 | 0.5 | 1 | 392 | 0.5 | 1 | 279 | 0.4 | 0.8 | 343 | 1.6 | 1.5 | 350 | ||
| 9 | 0.7 | 1.1 | 388 | 0.8 | 1.4 | 275 | 0.7 | 1.1 | 310 | 2.2 | 2 | 352 | ||
| 10 | 0.7 | 1.3 | 346 | 1.1 | 1.5 | 310 | 0.8 | 1.5 | 323 | 2.4 | 2 | 436 | ||
| 11 | 0.8 | 1.5 | 330 | 1.6 | 1.9 | 307 | 0.9 | 1.4 | 451 | 3 | 2.7 | 365 | ||
| 12 | 1.1 | 1.7 | 468 | 1.7 | 2.4 | 208 | 0.9 | 1.5 | 841 | 3.4 | 3 | 493 | ||
| 13 | 1.4 | 2 | 469 | 2.1 | 2.9 | 232 | 1.2 | 1.6 | 801 | 3.8 | 3.3 | 504 | ||
| 14 | 1.2 | 1.8 | 322 | 2.6 | 2.9 | 221 | 1 | 1.5 | 795 | 4.4 | 3.8 | 490 | ||
| 15 | 1.7 | 2.5 | 164 | 2.2 | 2.3 | 38 | 1.2 | 1.7 | 121 | 4.2 | 4 | 63 | ||
| 6‐15 | Mean (SD) change in DMFT: ‐0.11 (1.69) | Mean (SD) change in DMFT: ‐1.14 (2.59) | ||||||||||||
| HARDWICK 1982 | 12 | Mean (SD) increment in DMFT: ‐3.76 (2.86) | Mean (SD) increment in DMFT: ‐4.85 (3.39) | |||||||||||
| KUNZEL 1997c,d | 6 | 0.3 | 0.7 | 0.2 | 0.5 | 0.8 | 0.4 | 0.89 | ||||||
| 7 | 0.7 | 1.1 | 0.3 | 0.9 | 1.2 | 1 | 1.48 | |||||||
| 8 | 1.3 | 1.4 | 2419 | 0.5 | 1.00 | 3016 | 1.3 | 1.4 | 777 | 1.8 | 2.06 | 1076 | ||
| 9 | 1.9 | 1.5 | 0.9 | 1.8 | 1.6 | 2.4 | 2.42 | |||||||
| 10 | 2.4 | 1.8 | 1.2 | 2.4 | 1.8 | 3.2 | 2.84 | |||||||
| 11 | 3 | 2 | 1.6 | 2.8 | 1.8 | 3.9 | 3.17 | |||||||
| 12 | 3.7 | 2.3 | 1626 | 2 | 2.18 | 2426 | 3.5 | 2.1 | 563 | 4.8 | 3.56 | 925 | ||
| 13 | 4.3 | 2.7 | 2.6 | 4.1 | 2.6 | 5.5 | 3.84 | |||||||
| 14 | 5.3 | 3.1 | 3.4 | 4.7 | 2.5 | 6.5 | 4.22 | |||||||
| 15 | 5.8 | 3.5 | 1995 | 4 | 3.22 | 1897 | 5.2 | 3.1 | 744 | 7.4 | 4.54 | 756 | ||
| 8/12/15 | Mean (SD) change in DMFT: 1.02 (2.94) | Mean (SD) change in DMFT: ‐0.85 (3.26) | ||||||||||||
| LOH 1996 | 1.6 | 1.8 | 2 | 1.9 | 3.1 | |||||||||
| 4.4 | 2.1 | 3.7 | 4.5 | |||||||||||
| Insufficient data to include in further analysis | ||||||||||||||
| TESSIER 1987a | 6‐7 | 8.28 | 56 | 3.16 | 96 | 8.23 | 85 | 5.4 | 93 | |||||
| 6‐7 | Mean (SD) change in DMFT: 5.12 (6.16) | Mean (SD) change in DMFT: 2.83 (6.18) | ||||||||||||
| a. Imputed standard deviation b. 2 fluoridated areas combined c. Imputed standard deviation for follow‐up data only d. N values only available for ages 8, 12 and 15 years | ||||||||||||||
| Study ID | Age | Fluoridated area | Non/low fluoridated area | ||||||
| Baseline (before/at initiation) | Follow‐up | Baseline | Follow‐up | ||||||
| n | N | n | N | n | N | n | N | ||
| Adriasola 1959a | 3 | 26 | 151 | 82 | 216 | 9 | 77 | 26 | 135 |
| 4 | 12 | 156 | 55 | 216 | 11 | 76 | 11 | 110 | |
| 5 | 4 | 186 | 45 | 340 | 7 | 174 | 14 | 140 | |
| 8 | 21 | 493 | 11 | 458 | 17 | 223 | 2 | 226 | |
| Ast 1951 | 5 | 63 | 274 | 108 | 217 | 73 | 259 | 107 | 324 |
| Beal 1971b | 5 | 62 | 297 | 138 | 314 | 35 | 217 | 55 | 229 |
| Beal 1981 | 5 | 41 | 196 | 78 | 170 | 43 | 205 | 54 | 180 |
| 8 | 18 | 189 | 31 | 167 | 12 | 163 | 18 | 186 | |
| Blinkhorn 2015 | 5‐7 | 397 | 781 | 632 | 844 | 254 | 523 | 412 | 612 |
| DHSS 1969 (Eng) | 3 | 16 | 43 | 96 | 133 | 27 | 44 | 97 | 144 |
| 4 | 23 | 66 | 84 | 131 | 16 | 47 | 89 | 162 | |
| 5 | 12 | 148 | 51 | 111 | 15 | 110 | 42 | 119 | |
| 6 | 16 | 182 | 47 | 130 | 13 | 127 | 18 | 107 | |
| 7 | 13 | 192 | 55 | 172 | 7 | 121 | 24 | 133 | |
| DHSS 1969 (Wales) | 3 | 89 | 310 | 100 | 171 | 39 | 146 | 21 | 105 |
| 4 | 78 | 413 | 114 | 267 | 32 | 210 | 27 | 122 | |
| 5 | 56 | 556 | 90 | 284 | 18 | 256 | 19 | 138 | |
| 6 | 29 | 603 | 78 | 310 | 20 | 331 | 15 | 133 | |
| 7 | 17 | 640 | 53 | 266 | 14 | 346 | 5 | 130 | |
| Gray 2001b | 5 | 1465 | 2462 | 1903 | 2524 | 345 | 466 | 273 | 419 |
| Guo 1984 | 3 | 67 | 202 | 31 | 79 | 54 | 205 | 39 | 128 |
| 4 | 74 | 354 | 39 | 164 | 32 | 246 | 14 | 164 | |
| 5 | 61 | 589 | 47 | 345 | 18 | 218 | 19 | 387 | |
| 6 | 53 | 695 | 56 | 397 | 27 | 309 | 12 | 354 | |
| 7 | 41 | 399 | 21 | 240 | 29 | 335 | 11 | 352 | |
| 8 | 53 | 392 | 24 | 279 | 50 | 343 | 16 | 350 | |
| 8 | 278 | 392 | 204 | 279 | 273 | 343 | 104 | 350 | |
| Kunzel 1997 | 5 | 231 | 688 | 682 | 1306 | 39 | 172 | 192 | 597 |
| 8 | 117 | 2438 | 746 | 3020 | 40 | 777 | 61 | 1078 | |
| Note: Only data up to the age of 8 years included for the deciduous dentition a. Baseline data not available for ages 6 and 7 years b. Data from all fluoridated areas combined | |||||||||
| Study ID | Age | Fluoridated area | Non/low fluoridated area | ||||||
| B aseline (before/at initiation) | Follow‐up | Baseline | Follow‐up | ||||||
| n | N | n | N | n | N | n | N | ||
| ADRIASOLA 1959a | 8 | 21 | 493 | 11 | 458 | 17 | 223 | 2 | 226 |
| 12 | 7 | 292 | 8 | 419 | 3 | 197 | 9 | 211 | |
| BEAL 1981 | 8 | 77 | 189 | 115 | 167 | 56 | 163 | 82 | 186 |
| 12 | 51 | 192 | 41 | 189 | 13 | 188 | 14 | 197 | |
| BLINKHORN 2015 | 10 to 12 | 525 | 777 | 486 | 642 | 272 | 436 | 307 | 455 |
| BROWN 1960b | 9 to 11 | 34 | 595 | 220 | 502 | 35 | 571 | 42 | 521 |
| 12 to 14 | 7 | 593 | 94 | 503 | 3 | 486 | 11 | 485 | |
| DHSS 1969 (Eng) | 8 | 40 | 199 | 50 | 95 | 33 | 148 | 29 | 79 |
| 9 | 25 | 227 | 57 | 135 | 20 | 166 | 20 | 95 | |
| 10 | 13 | 134 | 36 | 115 | 14 | 160 | 10 | 80 | |
| 11 | 12 | 145 | 12 | 200 | 3 | 126 | 12 | 122 | |
| 12 | 3 | 111 | 20 | 134 | 0 | 51 | 4 | 99 | |
| 13 | 3 | 91 | 9 | 132 | 2 | 52 | 8 | 127 | |
| 14 | 0 | 70 | 4 | 90 | 2 | 36 | 9 | 180 | |
| DHSS 1969 (Wales) | 8 | 143 | 607 | 112 | 283 | 88 | 351 | 26 | 125 |
| 9 | 73 | 553 | 78 | 260 | 49 | 325 | 15 | 134 | |
| 10 | 63 | 502 | 44 | 241 | 25 | 308 | 8 | 133 | |
| 11 | 30 | 278 | 15 | 126 | 35 | 270 | 0 | 42 | |
| 12 | 15 | 186 | 10 | 108 | 27 | 265 | 2 | 108 | |
| 13 | 7 | 178 | 0 | 93 | 14 | 274 | 1 | 105 | |
| 14 | 8 | 158 | 3 | 93 | 15 | 243 | 1 | 96 | |
| Guo 1984 | 5 | 575 | 589 | 338 | 345 | 214 | 218 | 358 | 387 |
| 6 | 616 | 695 | 266 | 297 | 284 | 309 | 249 | 354 | |
| 7 | 305 | 399 | 189 | 240 | 272 | 335 | 162 | 352 | |
| 8 | 278 | 392 | 204 | 279 | 273 | 343 | 104 | 350 | |
| 9 | 242 | 388 | 167 | 275 | 195 | 310 | 98 | 352 | |
| 10 | 215 | 346 | 161 | 310 | 199 | 323 | 84 | 436 | |
| 11 | 213 | 330 | 133 | 307 | 245 | 451 | 65 | 365 | |
| 12 | 240 | 468 | 90 | 208 | 475 | 841 | 91 | 493 | |
| 13 | 227 | 469 | 88 | 232 | 434 | 801 | 77 | 504 | |
| 14 | 161 | 322 | 69 | 221 | 455 | 795 | 73 | 490 | |
| 15 | 78 | 164 | 11 | 38 | 66 | 121 | 11 | 63 | |
| Kunzel 1997 | 8 | 1021 | 2419 | 2147 | 3016 | 334 | 777 | 333 | 1076 |
| 12 | 120 | 1626 | 801 | 2426 | 42 | 563 | 50 | 925 | |
| 15 | 118 | 1995 | 249 | 1897 | 27 | 744 | 18 | 756 | |
| a. Baseline data not available for ages 11 and 15 years b. Data for 16‐17‐year olds presented but no N | |||||||||
| Study ID | Outcome | Age | Fluoride level | Assigned F level | Number of subjects | Proportion with outcome |
| Chen 1993 | Skeletal fluorosis | 16 to 65 | 5.5 | 5.5 | 28 | 82.1 |
| 3.1 | 3.1 | 114 | 71.1 | |||
| 0.4 | 0.4 | 50 | 46 | |||
| 3.1 | 3.1 | 50 | 86 | |||
| Wang 2012a | Skeletal fluorosis | ≥16 | 2.2 | 2.2 | 406,298 | 10.8 |
| 0.5 | 0.5 | 188,400 | 4.8 | |||
| Wenzel 1982b | Skeletal maturity | 12 to 14 | 2.4 | 2.4 | 122 | 0.59 (0.1)c |
| < 0.2 | 0.1 | 113 | 0.59 (0.09)c | |||
| Alarcon‐Herrera | Bone fracture | 6 to 12 | < 1.5 | 0.75 | 97 | 5.2 |
| 1.51‐4.99 | 3.25 | 112 | 8.9 | |||
| 5‐8.49 | 6.75 | 38 | 2.6 | |||
| 8.5‐11.99 | 10.25 | 27 | 11.1 | |||
| 12‐16 | 14 | 59 | 8.5 | |||
| 13 to 60 | < 1.5 | 0.75 | 192 | 3.1 | ||
| 1.51‐4.99 | 3.25 | 330 | 7.9 | |||
| 5‐8.49 | 6.75 | 146 | 8.9 | |||
| 8.5‐11.99 | 10.25 | 138 | 7.2 | |||
| 12‐16 | 14 | 96 | 6.3 | |||
| Jolly 1971b | Skeletal fluorosis | Not stated | 0.7 | 0.7 | Not stated | 3.6 |
| 1.4 | 1.4 | Not stated | 2.4 | |||
| 2.4 | 2.4 | Not stated | 17 | |||
| 2.4 | 2.4 | Not stated | 23 | |||
| 2.5 | 2.5 | Not stated | 33 | |||
| 3 | 3 | Not stated | 19.6 | |||
| 3 | 3 | Not stated | 42.2 | |||
| 3.3 | 3.3 | Not stated | 10 | |||
| 3.3 | 3.3 | Not stated | 45 | |||
| 3.6 | 3.6 | Not stated | 33.1 | |||
| 4.3 | 4.3 | Not stated | 19.4 | |||
| 5 | 5 | Not stated | 60 | |||
| 5.1 | 5.1 | Not stated | 44.5 | |||
| 5.5 | 5.5 | Not stated | 31.3 | |||
| 7 | 7 | Not stated | 47.4 | |||
| 8.5 | 8.5 | Not stated | 58.9 | |||
| 9.4 | 9.4 | Not stated | 70.1 | |||
| a. Participants were diagnosed on the basis of diagnostic criteria for endemic skeletal fluorosis (WS 192‐2008) b. Participants were examined radiologically c. Reported outcome was mean (standard error) skeletal maturity | ||||||
| Study ID | Age | Group | Measure | Social class | Baseline | Final | ||||||
| F level | N | % caries free | dmft (SD) | F level | N | % caries free | dmft (SD) | |||||
| Beal 1971a | 5 | Balsall Heath | Descriptive | Poor area | Low | 115 | 9 | 5.16 (0.44) | 1 | 132 | 48 | 1.94 (0.22) |
| Northfield | Industrial area | Low | 182 | 29 | 4.91 (0.36) | 1 | 182 | 41 | 2.45 (0.24) | |||
| Dudley | Industrial area | < 0.1 | 217 | 16 | 4.97 (0.28) | < 0.1 | 229 | 24 | 5.09 (0.32) | |||
| Gray 2000b | 5 | South east Staffordshire | Jarman score | ‐23.09 | Low | 3435 | 66 | 1.21 (0.59) | 1 | 3120 | 75 | 0.64 (1.46) |
| Sandwell | 18.1 | Low | 3950 | 51 | 1.93 (2.88) | 1 | 3598 | 69 | 0.83 (1.68) | |||
| Walsall | 1.67 | Low | 3120 | 54 | 1.85 (2.31) | 1 | 363 | 67 | 0.94 (1.77) | |||
| Dudley | ‐13.68 | Low | 3657 | 58 | 1.6 (2.54) | 1 | 3474 | 73 | 0.78 (1.75) | |||
| North Birmingham | 21.57 | Low | 1965 | 72 | 0.88 (1.97) | 1 | 1904 | 74 | 0.71 (1.65) | |||
| North Staffordshire | ‐3.59 | Low | 464 | 47 | 2.24 (3.04) | Low | 1947 | 59 | 1.49 (2.46) | |||
| Herefordshire | ‐13.01 | Low | 406 | 57 | 1.61 (2.55) | Low | 305 | 50 | 1.79 (2.68) | |||
| Shropshire | ‐12.34 | Low | 366 | 61 | 1.29 (2.22) | Low | 311 | 60 | 1.33 (2.33) | |||
| Kidderminster | ‐13.13 | Low | 904 | 58 | 1.74 (2.81) | Low | 1053 | 61 | 1.4 (2.52) | |||
| Holdcroft 1999b | Not stated | North Birmingham | Jarman score | ‐7.85 | Not stated | Not stated | 2.18 | High | Not stated | 0.68 | ||
| Sandwell | 15.03 | Not stated | Not stated | 2.55 | High | Not stated | 1.13 | |||||
| North Staffordshire | ‐4.07 | Not stated | Not stated | 2.24 | Not stated | Not stated | 1.48 | |||||
| Shropshire | ‐11.73 | Not stated | Not stated | 1.76 | Not stated | Not stated | 1.29 | |||||
| Herefordshire | ‐11.97 | Not stated | Not stated | 2.56 | Not stated | Not stated | 1.53 | |||||
| a. Caries data reported as deft (SE) b. Caries data reported as dmft (SD) | ||||||||||||
| WHO regions | DMFT |
| 2011 | |
| Africa | 1.19 |
| Americas | 2.35 |
| Eastern Mediteranean | 1.63 |
| Europe | 1.95 |
| South East Asia | 1.87 |
| Western Pacific | 1.39 |
| GLOBAL | 1.67 |
| http://www.mah.se/CAPP/Country‐Oral‐Health‐Profiles/According‐to‐Alphabetical/Global‐DMFT‐for‐12‐year‐olds‐2011/ | |
| Outcome or subgroup title | No. of studies | No. of participants | Statistical method | Effect size |
| 1 Change in decayed, missing or filled deciduous teeth (dmft) Show forest plot | 9 | 22134 | Mean Difference (IV, Random, 95% CI) | 1.81 [1.31, 2.31] |
| 1.1 Studies conducted in 1975 or earlier | 7 | 17039 | Mean Difference (IV, Random, 95% CI) | 1.82 [1.53, 2.11] |
| 1.2 Studies conducted after 1975 | 2 | 5095 | Mean Difference (IV, Random, 95% CI) | 1.56 [‐0.67, 3.80] |
| 2 Change in decayed, missing or filled permanent teeth (DMFT) Show forest plot | 10 | 39382 | Mean Difference (IV, Random, 95% CI) | 1.16 [0.72, 1.61] |
| 2.1 Studies conducted in 1975 or earlier | 7 | 30499 | Mean Difference (IV, Random, 95% CI) | 1.41 [0.84, 1.98] |
| 2.2 Studies conducted after 1975 | 3 | 8883 | Mean Difference (IV, Random, 95% CI) | 0.64 [‐0.27, 1.55] |
| 3 Change in proportion of caries free children (deciduous teeth) Show forest plot | 10 | 19983 | Mean Difference (IV, Random, 95% CI) | ‐0.15 [‐0.19, ‐0.11] |
| 3.1 Studies conducted in 1975 or earlier | 7 | 11902 | Mean Difference (IV, Random, 95% CI) | ‐0.17 [‐0.19, ‐0.15] |
| 3.2 Studies conducted after 1975 | 3 | 8081 | Mean Difference (IV, Random, 95% CI) | ‐0.12 [‐0.24, ‐0.01] |
| 4 Change in proportion of caries free children (permanent teeth) Show forest plot | 8 | 26769 | Mean Difference (IV, Random, 95% CI) | ‐0.14 [‐0.23, ‐0.05] |
| 4.1 Studies conducted in 1975 or earlier | 6 | 17459 | Mean Difference (IV, Random, 95% CI) | ‐0.13 [‐0.24, ‐0.03] |
| 4.2 Studies conducted after 1975 | 2 | 9310 | Mean Difference (IV, Random, 95% CI) | ‐0.17 [‐0.43, 0.10] |