Water fluoridation for the prevention of dental caries
Appendices
Appendix 1. Databases searched in the original systematic review (McDonagh 2000)
• MEDLINE
• EMBASE
• NTIS (National Technical Information Service)
• Biosis
• Current Contents Search (Science Citation Index and Social Science Citation Index)
• Healthstar (Health Service Technology, Administration and Research)
• HSRProj
• TOXLINE
• Chemical Abstracts
• OldMEDLINE
• CAB Health
• FSTA (Food Science and Technology Abstracts)
• JICST‐ E Plus (Japanese Science and Technology)
• Pascal
• EI Compendex (Engineering Index)
• Enviroline
• PAIS (Public Affairs Information Services)
• SIGLE (System for Information on Grey Literature in Europe)
• Conference Papers Index
• Water Resources Abstracts
• Agricola (Agricultural Online Access)
• Waternet
• AMED (Allied and Complementary Medicine Database)
• Psyclit
• LILACS (Latin American and Caribbean Health Sciences Literature)
Appendix 2. The Cochrane Oral Health Group Trials Register search strategy
#1 ((fluorid* or flurid* or fluorin* or flurin*))
#2 water*
#3 (#1 and #2)
Appendix 3. The Cochrane Central Register of Controlled Trials (CENTRAL) search strategy
#1 MeSH descriptor Fluoridation this term only
#2 MeSH descriptor Fluorides explode all trees
#3 MeSH descriptor Fluorine this term only
#4 (fluorid* in All Text or fluorin* in All Text or flurin* in All Text or flurid* in All Text)
#5 (#1 or #2 or #3 or #4)
#6 MeSH descriptor Dietary supplements this term only
#7 MeSH descriptor Water supply this term only
#8 water* in All Text
#9 (#6 or #7 or #8)
#10 MeSH descriptor Tooth demineralization explode all trees
#11 (caries in All Text or carious in All Text)
#12 (teeth in All Text and (cavit* in All Text or caries in All Text or carious in All Text or decay* in All Text or lesion* in All Text or deminerali* in All Text or reminerali* in All Text))
#13 (tooth in All Text and (cavit* in All Text or caries in All Text or carious in All Text or decay* in All Text or lesion* in All Text or deminerali* in All Text or reminerali* in All Text))
#14 (dental in All Text and (cavit* in All Text or caries in All Text or carious in All Text or decay* in All Text or lesion* in All Text or deminerali* in All Text or reminerali* in All Text))
#15 (enamel in All Text and (cavit* in All Text or caries in All Text or carious in All Text or decay* in All Text or lesion* in All Text or deminerali* in All Text or reminerali* in All Text))
#16 (dentin in All Text and (cavit* in All Text or caries in All Text or carious in All Text or decay* in All Text or lesion* in All Text or deminerali* in All Text or reminerali* in All Text))
#17 (root* in All Text and (cavit* in All Text or caries in All Text or carious in All Text or decay* in All Text or lesion* in All Text or deminerali* in All Text or reminerali* in All Text))
#18 MeSH descriptor Dental plaque this term only
#19 ((teeth in All Text or tooth in All Text or dental in All Text or enamel in All Text or dentin in All Text) and plaque in All Text)
#20 MeSH descriptor Dental health surveys explode all trees
#21 ("DMF Index" in All Text or "Dental Plaque Index" in All Text)
#22 (#10 or #11 or #12 or #13 or #14 or #15 or #16 or #17 or #18 or #19 or #21) #23 (#5 and #9 and #22)
Appendix 4. MEDLINE (OVID) search strategy
-
Fluoridation/
-
exp Fluorides/
-
Fluorine/
-
(fluorid$ or fluorin$ or flurin$ or flurid$).mp.
-
or/1‐4
-
Dietary supplements/
-
Water supply/
-
water$.mp.
-
or/6‐8
-
exp TOOTH DEMINERALIZATION/
-
(caries or carious).mp.
-
(teeth adj5 (cavit$ or caries$ or carious or decay$ or lesion$ or deminerali$ or reminerali$)).mp.
-
(tooth adj5 (cavit$ or caries$ or carious or decay$ or lesion$ or deminerali$ or reminerali$)).mp.
-
(dental adj5 (cavit$ or caries$ or carious or decay$ or lesion$ or deminerali$ or reminerali$)).mp.
-
(enamel adj5 (cavit$ or caries$ or carious or decay$ or lesion$ or deminerali$ or reminerali$)).mp.
-
(dentin$ adj5 (cavit$ or caries$ or carious or decay$ or lesion$ or deminerali$ or reminerali$)).mp.
-
(root$ adj5 (cavit$ or caries$ or carious or decay$ or lesion$ or deminerali$ or reminerali$)).mp.
-
Dental plaque/
-
((teeth or tooth or dental or enamel or dentin) and plaque).mp.
-
exp DENTAL HEALTH SURVEYS/
-
("DMF Index" or "Dental Plaque Index").mp.
-
or/10‐21
-
case reports.pt.
-
Comment/
-
Letter/
-
Editorial/
-
or/23‐26
-
exp animals/ not humans.sh.
-
5 and 9 and 22
-
29 not (28 or 27)
Appendix 5. EMBASE (OVID) search strategy
1. Fluoridation/
2. exp Fluoride/
3. Fluorine/
4. (fluorid$ or fluorin$ or flurin$ or flurid$).ti,ab.
5. or/1‐4
6. Diet supplementation/
7. Water supply/
8. water$.ti,ab.
9. or/6‐8
10. exp Dental caries/
11. (caries or carious).ti,ab.
12. (teeth adj5 (cavit$ or caries$ or carious or decay$ or lesion$ or deminerali$ or reminerali$)).ti,ab.
13. (tooth adj5 (cavit$ or caries$ or carious or decay$ or lesion$ or deminerali$ or reminerali$)).ti,ab.
14. (dental adj5 (cavit$ or caries$ or carious or decay$ or lesion$ or deminerali$ or reminerali$)).ti,ab.
15. (enamel adj5 (cavit$ or caries$ or carious or decay$ or lesion$ or deminerali$ or reminerali$)).ti,ab.
16. (dentin$ adj5 (cavit$ or caries$ or carious or decay$ or lesion$ or deminerali$ or reminerali$)).ti,ab.
17. (root$ adj5 (cavit$ or caries$ or carious or decay$ or lesion$ or deminerali$ or reminerali$)).ti,ab
18. Tooth plaque/
19. ((teeth or tooth or dental or enamel or dentin) and plaque).ti,ab.
20. ("DMF Index" or "Dental Plaque Index" or "dental health survey*").ti,ab.
21. or/10‐20
22. 9 and 21
23. (exp animal/ or animal.hw. or nonhuman/) not (exp human/ or human cell/ or (human or humans).ti.)
24. 22 not 23
Appendix 6. Proquest search strategy
ab(fluorid*) AND ab(water*) AND ab(caries OR carious OR dental OR tooth OR teeth OR plaque)
Appendix 7. Web of Science Conference Proceedings search strategy
#1 TS=(fluorid* or fluorin* or flurin* or flurid*)
#2 TS=water*
#3 TS=(caries or carious)
#4 TS=(teeth and (cavit* or caries* or carious or decay* or lesion* or deminerali* or reminerali*))
#5 TS=(tooth and (cavit* or caries* or carious or decay* or lesion* or deminerali* or reminerali*))
#6 TS=(dental and (cavit* or caries* or carious or decay* or lesion* or deminerali* or reminerali*))
#7 TS=(enamel and (cavit* or caries* or carious or decay* or lesion* or deminerali* or reminerali*))
#8 TS=(dentin* and (cavit* or caries* or carious or decay* or lesion* or deminerali* or reminerali*))
#9 TS=(root* and (cavit* or caries* or carious or decay* or lesion* or deminerali* or reminerali*))
#10 TS=((teeth or tooth or dental or enamel or dentin) and plaque)
#11 TS=("DMF Index" or "Dental Plaque Index")
#12 #3 or #4 or #5 or #6 or #7 or #8 or #9 or #10 or #11
#13 #1 and #2 and #12
Appendix 8. ZETOC Conference Proceedings search strategy
fluoride AND water AND caries
fluoridation AND water AND caries
fluoride AND water AND carious
fluoridation AND water AND carious
fluoride AND water AND dental
fluoridation AND water AND dental
fluoride AND water AND tooth
fluoridation AND water AND tooth
fluoride AND water AND teeth
fluoridation AND water AND teeth
Appendix 9. US National Institutes of Health Trials Registry and WHO International Clinical Trials Registry Platform search strategy
fluoride and water and caries
Appendix 10. Imputation of standard deviations for caries data
Where standard deviations are missing for the DMFT, dmft data we used the equation: log(SD) = 0.17 + 0.56 x log(mean) to estimate the standard deviations for both before and after mean caries values. A sensitivity analysis was undertaken omitting all the data for studies/age groups where the standard deviation was imputed.
The equation we used was obtained from the data we had available to us from the other included studies in the review (102 mean and standard deviation data points). The equation had a similar regression coefficient to those developed by van Rijkom 1996 and Marinho 2003b shown below, although the intercept was smaller. This is probably because both these models had been developed on caries increments whereas the data we have used is cross‐sectional caries severity data.
Equation from:
van Rijkom 1996 log(SD) = 0.54 + 0.58 x log(mean), (R² = 0.83)
Marinho 2003b log(SD) = 0.64 + 0.55 x log(mean), (R² = 0.77)
This review log(SD) = 0.17 + 0.55 x log(mean), (R² = 0.90)
Appendix 11. Fluorosis studies
Studies included in the analysis of all level of fluorosis:
Acharya 2005; Adair 1999; Al‐Alousi 1975; Alarcon‐Herrera 2001; Albrecht 2004; AlDosari 2010; Angelillo 1999; Arif 2013; Azcurra 1995; Beltran‐Aguilar 2002; Booth 1991; Brothwell 1999; Chandrashekar 2004; Chen 1989; Chen 1993; Clark 1993; Clarkson 1989; Cochran 2004a; Correia Sampaio 1999; Cutress 1985; Driscoll 1983; Ekanayake 2002; Eklund 1987; Ellwood 1995; Ellwood 1996; Firempong 2013; Forrest 1965; Garcia‐Perez 2013; Gaspar 1995; Grimaldo 1995; Grobler 1986; Grobler 2001; Haavikko 1974; Heintze 1998; Heller 1997; Hernandez‐Montoya 2003; Hong 1990; Ibrahim 1995; Indermitte 2007; Indermitte 2009; Ismail 1990; Jackson 1975; Jackson 1999; Kanagaratnam 2009; Kotecha 2012; Kumar 2007; Kunzel 1976; Leverett 1986; Levine 1989; Lin 1991; Louw 2002; Machiulskiene 2009; Mackay 2005; Macpherson 2007; Mandinic 2009; Marya 2010; Masztalerz 1990; McGrady 2012; McInnes 1982; Mella 1992; Mella 1994; Milsom 1990; Montero 2007; Nanda 1974; Narbutaite 2007; Narwaria 2013; Nunn 1994a; Ockerse 1941; Pontigo‐Loyola 2008; Ray 1982; Riordan 1991; Riordan 2002; Rwenyonyi 1998; Rwenyonyi 1999; Saravanan 2008; Sellman 1957; Shekar 2012; Stephen 2002; Szpunar 1988; Tabari 2000; Tsutsui 2000; Wang 1993; Wang 1999; Wang 2012; Warnakulasuriya 1992; Warren 2001; Wenzel 1982; Wondwossen 2004; Zheng 1986; Zimmermann 1954
Studies included in the analysis of fluorosis of aesthetic concern:
Acharya 2005; Alarcon‐Herrera 2001; AlDosari 2010; Angelillo 1999; Arif 2013; Beltran‐Aguilar 2002; Chen 1989; Clark 1993; Correia Sampaio 1999; Driscoll 1983; Eklund 1987; Forrest 1965; Gaspar 1995; Grimaldo 1995; Grobler 1986; Grobler 2001; Haavikko 1974; Heller 1997; Hernandez‐Montoya 2003; Hong 1990; Ibrahim 1995; Jackson 1999; Kunzel 1976; Leverett 1986; Louw 2002; Macpherson 2007; McGrady 2012; Mella 1992; Mella 1994; Montero 2007; Nanda 1974; Pontigo‐Loyola 2008; Ray 1982; Riordan 1991; Riordan 2002; Ruan 2005; Russell 1951; Sellman 1957; Stephen 2002; Tabari 2000; Zheng 1986; Zimmermann 1954
Studies that could not be included in analysis:
Awadia 2000; Bao 2007; Baskaradoss 2008; Birkeland 2005; Butler 1985; Chen 1993; Clarkson 1992; Colquhoun 1984; Cypriano 2003; de Crousaz 1982; Downer 1994; Driscoll 1983; Ermis 2003; Forrest 1956; Franzolin 2008; Harding 2005; Heifetz 1988; Jolly 1971; Kumar 1999; Mandinic 2010; Mazzotti 1939; Rugg‐Gunn 1997; Scheinin 1964; Segreto 1984; Selwitz 1995; Selwitz 1998; Shanthi 2014; Skinner 2013; Skotowski 1995; Spadaro 1955; Sudhir 2009; Venkateswarlu 1952; Vilasrao 2014; Villa 1998; Vignarajah 1993; Vuhahula 2009; Whelton 2004; Whelton 2006
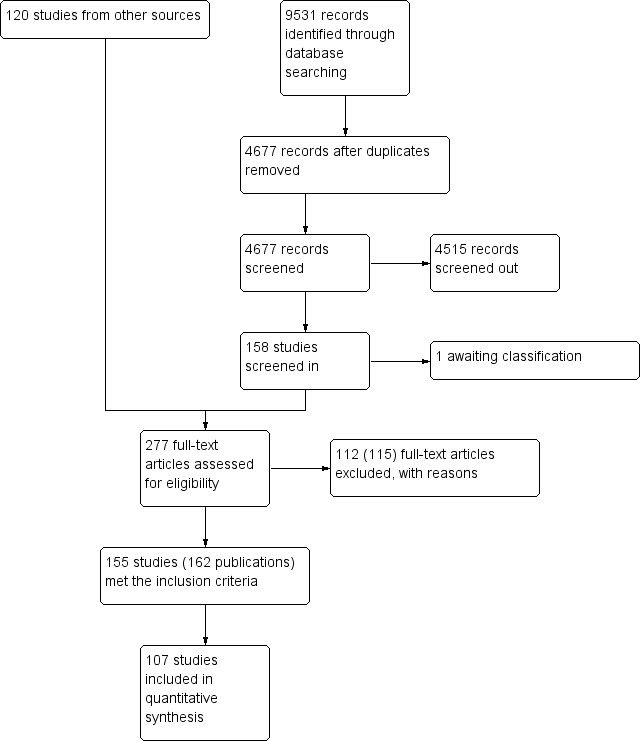
Figure 1. Study flow diagram.

Risk of bias summary: review authors' judgements about each risk of bias item for each included study.

Initiation of water fluoridation compared with low/non‐fluoridated water: change in dmft
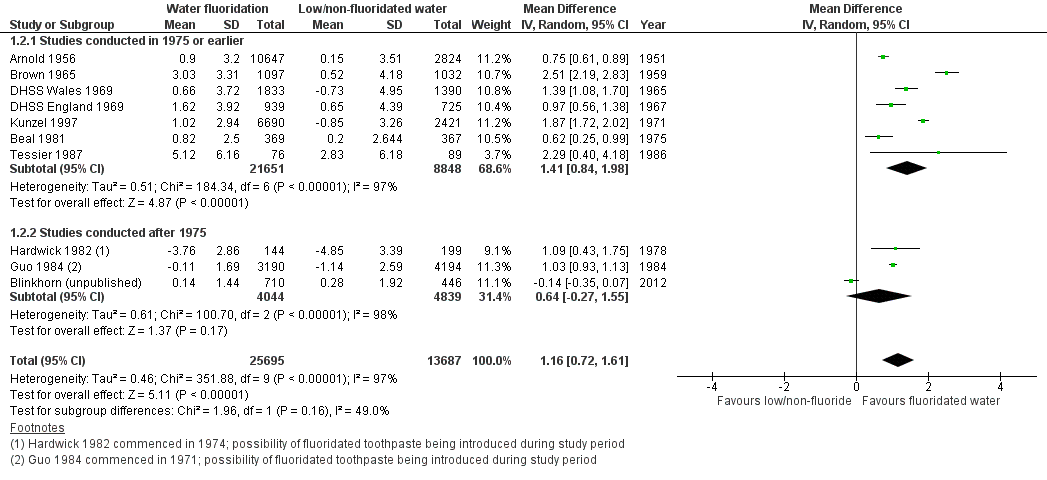
Initiation of water fluoridation compared with low/non‐fluoridated water: change in DMFT

Initiation of water fluoridation compared with low/non‐fluoridated water: change in proportion of caries‐free children (deciduous teeth)

Initiation of water fluoridation compared with low/non‐fluoridated water: change in proportion of caries‐free children (permanent teeth)
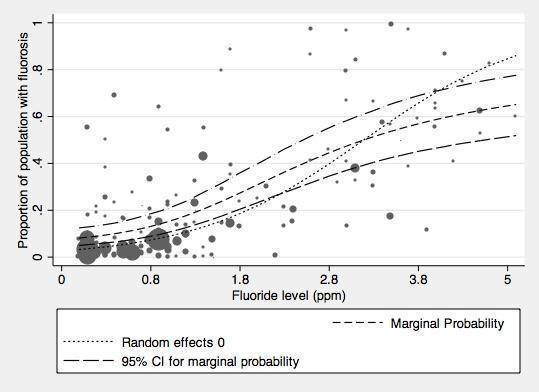
Proportion of the population with dental fluorosis of aesthetic concern by water fluoride level together with 95% confidence limits for the proportion (studies reporting up to and including 5ppm).

Proportion of the population with dental fluorosis of any level by water fluoride level together with 95% confidence limits for the proportion (studies reporting up to and including 5ppm F)

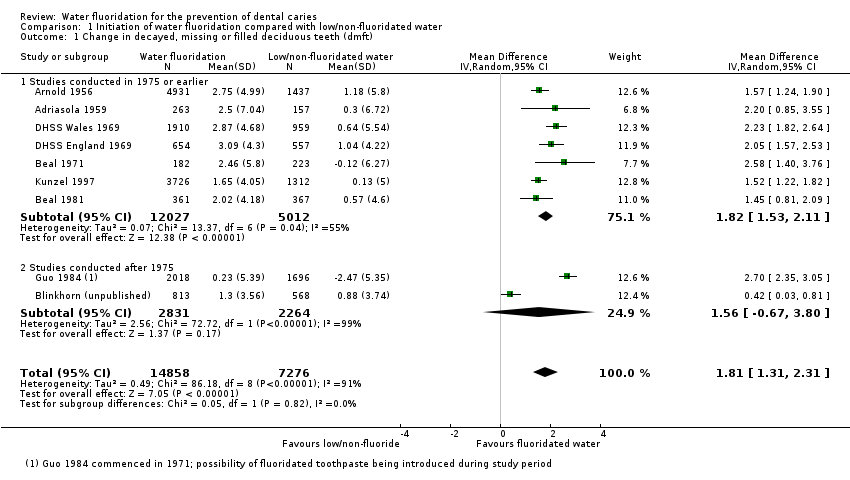
Comparison 1 Initiation of water fluoridation compared with low/non‐fluoridated water, Outcome 1 Change in decayed, missing or filled deciduous teeth (dmft).

Comparison 1 Initiation of water fluoridation compared with low/non‐fluoridated water, Outcome 2 Change in decayed, missing or filled permanent teeth (DMFT).
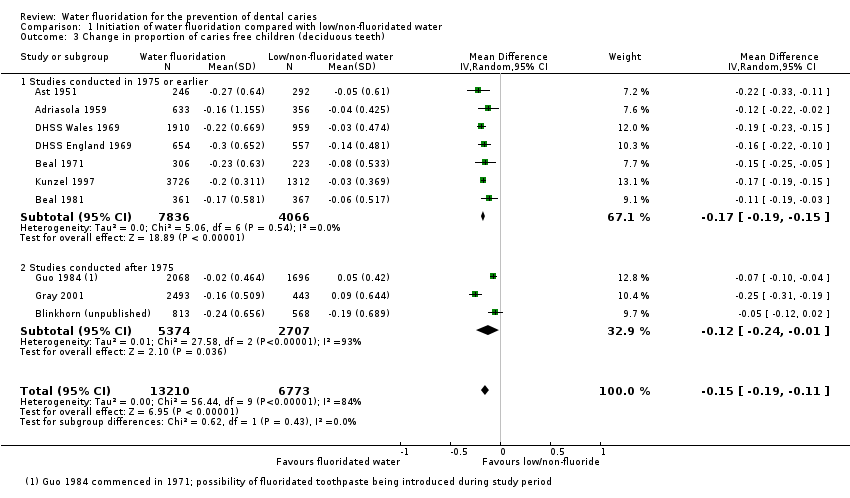
Comparison 1 Initiation of water fluoridation compared with low/non‐fluoridated water, Outcome 3 Change in proportion of caries free children (deciduous teeth).

Comparison 1 Initiation of water fluoridation compared with low/non‐fluoridated water, Outcome 4 Change in proportion of caries free children (permanent teeth).
| Initiation of water fluoridation compared with low/non‐fluoridated water for the prevention of dental caries | ||||||
| Patient or population: people of all ages Settings: community setting Intervention: initiation of water fluoridation Comparison: low/non‐fluoridated water | ||||||
| Outcomes | Illustrative comparative risks* (95% CI) | Relative effect | No of participants | Quality of the evidence | Comments | |
| Risk in area with low/non‐fluoridated water | Risk in area with initiation of water fluoridation | |||||
| Caries in deciduous teeth (dmft)1 Scale from: 0 to 20 (lower = better) Follow‐up: range from 3‐12 years | The mean dmft at follow‐up in the low/non‐fluoridated areas ranged from 1.21 to 7.8 (median 5.1) | The mean dmft in the areas with water fluoridation was 1.81 lower (1.31 lower to 2.31 lower) | 44,2682 (9 observational studies) | ⊕⊕⊝⊝3,4,5,6 | This indicates a reduction in dmft of 35% in the water fluoridation groups over and above that for the control groups We have limited confidence in the size of this effect due to the high risk of bias within the studies and the lack of contemporary evidence | |
| Caries score in permanent teeth (DMFT)7 Scale from: 0 to 32 (lower better) Follow‐up: range from 8‐11 years | The mean DMFT at follow‐up in the low/non‐fluoridated areas ranged from 0.7 to 5.5 (median 4.4) | The mean DMFT in the areas with water fluoridation was 1.16 lower (0.72 lower to 1.61 lower) | 78,7642 (10 observational studies) | ⊕⊕⊝⊝3,4,5,6 | This indicates a reduction in DMFT of 26% in the water fluoridation groups over and above that for the control groups We have limited confidence in the size of this effect due to the high risk of bias within the studies and the lack of contemporary evidence | |
| Change in proportion of caries‐free children (deciduous teeth) Scale: 0 to 1 Follow‐up: range 3‐12 years | The proportion of caries‐free children at follow‐up in the low/non‐fluoridated areas ranged from 0.06 to 0.67 (median 0.22) | The proportion of caries‐free children increased in the areas with water fluoridation 0.15 (0.11 to 0.19) | 39,9662 (10 observational studies) | ⊕⊕⊝⊝3,4,5,6 | We have limited confidence in the size of this effect due to the high risk of bias within the studies and the lack of contemporary evidence | |
| Change in proportion of caries‐free children (permanent teeth) Scale: 0 to 1 Follow‐up: range 8‐12 years | The proportion of caries‐free children at follow‐up in the low/non‐fluoridated areas ranged from 0.01 to 0.67 (median 0.14) | The proportion of caries‐free children increased in the areas with water fluoridation 0.14 (0.05 to 0.23) | 53,5382 (8 observational studies) | ⊕⊕⊝⊝3,4,5,6 | We have limited confidence in the size of this effect due to the high risk of bias within the studies and the lack of contemporary evidence. | |
| Disparities in caries by socioeconomic status (SES)8 | > 35,3999 (3 observational studies) | ⊕⊕⊝⊝3 | There is insufficient information to determine whether initiation of a water fluoridation programme results in a change in disparities in caries levels across SES | |||
| Adverse effects Dental fluorosis of aesthetic concern10 (measured by Dean's Index, TFI, TSIF)11 | For a fluoride level of 0.7 ppm the percentage of participants with dental fluorosis of aesthetic concern was estimated to be 12% (95% CI 8% to 17%). Controlling for study effects, we would expect the odds of dental fluorosis to increase by a factor of 2.90 (95% CI 2.05 to 4.10) for each one unit increase in fluoride level (1 ppm F). | 59,630 (40 observational studies) | ⊕⊕⊝⊝3,12 | The estimate for any level of dental fluorosis at 0.7ppm was 40% (95% CI 35% to 44%; 90 studies). This includes dental fluorosis that can only be detected under clinical conditions and other enamel defects We have limited confidence in the size of this effect due to the high risk of bias and substantial between‐study variation. | ||
| ⊕⊕⊕⊕: We are very confident that the true effect lies close to that of the estimate of the effect. Further research is very unlikely to change the estimate of effect. | ||||||
|
| ||||||
| Cessation of water fluoridation compared with fluoridated water for the prevention of dental caries | |||
| Patient or population: people of all ages Settings: community setting Intervention: cessation of water fluoridation Comparison: fluoridated water | |||
| Outcomes | No of participants | Quality of the evidence | Comments |
| Caries in permanent teeth (DMFS)1 Follow‐up: 3 years | 92492 (1 observational study) | ⊕⊝⊝⊝ 3 | Insufficient evidence to determine the effect of the cessation of water fluoridation on caries |
| Caries in deciduous teeth (dmft/dmfs)4 | No evidence to determine the effect of the cessation of water fluoridation on caries | ||
| Change in proportion of caries‐free children (deciduous or permanent teeth) | No evidence to determine the effect of the cessation of water fluoridation on caries | ||
| Disparities in caries by socioeconomic status (SES)5 | No evidence to determine the effect of the cessation of water fluoridation on disparities | ||
| Adverse effects | No evidence to determine whether cessation of a water fluoridation programme is associated with any harms | ||
| ⊕⊕⊕⊕: We are very confident that the true effect lies close to that of the estimate of the effect. Further research is very unlikely to change the estimate of effect. | |||
|
| |||
| Study ID | Age | Fluoridated area | Non/low fluoridated area | |||||||||||
| Baseline (before/at initiation) | Follow‐up | Baseline | Follow‐up | |||||||||||
| MEAN | SD | N | MEAN | SD | N | MEAN | SD | N | MEAN | SD | N | |||
| ADRIASOLA 1959 | 5 | 8.9 | 5.03 | 186 | 6.4 | 4.18 | 340 | 8.1 | 4.77 | 174 | 7.8 | 4.67 | 140 | |
| 5 | Mean (SD) change in dmft: 2.5 (7.04) | Mean (SD) change in dmft: 0.3 (6.72) | ||||||||||||
| ARNOLD 1956a | 4 | 4.19 | 3.30 | 323 | 2.13 | 2.26 | 168 | 5.05 | 3.66 | 20 | 4.46 | 3.42 | 63 | |
| 5 | 5.37 | 3.79 | 1633 | 2.27 | 2.34 | 853 | 6.82 | 4.33 | 402 | 5.25 | 3.74 | 351 | ||
| 6 | 6.43 | 4.19 | 1789 | 2.98 | 2.73 | 750 | 7.17 | 4.46 | 462 | 5.67 | 3.91 | 294 | ||
| 7 | 6.29 | 4.14 | 1806 | 4.03 | 3.23 | 423 | 6.66 | 4.28 | 408 | 5.77 | 3.95 | 223 | ||
| 8 | 5.78 | 3.95 | 1647 | 4.12 | 3.27 | 470 | 6.06 | 4.06 | 376 | 5.32 | 3.77 | 275 | ||
| 4‐8 | Mean (SD) change in dmft: 2.75 (4.99) | Mean (SD) change in dmft: 1.18 (5.8) | ||||||||||||
| BEAL 1971 | 5 | 4.91 | 4.86 | 182 | 2.45 | 3.24 | 182 | 4.97 | 4.12 | 217 | 5.09 | 4.84 | 229 | |
| 5 | Mean (SD) change in dmft: 2.46 (5.8) | Mean (SD) change in dmft: ‐0.12 (6.27) | ||||||||||||
| BEAL 1981 | 5 | 4.29 | 3.50 | 196 | 1.8 | 2.48 | 170 | 4.28 | 3.58 | 205 | 3.49 | 3.62 | 180 | |
| 8 | 5 | 2.89 | 189 | 3.42 | 2.84 | 167 | 5.36 | 3.06 | 163 | 4.97 | 3.00 | 186 | ||
| 5/8 | Mean (SD) change in dmft: 2.02 (4.18) | Mean (SD) change in dmft: 0.57 (4.6) | ||||||||||||
| BLINKHORN 2015 | 5‐7 | 2.02 | 3.13 | 781 | 0.72 | 1.63 | 844 | 2.09 | 2.91 | 523 | 1.21 | 2.27 | 612 | |
| 5‐7 | Mean (SD) change in dmft: 1.3 (3.56) | Mean (SD) change in dmft: 0.88 (3.74) | ||||||||||||
| DHSS 1969 (Eng)a | 3 | 2.7 | 2.58 | 43 | 0.6 | 1.11 | 133 | 1.4 | 1.79 | 44 | 1.2 | 1.64 | 144 | |
| 4 | 3.6 | 3.03 | 66 | 1.3 | 1.71 | 131 | 2.6 | 2.53 | 47 | 1.8 | 2.06 | 162 | ||
| 5 | 5.4 | 3.80 | 148 | 1.6 | 1.92 | 111 | 5 | 3.64 | 110 | 2.8 | 2.63 | 119 | ||
| 6 | 5.7 | 3.92 | 182 | 2.5 | 2.47 | 130 | 5.4 | 3.80 | 127 | 4.1 | 3.26 | 107 | ||
| 7 | 6.4 | 4.18 | 192 | 2.7 | 2.58 | 172 | 6 | 4.03 | 121 | 4.3 | 3.35 | 133 | ||
| 3‐7 | Mean (SD) change in dmft: 3.09 (4.3) | Mean (SD) change in dmft: 1.04 (4.22) | ||||||||||||
| DHSS 1969 (Wales)a,b | 3 | 3.9 | 3.17 | 310 | 1.4 | 1.79 | 171 | 4 | 3.21 | 146 | 3.3 | 2.89 | 105 | |
| 4 | 5.54 | 3.86 | 413 | 2.6 | 2.53 | 267 | 5.8 | 3.96 | 210 | 4.8 | 3.56 | 122 | ||
| 5 | 5.5 | 3.84 | 556 | 2.9 | 2.69 | 284 | 5.5 | 3.84 | 256 | 4.8 | 3.56 | 138 | ||
| 6 | 6.3 | 4.15 | 603 | 3.1 | 2.79 | 310 | 6.2 | 4.11 | 331 | 5.9 | 4.00 | 133 | ||
| 7 | 6.85 | 4.35 | 640 | 3.65 | 3.05 | 266 | 7.3 | 4.50 | 346 | 6.8 | 4.33 | 130 | ||
| 3‐7 | Mean (SD) change in dmft: 2.87 (4.68) | Mean (SD) change in dmft: 0.64 (5.54) | ||||||||||||
| GUO 1984 | 3 | 3 | 3.4 | 202 | 2.6 | 3.3 | 79 | 1.3 | 3.2 | 205 | 3.7 | 3.9 | 128 | |
| 4 | 4.6 | 4 | 354 | 4.5 | 4.7 | 164 | 5.6 | 4.6 | 246 | 7.1 | 4.6 | 164 | ||
| 5 | 6.5 | 4.4 | 589 | 5.5 | 4.3 | 345 | 6.4 | 4.2 | 218 | 8.5 | 4.6 | 387 | ||
| 6 | 6.7 | 4.4 | 695 | 6.2 | 4.8 | 297 | 5.8 | 4.2 | 309 | 9 | 4.3 | 354 | ||
| 7 | 5.5 | 3.7 | 399 | 5.6 | 3.7 | 240 | 5.4 | 3.7 | 335 | 7.9 | 3.6 | 352 | ||
| 8 | 4.2 | 3 | 392 | 4.4 | 2.9 | 279 | 3.5 | 2.7 | 343 | 6 | 3.1 | 350 | ||
| 3‐8 | Mean (SD) change in dmft: 0.23 (5.39) | Mean (SD) change in dmft: ‐2.47 (5.35) | ||||||||||||
| KUNZEL 1992a | 5 | 2.4 | 2.415006452 | 688 | 1.4 | 1.7857954 | 1306 | 3.3 | 2.886475039 | 172 | 2.9 | 2.684991275 | 597 | |
| 8 | 4.9 | 3.601718817 | 2438 | 2.8 | 2.632743187 | 3020 | 4.9 | 3.601718817 | 777 | 4.9 | 3.601718817 | 1078 | ||
| 5‐8 | Mean (SD) change in dmft: 2.1 (5.01) | Mean (SD) change in dmft: 0.13 (5.0) | ||||||||||||
| Note: Only data up to the age of 8 years included for the deciduous dentition a. Imputed standard deviation b. 2 fluoridated areas combined | ||||||||||||||
| Study ID | Age | FLuoridated area | Non/low fluoridated area | |||||||||||
| B aseline (before/at initiation) | Follow‐up | Baseline | Follow‐up | |||||||||||
| MEAN | SD | N | MEAN | SD | N | MEAN | SD | N | MEAN | SD | N | |||
| ARNOLD 1956a | 6 | 0.78 | 1.29 | 1789 | 0.26 | 0.70 | 750 | 0.81 | 1.31 | 462 | 0.8 | 1.31 | 294 | |
| 7 | 1.89 | 2.11 | 1806 | 0.84 | 1.34 | 423 | 1.99 | 2.17 | 408 | 1.88 | 2.11 | 223 | ||
| 8 | 2.95 | 2.71 | 1647 | 1.58 | 1.91 | 470 | 2.81 | 2.64 | 376 | 2.63 | 2.54 | 275 | ||
| 9 | 3.9 | 3.17 | 1639 | 2.04 | 2.21 | 582 | 3.81 | 3.13 | 357 | 3.52 | 2.99 | 277 | ||
| 10 | 4.92 | 3.61 | 1626 | 2.93 | 2.70 | 141 | 4.91 | 3.61 | 359 | 4.32 | 3.36 | 62 | ||
| 11 | 6.41 | 4.19 | 1556 | 3.67 | 3.06 | 151 | 6.32 | 4.15 | 293 | 5.34 | 3.78 | 139 | ||
| 12 | 8.07 | 4.76 | 1685 | 5.89 | 3.99 | 176 | 8.66 | 4.95 | 328 | 7.71 | 4.64 | 48 | ||
| 13 | 9.73 | 5.29 | 1668 | 6.6 | 4.26 | 497 | 9.98 | 5.36 | 377 | 9.36 | 5.18 | 225 | ||
| 14 | 10.95 | 5.65 | 1690 | 8.21 | 4.81 | 128 | 12 | 5.95 | 369 | 11.36 | 5.77 | 59 | ||
| 15 | 12.48 | 6.08 | 1511 | 8.91 | 5.03 | 53 | 12.86 | 6.18 | 292 | 12.38 | 6.05 | 21 | ||
| 16 | 13.5 | 6.35 | 1107 | 11.06 | 5.68 | 198 | 14.07 | 6.50 | 248 | 13.16 | 6.26 | 155 | ||
| 6‐16 | Mean (SD) change in DMFT: 0.90 (3.20) | Mean (SD) change in DMFT: 0.15 (3.51) | ||||||||||||
| BEAL 1981 | 8 | 1.48 | 1.51 | 189 | 0.65 | 1.16 | 167 | 1.55 | 1.40 | 163 | 1.34 | 1.50 | 186 | |
| 12 | 3.53 | 3.32 | 192 | 2.74 | 2.33 | 189 | 4.28 | 2.47 | 188 | 4.11 | 2.95 | 197 | ||
| 8/12 | Mean (SD) change in DMFT: 0.82 (2.50) | Mean (SD) change in DMFT: 0.20 (2.64) | ||||||||||||
| BLINKHORN 2015a | 0.59 | 1.10 | 777 | 0.45 | 0.95 | 642 | 0.99 | 1.47 | 436 | 0.72 | 1.23 | 455 | ||
| Mean (SD) change in DMFT: 0.14 (1.44) | Mean (SD) change in DMFT: 0.28 (1.92) | |||||||||||||
| BROWN 1960 | 9‐11 | 4.07 | 2.20 | 595 | 1.52 | 1.80 | 502 | 4.21 | 2.63 | 571 | 3.68 | 2.35 | 521 | |
| 12‐14 | 7.68 | 3.90 | 593 | 3.23 | 2.92 | 503 | 7.94 | 4.41 | 486 | 7.46 | 4.40 | 485 | ||
| 9‐14 | Mean (SD) change in DMFT: 3.03 (3.31) | Mean (SD) change in DMFT: 0.52 (4.18) | ||||||||||||
| DHSS 1969 (Eng)a | 8 | 2.4 | 2.42 | 199 | 1.08 | 1.54 | 95 | 2.4 | 2.42 | 148 | 1.85 | 2.09 | 79 | |
| 9 | 3.1 | 2.79 | 227 | 1.5 | 1.86 | 135 | 2.9 | 2.68 | 166 | 2.4 | 2.42 | 95 | ||
| 10 | 3.6 | 3.03 | 134 | 2 | 2.18 | 115 | 3.8 | 3.12 | 160 | 3.1 | 2.79 | 80 | ||
| 11 | 4.6 | 3.48 | 145 | 3 | 2.74 | 200 | 4.7 | 3.52 | 126 | 3.9 | 3.17 | 122 | ||
| 12 | 5.6 | 3.88 | 111 | 3.52 | 2.99 | 134 | 6.1 | 4.07 | 51 | 4.99 | 3.64 | 99 | ||
| 13 | 7.1 | 4.43 | 91 | 4.9 | 3.60 | 132 | 6.6 | 4.26 | 52 | 6.1 | 4.07 | 127 | ||
| 14 | 8.4 | 4.87 | 70 | 5.77 | 3.95 | 90 | 7.9 | 4.71 | 36 | 6.74 | 4.31 | 108 | ||
| 8‐14 | Mean (SD) change in DMFT: 1.62 (3.92) | Mean (SD) change in DMFT: 0.65 (4.39) | ||||||||||||
| DHSS 1969 (Wales)a,b | 8 | 2.00 | 2.18 | 607 | 1.31 | 1.72 | 283 | 1.95 | 2.15 | 351 | 2.16 | 2.28 | 125 | |
| 9 | 2.65 | 2.55 | 553 | 1.98 | 2.17 | 260 | 2.6 | 2.53 | 325 | 2.9 | 2.68 | 134 | ||
| 10 | 3.35 | 2.91 | 502 | 2.59 | 2.52 | 241 | 3.2 | 2.84 | 308 | 3.6 | 3.03 | 133 | ||
| 11 | 3.83 | 3.14 | 278 | 2.99 | 2.73 | 126 | 3.3 | 2.89 | 270 | 4.1 | 3.26 | 42 | ||
| 12 | 4.65 | 3.50 | 186 | 4.38 | 3.38 | 108 | 3.95 | 3.19 | 265 | 6.16 | 4.09 | 108 | ||
| 13 | 6 | 4.03 | 178 | 5.9 | 4.00 | 93 | 5.2 | 3.72 | 274 | 7.6 | 4.61 | 105 | ||
| 14 | 6.95 | 4.38 | 158 | 6.73 | 4.30 | 93 | 5.6 | 3.88 | 243 | 7.64 | 4.62 | 96 | ||
| 8‐14 | Mean (SD) change in DMFT: 0.66 (3.72) | Mean (SD) change in DMFT: ‐0.73 (4.95) | ||||||||||||
| GUO 1984 | 6 | 0.2 | 0.6 | 695 | 0.2 | 0.5 | 297 | 0.1 | 0.4 | 309 | 0.5 | 0.9 | 354 | |
| 7 | 0.4 | 0.8 | 399 | 0.4 | 0.9 | 240 | 0.3 | 0.7 | 335 | 1.2 | 1.4 | 352 | ||
| 8 | 0.5 | 1 | 392 | 0.5 | 1 | 279 | 0.4 | 0.8 | 343 | 1.6 | 1.5 | 350 | ||
| 9 | 0.7 | 1.1 | 388 | 0.8 | 1.4 | 275 | 0.7 | 1.1 | 310 | 2.2 | 2 | 352 | ||
| 10 | 0.7 | 1.3 | 346 | 1.1 | 1.5 | 310 | 0.8 | 1.5 | 323 | 2.4 | 2 | 436 | ||
| 11 | 0.8 | 1.5 | 330 | 1.6 | 1.9 | 307 | 0.9 | 1.4 | 451 | 3 | 2.7 | 365 | ||
| 12 | 1.1 | 1.7 | 468 | 1.7 | 2.4 | 208 | 0.9 | 1.5 | 841 | 3.4 | 3 | 493 | ||
| 13 | 1.4 | 2 | 469 | 2.1 | 2.9 | 232 | 1.2 | 1.6 | 801 | 3.8 | 3.3 | 504 | ||
| 14 | 1.2 | 1.8 | 322 | 2.6 | 2.9 | 221 | 1 | 1.5 | 795 | 4.4 | 3.8 | 490 | ||
| 15 | 1.7 | 2.5 | 164 | 2.2 | 2.3 | 38 | 1.2 | 1.7 | 121 | 4.2 | 4 | 63 | ||
| 6‐15 | Mean (SD) change in DMFT: ‐0.11 (1.69) | Mean (SD) change in DMFT: ‐1.14 (2.59) | ||||||||||||
| HARDWICK 1982 | 12 | Mean (SD) increment in DMFT: ‐3.76 (2.86) | Mean (SD) increment in DMFT: ‐4.85 (3.39) | |||||||||||
| KUNZEL 1997c,d | 6 | 0.3 | 0.7 | 0.2 | 0.5 | 0.8 | 0.4 | 0.89 | ||||||
| 7 | 0.7 | 1.1 | 0.3 | 0.9 | 1.2 | 1 | 1.48 | |||||||
| 8 | 1.3 | 1.4 | 2419 | 0.5 | 1.00 | 3016 | 1.3 | 1.4 | 777 | 1.8 | 2.06 | 1076 | ||
| 9 | 1.9 | 1.5 | 0.9 | 1.8 | 1.6 | 2.4 | 2.42 | |||||||
| 10 | 2.4 | 1.8 | 1.2 | 2.4 | 1.8 | 3.2 | 2.84 | |||||||
| 11 | 3 | 2 | 1.6 | 2.8 | 1.8 | 3.9 | 3.17 | |||||||
| 12 | 3.7 | 2.3 | 1626 | 2 | 2.18 | 2426 | 3.5 | 2.1 | 563 | 4.8 | 3.56 | 925 | ||
| 13 | 4.3 | 2.7 | 2.6 | 4.1 | 2.6 | 5.5 | 3.84 | |||||||
| 14 | 5.3 | 3.1 | 3.4 | 4.7 | 2.5 | 6.5 | 4.22 | |||||||
| 15 | 5.8 | 3.5 | 1995 | 4 | 3.22 | 1897 | 5.2 | 3.1 | 744 | 7.4 | 4.54 | 756 | ||
| 8/12/15 | Mean (SD) change in DMFT: 1.02 (2.94) | Mean (SD) change in DMFT: ‐0.85 (3.26) | ||||||||||||
| LOH 1996 | 1.6 | 1.8 | 2 | 1.9 | 3.1 | |||||||||
| 4.4 | 2.1 | 3.7 | 4.5 | |||||||||||
| Insufficient data to include in further analysis | ||||||||||||||
| TESSIER 1987a | 6‐7 | 8.28 | 56 | 3.16 | 96 | 8.23 | 85 | 5.4 | 93 | |||||
| 6‐7 | Mean (SD) change in DMFT: 5.12 (6.16) | Mean (SD) change in DMFT: 2.83 (6.18) | ||||||||||||
| a. Imputed standard deviation b. 2 fluoridated areas combined c. Imputed standard deviation for follow‐up data only d. N values only available for ages 8, 12 and 15 years | ||||||||||||||
| Study ID | Age | Fluoridated area | Non/low fluoridated area | ||||||
| Baseline (before/at initiation) | Follow‐up | Baseline | Follow‐up | ||||||
| n | N | n | N | n | N | n | N | ||
| Adriasola 1959a | 3 | 26 | 151 | 82 | 216 | 9 | 77 | 26 | 135 |
| 4 | 12 | 156 | 55 | 216 | 11 | 76 | 11 | 110 | |
| 5 | 4 | 186 | 45 | 340 | 7 | 174 | 14 | 140 | |
| 8 | 21 | 493 | 11 | 458 | 17 | 223 | 2 | 226 | |
| Ast 1951 | 5 | 63 | 274 | 108 | 217 | 73 | 259 | 107 | 324 |
| Beal 1971b | 5 | 62 | 297 | 138 | 314 | 35 | 217 | 55 | 229 |
| Beal 1981 | 5 | 41 | 196 | 78 | 170 | 43 | 205 | 54 | 180 |
| 8 | 18 | 189 | 31 | 167 | 12 | 163 | 18 | 186 | |
| Blinkhorn 2015 | 5‐7 | 397 | 781 | 632 | 844 | 254 | 523 | 412 | 612 |
| DHSS 1969 (Eng) | 3 | 16 | 43 | 96 | 133 | 27 | 44 | 97 | 144 |
| 4 | 23 | 66 | 84 | 131 | 16 | 47 | 89 | 162 | |
| 5 | 12 | 148 | 51 | 111 | 15 | 110 | 42 | 119 | |
| 6 | 16 | 182 | 47 | 130 | 13 | 127 | 18 | 107 | |
| 7 | 13 | 192 | 55 | 172 | 7 | 121 | 24 | 133 | |
| DHSS 1969 (Wales) | 3 | 89 | 310 | 100 | 171 | 39 | 146 | 21 | 105 |
| 4 | 78 | 413 | 114 | 267 | 32 | 210 | 27 | 122 | |
| 5 | 56 | 556 | 90 | 284 | 18 | 256 | 19 | 138 | |
| 6 | 29 | 603 | 78 | 310 | 20 | 331 | 15 | 133 | |
| 7 | 17 | 640 | 53 | 266 | 14 | 346 | 5 | 130 | |
| Gray 2001b | 5 | 1465 | 2462 | 1903 | 2524 | 345 | 466 | 273 | 419 |
| Guo 1984 | 3 | 67 | 202 | 31 | 79 | 54 | 205 | 39 | 128 |
| 4 | 74 | 354 | 39 | 164 | 32 | 246 | 14 | 164 | |
| 5 | 61 | 589 | 47 | 345 | 18 | 218 | 19 | 387 | |
| 6 | 53 | 695 | 56 | 397 | 27 | 309 | 12 | 354 | |
| 7 | 41 | 399 | 21 | 240 | 29 | 335 | 11 | 352 | |
| 8 | 53 | 392 | 24 | 279 | 50 | 343 | 16 | 350 | |
| 8 | 278 | 392 | 204 | 279 | 273 | 343 | 104 | 350 | |
| Kunzel 1997 | 5 | 231 | 688 | 682 | 1306 | 39 | 172 | 192 | 597 |
| 8 | 117 | 2438 | 746 | 3020 | 40 | 777 | 61 | 1078 | |
| Note: Only data up to the age of 8 years included for the deciduous dentition a. Baseline data not available for ages 6 and 7 years b. Data from all fluoridated areas combined | |||||||||
| Study ID | Age | Fluoridated area | Non/low fluoridated area | ||||||
| B aseline (before/at initiation) | Follow‐up | Baseline | Follow‐up | ||||||
| n | N | n | N | n | N | n | N | ||
| ADRIASOLA 1959a | 8 | 21 | 493 | 11 | 458 | 17 | 223 | 2 | 226 |
| 12 | 7 | 292 | 8 | 419 | 3 | 197 | 9 | 211 | |
| BEAL 1981 | 8 | 77 | 189 | 115 | 167 | 56 | 163 | 82 | 186 |
| 12 | 51 | 192 | 41 | 189 | 13 | 188 | 14 | 197 | |
| BLINKHORN 2015 | 10 to 12 | 525 | 777 | 486 | 642 | 272 | 436 | 307 | 455 |
| BROWN 1960b | 9 to 11 | 34 | 595 | 220 | 502 | 35 | 571 | 42 | 521 |
| 12 to 14 | 7 | 593 | 94 | 503 | 3 | 486 | 11 | 485 | |
| DHSS 1969 (Eng) | 8 | 40 | 199 | 50 | 95 | 33 | 148 | 29 | 79 |
| 9 | 25 | 227 | 57 | 135 | 20 | 166 | 20 | 95 | |
| 10 | 13 | 134 | 36 | 115 | 14 | 160 | 10 | 80 | |
| 11 | 12 | 145 | 12 | 200 | 3 | 126 | 12 | 122 | |
| 12 | 3 | 111 | 20 | 134 | 0 | 51 | 4 | 99 | |
| 13 | 3 | 91 | 9 | 132 | 2 | 52 | 8 | 127 | |
| 14 | 0 | 70 | 4 | 90 | 2 | 36 | 9 | 180 | |
| DHSS 1969 (Wales) | 8 | 143 | 607 | 112 | 283 | 88 | 351 | 26 | 125 |
| 9 | 73 | 553 | 78 | 260 | 49 | 325 | 15 | 134 | |
| 10 | 63 | 502 | 44 | 241 | 25 | 308 | 8 | 133 | |
| 11 | 30 | 278 | 15 | 126 | 35 | 270 | 0 | 42 | |
| 12 | 15 | 186 | 10 | 108 | 27 | 265 | 2 | 108 | |
| 13 | 7 | 178 | 0 | 93 | 14 | 274 | 1 | 105 | |
| 14 | 8 | 158 | 3 | 93 | 15 | 243 | 1 | 96 | |
| Guo 1984 | 5 | 575 | 589 | 338 | 345 | 214 | 218 | 358 | 387 |
| 6 | 616 | 695 | 266 | 297 | 284 | 309 | 249 | 354 | |
| 7 | 305 | 399 | 189 | 240 | 272 | 335 | 162 | 352 | |
| 8 | 278 | 392 | 204 | 279 | 273 | 343 | 104 | 350 | |
| 9 | 242 | 388 | 167 | 275 | 195 | 310 | 98 | 352 | |
| 10 | 215 | 346 | 161 | 310 | 199 | 323 | 84 | 436 | |
| 11 | 213 | 330 | 133 | 307 | 245 | 451 | 65 | 365 | |
| 12 | 240 | 468 | 90 | 208 | 475 | 841 | 91 | 493 | |
| 13 | 227 | 469 | 88 | 232 | 434 | 801 | 77 | 504 | |
| 14 | 161 | 322 | 69 | 221 | 455 | 795 | 73 | 490 | |
| 15 | 78 | 164 | 11 | 38 | 66 | 121 | 11 | 63 | |
| Kunzel 1997 | 8 | 1021 | 2419 | 2147 | 3016 | 334 | 777 | 333 | 1076 |
| 12 | 120 | 1626 | 801 | 2426 | 42 | 563 | 50 | 925 | |
| 15 | 118 | 1995 | 249 | 1897 | 27 | 744 | 18 | 756 | |
| a. Baseline data not available for ages 11 and 15 years b. Data for 16‐17‐year olds presented but no N | |||||||||
| Study ID | Outcome | Age | Fluoride level | Assigned F level | Number of subjects | Proportion with outcome |
| Chen 1993 | Skeletal fluorosis | 16 to 65 | 5.5 | 5.5 | 28 | 82.1 |
| 3.1 | 3.1 | 114 | 71.1 | |||
| 0.4 | 0.4 | 50 | 46 | |||
| 3.1 | 3.1 | 50 | 86 | |||
| Wang 2012a | Skeletal fluorosis | ≥16 | 2.2 | 2.2 | 406,298 | 10.8 |
| 0.5 | 0.5 | 188,400 | 4.8 | |||
| Wenzel 1982b | Skeletal maturity | 12 to 14 | 2.4 | 2.4 | 122 | 0.59 (0.1)c |
| < 0.2 | 0.1 | 113 | 0.59 (0.09)c | |||
| Alarcon‐Herrera | Bone fracture | 6 to 12 | < 1.5 | 0.75 | 97 | 5.2 |
| 1.51‐4.99 | 3.25 | 112 | 8.9 | |||
| 5‐8.49 | 6.75 | 38 | 2.6 | |||
| 8.5‐11.99 | 10.25 | 27 | 11.1 | |||
| 12‐16 | 14 | 59 | 8.5 | |||
| 13 to 60 | < 1.5 | 0.75 | 192 | 3.1 | ||
| 1.51‐4.99 | 3.25 | 330 | 7.9 | |||
| 5‐8.49 | 6.75 | 146 | 8.9 | |||
| 8.5‐11.99 | 10.25 | 138 | 7.2 | |||
| 12‐16 | 14 | 96 | 6.3 | |||
| Jolly 1971b | Skeletal fluorosis | Not stated | 0.7 | 0.7 | Not stated | 3.6 |
| 1.4 | 1.4 | Not stated | 2.4 | |||
| 2.4 | 2.4 | Not stated | 17 | |||
| 2.4 | 2.4 | Not stated | 23 | |||
| 2.5 | 2.5 | Not stated | 33 | |||
| 3 | 3 | Not stated | 19.6 | |||
| 3 | 3 | Not stated | 42.2 | |||
| 3.3 | 3.3 | Not stated | 10 | |||
| 3.3 | 3.3 | Not stated | 45 | |||
| 3.6 | 3.6 | Not stated | 33.1 | |||
| 4.3 | 4.3 | Not stated | 19.4 | |||
| 5 | 5 | Not stated | 60 | |||
| 5.1 | 5.1 | Not stated | 44.5 | |||
| 5.5 | 5.5 | Not stated | 31.3 | |||
| 7 | 7 | Not stated | 47.4 | |||
| 8.5 | 8.5 | Not stated | 58.9 | |||
| 9.4 | 9.4 | Not stated | 70.1 | |||
| a. Participants were diagnosed on the basis of diagnostic criteria for endemic skeletal fluorosis (WS 192‐2008) b. Participants were examined radiologically c. Reported outcome was mean (standard error) skeletal maturity | ||||||
| Study ID | Age | Group | Measure | Social class | Baseline | Final | ||||||
| F level | N | % caries free | dmft (SD) | F level | N | % caries free | dmft (SD) | |||||
| Beal 1971a | 5 | Balsall Heath | Descriptive | Poor area | Low | 115 | 9 | 5.16 (0.44) | 1 | 132 | 48 | 1.94 (0.22) |
| Northfield | Industrial area | Low | 182 | 29 | 4.91 (0.36) | 1 | 182 | 41 | 2.45 (0.24) | |||
| Dudley | Industrial area | < 0.1 | 217 | 16 | 4.97 (0.28) | < 0.1 | 229 | 24 | 5.09 (0.32) | |||
| Gray 2000b | 5 | South east Staffordshire | Jarman score | ‐23.09 | Low | 3435 | 66 | 1.21 (0.59) | 1 | 3120 | 75 | 0.64 (1.46) |
| Sandwell | 18.1 | Low | 3950 | 51 | 1.93 (2.88) | 1 | 3598 | 69 | 0.83 (1.68) | |||
| Walsall | 1.67 | Low | 3120 | 54 | 1.85 (2.31) | 1 | 363 | 67 | 0.94 (1.77) | |||
| Dudley | ‐13.68 | Low | 3657 | 58 | 1.6 (2.54) | 1 | 3474 | 73 | 0.78 (1.75) | |||
| North Birmingham | 21.57 | Low | 1965 | 72 | 0.88 (1.97) | 1 | 1904 | 74 | 0.71 (1.65) | |||
| North Staffordshire | ‐3.59 | Low | 464 | 47 | 2.24 (3.04) | Low | 1947 | 59 | 1.49 (2.46) | |||
| Herefordshire | ‐13.01 | Low | 406 | 57 | 1.61 (2.55) | Low | 305 | 50 | 1.79 (2.68) | |||
| Shropshire | ‐12.34 | Low | 366 | 61 | 1.29 (2.22) | Low | 311 | 60 | 1.33 (2.33) | |||
| Kidderminster | ‐13.13 | Low | 904 | 58 | 1.74 (2.81) | Low | 1053 | 61 | 1.4 (2.52) | |||
| Holdcroft 1999b | Not stated | North Birmingham | Jarman score | ‐7.85 | Not stated | Not stated | 2.18 | High | Not stated | 0.68 | ||
| Sandwell | 15.03 | Not stated | Not stated | 2.55 | High | Not stated | 1.13 | |||||
| North Staffordshire | ‐4.07 | Not stated | Not stated | 2.24 | Not stated | Not stated | 1.48 | |||||
| Shropshire | ‐11.73 | Not stated | Not stated | 1.76 | Not stated | Not stated | 1.29 | |||||
| Herefordshire | ‐11.97 | Not stated | Not stated | 2.56 | Not stated | Not stated | 1.53 | |||||
| a. Caries data reported as deft (SE) b. Caries data reported as dmft (SD) | ||||||||||||
| WHO regions | DMFT |
| 2011 | |
| Africa | 1.19 |
| Americas | 2.35 |
| Eastern Mediteranean | 1.63 |
| Europe | 1.95 |
| South East Asia | 1.87 |
| Western Pacific | 1.39 |
| GLOBAL | 1.67 |
| http://www.mah.se/CAPP/Country‐Oral‐Health‐Profiles/According‐to‐Alphabetical/Global‐DMFT‐for‐12‐year‐olds‐2011/ | |
| Outcome or subgroup title | No. of studies | No. of participants | Statistical method | Effect size |
| 1 Change in decayed, missing or filled deciduous teeth (dmft) Show forest plot | 9 | 22134 | Mean Difference (IV, Random, 95% CI) | 1.81 [1.31, 2.31] |
| 1.1 Studies conducted in 1975 or earlier | 7 | 17039 | Mean Difference (IV, Random, 95% CI) | 1.82 [1.53, 2.11] |
| 1.2 Studies conducted after 1975 | 2 | 5095 | Mean Difference (IV, Random, 95% CI) | 1.56 [‐0.67, 3.80] |
| 2 Change in decayed, missing or filled permanent teeth (DMFT) Show forest plot | 10 | 39382 | Mean Difference (IV, Random, 95% CI) | 1.16 [0.72, 1.61] |
| 2.1 Studies conducted in 1975 or earlier | 7 | 30499 | Mean Difference (IV, Random, 95% CI) | 1.41 [0.84, 1.98] |
| 2.2 Studies conducted after 1975 | 3 | 8883 | Mean Difference (IV, Random, 95% CI) | 0.64 [‐0.27, 1.55] |
| 3 Change in proportion of caries free children (deciduous teeth) Show forest plot | 10 | 19983 | Mean Difference (IV, Random, 95% CI) | ‐0.15 [‐0.19, ‐0.11] |
| 3.1 Studies conducted in 1975 or earlier | 7 | 11902 | Mean Difference (IV, Random, 95% CI) | ‐0.17 [‐0.19, ‐0.15] |
| 3.2 Studies conducted after 1975 | 3 | 8081 | Mean Difference (IV, Random, 95% CI) | ‐0.12 [‐0.24, ‐0.01] |
| 4 Change in proportion of caries free children (permanent teeth) Show forest plot | 8 | 26769 | Mean Difference (IV, Random, 95% CI) | ‐0.14 [‐0.23, ‐0.05] |
| 4.1 Studies conducted in 1975 or earlier | 6 | 17459 | Mean Difference (IV, Random, 95% CI) | ‐0.13 [‐0.24, ‐0.03] |
| 4.2 Studies conducted after 1975 | 2 | 9310 | Mean Difference (IV, Random, 95% CI) | ‐0.17 [‐0.43, 0.10] |