Moduladores selectivos de los receptores de progesterona (MSRP) para los miomas uterinos
Información
- DOI:
- https://doi.org/10.1002/14651858.CD010770.pub2Copiar DOI

- Base de datos:
-
- Cochrane Database of Systematic Reviews
- Versión publicada:
-
- 26 abril 2017see what's new
- Tipo:
-
- Intervention
- Etapa:
-
- Review
- Grupo Editorial Cochrane:
-
Grupo Cochrane de Ginecología y fertilidad
- Copyright:
-
- Copyright © 2017 The Cochrane Collaboration. Published by John Wiley & Sons, Ltd.
Cifras del artículo
Altmetric:
Citado por:
Autores
Contributions of authors
All review authors contributed equally in drafting and reviewing the protocol and review.
Sources of support
Internal sources
-
None, Other.
External sources
-
None, Other.
Declarations of interest
AM participated in a speakers bureau or served on the advisory board for Allergan (manufacturer of ulipristal acetate in Canada), Abbvie (manufacturer of leuprolide), Bayer, Hologic and Medtronic.
MS, TC and LW have no conflicts of interest to declare.
Acknowledgements
We acknowledge the significant contributions of Drs Hilary OD Critchley and Andrew H Horne to the review.
Many thanks to Marian Showell, Information Specialist with the Cochrane Gynaecology and Fertility Group, and Vicky Lynham, at Sidney Liswood Library Mount Sinai Hospital, Toronto, Ontario, for help in devising and executing the literature search strategy.
Many thanks also to Professor Joseph Beyenne, Professor of Biostatistics, Faculty of Health Sciences, McMaster University, Hamilton, who assisted with statistical analysis and imputation of missing data.
Version history
| Published | Title | Stage | Authors | Version |
| 2017 Apr 26 | Selective progesterone receptor modulators (SPRMs) for uterine fibroids | Review | Ally Murji, Lucy Whitaker, Tiffany L Chow, Mara L Sobel | |
| 2013 Oct 16 | Selective progesterone receptor modulators (SPRMs) for uterine fibroids | Protocol | Ally Murji, Andrew W Horne, Lucy Whitaker, Mara L Sobel, Hilary OD Critchley | |
Differences between protocol and review
Secondary outcomes
We removed the outcome that looked at recurrence rate over time. When conducting the review, we found this outcome to be not workable as it applied only to the post‐randomisation subgroup.
Measures of treatment effect
We added a paragraph to explain how SMDs would be interpreted because we wished to ensure that they would be interpreted in a consistent manner in the review.
Unit of analysis issues
In the protocol, we stated, "Change in fibroid size data will be analysed based on the number of fibroids tracked and not the number of patients". We decided that we would not pool any data not analysed per woman but would include them in an additional table, because we wished to avoid a unit of analysis error.
Dealing with missing data
We added a sentence to make it clear that when data manipulation was undertaken (such as imputing standard deviations or calculating medians from means), we obtained statistical advice and imputed the data using methods included in an appendix. Our rationale was that we wished to be transparent about our methods.
Subgroup analyses
The protocol stated that subgroup analyses would be undertaken "if sufficient data were available". Because "sufficient data" was poorly defined, we specified that this would mean more than five studies.
Sensitivity analyses
The protocol stated that we would conduct the following sensitivity analyses.
-
Exclusion of studies with high risk of bias.
-
Application of a fixed‐effect model.
-
Exclusion of unpublished studies.
-
Exclusion of trials for which data were imputed for primary outcomes.
-
Exclusion of studies that used unpublished rating scales or scales that had not been validated to assess for symptom relief.
We decided not to conduct the third and fifth sensitivity analyses in the list above because we considered that these factors would be reflected in an assessment of study risk of bias, and we changed the wording of the fourth subgroup analysis to "if alternative imputation strategies had been implemented" because it allows consideration of a wider range of scenarios for imputation of data.
Overall quality of the body of evidence: 'Summary of findings' tables
We added a paragraph explaining the methods we would use to compile 'Summary of findings' tables, and we added details of a second comparison because this information was not included in the protocol.
Keywords
MeSH
Medical Subject Headings (MeSH) Keywords
- Amenorrhea [drug therapy];
- Antineoplastic Agents, Hormonal [*therapeutic use];
- Estrenes [*therapeutic use];
- Leiomyoma [*drug therapy];
- Leuprolide [therapeutic use];
- Menstruation [drug effects];
- Mifepristone [*therapeutic use];
- Norpregnadienes [*therapeutic use];
- Oximes [*therapeutic use];
- Pelvic Pain [drug therapy];
- Quality of Life;
- Randomized Controlled Trials as Topic;
- Receptors, Progesterone [*antagonists & inhibitors];
- Uterine Neoplasms [*drug therapy];
Medical Subject Headings Check Words
Female; Humans;
PICO

Study flow diagram.

Risk of bias graph: review authors' judgements about each risk of bias item presented as percentages across all included studies.
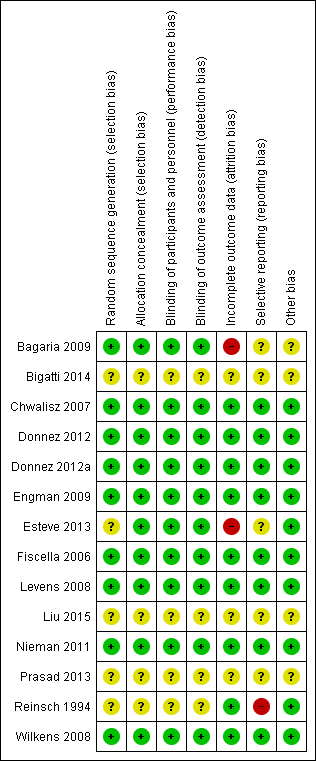
Risk of bias summary: review authors' judgements about each risk of bias item for each included study.
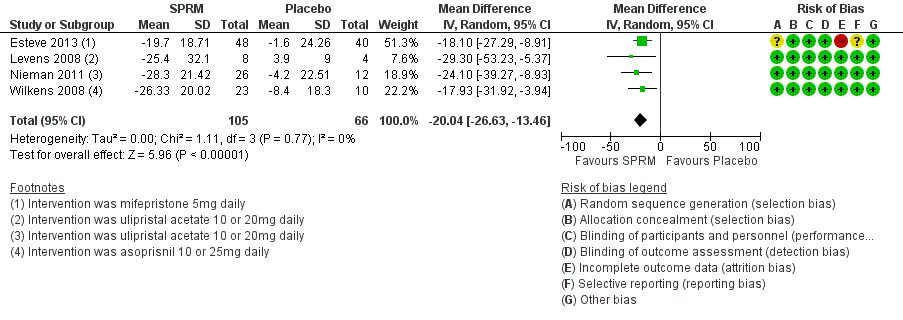
Forest plot of comparison: 1 SPRM versus placebo, outcome: 1.1 Change in symptom severity score (QoL).

Forest plot of comparison: 1 SPRM versus placebo, outcome: 1.2 Change in health‐related quality of life score.

Forest plot of comparison: 1 SPRM versus placebo, outcome: 1.3 Change in menstrual blood loss.

Forest plot of comparison: 2 SPRM versus leuprolide acetate, outcome: 2.1 Change in symptom severity score (QoL).

Forest plot of comparison: 2 SPRM versus leuprolide acetate, outcome: 2.2 Change in health‐related quality of life score.
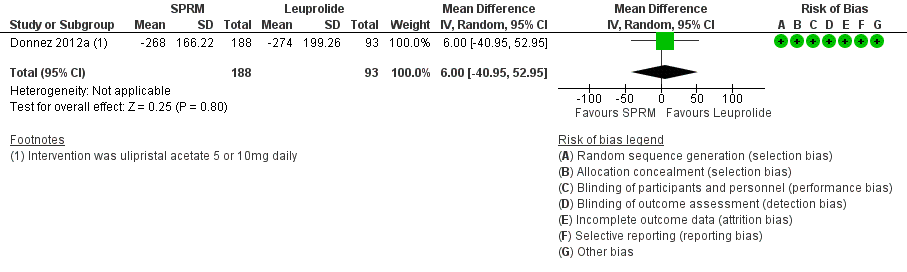
Forest plot of comparison: 2 SPRM versus leuprolide acetate, outcome: 2.3 Change in menstrual blood loss.

Comparison 1 SPRM versus placebo, Outcome 1 Change in symptom severity score (QoL).
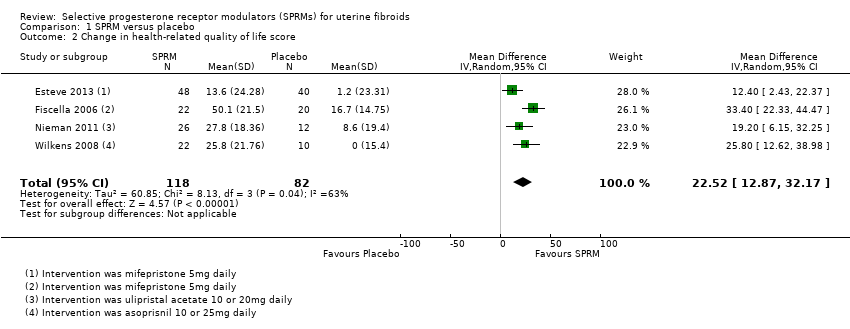
Comparison 1 SPRM versus placebo, Outcome 2 Change in health‐related quality of life score.

Comparison 1 SPRM versus placebo, Outcome 3 Change in menstrual blood loss.

Comparison 1 SPRM versus placebo, Outcome 4 Amenorrhoea.
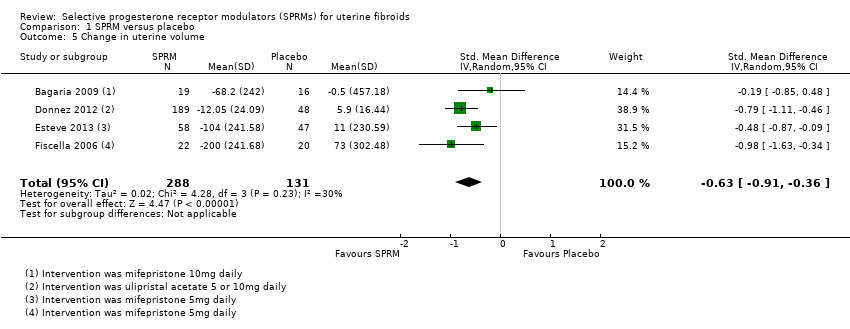
Comparison 1 SPRM versus placebo, Outcome 5 Change in uterine volume.
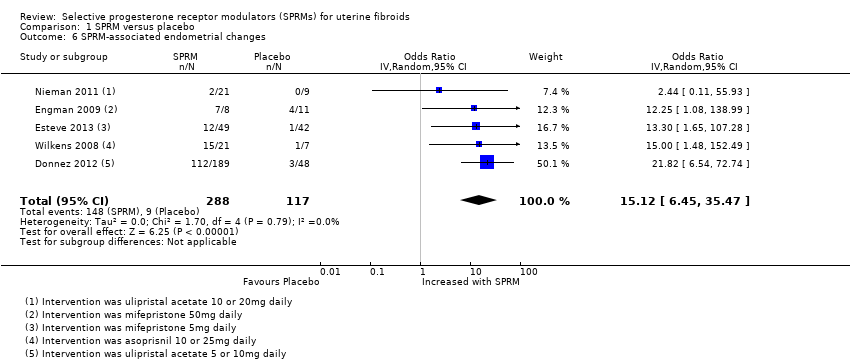
Comparison 1 SPRM versus placebo, Outcome 6 SPRM‐associated endometrial changes.
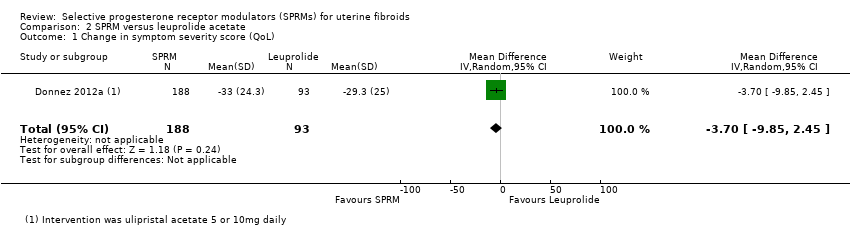
Comparison 2 SPRM versus leuprolide acetate, Outcome 1 Change in symptom severity score (QoL).

Comparison 2 SPRM versus leuprolide acetate, Outcome 2 Change in health‐related quality of life score.

Comparison 2 SPRM versus leuprolide acetate, Outcome 3 Change in menstrual blood loss.

Comparison 2 SPRM versus leuprolide acetate, Outcome 4 Amenorrhoea.

Comparison 2 SPRM versus leuprolide acetate, Outcome 5 Change in pelvic pain.
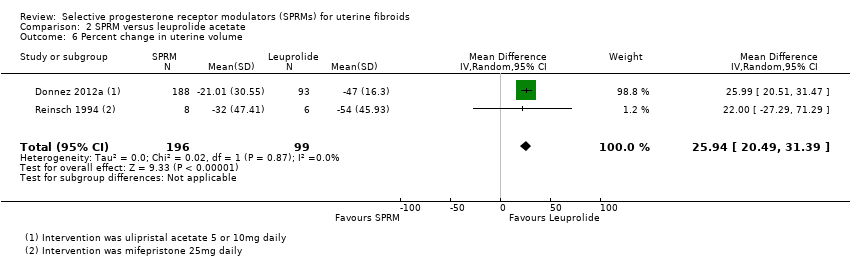
Comparison 2 SPRM versus leuprolide acetate, Outcome 6 Percent change in uterine volume.
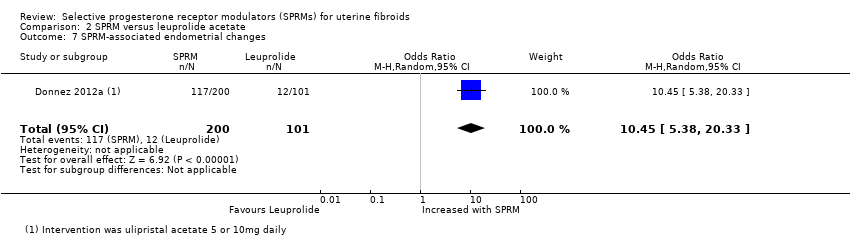
Comparison 2 SPRM versus leuprolide acetate, Outcome 7 SPRM‐associated endometrial changes.
| SPRM vs placebo | ||||||
| Patient or population: women with uterine fibroids | ||||||
| Outcomes | Anticipated absolute effects* (95% CI) | Relative effect | Number of participants | Quality of the evidence | Comments | |
| Risk with placebo | Risk with SPRM | |||||
| Quality of life: change in symptom severity score measured with Uterine Fibroid Symptom Quality of Life Scale (UFS‐QoL): scale 0 to 100 | Mean change in symptom severity score (QoL) in the intervention group was 20.04 points lower (26.63 lower to 13.46 lower), indicating improvement in symptom severity with SPRM treatment for 3 months | ‐ | 171 | ⊕⊕⊕⊝ | ||
| Quality of life: change in health‐related quality of life score measured with UFS‐QoL: scale 0 to 100 | Mean change in health‐related quality of life score in the intervention group was 22.52 points higher (12.87 higher to 32.17 higher), indicating improvement in quality of life with SPRM treatment for 3 to 6 months | ‐ | 200 | ⊕⊕⊕⊝ | 1 RCT (Fiscella 2006) reported outcomes at 6 months. Remaining studies had a 3‐month follow‐up period | |
| Abnormal uterine bleeding: change in menstrual blood loss | Mean change in menstrual blood loss in the intervention group was 1.11 points lower (1.38 lower to 0.83 lower), indicating a decrease in menstrual blood loss with SPRM treatment for 3 months | ‐ | 310 | ⊕⊕⊕⊝ | Measured by PBAC score or similar menstrual pictorial score. PBAC score ≥ 100 correlates with menorrhagia, which is defined as > 80 mL menstrual blood loss | |
| Abnormal uterine bleeding: amenorrhoea | 29 per 1000 | 477 per 1000 | OR 82.50 | 590 | ⊕⊕⊕⊝ | 1 RCT (Fiscella 2006) reported outcomes at 6 months. Remaining studies had a 3‐month follow‐up period |
| Pelvic pain (measured subjectively) | No conclusions could be drawn owing to variability in estimates | 629 (7 RCTs) | ||||
| Adverse effects: SPRM‐associated endometrial changes | 77 per 1000 | 351 per 1000 | OR 15.12 | 405 | ⊕⊕⊝⊝ | |
| *Risk in the intervention group (and its 95% confidence interval) is based on mean risk in the comparison group and relative effect of the intervention (and its 95% CI) | ||||||
| GRADE Working Group grades of evidence | ||||||
| aDowngraded one level as publication bias suspected because no small negative studies included. Also, many studies were conducted and not published bDowngraded one level because of serious issues with indirectness of evidence when criteria for evaluating endometrial specimens differed between studies | ||||||
| SPRM versus leuprolide acetate for uterine fibroids | ||||||
| Patient or population: uterine fibroids | ||||||
| Outcomes | Anticipated absolute effects* (95% CI) | Relative effect | Number of participants | Quality of the evidence | Comments | |
| Risk with leuprolide acetate | Risk with SPRM | |||||
| Quality of life: change in symptom severity score measured with Uterine Fibroid Symptom Quality of Life Scale (UFS‐QoL): scale 0 to 100 | Mean change in symptom severity score (QoL) in the SPRM group was 3.7 points lower | ‐ | 281 | ⊕⊕⊕⊝ | ||
| Quality of life: change in health‐related quality of life score measured with UFS‐QoL: scale 0 to 100 | Mean change in health‐related quality of life score in the SPRM group was 1.06 points higher | ‐ | 281 | ⊕⊕⊕⊝ | ||
| Abnormal uterine bleeding: change in menstrual blood loss (measured using PBAC score) | Mean change in menstrual blood loss in the SPRM group was 6 points higher | ‐ | 281 | ⊕⊕⊝⊝ | PBAC score ≥ 100 correlates with menorrhagia, which is defined as > 80 mL menstrual blood loss | |
| Abnormal uterine bleeding: amenorrhoea | 804 per 1000 | 828 per 1000 | OR 1.14 | 280 | ⊕⊕⊕⊝ | |
| Pelvic pain (measured using McGill Pain Questionnaire: range 0 to 45) | Mean change in pelvic pain in the SPRM group was 0.01 points lower (2.14 lower to 2.12 higher) than in the leuprolide group at 3 months | ‐ | 281 | ⊕⊕⊕⊝ | ||
| Adverse effects: SPRM‐associated endometrial changes | 119 per 1000 | 585 per 1000 | OR 10.45 | 301 | ⊕⊕⊕⊝ | |
| *Risk in the intervention group (and its 95% confidence interval) is based on mean risk in the comparison group and relative effect of the intervention (and its 95% CI) | ||||||
| GRADE Working Group grades of evidence | ||||||
| aDowngraded one level as publication bias strongly suspected bDowngraded one level owing to serious issue with imprecision as point estimate has very wide confidence interval | ||||||
| Study | Participants | Daily dose | Control | Follow‐up (months) |
| 124 | 5 mg | Placebo | 3 | |
| 42 | 5 mg | Placebo | 6 | |
| 40 | 10 mg | Placebo | 3 | |
| 62 | 10 mg | Placebo | 3 | |
| 132 | 10 mg | Placebo | 3 | |
| 14 | 25 mg | Leuprolide acetate | 3 | |
| 30 | 50 mg | Vitamin B | 3 |
| Study | Participants | Daily dose | Control | Follow‐up (months) |
| Unknown | 5 mg | No treatment | Not stated | |
| 242 | 5 or 10 mg | Placebo | 3 | |
| 303 | 5 or 10 mg | Leuprolide acetate | 3 | |
| 22 | 10 or 20 mg | Placebo | 3 | |
| 42 | 10 or 20 mg | Placebo | 3 |
| Study | Participants | Daily dose | Control | Follow‐up (months) |
| 129 | 5 or 10 or 25 mg | Placebo | 3 | |
| 33 | 10 or 25 mg | Placebo | 3 |
| Study | SPRM type | SPRM | Placebo | |||||
| MD | SD | n | MD | SD | n | Finding | ||
| Mifepristone | ‐41.5 cc | 220.59 | 19 | 0.6 cc | 266.63 cc | 16 | No significant difference | |
| Mifepristone | ‐10.0 cc | 107.39 | 12 | ‐16.0 cc | 98.54 cc | 15 | No significant difference | |
| Mifepristone | ‐37.0 cc | 96.24 | 58 | 4.0 cc | 99.1 cc | 47 | Favours SPRM | |
| Ulipristal acetate | ‐16.88% | 31.34 | 165 | 3.0% | 31.63 | 45 | Favours SPRM | |
| Ulipristal acetate | ‐20.5% | 20.6 | 26 | 7.0% | 25.0 | 12 | Favours SPRM | |
| cc: cubic centimetres MD: mean difference n: fibroids tracked SD: standard deviation | ||||||||
| Study | SPRM | Leuprolide | |||||
| MD | SD | n | MD | SD | n | Finding | |
| Donnez 2012a | ‐39.03% | 37.92 | 188 | ‐53.0% | 24.44 | 93 | Favours leuprolide |
| MD: mean difference n: fibroids tracked SD: standard deviation | |||||||
| Outcome or subgroup title | No. of studies | No. of participants | Statistical method | Effect size |
| 1 Change in symptom severity score (QoL) Show forest plot | 4 | 171 | Mean Difference (IV, Random, 95% CI) | ‐20.04 [‐26.63, ‐13.46] |
| 2 Change in health‐related quality of life score Show forest plot | 4 | 200 | Mean Difference (IV, Random, 95% CI) | 22.52 [12.87, 32.17] |
| 3 Change in menstrual blood loss Show forest plot | 3 | 310 | Std. Mean Difference (IV, Random, 95% CI) | ‐1.11 [‐1.38, ‐0.83] |
| 4 Amenorrhoea Show forest plot | 7 | 590 | Odds Ratio (IV, Random, 95% CI) | 82.50 [37.01, 183.90] |
| 5 Change in uterine volume Show forest plot | 4 | 419 | Std. Mean Difference (IV, Random, 95% CI) | ‐0.63 [‐0.91, ‐0.36] |
| 6 SPRM‐associated endometrial changes Show forest plot | 5 | 405 | Odds Ratio (IV, Random, 95% CI) | 15.12 [6.45, 35.47] |
| Outcome or subgroup title | No. of studies | No. of participants | Statistical method | Effect size |
| 1 Change in symptom severity score (QoL) Show forest plot | 1 | 281 | Mean Difference (IV, Random, 95% CI) | ‐3.70 [‐9.85, 2.45] |
| 2 Change in health‐related quality of life score Show forest plot | 1 | 281 | Mean Difference (IV, Random, 95% CI) | 1.06 [‐5.73, 7.85] |
| 3 Change in menstrual blood loss Show forest plot | 1 | 281 | Mean Difference (IV, Random, 95% CI) | 6.00 [‐40.95, 52.95] |
| 4 Amenorrhoea Show forest plot | 1 | 280 | Odds Ratio (M‐H, Random, 95% CI) | 1.14 [0.60, 2.16] |
| 5 Change in pelvic pain Show forest plot | 1 | 281 | Mean Difference (IV, Random, 95% CI) | ‐0.01 [‐2.14, 2.12] |
| 6 Percent change in uterine volume Show forest plot | 2 | 295 | Mean Difference (IV, Random, 95% CI) | 25.94 [20.49, 31.39] |
| 7 SPRM‐associated endometrial changes Show forest plot | 1 | 301 | Odds Ratio (M‐H, Random, 95% CI) | 10.45 [5.38, 20.33] |