Tratamiento antipalúdico preventivo intermitente para niños con anemia
Información
- DOI:
- https://doi.org/10.1002/14651858.CD010767.pub2Copiar DOI

- Base de datos:
-
- Cochrane Database of Systematic Reviews
- Versión publicada:
-
- 13 enero 2015see what's new
- Tipo:
-
- Intervention
- Etapa:
-
- Review
- Grupo Editorial Cochrane:
-
Grupo Cochrane de Enfermedades infecciosas
- Clasificada:
-
- Pendiente de actualización
Studies awaiting assessment
The CIDG is currently examining a new search conducted up to 16 Nov, 2017 for potentially relevant studies. These studies have not yet been incorporated into this Cochrane Review.Evaluada: 16 April 2019
- Pendiente de actualización
- Copyright:
-
- Copyright © 2015 The Authors. Cochrane Database of Systematic Reviews published by John Wiley & Sons, Ltd. on behalf of The Cochrane Collaboration.
- This is an open access article under the terms of the Creative Commons Attribution‐Non‐Commercial Licence, which permits use, distribution and reproduction in any medium, provided the original work is properly cited and is not used for commercial purposes.
Cifras del artículo
Altmetric:
Citado por:
Autores
Contributions of authors
MA, AR and AMK developed the protocol. MA and AR screened search outputs, selected trials for inclusion, extracted data, assessed risk of bias, analysed data and prepared the draft manuscript. AMK critically engaged with the manuscript and provided comments. All review authors have seen and approved the final manuscript.
Sources of support
Internal sources
-
Centre for Evidence‐based Health Care, Stellenbosch University, South Africa.
-
Ifakara Health Institute, Tanzania.
-
Liverpool School of Tropical Medicine, UK.
External sources
-
Effective Health Care Research Consortium, UK.
-
Department for International Development (DfID), UK.
Declarations of interest
The review authors have no known conflicts of interest.
Acknowledgements
We thank Paul Garner, Dave Sinclair, Marty Richardson, Taryn Young and Vittoria Lutje for their comments and support. The editorial base of the Cochrane Infectious Diseases Group is funded by UKaid from the UK Government for the benefit of developing countries.
AR is supported in part by the Effective Health Care Research Consortium, which is funded by UKaid from the UK Government.
Version history
| Published | Title | Stage | Authors | Version |
| 2015 Jan 13 | Intermittent preventive antimalarial treatment for children with anaemia | Review | Mwaka Athuman, Abdunoor M Kabanywanyi, Anke C Rohwer | |
| 2013 Oct 18 | Intermittent preventive antimalarial treatment for children with anaemia | Protocol | Mwaka Athuman, Abdunoor M Kabanywanyi, Anke C Rohwer | |
Differences between protocol and review
1. We planned to include only children under the age of five (as stated in protocol), but when screening the studies, we noticed that some of them included children up to the age of nine years and we thus decided to include all children.
2. In the protocol, we prespecified the following outcomes:
Primary outcomes:
-
Mean Hb at follow‐up (g/dL)
-
Mean change in Hb from baseline at follow‐up
Secondary outcomes:
-
Complete recovery from severe anaemia (Hb > 5 g/dL)
-
Complete recovery from moderate anaemia (Hb > 8 g/dL)
-
Blood transfusions
-
All‐cause mortality
-
Admission due to severe anaemia
During our fellowship (MK and AR) at the editorial base of the Cochrane Infectious Diseases Group (CIDG) in Liverpool, we discussed these outcomes with some of the CIDG editors. We also consulted Higgins 2011 and agreed that mortality and hospital admission would be more meaningful outcomes to clinicians and decision‐makers, than mean Hb levels. We thus changed the primary and secondary outcomes to the following:
Primary outcomes:
-
All‐cause mortality and hospital admission
Secondary outcomes:
-
Anaemia at follow‐up (Hb < 11 g/dL)
-
Mean change in Hb (g/dL) from baseline to follow‐up
-
Mean Hb at follow‐up (g/dL)
3. We planned to perform the following subgroup analyses:
-
IPTi versus IPTc
-
Additional interventions to treat anaemia (such as, hematinics or folic acid)
-
The use of LLINs or not
Due to the lack of heterogeneity and the limited amount of included trials, we only performed the following subgroup analyses:
-
Additional interventions to treat anaemia (such as, hematinics or folic acid)
-
Hospital recruitment versus community recruitment
4. Due to the limited number of trials included in the analyses, we did not do sensitivity analyses.
Keywords
MeSH
Medical Subject Headings (MeSH) Keywords
Medical Subject Headings Check Words
Child, Preschool; Humans; Infant; Infant, Newborn;
PICO

Study flow diagram.

Risk of bias graph: review authors' judgements about each risk of bias item presented as percentages across all included trials.

Risk of bias summary: review authors' judgements about each risk of bias item for each included trial.

Comparison 1 IPT versus placebo, Outcome 1 All‐cause mortality plus hospital admissions at 6 months.
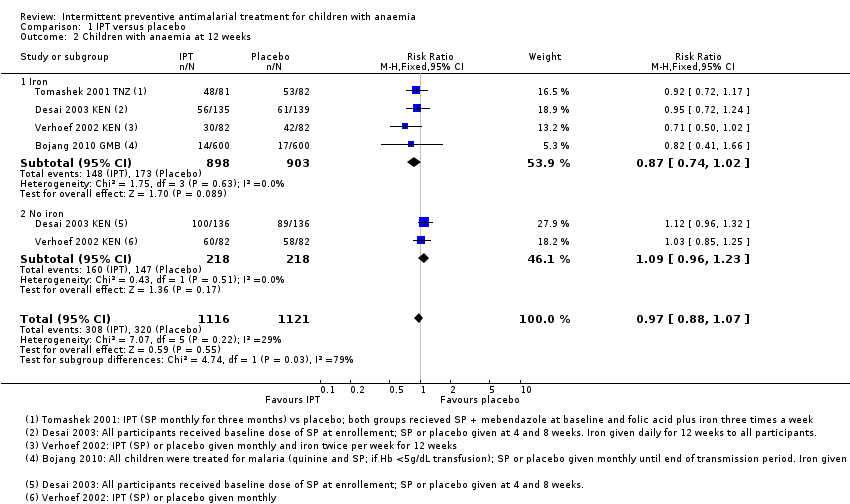
Comparison 1 IPT versus placebo, Outcome 2 Children with anaemia at 12 weeks.
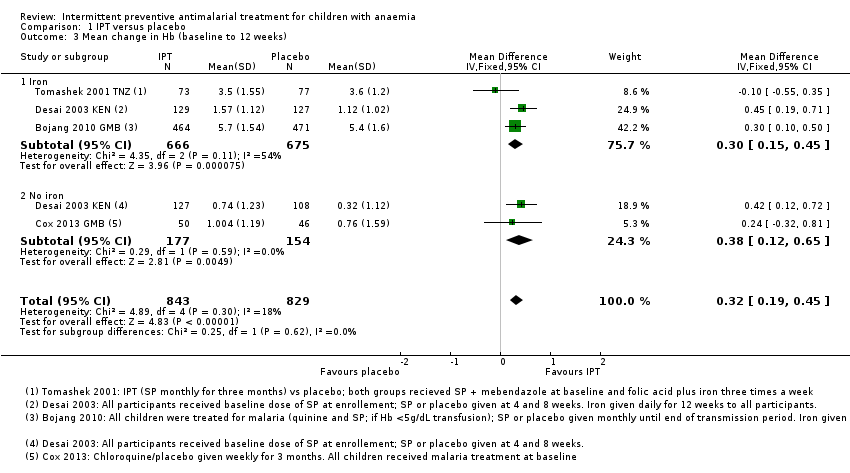
Comparison 1 IPT versus placebo, Outcome 3 Mean change in Hb (baseline to 12 weeks).

Comparison 1 IPT versus placebo, Outcome 4 Mean Hb at 12 weeks.
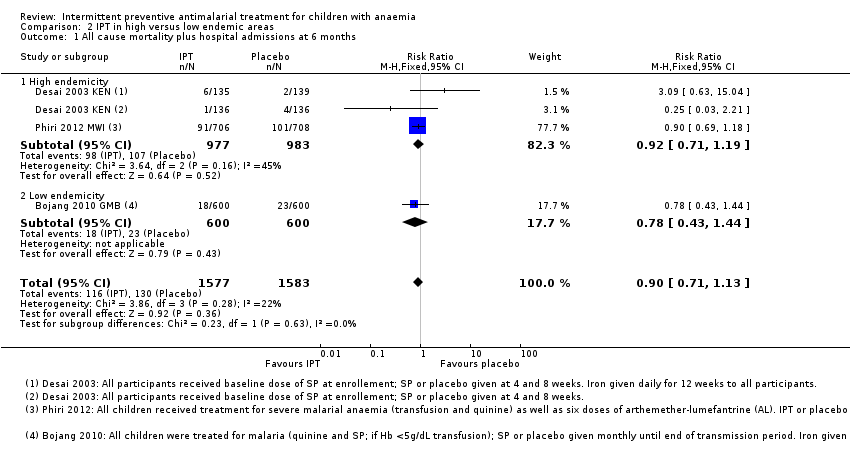
Comparison 2 IPT in high versus low endemic areas, Outcome 1 All cause mortality plus hospital admissions at 6 months.

Comparison 2 IPT in high versus low endemic areas, Outcome 2 Children with anaemia at 12 weeks.
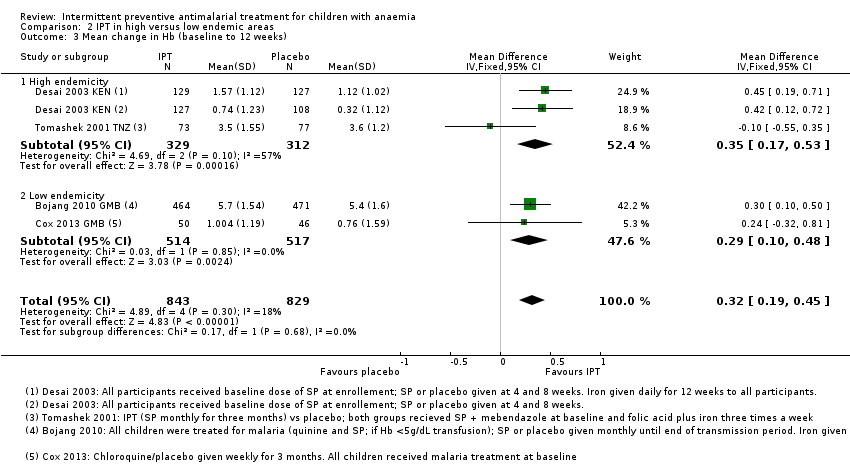
Comparison 2 IPT in high versus low endemic areas, Outcome 3 Mean change in Hb (baseline to 12 weeks).

Comparison 2 IPT in high versus low endemic areas, Outcome 4 Mean Hb at 12 weeks.

Comparison 3 IPT plus Vitamin A and C versus IPT in the presence of iron, Outcome 1 Children with anaemia at 12 weeks.
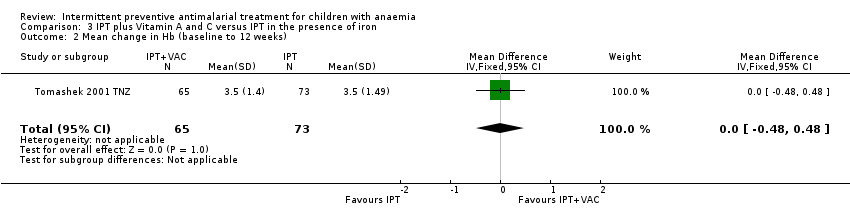
Comparison 3 IPT plus Vitamin A and C versus IPT in the presence of iron, Outcome 2 Mean change in Hb (baseline to 12 weeks).

Comparison 3 IPT plus Vitamin A and C versus IPT in the presence of iron, Outcome 3 Mean Hb at 12 weeks.
| Intermittent preventive treatment compared to placebo for children with anaemia | |||||
| Patient or population: Children with anaemia | |||||
| Outcomes | Illustrative comparative risks* (95% CI) | Relative effect | No of participants | Quality of the evidence | |
| Assumed risk | Corresponding risk | ||||
| Placebo | IPT | ||||
| Death or hospital admission Follow up at 6 months | 34 per 1000 | 31 per 1000 | RR 0.9 | 3160 | ⊕⊕⊕⊝ |
| Children with anaemia Follow up at 12 weeks | 579 per 1000 | 561 per 1000 | RR 0.97 | 2237 | ⊕⊕⊕⊝ |
| Mean change in Hb from baseline Follow up: 12 weeks | The mean change ranged across control groups from | The mean change in the intervention groups was | ‐ | 1672 | ⊕⊕⊕⊝ |
| Mean Hb Follow up at 12 weeks | The mean Hb concentration ranged across control groups from | The mean Hb concentration in the intervention groups was | ‐ | 1672 | ⊕⊕⊝⊝ |
| *The basis for the assumed risk is the median control group risk across trials. The corresponding risk (and its 95% CI) is based on the assumed risk in the comparison group and the relative effect of the intervention (and its 95% CI). | |||||
| GRADE Working Group grades of evidence | |||||
| 1 No serious risk of bias: The largest trial was at low risk of bias. The two smaller trials were at high risk of attrition bias, but exclusion of these trials does not change the result. 8 No serious imprecision. A small effect was seen although this disappears when we removed trials at high risk of bias from the analysis. | |||||
| Trial | ||||||
| Sample size (n randomized) | 1200 | 96 | 554 | 1431 | 328 | 238 |
| Country | The Gambia (Banjul) | The Gambia | Kenya (Western Kenya) | Malawi (southern Malawi) | Kenya (Eastern province) | Tanzania (Kigoma region) |
| Endemicity | low* | low* | high* | high* | low* | moderate/high (50% parasitaemia)** |
| Age | 3 months to 9 years | 12 to 72 months | 2 to 36 months | 4 to 59 months | 2 to 36 months | 6 to 59 months |
| Anaemia | Hb < 7 g/dL | Hb 69 to 110 g/L | Hb 7.0 to 10.9 g/dL | All children treated for severe malarial anaemia with transfusion and completed the course of intravenous quinine with subsequent Hb > 5g/dL | Hb 60 to 110 g/L | Hb 5.0 to 8.0 g/dL |
| Malaria | Not criteria for inclusion. Children with malaria were treated | Uncomplicated malaria | No malaria (aparasitaemic) or parasite counts < 20,000 parasites/mm3 | No clinical malaria | Not described as part of eligibility | |
| Recruitment | Hospital or OPD admission | Active and passive case finding of children in community | Community: resident children screened | Hospital admissions | Community: randomly selected | Health care worker diagnosed children with clinical anaemia and referred them to the trial |
| Trial intervention |
|
|
|
|
|
|
| Iron and other supplementation during trial period (all participants) | Yes: oral iron for 28 days | No | No ‐ part of trial intervention | Not reported | No – part of trial intervention | Yes: Iron and folic acid for 12 weeks |
| Baseline treatment for all participants | Some were treated with quinine and SP or CQ and SP. Not all children | Either CQ and SP or AL | Single dose of SP | 3 day course of AL | None | Single dose of SP; mebendazole for participants > 12 months |
| *endemicity derived from the Malaria Atlas Project (Gething 2011). **as reported in the trial (Tomashek 2001 TNZ). Abbreviations: Hb: Haemoglobin OPD: Out patient department IPT: Intermittent preventive treatment SP:Sulfadoxine‐pyrimethamine CQ: Chloroquine AL: Arthemeter‐lumefantrine VAC: Vitamin A and C | ||||||
| Outcomes | Trial | ||||||
| Haematological outcomes | Mean Hb at end of follow‐up | Mean Hb level at end of transmission period | ‐ | Hb concentration (measured in g/dL) | ‐ | Hb concentration at the end of follow‐up (12 weeks)* | Mean Hb |
| Mean change of Hb from baseline to follow‐up | ‐ | Mean change of Hb from baseline to follow‐up | ‐ | ‐ | ‐ | ‐ | |
| Children with anaemia at follow‐up | Proportion of children with moderate or severe anaemia at the end of the transmission period* | ‐ | Hematological recovery (Hb ≥ 11g/dL before or at week 12) Severe anaemia (Hb < 7 g/dL before or at week 12) | ‐ | Anaemia (Hb < 11.0 g/dL) | Prevalence of anaemia (Hb < 11.0 g/dL) | |
| Other | ‐ | Change in erythropoietic response Hb change from baseline to follow‐up in two placebo arms to investigate the effect of antimalarial therapy | MCV (measured in fL) sTfR concentration (measured in µg/mL) | ‐ | Iron deficiency (serum ferritin concentration < 12 µg/L) | Mean TfR level Prevalence of iron deficiency (TfR < 8.5 µg/mL) | |
| Malaria outcomes | Clinical malaria | Clinical episodes of malaria during the surveillance period | ‐ | Clinical malaria (axillary temperature 37.5 with co‐existing malaria parasitaemia) | ‐ | Proportion of children with at least one malaria attack (defined as presence of fever, that is temperature ≥ 37.5°C, and a positive dipstick result)* | ‐ |
| Malaria parasitaemia | Prevalence of parasitaemia and splenomegaly | Prevalence of submicroscopic malaria parasitaemia | Prevalence of malaria parasitaemia Parasite density (parasites/mm3) | ‐ | ‐ | ‐ | |
| Hospital admissions or clinic visits related to malaria | ‐ | ‐ | ‐ | Hospital re‐admission because of all‐cause severe anaemia or severe malaria Clinic visits because of microscopically confirmed non‐severe malaria | ‐ | ‐ | |
| Other | ‐ | ‐ | ‐ | ‐ | Time to first occurrence of malaria attack | ‐ | |
| All‐cause mortality and hospital admission | ‐ | ‐ | ‐ | Composite outcome of all‐cause mortality and hospital readmission because of all‐cause severe anaemia or severe malaria between 1 and 6 months* All‐cause hospital admission All‐cause mortality | ‐ | ‐ | |
| Visits to healthcare facilities | Outpatient attendance | ‐ | Clinic visits (incidence, number of episodes) | All‐cause sick child clinic visits | ‐ | ‐ | |
| Other | Nutritional status at the end oft he transmission period Compliance with treatment regimen | Change in urinary neopterin | ‐ | ‐ | Adverse drug reactions | ‐ | |
| *indicates primary outcomes Abbreviations: Hb: haemoglobin TfR: transferrin receptor | |||||||
| Outcome or subgroup title | No. of studies | No. of participants | Statistical method | Effect size |
| 1 All‐cause mortality plus hospital admissions at 6 months Show forest plot | 3 | 3160 | Risk Ratio (M‐H, Fixed, 95% CI) | 0.90 [0.71, 1.13] |
| 1.1 Iron | 2 | 1474 | Risk Ratio (M‐H, Fixed, 95% CI) | 0.96 [0.56, 1.67] |
| 1.2 No iron | 2 | 1686 | Risk Ratio (M‐H, Fixed, 95% CI) | 0.88 [0.68, 1.14] |
| 2 Children with anaemia at 12 weeks Show forest plot | 4 | 2237 | Risk Ratio (M‐H, Fixed, 95% CI) | 0.97 [0.88, 1.07] |
| 2.1 Iron | 4 | 1801 | Risk Ratio (M‐H, Fixed, 95% CI) | 0.87 [0.74, 1.02] |
| 2.2 No iron | 2 | 436 | Risk Ratio (M‐H, Fixed, 95% CI) | 1.09 [0.96, 1.23] |
| 3 Mean change in Hb (baseline to 12 weeks) Show forest plot | 4 | 1672 | Mean Difference (IV, Fixed, 95% CI) | 0.32 [0.19, 0.45] |
| 3.1 Iron | 3 | 1341 | Mean Difference (IV, Fixed, 95% CI) | 0.30 [0.15, 0.45] |
| 3.2 No iron | 2 | 331 | Mean Difference (IV, Fixed, 95% CI) | 0.38 [0.12, 0.65] |
| 4 Mean Hb at 12 weeks Show forest plot | 4 | 1672 | Mean Difference (IV, Random, 95% CI) | 0.35 [0.06, 0.64] |
| 4.1 Iron | 3 | 1341 | Mean Difference (IV, Random, 95% CI) | 0.24 [0.08, 0.40] |
| 4.2 No iron | 2 | 331 | Mean Difference (IV, Random, 95% CI) | 0.57 [‐0.10, 1.23] |
| Outcome or subgroup title | No. of studies | No. of participants | Statistical method | Effect size |
| 1 All cause mortality plus hospital admissions at 6 months Show forest plot | 3 | 3160 | Risk Ratio (M‐H, Fixed, 95% CI) | 0.90 [0.71, 1.13] |
| 1.1 High endemicity | 2 | 1960 | Risk Ratio (M‐H, Fixed, 95% CI) | 0.92 [0.71, 1.19] |
| 1.2 Low endemicity | 1 | 1200 | Risk Ratio (M‐H, Fixed, 95% CI) | 0.78 [0.43, 1.44] |
| 2 Children with anaemia at 12 weeks Show forest plot | 4 | 2237 | Risk Ratio (M‐H, Fixed, 95% CI) | 0.97 [0.88, 1.07] |
| 2.1 High endemicity | 2 | 709 | Risk Ratio (M‐H, Fixed, 95% CI) | 1.02 [0.90, 1.15] |
| 2.2 Low endemicity | 2 | 1528 | Risk Ratio (M‐H, Fixed, 95% CI) | 0.89 [0.74, 1.07] |
| 3 Mean change in Hb (baseline to 12 weeks) Show forest plot | 4 | 1672 | Mean Difference (IV, Fixed, 95% CI) | 0.32 [0.19, 0.45] |
| 3.1 High endemicity | 2 | 641 | Mean Difference (IV, Fixed, 95% CI) | 0.35 [0.17, 0.53] |
| 3.2 Low endemicity | 2 | 1031 | Mean Difference (IV, Fixed, 95% CI) | 0.29 [0.10, 0.48] |
| 4 Mean Hb at 12 weeks Show forest plot | 4 | 1672 | Mean Difference (IV, Random, 95% CI) | 0.35 [0.06, 0.64] |
| 4.1 High endemicity | 2 | 641 | Mean Difference (IV, Random, 95% CI) | 0.44 [‐0.03, 0.91] |
| 4.2 Low endemicity | 2 | 1031 | Mean Difference (IV, Random, 95% CI) | 0.20 [0.01, 0.40] |
| Outcome or subgroup title | No. of studies | No. of participants | Statistical method | Effect size |
| 1 Children with anaemia at 12 weeks Show forest plot | 1 | 138 | Risk Ratio (M‐H, Fixed, 95% CI) | 0.96 [0.75, 1.23] |
| 2 Mean change in Hb (baseline to 12 weeks) Show forest plot | 1 | 138 | Mean Difference (IV, Fixed, 95% CI) | 0.0 [‐0.48, 0.48] |
| 3 Mean Hb at 12 weeks Show forest plot | 1 | 138 | Mean Difference (IV, Fixed, 95% CI) | ‐0.10 [‐0.65, 0.45] |