Vilanterol dan fluticasone furoate untuk rawatan asma
Abstract
Background
Vilanterol (VI) is a long‐acting beta2‐agonist (LABA) that binds to the beta2‐adrenoceptor on the airway smooth muscle, producing bronchodilation. LABA therapy, which is well established in adults as part of the British Thoracic Society (BTS) Guidelines for the Management of Asthma, leads to improvement in symptoms and lung function and reduction in exacerbations. At present, the commonly used LABAs licensed for use in asthma management (formoterol and salmeterol) require twice‐daily administration, whereas VI is a once‐daily therapy.
Fluticasone furoate (FF) is an inhaled corticosteroid (ICS), and ICS therapy is recommended by the BTS asthma guidelines. ICSs, the mainstay of asthma treatment, lead to a reduction in both airway inflammation and airway hyper‐responsiveness. Regular use leads to improvement in symptoms and lung function. ICSs are currently recommended as 'preventer' therapy for patients who use a 'reliever' medication (e.g. short‐acting beta2 agonist (SABA), salbutamol) three or more times per week. Most of the commonly used ICS treatments are twice‐daily medications, although two once‐daily products are currently licensed (ciclesonide and mometasone).
At the present time, only one once‐daily ICS/LABA combination (FF/VI) is available, and several other combination inhalers are recommended for twice‐daily administration.
Objectives
To compare effects of VI and FF in combination versus placebo, or versus other ICSs and/or LABAs, on acute exacerbations and on health‐related quality of life (HRQoL) in adults and children with chronic asthma.
Search methods
We searched the Cochrane Airways Group Register of trials, clinical trial registries, manufacturers' websites and reference lists of included studies up to June 2016.
Selection criteria
We included randomised controlled trials (RCTs) of adults and children with a diagnosis of asthma. Included studies compared VI and FF combined versus placebo, or versus other ICSs and/or LABAs. Our primary outcomes were health‐related quality of life, severe asthma exacerbation, as defined by hospital admissions or treatment with a course of oral corticosteroids, and serious adverse events.
Data collection and analysis
Two review authors independently extracted data and analysed outcomes using a fixed‐effect model. We used standard Cochrane methods.
Main results
We identified 14 studies that met our inclusion criteria, with a total of 6641 randomised participants, of whom 5638 completed the study. All studies lasted between two and 78 weeks and showed good methodological quality overall.
We included 10 comparisons in this review, seven for which the dose of VI and FF was 100/25 mcg (VI/FF 100/25 mcg vs placebo; VI/FF 100/25 mcg vs same dose of FF; VI/FF 100/25 mcg vs same dose of VI; VI/FF 100/25 mcg vs fluticasone propionate (FP) 500 mcg twice‐daily; VI/FF 100/25 mcg vs fluticasone propionate/salmeterol (FP/SAL) 250/50 mcg twice‐daily; VI/FF 100/25 mcg vs FP/SAL 250/25 mcg twice‐daily; FF/VI 100/25 vs FP/SAL500/50) and three for which the dose of VI and FF was 200/25 mcg (VI/FF 200/25 mcg vs placebo; VI/FF 200/25 mcg vs FP 500 mcg; VI/FF 200/25 mcg vs same dose of FF).
We found very few opportunities to combine results from the 14 included studies in meta‐analyses. We tabulated the data for our pre‐specified primary outcomes. In particular, we found insufficient information to assess whether once‐daily VI/FF was better or worse than twice‐daily FP/SAL in terms of efficacy or safety.
Only one of the 14 studies looked at health‐related quality of life when comparing VI and FF 100/25 mcg versus placebo and identified a significant advantage of VI/FF 100/25 mcg (mean difference (MD) 0.30, 95% confidence interval (CI) 0.14 to 0.46; 329 participants); we recognised this as moderate‐quality evidence. Only two studies compared VI/FF 100/25 mcg versus placebo with respect to exacerbations; both studies reported no exacerbations in either treatment arm. Five studies (VI/FF 100/25 mcg vs placebo) sought information on serious adverse events; all five studies reported no serious adverse events in the VI/FF 100/25 mcg or placebo arms. We found no comparison relevant to our primary outcomes for VI/FF at a higher dose (200/25 mcg) versus placebo.
The small number of studies contributing to each comparison precludes the opportunity to draw robust conclusions for clinical practice. These studies were not of sufficient duration to allow conclusions about long‐term side effects.
Authors' conclusions
Some evidence suggests clear advantages for VI/FF, in combination, compared with placebo, particularly for forced expiratory volume in one second (FEV1) and peak expiratory flow; however, the variety of questions addressed in the included studies did not allow review authors to draw firm conclusions. Information was insufficient for assessment of whether once‐daily VI/FF was better or worse than twice‐daily FP/SAL in terms of efficacy or safety. It is clear that more research is required to reduce the uncertainties that surround interpretation of these studies. It will be necessary for these findings to be replicated in other work before more robust conclusions are revealed. Only five of the 13 included studies provided data on health‐related quality of life, and only six recorded asthma exacerbations. Only one study focused on paediatric patients, so no conclusions can be drawn for the paediatric population. More research is needed, particularly in the primary outcome areas selected for this review, so that we can draw firmer conclusions in the next update of this review.
PICO
Ringkasan bahasa mudah
Vilanterol dan fluticasone furoate untuk rawatan asma kronik dalam kalangan kanak‐kanak dan orang dewasa.
Soalan ulasan
Kami mempertimbangkan dalam ulasan ini sama ada kombinasi vilanterol (VI) dan fluticasone furoate (FF) adalah lebih baik daripada plasebo dalam kalangan orang yang mengidap asma. Kami juga membandingkan VI dan FF dengan steroid sedutan lain dan ubat‐ubat agonis beta2 yang bertindak lama.Kami juga membandingkan VI dan FF dengan steroid sedutan lain dan ubat‐ubat agonis beta2 yang bertindak lama.
Latarbelakang
Asma adalah sejenis keradangan paru‐paru di mana saluran pernafasan menjadi sempit. Sehingga tahun 2025, dianggarkan 400 juta orang akan mengalami keadaan ini. Asma boleh mempengaruhi kualiti hidup pengidapnya secara serius, dan kombinasi VI dengan FF boleh membantu mengurangkan impak sesak nafas dan simptom‐simptom berkaitannya dalam kehidupan seharian penghidapnya.
Ciri‐ciri kajian
Kami memasukkan 14 kajian melibatkan 6641 peserta di dalam ulasan ini. Tempoh kesemua kajian adalah di antara dua dan 78 minggu. Kesemua peserta kajian telah didiagnos mengalami asma. Kajian melibatkan kedua‐dua lelaki dan wanita; dan satu kajian melibatkan kanak‐kanak serta orang muda.
Kesemua kajian mengkaji penggunaan VI dan FF berbanding dengan ubat yang lain ataupun plasebo. Di dalam kesemua kajian, kombinasi VI/FF diambil melalui sedutan debu kering.
Keputusan utama
Kami mendapati peserta yang menerima kombinasi terapi FF dan VI mempunyai peningkatan fungsi paru‐paru berbanding dengan plasebo, namun tiada bukti yang cukup untuk menyokong kesimpulan lain kerana para penyelidik telah cuba menjawab terlalu banyak persoalan. Tiada cukup bukti sama ada kombinasi terapi VI dan FF satu kali sehari adalah lebih baik atau lebih teruk daripada alternatif dua kali sehari. Lebih banyak kajian diperlukan agar dapat memahami bukti keseluruhan.
Kualiti bukti
Secara keseluruhannya, bukti yang ditunjukkan dalam ulasan ini diambil daripada kajian‐kajian yang baik yang berisiko bias rendah tentang penerima jenis rawatan, "blinding" dan bagaimana hasil keputusan peserta yang tidak dapat meneruskan kajian dilaporkan. Namun, oleh kerana keputusan beberapa kajian tidak dapat menggabungkan hasil yang kami perlukan, atau kerana hasil yang jarang ditemui, kami memutuskan kualiti kajian keseluruhan adalah rendah hingga sederhana.
Authors' conclusions
Summary of findings
| VI and FF compared with placebo for asthma | |||||
| Patient or population: people with asthma Settings: community Intervention: VI and FF Comparison: placebo | |||||
| Outcomes | Illustrative comparative risks* (95% CI) | Relative effect | Number of participants | Quality of the evidence | |
| Assumed risk | Corresponding risk | ||||
| Placebo | VI and FF | ||||
| Health‐related quality of life | 0.61 | 0.91 (SE 0.055), n = 180 | MD 0.30, 95% CI 0.14 to 0.46 | Bleecker 2012 (N = 609 participants, 515 completed study) compared VI/FF 100/25 mcg vs placebo in respect of health‐related quality of life and indicated a significant advantage for VI/FF 100/25 mcg | Moderatea |
| Asthma exacerbation | Not estimable | Only 2 studies (Allen 2013 and Kempsford 2012a) compared VI/FF 100/25 mcg vs placebo in respect of exacerbations; both studies reported no exacerbations in either treatment arm | Very lowb | ||
| Serious adverse events | Not estimable | Five trials (Allen 2013; Bleecker 2012; Kempsford 2012a; Oliver 2012; Oliver 2013) made this same comparison in relation to serious adverse events; all 5 reported no serious adverse events in VI/FF100/25 mcg or placebo arms | Very lowb | ||
| FEV1 | 0.196 L n = 193 | 0.368 L (SE 0.0304), n = 200 | MD 0.17 L, 95% CI 0.09 to 0.26 | Significant difference in favour of VI/FF 100/25 mcg vs placebo with respect to mean change in trough FEV1 (pre‐bronchodilator and pre‐dose) from baseline to week 12 in 1 trial (Bleecker 2012) (N = 609 participants, 515 completed study) (MD 0.17 L, 95% CI 0.09 to 0.26), and a similar effect was found in a small cross‐over trial (Kempsford 2012a) over a 2‐week period in the morning (MD 0.377 L, 90% CI 0.293 to 0.462) and in the evening (MD 0.422 L, 90% CI 0.337 to 0.507) | Moderatec |
| Peak expiratory flow | ‐0.4 L/min (SE 2.42), | 32.9 L/min (SE 2.42), n = 201 | MD 33.30 L/min, 95% CI 26.59 to 40.01 | Bleecker 2012 (N = 609 participants, 515 completed study) compared VI/FF 100/25 mcg vs placebo as mean change from baseline in daily morning (AM) PEF averaged over 12‐week treatment period; researchers noted a significant difference in favour of VI/FF 100/25 mcg (MD 33.30 L/min, 95% CI 26.59 to 40.01). The same trial showed a similar advantage in favour of VI/FF 100/25 mcg vs placebo in the evening over this period (28.20 L/min, 95% CI 21.67 to 34.73). A small cross‐over trial (Kempsford 2012a) produced a similar effect in favour of VI/FF 100/25 mcg vs placebo over a 2‐week period in the morning (MD 44.0 L/min, 90% CI 31.2 to 56.9) and in the evening (MD 69.0 L/min, 90% CI 55.9 to 82.1) | Moderatec |
| Asthma symptoms | 14.6 (SE 2.15), n = 202 | 32.5 (SE 2.14), n = 201 | MD 17.90, 95% CI 11.95 to 23.85 | Only 1 trial (Bleecker 2012) (N = 609 participants, 515 completed study) made VI/FF vs placebo comparison with respect to asthma symptoms, indicating a clear advantage for VI/FF 100/25 mcg | Moderatea |
| Adverse events | Not estimable | Several trials reported a range of adverse events for which overall aggregation was not possible. These are tabulated in Table 8 | Moderated | ||
| *The basis for the assumed risk (e.g. median control group risk across studies) is provided in footnotes. The corresponding risk (and its 95% confidence interval) is based on the assumed risk in the comparison group and the relative effect of the intervention (and its 95% CI) | |||||
| GRADE Working Group grades of evidence | |||||
| aPoint deducted to reflect that these data were derived from only one trial bInvestigators reported no events in either arm of these trials cPoint deducted to reflect that data contributing to the main result (MD 0.17 L, 95% CI 0.09 to 0.26) were obtained from only one trial dPoint deducted, as we were unable to combine data on this outcome; results are presented in a separate table | |||||
| Study | FF/VI 100/25 mcg | FF 100 mcg | FF 200 mcg | FF/VI 200/25 mcg | VI 25 mcg | FP/SAL 250/50 mcg twice‐daily | FP 500 mcg | Prednisolone 10 mg | Placebo |
| 6 weeks' duration. On‐treatment AEs | 23/56 (41.00%) | ‐ | ‐ | 21/56 (38.00%) | ‐ | ‐ | ‐ | 5/15 (33.00%) | 16/58 (28.00%) |
| ≥24 to 78 weeks' duration. On‐treatment AEs | 636/1009 (63.00%) | 652/1010 (65.00%) | ‐ | ‐ | ‐ | ‐ | ‐ | ‐ | ‐ |
| 12 weeks' duration | 54/346 (15.61%) | 67/347 (19.31%) | ‐ | 52/346 (15.03%) | ‐‐ | ‐ | ‐ | ‐ | |
| 12 weeks' duration | 29/201 (14.43%) | 20/205 (9.76%) | ‐ | ‐ | ‐ | ‐ | ‐ | ‐ | 22/203 (10.84%) |
| 52 weeks' duration. On‐treatment AEs | 139/201 (69.15%) | ‐ | ‐ | 134/202 (66.34%) | ‐ | ‐ | 73/100 (73.00%) | ‐ | ‐ |
| Cross‐over trial. 3 of 7 treatments (2 weeks) separated by 12 to 14‐day washout periods | 43/172 (25%) | 25/187 (13%) | ‐ | ‐ | ‐ | ‐ | ‐ | ‐ | ‐ |
| 12 weeks' duration. Any AE | ‐ | ‐ | ‐ | 40/155 (26.00%) | ‐ | ‐ | 41/154 (27.00%) | ‐ | ‐ |
| Cross‐over trial. Each period lasted 14 days with a 14 to 21‐day washout period between periods | 11/24 (45.83%) AM 12/25 (48.00%) PM | ‐ | ‐ | ‐ | ‐ | ‐ | ‐ | ‐ | 8/23 (34.78%) |
| 24 weeks' duration | ‐ | ‐ | 66/194 (34.02%) | 62/197 (31.47%) | ‐ | ‐ | 73/195 (37.44%) | ‐ | ‐ |
| Cross‐over trial. 11 weeks (for a single period) | 4/25 (16.00%) | 1/25 (4.00%) | ‐ | ‐ | ‐ | ‐ | ‐ | ‐ | ‐ |
| Cross‐over trial. 28 days for each period | 11/51 (21.57%) | 18/51 (35.29%) | ‐ | ‐ | ‐ | ‐ | ‐ | ‐ | 15/51 (29.41%) |
| Cross‐over trial. 21 days | 20/27 (74.07%) | 19/27 (70.37%) | ‐ | ‐ | 22/26 (84.62%) | ‐ | ‐ | ‐ | 19/27 (70.37%) |
| 24 weeks' duration | 110/403 (27.30%) | ‐ | ‐ | ‐ | ‐ | 106/403 (26.30%) | ‐ | ‐ | ‐ |
| Fractions shown in the table indicate the proportions of people who suffered one or more adverse events of any cause in each treatment arm AE: adverse event; F: fluticasone furoate; FP: fluticasone propionate; SAL: salmeterol; VI: vilanterol | |||||||||
Background
Description of the condition
Asthma, a chronic respiratory disease, may be well controlled at times, but periods of marked deterioration in symptoms and lung function (referred to as an exacerbation) may abruptly occur. Currently, the number of people with asthma is estimated at 300 million, and forecasts suggest that by 2025, the total will be closer to 400 million (WHO 2007). Between 2001 and 2009, the number of people with asthma increased from 20 million to 25 million in the United States, where prevalence rates are slightly lower among adults (8%) than children (10%) (CDC 2012; CDCP 2011). Considerable differences in asthma prevalence have been noted among different ethnic groups. Between 2008 and 2010, US rates were as follows: multiple‐race 14.1%, Alaskan Native 9.4%, American Indian 9.4%, black 11.2%, white 7.7% and Asian 5.2% (CDCP 2011). The prevalence of wheezing symptoms in children varies geographically, with the UK having the highest recorded prevalence of current wheezing at 32.3%, and Ethiopia the lowest at 1.7% (Patel 2008).
Asthma is associated with impaired quality of life (Clayton 2005), and the condition presents financial implications (Wu 2007). Each year, asthma exacerbations impact approximately 10 million people in the USA (Krishnan 2006). Other countries report similarly high incidence rates; in the UK, more than 65,000 hospital admissions for asthma occurred in the period from 2005 to 2006 (NHS 2011). Well‐recognised factors can be addressed to prevent hospital admissions in children with acute asthma (Ordonez 1998). In recent years, evidence‐based clinical guidelines have emerged, at both national (e.g. BTS/SIGN 2014; NIH 2007) and international (e.g. GINA 2015) levels, to provide guidance for the management of asthma. Asthma is a consequence of airways inflammation, but with appropriate clinical management, health‐related quality of life can be maintained for considerable periods (WHO 2011). Mortality specifically associated with both asthma and asthma morbidity is a major health concern (Braman 2006).
Description of the intervention
Asthma is a chronic inflammatory disorder of the airways that is characterised by reversible airways obstruction. A combination of inhaled corticosteroid (ICS) and long‐acting beta2‐agonist (LABA) is recommended for patients at step three of the British Thoracic Society guidelines, that is, patients not controlled by ICS alone. Evidence suggests that addition of a LABA to ICS alone can lead to improved lung function, improved symptoms, reduced use of rescue medications and reduced asthma exacerbations among patients with uncontrolled symptoms (BTS/SIGN 2014). Although generally less effective, the combination of ICS and a leukotriene antagonist (LTRA) is a valid alternative to ICS combined with LABA (Montuschi 2008; Montuschi 2010).
Inhaled corticosteroids are fundamental in the treatment of asthma, and fluticasone furoate (FF) belongs to this class of drugs. Inhaled corticosteroids work by reducing inflammation and airway hyper‐responsiveness (Barnes 1998), thus improving symptoms of asthma and lung function (Montuschi 2011). Most available ICS' are administered twice‐daily, and studies have shown that once‐daily use is less effective and leads to an increase in the requirement for rescue medication (BTS/SIGN 2014; Weiner 1995).
Vilanterol (VI) is a new drug that belongs to the LABA class. It has a rapid onset of action in experimental models and a 24‐hour duration of bronchodilating effects in patients with asthma (Fuso 2013). Long‐acting beta2‐agonist therapy added to ICS treatment in asthma has been shown to improve lung function, reduce asthma symptoms and decrease exacerbation rates (Remington 2005). Available LABAs licensed for the treatment of patients with asthma require twice‐daily administration. Indacaterol and olodaterol are approved for chronic obstructive pulmonary disease (COPD) and require once‐daily administration.
At the present time, several combination inhalers containing both ICS and LABA are available for the treatment of adults with asthma. However, all of these involve twice‐daily dosing, which is less convenient for patients and leads to reduced adherence with long‐term therapy. Clinicians anticipate that providing a once‐daily combination inhaler would lead to increased adherence with treatment long‐term among people with asthma.
Investigators have provided few data on once‐daily combination treatments other than VI and FF for asthma. A 12‐week randomised controlled double‐blind study of 531 children aged six to 15 years showed that taking a single inhaler containing budesonide and formoterol once‐daily maintained pulmonary function, but taking the same inhaler twice‐daily resulted in improved pulmonary function, fewer discontinuations for worsening asthma and less need for daytime rescue medication (Eid 2010). Once‐daily budesonide/formoterol has shown improved asthma control when compared with once‐daily budesonide alone (at a four times higher dose) in children four to 11 years of age (Bisgaard 2006).
How the intervention might work
Inhaled corticosteroids serve as the cornerstone of asthma treatment and are initiated when patients require use of short‐acting ‘reliever’ medications on a regular basis. As well as the benefits mentioned previously, patients who are compliant with ICS therapy demonstrate a reduction in asthma exacerbations and in mortality related to asthma (Powell 2003). It is well recognised that poor adherence is a major issue among patients with poorly controlled symptoms (BTS/SIGN 2014). One of the issues that may contribute to this is the twice‐daily dosing regimen of most ICS'.
Fluticasone furoate is a relatively new long‐acting ICS. It remains active for at least 24 hours after administration. Early studies have shown improvement in lung function tests and a favourable safety and tolerability profile (Bleecker 2011; Woodcock 2011).
In recent years, investigators have provided increasing evidence for the addition of LABAs to ICS therapy for the treatment of patients with asthma, and the benefit appears to consist of more than bronchodilatation alone. The action of corticosteroids is mediated by cytoplasmic glucocorticoid receptors (GRs); after binding with corticosteroids, GRs translocate to the nucleus, where they are able to regulate gene expression (Montuschi 2011). Long‐acting beta2‐agonists have also been shown to induce GR nuclear translocation, although not as effectively as glucocorticoids. Study of sputum epithelial cells and macrophages of people with asthma has shown that the LABA, salmeterol, given in combination with fluticasone propionate (FP), was more effective than low‐dose FP alone in enhancing GR nuclear translocation (Usmani 2005).
Interleukin‐8 (IL‐8) is a chemokine that has been implicated in the abnormal airway inflammation seen in patients with asthma; studies have shown that study participants with clinically stable asthma have higher levels of IL‐8 in bronchoalveolar lavage samples than normal healthy control participants (Nocker 1996). A study looking at IL‐8 production from neutrophils stimulated by cigarette smoke reported that salmeterol and FP additively suppressed IL‐8 release from neutrophils when compared with either agent alone. This effect is not seen in all human cell types and appears to be cell‐specific. The mechanism of action is not yet clear, but researchers have suggested that increased translocation of GRs to the nucleus may be involved (Mortaz 2008).
For patients whose condition is uncontrolled by regular ICS therapy, current British Thoracic Society (BTS) guidelines recommend the addition of a LABA, such as salmeterol or formoterol (BTS/SIGN 2014). Both of these medications have a twice‐daily dosing regimen that affects adherence and, therefore, asthma control. Long‐acting beta2‐agonists are of benefit because of their bronchodilation effect, and VI is a new selective beta2‐agonist within this class (Cazzola 2011). It has been shown that VI is well tolerated with no significant adverse effects (Kempsford 2013), and that it leads to an increase in symptom‐free periods and a reduction in the use of rescue medication (Lotvall 2012).
In summary, limited studies suggest that effective once‐daily ICS and LABA therapy would allow a once‐daily dosing regimen (e.g. Kuna 2006), leading to the possibility of increased adherence and improved asthma control in adults and in children.
Why it is important to do this review
Published randomised trials have examined use of VI and FF in combination. This review aims to establish whether VI combined with FF may play a positive role in the management of chronic asthma among children and adults. This is important to determine, as a VI/FF combination would consist of a once‐daily medication. This dosing regimen may lead to increased medication adherence, improved health‐related quality of life (HRQoL) and reduced asthma exacerbations and symptoms.
Objectives
To compare effects of VI and FF in combination versus placebo, or versus other ICSs and/or LABAs, on acute exacerbations and on HRQoL in adults and children with chronic asthma.
Methods
Criteria for considering studies for this review
Types of studies
We included randomised controlled trials (RCTs) reported as full text, those published as abstract only and unpublished data.
Types of participants
We included studies involving adults and children with a diagnosis of asthma. We excluded participants with the following co‐morbidities: co‐existing chronic disease such as smoking‐related COPD, congenital heart disease and diseases such as cystic fibrosis and chronic renal failure. We also excluded people who are current smokers and pregnant women.
Types of interventions
We planned to include studies comparing the following interventions.
-
VI and FF versus placebo.
-
VI and FF versus ICS and required short‐acting beta2‐agonist (SABA).
-
VI and FF versus other combination inhalers.
-
VI and FF versus ICS and LABA in separate inhalers.
We also planned to include the following co‐interventions, provided they were not part of the randomised treatment: bronchodilators, systemic steroids, leukotriene antagonists, oral aminophylline and macrolide antibiotics.
Types of outcome measures
Primary outcomes
-
Health‐related quality of life.
-
Severe asthma exacerbation as defined by hospital admission or treatment with a course of oral corticosteroids (OCS)
-
Serious adverse event*.
Secondary outcomes
-
Measures of lung function: forced expiratory flow in one second (FEV1), peak expiratory flow (PEF).
-
Asthma symptoms.
-
Adverse events/side effects.
A study report describing one or more of the outcomes listed here was not an inclusion criterion for the review.
*Defined as any adverse event or adverse reaction that results in death, is life‐threatening, requires hospitalisation or prolongation of existing hospitalisation or results in persistent or significant disability or incapacity.
Search methods for identification of studies
Electronic searches
We identified studies by searching the Cochrane Airways Group Specialised Register (CAGR), which is maintained by the Information Specialist for the Group. The Register contains trial reports identified through systematic searches of bibliographic databases, including the Cochrane Central Register of Controlled Trials (CENTRAL), MEDLINE, Embase, the Cumulative Index to Nursing and Allied Health Literature (CINAHL), the Allied and Complementary Medicine Database (AMED) and PsycINFO, and by handsearching of respiratory journals and meeting abstracts (please see Appendix 1 for further details). We searched all records in the CAGR using the search strategy presented in Appendix 2.
We also conducted a search of ClinicalTrials.gov (www.clinicaltrials.gov) and the World Health Organization (WHO) trials portal (www.who.int/ictrp/en/). We searched all databases from their inception to 24 June 2016, and we imposed no restriction on language of publication.
Searching other resources
We checked the reference lists of all primary studies and review articles for additional references. We searched relevant manufacturers' websites for trial information.
We searched on 24 June 2015 for errata or retractions from included studies published in full text on PubMed (www.ncbi.nlm.nih.gov/pubmed).
Data collection and analysis
Selection of studies
Two review authors (LB, NW) independently screened the titles and abstracts of all studies identified for possible inclusion as a result of the search and coded them as 'retrieve' (eligible or potentially eligible/unclear) or 'do not retrieve'. We retrieved full‐text study reports/publications, and two review authors (LB, NW) independently screened the full text, identified studies for inclusion and identified and recorded reasons for exclusion of ineligible studies. We planned to resolve disagreements through discussion or, if required, by consultation with a third review author (CP); however, this was not necessary. We identified and excluded duplicates and collated multiple reports of the same study, so that each study rather than each report was the unit of interest in the review. We recorded the selection process in sufficient detail to complete a PRISMA (Preferred Reporting Items for Systematic Reviews and Meta‐Analyses) flow diagram (Figure 1) and entered data regarding all studies into the Characteristics of included studies table.

Study flow diagram.
Data extraction and management
We used a data collection form that had been piloted on at least one study in the review to record study characteristics and outcome data. Two review authors (CP, SJM) extracted study characteristics from reports of included studies. We extracted the following study characteristics.
-
Methods: study design, total duration of study, details of any 'run‐in' period, number of study centres and locations, study settings, withdrawals and date of study.
-
Participants: number (N), mean age, age range, gender, severity of condition, diagnostic criteria, baseline lung function, smoking history, inclusion criteria and exclusion criteria.
-
Interventions: intervention, comparison, concomitant medications and excluded medications.
-
Outcomes: primary and secondary outcomes specified and collected and time points reported.
-
Notes: funding for trial and notable conflicts of interest of trial authors.
Two review authors (CP, SJM) independently extracted outcome data from the included studies. We noted in the Characteristics of included studies table if outcome data were not reported in a useable way. We planned to resolve disagreements by consensus or by consultation with a third review author (NW); however, this was not necessary. One review author (KD) transferred data into the Review Manager (Review Manager 2014) file. We double‐checked that data were entered correctly by comparing data presented in the systematic review with those provided in study reports. A second review author (SJM) spot‐checked study characteristics for accuracy against the trial report.
Assessment of risk of bias in included studies
Two review authors (CP, SJM) independently assessed risk of bias for each study using the criteria outlined in the Cochrane Handbook for Systematic Reviews of Interventions (Higgins 2011). We planned to resolve disagreements by discussion or by consultation with another review author (KD); however, this was not necessary. We assessed risk of bias according to the following domains.
-
Random sequence generation.
-
Allocation concealment.
-
Blinding of participants and personnel.
-
Blinding of outcome assessment.
-
Incomplete outcome data.
-
Selective outcome reporting.
-
Other bias.
We graded each potential source of bias as high, low or unclear, and provided a quote from the study report together with a justification for our judgement in the 'Risk of bias' table. We summarised risk of bias judgements across different studies for each of the domains listed. We considered blinding separately for different key outcomes when necessary (e.g. for unblinded outcome assessment, risk of bias for all‐cause mortality may be very different than for a patient‐reported pain scale). When information on risk of bias was related to unpublished data or to correspondence with a trialist, we noted this in the 'Risk of bias' table.
When considering each treatment effect,we took into account the risk of bias for studies that contributed to that outcome.
Assessment of bias in conducting the systematic review
We conducted the review according to this published protocol and reported any deviations from it in the Differences between protocol and review section of the systematic review.
Measures of treatment effect
We planned to analyse dichotomous data as odds ratios (ORs) and continuous data as mean differences (MDs) or standardised mean differences (SMDs), and to present them with 95% confidence intervals (CIs). We entered data presented as a scale with a consistent direction of effect.
We undertook meta‐analyses only when data were available, and when it was meaningful to do so (i.e. when treatments, participants and the underlying clinical question were similar enough for pooling to make sense).
We will narratively describe skewed data reported as medians and interquartile ranges if reported for future updates of this review.
When a single trial reported multiple trial arms, we included only the relevant arms.
Unit of analysis issues
We identified cross‐over trials and sought data for a paired analysis from the trial report or study authors to appropriately include data in the review using the inverse variance method. However, this was unsuccessful, and we provided the data in additional tables. We identified no cluster‐randomised trials, but future versions of this review will analyse data at the level of the individual while allowing for clustering in the data by using the intracluster correlation co‐efficient. If this is not reported in the trial, we will impute it from similar studies.
Dealing with missing data
We planned to contact investigators or study sponsors to verify key study characteristics and to obtain missing numerical outcome data when possible (e.g. when a study is identified as abstract only) when uncertainties arise during completion of the study. In practice for this review, we had to do this with only one of the study authors.
Assessment of heterogeneity
We visually assessed statistical heterogeneity between studies by inspecting forest plots and using the Chi2 test (P value < 0.1 was considered significant owing to the low power of the test). We calculated the I2 statistic, which describes the percentage of variability in effect estimates that is due to heterogeneity rather than to sampling error (chance). Values of I2 range from 0 to 100, with 0 representing no heterogeneity and 100 representing considerable heterogeneity.
For this review:
-
0% to 40%: Heterogeneity might not be important;
-
30% to 60%: may represent moderate heterogeneity;
-
50% to 90%: may represent substantial heterogeneity; and
-
75% to 100%: shows considerable heterogeneity.
Assessment of reporting biases
If we cannot pool more than 10 studies for a future update of this review, we will create and examine a funnel plot to explore possible small‐study biases and publication bias.
Data synthesis
We used a fixed‐effect model and performed a sensitivity analysis with a random‐effects model when heterogeneity was substantial.
We will combine data on outcomes at six months and at 12 months in future versions of this review if sufficient data become available. We will describe other time points when data become available.
'Summary of findings' table
We created a 'Summary of findings' table by using the following outcomes.
-
Health‐related quality of life.
-
Asthma exacerbation as defined by hospital admission or treatment with a course of OCS.
-
Serious adverse events.
-
Adverse events/side effects.
We used the five GRADE (Grades of Recommendation, Assessment, Development and Evaluation Working Group) considerations (study limitations, consistency of effect, imprecision, indirectness and publication bias) to assess the quality of a body of evidence as it relates to studies that contribute data to the meta‐analyses for pre‐specified outcomes. We followed the methods and recommendations described in Section 8.5 and Chapter 12 of the Cochrane Handbook for Systematic Reviews of Interventions (Higgins 2011) and used GRADEpro software. We justified all decisions to downgrade or upgrade the quality of studies by using footnotes; we included comments to aid the reader's understanding of the review when necessary.
Subgroup analysis and investigation of heterogeneity
We planned to carry out the following subgroup analyses.
-
Age (nought to five years, six to 16 years, 16 plus years).
We planned to use the following outcomes in subgroup analyses.
-
Health‐related quality of life.
-
Asthma symptoms.
We planned to use the formal test for subgroup interactions in Review Manager (Review Manager 2014), but sufficient data were not available.
Sensitivity analysis
We planned to carry out the following sensitivity analyses, but sufficient data were not available.
-
Excluding studies with an overall high risk of bias.
-
Excluding cross‐over trials and cluster‐randomised trials.
-
Using a random‐effects model.
Results
Description of studies
Results of the search
We identified 29 records through electronic searches conducted in October 2013, and we identified 15 similar records in October 2014, together with eight additional records in October 2015 and an additional nine in June 2016, yielding a total of 59 records obtained from electronic searches. Additional searches from trial registries provided 20 additional records (Figure 1).
Thirty‐eight records (representing 14 studies) met our criteria for inclusion; we have described these in the Characteristics of included studies table.
We excluded 29 records (representing 20 studies) and listed our reasons for exclusion in the Characteristics of excluded studies table.
We identified 12 ongoing studies and provided details of these studies in the Characteristics of ongoing studies table.
Included studies
In all, 14 studies met our criteria for inclusion, with a total of 6641 randomised participants, of whom 5638 completed the study (Characteristics of included studies). Eight of these studies included both adolescents and adults (12 years of age and older): Allen 2013; Bateman 2014; Bernstein 2014; Bleecker 2012; Busse 2013; Lin 2013; NCT01134042; Woodcock 2013. Five studies recruited only adult participants (18 years of age and older): Hojo 2015; Kempsford 2012; Lee 2014; Oliver 2012; Oliver 2013, and one study recruited only paediatric participants (between five and 11 years of age): NCT01453023.
We noted considerable variation in the range of comparisons presented in the eight studies that included both adolescents and adults (12 years of age and older).
-
One compared FF/VI 100/25 mcg versus FF/VI 200/25 mcg versus placebo versus prednisolone (Allen 2013).
-
One compared FF/VI 100/25 mcg versus FF 100 mcg (Bateman 2014).
-
One compared FF/VI 100/25 mcg versus FF/VI 200/25 mcg and versus FF 100 mcg (Bernstein 2014).
-
One compared FF/VI 100/25 mcg versus FF 100 mcg and versus placebo (Bleecker 2012).
-
One compared FF/VI 100/25 mcg versus FF/VI 200/25 mcg and versus FP 500 mcg (Busse 2013).
-
One compared FF/VI 200/25 mcg versus FP 500 mcg (Lin 2013).
-
One compared FF 200 mcg versus FF/VI 200/25 mcg and versus FP 500 mcg (NCT01134042).
-
One compared FF/VI 100/25 mcg versus FP/salmeterol (SAL) 250/50 mcg (Woodcock 2013).
We observed similar variation in the range of comparisons presented in the five studies that included only adults.
-
One compared FF/VI 100/25 versus FP/SAL500/50 (Hojo 2015).
-
One compared FF/VI 100/25 mcg AM versus FF/VI 100/25 mcg PM and versus placebo (Kempsford 2012).
-
One compared FF 100 mcg versus FF/VI 100/25 mcg and versus placebo (Oliver 2012).
-
One compared FF 100 mcg versus FF/VI 100/25 mcg and versus umeclidinium (Lee 2014).
-
One compared FF/VI 100/25 mcg versus FF 100 mcg and versus placebo versus VI 25 mcg (Oliver 2013).
The study that included only children presented the following comparison.
-
FF/VI 100/25 mcg versus FF 100 mcg (NCT01453023).
We have provided additional detailed information on the included studies in the Characteristics of included studies table and in Table 1.
| Study | Duration (weeks) | Severity at baseline | Inclusion criteria | Adverse events |
| 6 | Reversibility > 12%
FEV1 > 50% of predicted | Adults Comply with treatment
Clinical diagnosis of asthma for ≥ 12 weeks | Cortisol urinary excretion, serum AUC and trough | |
| 24 to 78 | Reversibility > 12%
FEV1 > 50% to 90% of predicted | Adults Using ICS
History of ≥ 1 exacerbation requiring hospitalisation or steroids in the past year | None | |
| 12 | Reversibility > 12% FEV1 50% to 80% of predicted | ICS for > 12 weeks before study
> 12 years of age | Yes, not clear | |
| 12 | Pre‐bronchodilator FEV1 40% to 90% of predicted normal Reversibility FEV1 ≥ 12% | ICS for 12 weeks before study
> 12 years of age | Details not stated | |
| 52 | Pre‐bronchodilator FEV1 40% to 90% of predicted normal Reversibility FEV1 ≥ 12%
| Adults Clinical diagnosis of asthma
ICS at high dose | Details not stated | |
| 4 | ACT suggesting poor control and FEV1 mean 70% (SD 11%) | Asthma ≥ 20 years of age | No, conference abstract only | |
| 4 | Pre‐bronchodilator FEV1 40% to 80% of predicted Demonstrated reversibility by ≥ 12% | Need for regular controller therapy for minimum of 8 weeks Stable dose of ICS for ≥ 4 weeks ≥ 18 years of age Diagnosis of asthma for ≥ 6 months
| No | |
| 12 | Reversibility of disease: demonstrated ≥ 12% and FEV1 40% to 90%
| ICS, with or without LABA, for ≥ 12 weeks Clinical diagnosis of asthma for 12 weeks
Adults | No | |
| 6 to 8 | Pre‐bronchodilator FEV1 ≥ 60% of predicted.
| 18 and 70 years of age inclusive Using an ICS, with or without a SABA, for ≥ 12 weeks before screening Participants who are current non‐smokers, who have not used inhaled tobacco products in the 12‐month period preceding screening visit Body weight ≥ 50 kg and BMI within the range 19.0 to 29.9 kg/m2 | Yes, details not stated | |
| 24 | Pre‐bronchodilator FEV1 40% to 90% of predicted Reversibility FEV1 ≥ 12%
| Current asthma therapy that includes an ICS for ≥ 12 weeks before first visit Adults | Cortisol, ECG, mouth swabs, various blood parameters | |
| 14 | Mild to moderate (GINA) | Stable asthma therapy (FP, total daily dose ≤ 400 mcg or equivalent) and SABA inhaler for ≥ 4 weeks before screening 5 to 12 years of age Clinical diagnosis of asthma 6 months before Controlled asthma (Childhood ACT > 19) | Not stated | |
| 8 | Pre‐bronchodilator FEV1 > 70% of predicted at screening
Methacholine challenge PC20 < 8 mg/mL at screening
| Adults Stable asthma therapy (FP, total daily dose ≤ 400 mcg or equivalent) and SABA inhaler for ≥ 4 weeks before screening BMI within the range 18.5 to 35.0 kg/m2
| Not stated | |
| 3 with 3 weeks' washout | Pre‐bronchodilator FEV1 > 70% of predicted at screening
Methacholine challenge PC20 < 8 mg/mL at screening
| Stable asthma therapy (FP, total daily dose ≤ 400 mcg or equivalent) and SABA inhaler for ≥ 4 weeks before screening BMI within the range 18.5 to 35.0 kg/m2 Adults | Not stated | |
| 24 | Reversibility ≥ 12% and 200 mL within 10 to 40 minutes following 2 to 4 inhalations of albuterol FEV1 40% to 85% predicted normal | Currently using ICS therapy Clinical diagnosis of asthma Adults | Not stated |
ACT: Asthma Control Test
AUC: area under the curve
BMI: body mass index
ECG: electrocardiogram
FEV1: forced expiratory volume in one second
FP: fluticasone propionate
GINA: Global Initiative for Asthma
ICS: inhaled corticosteroid
LABA: long‐acting beta2‐agonist
PC20: provocative concentration of methacholine estimated to result in a 20% reduction in FEV1
SABA: short‐acting beta2‐agonist
Excluded studies
We excluded 20 studies for the following reasons: Participants in the study did not have a diagnosis of asthma (N = 9, 45%); the ICS used in the study was not FF (N = 3, 15%); pooled analysis included data from the clinical trials (N = 2, 10%); study was withdrawn before participants were enrolled (N = 1, 5%); VI and FF were not used together in the intervention arm (N = 1, 5%); focus of trial was on VI and FP, not on VI and FF (N = 1, 5%) and evaluation of dry powder inhaler (DPI) (N = 1, 5%); trial compared budesonide/formoterol maintenance and reliever therapy versus FF/VI (N = 1, 5%); and study evaluated exhaled nitric oxide time profile as a biomarker of airway Inflammation (N = 1, 5%) (Characteristics of excluded studies).
Risk of bias in included studies
Allocation
We judged 12 of the included studies to be at low risk with respect to selection bias. We considered risk of selection bias in the two remaining studies (Bleecker 2012; Hojo 2015) to be unclear (Figure 2; Figure 3).
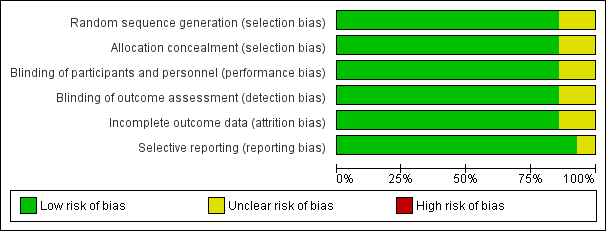
Risk of bias graph: review authors' judgements about each risk of bias item presented as percentages across all included studies.

Risk of bias summary: review authors' judgements about each risk of bias item for each included study.
Blinding
For blinding, we judged 12 of the included studies to be at low risk. For Kempsford 2012 and Hojo 2015, we judged the risk to be unclear (Figure 2; Figure 3).
Incomplete outcome data
For attrition bias, we judged 12 of the included studies to have low risk. We considered risk of selection bias in the two remaining studies (Hojo 2015; Kempsford 2012) to be unclear (Figure 2; Figure 3).
Selective reporting
For reporting bias, we judged 13 studies to be at low risk of bias; for Hojo 2015, we judged this risk to be unclear (Figure 2; Figure 3).
Effects of interventions
VI and FF 100/25 mcg versus placebo
Primary outcomes
Health‐related quality of life
See Table 2.
| Study score (change from baseline) | FF/VI 100/25 mcg Mean (SE), N | FF 100 mcg Mean (SE), N | FF 200 mcg Mean (SE), N | FF/VI 200/25 mcg Mean (SE), N | FP/SAL 250/50 mcg twice‐daily | FP 500 mcg | Placebo | MD (95% CI) |
| AQLQ change from baseline at 12 weeks | 0.91 (0.055), n = 180 | 0.76 (0.055), n = 184 | ‐ | ‐ | ‐ | ‐ | 0.61 (0.061), n = 149 | 0.15 (0.00 to 0.30), 0.30 (0.14 to 0.46), 0.15 (‐0.01 to 0.31) |
| AQLQ change from baseline at 12 weeks | ‐ | ‐ | ‐ | 0.80 (0.069), n = 140 | ‐ | 0.69 (0.074), n = 123 | ‐ | 0.12 (‐0.08 to 0.32) |
| AQLQ change from baseline at 12 weeks | ‐ | ‐ | 0.66 (0.061), n = 154 | 0.74 (0.056), n = 180 | ‐ | 0.74 (0.059), n = 163 | ‐ | ‐0.08 (‐0.24 to 0.08), ‐0.08 (‐0.25 to 0.09), 0.00 (‐0.16 to 0.16) |
| AQLQ change from baseline at 24 weeks | ‐ | ‐ | 0.88 (0.071), n = 140 | 0.93 (0.065), n = 167 | ‐ | 0.90 (0.068), n = 156 | ‐ | ‐0.05 (‐0.24 to 0.14), ‐0.02 (‐0.21 to 0.17), 0.03 (‐0.15 to 0.21) |
| AQLQ change from baseline at 168 days | 0.46 (0.043), n = 342 | ‐ | ‐ | ‐ | 0.37 (0.043), n = 335 | ‐ | ‐ | 0.09 (‐0.03 to 0.21) |
| EQ‐5D change from baseline at 168 days | 5.5 (0.60), n = 343 | ‐ | ‐ | ‐ | 4.1 (0.60), n = 349 | ‐ | ‐ | 1.4 (‐0.3 to 3.0) |
AQLQ: asthma quality of life questionnaire; CI: confidence interval; EQ‐5D: EuroQuality of Life‐5D questionnaire; FF: fluticasone furoate; FP: fluticasone propionate; MD: mean difference; SAL: salmeterol; SE: standard error; VI: vilanterol
Bleecker 2012 provided data on the change in quality of life (as measured by the Asthma Quality of Life Questionnaire (AQLQ) at 12 weeks), indicating a significant difference in favour of VI and FF 100/25 mcg (mean difference (MD) 0.30, 95% confidence interval (CI) 0.14 to 0.46; Analysis 1.1). The minimal important difference on this scale is 0.5 unit.
Severe asthma exacerbation as defined by hospital admission or treatment with a course of oral corticosteroid
See Table 3.
| Study | FF/VI 100/25 mcg | FF 100 mcg | FF 200 mcg | FF/VI 200/25 mcg | FP/SAL 250/50 mcg twice‐daily | FP 500 mcg | Prednisolone 10 mg | Placebo |
| 6 weeks' duration | 0/56 (0.00%) | ‐ | ‐ | 0/56 (0.00%) | ‐ | ‐ | 0/15 (0.00%) | 0/58 (0.00%) |
| ≥ 24 to 78 weeks' duration Time to first severe exacerbation (HR 0.80, 95% CI 0.64 to 0.99). Annualised rate of severe exacerbation 25% reduction (95% CI 5% to 40%) | 154/1009 (15.26%) | 186/1010 (18.42%) | ‐ | ‐ | ‐ | ‐ | ‐ | ‐ |
| 52 weeks' duration | 3/201 (1.49%) | ‐ | ‐ | 6/202 (2.97%) | ‐ | 3/100 (3.00%) | ‐ | ‐ |
| 12 weeks' duration | ‐ | ‐ | ‐ | 1/155 (0.65%) | ‐ | 3/154 (1.95%) | ‐ | ‐ |
| Cross‐over trial. Each period lasted 14 days with a 14 to 21‐day washout period between periods | 0/24 (0.00%) AM 0/25 (0.00%) PM | ‐ | ‐ | ‐ | ‐ | ‐ | ‐ | 0/23 (0.00%) |
| 24 weeks' duration | 1/403 (0.25%) | ‐ | ‐ | ‐ | 2/403 (0.50%) | ‐ | ‐ | ‐ |
aOne participant in the FF/VI 100/25 mcg group experienced a severe asthma exacerbation concurrent with sinusitis and was withdrawn owing to lack of efficacy. The participant did not require hospitalisation, and the event, which was not classified as an AE, resolved following treatment with prednisone
bThe incidence of asthma exacerbations was low, and no difference was noted between groups (3% vs 2% on FP/SAL vs FF/VI, respectively (on‐treatment events)). Eight (2%) participants in the FF/VI group and seven (2%) in the FP/SAL group withdrew because of exacerbation. One patient in the FF/VI group and two in the FP/SAL group were hospitalised because of exacerbation
AM: morning; CI: confidence interval; FF: fluticasone furoate; FP: fluticasone propionate; HR: hazard ratio; PM: afternoon; SAL: salmeterol; VI: vilanterol
No exacerbations were reported in the VI and FF 100/25 mcg or placebo arms in the two short‐term trials (Allen 2013; Kempsford 2012) pooled in Analysis 1.2.
Serious adverse events
See Table 4.
| Study | FF/VI 100/25 mcg | FF 100 mcg | FF 200 mcg | FF/VI 200/25 mcg | VI 25 mcg | FP/SAL 250/50 mcg twice‐daily | FP 500 mcg | Prednisolone 10 mg | Placebo |
| 6 weeks' duration. Post‐treatment period SAEs | 0/56 (0.00%) | ‐ | ‐ | 0/56 (0.00%) | ‐ | ‐ | ‐ | 0/15 (0.00%) | 0/58 (0.00%) |
| ≥ 24 to 78 weeks' duration. On‐treatment SAEs | 41/1009 (4.06%) | 29/1010 (2.87%) | ‐ | ‐ | ‐ | ‐ | ‐ | ‐ | ‐ |
| 12 weeks' duration | 4/346 (1.16%) | 3/347 (0.86%) | ‐ | 1/346 (0.29%) | ‐ | ‐ | ‐ | ‐ | ‐ |
| 12 weeks' duration | 0/201 (0.00%) | 1/205 (0.49%) | ‐ | ‐ | ‐ | ‐ | ‐ | ‐ | 0/203 (0.00%) |
| 52 weeks' duration. On‐treatment SAEs | 3/201 (1.49%) | ‐ | ‐ | 1/202 (0.50%) | ‐ | ‐ | 7/100 (7.00%) | ‐ | ‐ |
| Cross‐over trial. Three of 7 treatments (2 weeks) separated by 12 to 14‐day washout periods | 1/172 (0.006%) | 0/187 (0%) | ‐ | ‐ | ‐ | ‐ | ‐ | ‐ | ‐ |
| 12 weeks' duration | ‐ | ‐ | ‐ | 1/155 (0.65%) | ‐ | ‐ | 2/154 (1.30%) | ‐ | ‐ |
| Cross‐over trial. Each period lasted 14 days with a 14 to 21‐day washout period | 0/24 (0.00%) AM. 0/25 (0.00%) PM. | ‐ | ‐ | ‐ | ‐ | ‐ | ‐ | ‐ | 0/23 (0.00%) |
| 24 weeks' duration | ‐ | ‐ | 1/194 (0.52%) | 6/197 (3.05%) | ‐ | ‐ | 2/195 (1.03%) | ‐ | ‐ |
| Cross‐over trial. 11 weeks (for a single period) | 0/25 (0.00%) | 0/25 (0.00%) | ‐ | ‐ | ‐ | ‐ | ‐ | ‐ | ‐ |
| Cross‐over trial. 28 days for each period | 0/51 (0.00%) | 0/51 (0.00%) | ‐ | ‐ | ‐ | ‐ | ‐ | ‐ | 0/51 (0.00%) |
| Cross‐over trial. 21 days | 0/27 (0.00%) | 0/27 (0.00%) | ‐ | ‐ | 0/26 (0.00%) | ‐ | ‐ | ‐ | 0/27 (0.00%) |
| 24 weeks' duration | 4/403 (0.99%) | ‐ | ‐ | ‐ | ‐ | 5/403 (1.24%) | ‐ | ‐ | ‐ |
aThe main paper reports that 1 of the 52 withdrew during the study owing to an SAE, which occurred 4 days after the last dose in the FF 100 treatment period. This participant was provisionally diagnosed with moderate (grade 2) Still’s disease. Six weeks later, the participant was hospitalised. A diagnosis of histiocytic necrotising lymphadenitis (Kikuchi’s disease) was made on the basis of histology of an excised lymph node. Tapered prednisolone treatment, initiated at 60 mg per day, has been successful
FF: fluticasone furoate; FP: fluticasone propionate; SAE: serious adverse event; SAL: salmeterol; VI: vilanterol
No serious adverse events were observed in the VI and FF 100/25 mcg or placebo arms in the five studies (Allen 2013; Bleecker 2012; Kempsford 2012; Oliver 2012; Oliver 2013) aggregated in Analysis 1.3. These studies were of short duration; the longest (Bleecker 2012) had a treatment period of 12 weeks.
Secondary outcomes
Measures of lung function: forced expiratory flow in one second (FEV1), peak expiratory flow (PEF)
| Study measure time point/ duration | FF/VI 100/25 mcg Mean (SE), N, of MD (95% CI) | FF 100 mcg Mean (SE), N | FF 200 mcg Mean (SE), N | FF/VI 200/25 mcg Mean (SE), N | VI 25 mcg Mean (SE), N | FP/SAL250/50 mcg twice‐daily Mean (SE), N | FP 500 mcg Mean (SE), N | Placebo Mean (SE), N | MD (95% CI, unless otherwise stated) |
| Trough FEV1 At 0 to 12 weeks Change in baseline trough FEV1 from baseline to week 12 | 0.441 L (0.022) | 0.365 L (0.022) | ‐ | 0.457 L (0.022) | ‐ | ‐ | ‐‐ | ‐ | ‐ |
| Trough FEV1 At 0 to 12 weeks Mean change in trough FEV1 (pre‐bronchodilator and pre‐dose) from baseline to week 12 | 0.368 L (0.0304), n = 200 | 0.332 L (0.0302), n = 203 | ‐ | ‐ | ‐ | ‐ | ‐ | 0.196 L (0.0310), n = 193 | 0.04 L (‐0.05 to 0.12) 0.17 L (0.09 to 0.26) 0.14 L (0.05 to 0.22) |
| Trough FEV1 combining all treatment periods At 0 to 2 weeks 3 of 7 treatments (2 weeks) separated by 12 to 14‐day washout periods | 0.200 L, n = 158 | 0.087 L, n = 158 | ‐ | ‐ | ‐ | ‐ | ‐ | ‐ | ‐ |
| 12 weeks' duration | ‐ | ‐ | ‐ | ‐ | ‐ | ‐ | ‐ | ‐ | Adjusted treatment difference 0.108 L (0.040 to 0.176) |
| Weighted mean FEV1 over the day At day 14 Weighted mean FEV1, over 0 to 24 hours post dose at day 14 Cross‐over trial. Each period lasted 14 days with a 14 to 21‐day washout period | AM dose: 3.188 L PM dose: 3.233 L | ‐ | ‐ | ‐ | ‐ | ‐ | ‐ | 2.811 L n = 20 | AM vs placebo 0.377 L (90% CI 0.293 to 0.462) PM vs placebo 0.422 L (90% CI 0.337 to 0.507) AM vs PM ‐0.44 L (90% CI ‐0.125 to 0.36) |
| Day 14 pre‐treatment (trough) AM FEV1 At day 14 | AM dose: 3.191 L PM dose: 3.285 L n = 25 | ‐ | ‐ | ‐ | ‐ | ‐ | ‐ | 2.788 L n = 22 | AM vs placebo 0.403 L (90% CI 0.272 to 0.533) PM vs placebo 0.496 L (90% CI 0.369 to 0.624) AM vs PM ‐0.094 L (90% CI ‐0.221 to 0.034) |
| Day 14 pre‐treatment (trough) PM FEV1 At day 14 | AM dose: 3.153 L PM dose: 3.188 L | ‐ | ‐ | ‐ | ‐ | ‐ | ‐ | 2.879 L n = 23 | AM vs placebo 0.275 L (90% CI 0.169 to 0.380) PM vs placebo 0.309 L (90% CI 0.205 to 0.413) AM vs PM ‐0.034 (90% CI ‐0.138 to 0.070) |
| Change in baseline trough FEV1 At 24 weeks Change from baseline in clinic visit trough (pre‐bronchodilator and pre‐dose) FEV1 at end of 24‐week treatment period | ‐ | ‐ | 0.201 L (0.0303), n = 186 | 0.394 L (0.0302), n = 187 | ‐ | ‐ | 0.183 L (0.0300), n = 190 | ‐ | ‐0.19 L (‐0.28 to ‐0.11) 0.02 L (‐0.06 to 0.10) 0.21 L (0.13 to 0.29) |
| Change from baseline in weighted mean serial FEV1 over 24 hours At 24 weeks Change from baseline in weighted mean serial FEV1 over 0 to 24 hours post dose at week 24 | ‐ | ‐ | 0.328 L (0.0493), n = 83 | 0.464 L (0.0470), n = 89 | ‐ | ‐ | 0.258 L (0.0483), n = 86 | ‐ | ‐0.14 L (‐0.27 to ‐0.00) 0.07 L (‐0.07 to 0.21) 0.21 L (0.07, 0.34) |
| 23 hours post challenge At day 29 Cross‐over trial ‐ 28 days for each period Weighted mean change from baseline in FEV1 between 0 and 2 hours following 22 to 23‐hour post‐treatment allergen challenge at day 29 of each treatment period | ‐0.227 L (0.0550), n = 46 | ‐0.210 L (0.0549), n = 49 | ‐ | ‐ | ‐ | ‐ | ‐ | ‐0.372 L (0.0557), n = 45 | FF vs placebo 0.162 L (0.087 to 0.237) FF/VI vs placebo 0.145 L (0.069 to 0.222) FF/VI vs FF ‐0.017 L (‐0.091 to 0.057) |
| Decrease from baseline 23 hours post challenge At day 29 Maximum % decrease from baseline FEV1 between 0 and 2 hours following 22 to 23‐hour post‐treatment allergen challenge at day 29 of each treatment period (time frame: baseline and at day 29 of each treatment period (up to study day 197)) | ‐13.206% (2.0491), n = 46 | ‐14.040% (2.0435), n = 49 | ‐ | ‐ | ‐ | ‐ | ‐ | ‐24.991% (2.0736), n = 45 | FF vs placebo 10.951% (8.053 to 13.848) (8.849 to 14.721) |
| Change from baseline FEV1 23 hours post challenge Minimum FEV1 absolute change from baseline between 0 and 2 hours following 22 to 23‐hour post‐treatment allergen challenge at day 29 of each treatment period | ‐0.478 L (0.0767), n = 46 | ‐0.479 L (0.0765), n = 49 | ‐ | ‐ | ‐ | ‐ | ‐ | ‐0.809 L (0.0775), n = 45 | FF vs placebo 0.330 L (0.232 to 0.429) |
| Change from baseline 4 to 10 hours post challenge At day 21 Cross‐over trial ‐ 21 days LAR: absolute change from baseline in minimum FEV1 between 4 and 10 hours following 1‐hour post‐treatment allergen challenge at day 21 of each treatment period | ‐0.216 L n = 26 | ‐0.188 L n = 27 | ‐ | ‐ | ‐0.536 L n = 22 | ‐ | ‐ | ‐0.731 L n = 20 | ‐ |
| Change from baseline 4 to 10 hours post challenge At day 21 LAR: absolute change from baseline in weighted mean FEV1 between 4 and 10 hours following 1‐hour post‐treatment allergen challenge at day 21 of each treatment period | 0.018 L | 0.018 L n = 27 | ‐ | ‐ | ‐0.298 L n = 22 | ‐ | ‐ | ‐0.466 L n = 20 | ‐ |
| Change from baseline trough FEV1 At day 168 24 weeks' duration | 0.281 L (0.0191), n = 397 | ‐ | ‐ | ‐ | ‐ | 0.300 L (0.0193), n = 389 | ‐ | ‐ | ‐0.019 L (‐0.073 to 0.034) |
AM: morning; CI: confidence interval; FEV1: forced expiratory volume in one second; FF: fluticasone furoate; FP: fluticasone propionate; h: hour; LAR: late asthmatic response; MD: mean difference; PM: afternoon; SAL: salmeterol; SE: standard error; VI: vilanterol
| Study | Duration (weeks) | Measure of PEF | FF/VI 100/25 mcg Mean (SD, unless otherwise stated), N | FF 100 mcg Mean (SD, unless otherwise stated), N | FF 200 mcg Mean (SE), N | FF/VI 200/25 mcg Mean (SE ), N | FP 500 mcg Mean (SE), N | Placebo Mean (SE, unless otherwise stated), N | MD (95% CI, unless otherwise stated) |
| 12 | Change from baseline, AM Change from baseline in AM PEF Averaged over 12‐week treatment period | 44.3 L/min (2.25) | 19.1 L/min (2.25) | ‐ | 47.7 L/min (2.25) | ‐ | 25.20 L/min (18.96 to 31.44), 100/25 vs 100 FF | ||
| 12 | Change from baseline, PM Change from baseline in AM PEF Averaged over 12‐week treatment period | 39.7 L/min (2.24) | 15.5 L/min (2.24) | ‐ | 41.7 L/min (2.24) | ‐ | 24.20 L/min (17.99 to 30.41), 100/25 vs 100 FF | ||
| 12 | Change from baseline, PM Mean change from baseline in daily PM PEF averaged over 12‐week treatment period | 26.4 L/min (SE 2.35), n = 201 | 14.1 L/min (SE 2.34), n = 204 | ‐ | ‐ | ‐ | ‐1.8 L/min (2.36), n = 202 | 12.30 L/min (5.80 to 18.80), 28.20 L/min (21.67 to 34.73), 15.90 L/min (9.39 to 22.41) | |
| 4 | Change from baseline, AM Only 1 (FF/VI) condition reported. Trial reported as conference abstract with limited information | ||||||||
| Baseline to day 15 | Least squares mean change calculated from baseline to day 15 Least squares mean change in last 7 days, mean PEF | 24.1 (2.46) AM 21.4 (2.58) PM n = 172 | ‐2.9 (2.44) AM ‐5.2 (2.51) PM n = 187 | ‐ | ‐ | ‐ | ‐ | ‐ | |
| 12 | 12 weeks' duration. | ‐ | ‐ | ‐ | 39.1 L/min (3.01), n = 155 | 10.5 L/min (3.03), n = 154 | ‐ | Adjusted treatment difference 28.5 L/min (20.1 to 36.9) | |
| 12 days | Pre‐treatment Pre‐treatment PEF at days 1 to 12 Cross‐over trial. Each period lasted 14 days with a 14 to 21‐day washout period | AM dose: 510.4 L/min PM dose: 535.3 L/min | ‐ | ‐ | ‐ | ‐ | 466.3 L/min | AM vs placebo 44.0 L/min (90% CI 31.2 to 56.9) PM vs placebo 69.0 L/min (90% CI 55.9 to 82.1) AM vs PM ‐25.0 L/min (90% CI ‐37.9 to ‐12.0) | |
| 12 days | Pre‐treatment Pre‐treatment PEF (PM) at days 1 to 12 | AM dose: 517.6 L/min PM dose: 521.4 L/min | ‐ | ‐ | ‐ | ‐ | 453.2 L/min | AM vs placebo 64.4 L/min (90% CI 52.9 to 76.0) PM vs placebo 68.2 L/min (90% CI 56.5 to 79.8) AM vs PM ‐3.7 L/min (90% CI ‐15.2 to 7.7) | |
| 24 | Change from baseline, AM 4 weeks Mean change from baseline in daily trough (AM) PEF averaged over 24‐week treatment period | ‐ | ‐ | 18.2 L/min (2.97), n = 193 | 51.8L/min (2.94), n = 197 | 18.8L/min (2.95), n = 195 | ‐ | ‐33.60 L/min (‐41.79 to, ‐25.41), ‐0.60 L/min (‐8.80 to 7.60), 33.00 L/min (24.84 to 41.16) | |
| 24 | Change from baseline, PM Mean change from baseline in daily trough (PM) PEF averaged over 24‐week treatment period | ‐ | ‐ | 9.1 L/min (2.98), n = 192 | 39.8 L/min (2.93), n = 197 | 13.6 L/min (2.96), n = 194 | ‐ | ‐30.70 L/min (‐38.89 to ‐22.51), ‐4.50 L/min (‐12.73 to 3.73), 26.20 L/min (18.04 to 34.36) |
AM: morning; CI: confidence interval; FF: fluticasone furoate; PEF: peak expiratory flow; PM: evening; SD: standard deviation; SE: standard error; VI: vilanterol
Data contributed by Bleecker 2012 on FEV1 (litres) indicated a significant difference in favour of VI and FF 100/25 mcg (MD 0.17, 95% CI 0.09 to 0.26; Analysis 1.4). A similar effect was reported for peak expiratory flow rate (PEFR) AM L/min (MD 28.20, 95% CI 21.67 to 34.73; Analysis 1.5) and PEFR AM L/min (MD 28.20, 95% CI 21.67 to 34.73; Analysis 1.6).
Asthma symptoms
See Table 7.
| Study | Measure | FF/VI 100/25 mcg Mean (SE) | FF 100 mcg Mean (SE) | FF 200 mcg Mean (SE) | FF/VI 200/25 mcg Mean (SE) | FP/SAL250/50 mcg twice‐daily Mean (SE) | FP 500 mcg Mean (SE) | Placebo Mean (SE) | MD (95% CI) |
| ≥ 24 to 78 weeks' duration Responder analysis results: ORs for FF/VI vs FF at week 12 (1.49, 95% CI 1.20 to 1.84), week 36 (1.49, 95% CI 1.21 to 1.83) and at endpoint (1.50, 95% CI 1.23 to 1.82) | ACQ7 mean difference and responder analysis | NR | NR | ‐ | ‐ | ‐ | ‐ | ‐ | ‐ |
| Change from baseline in percentage of symptom‐free 24‐hour periods during 12‐week treatment | Change from baseline % symptom‐free days | 27.2 (1.74) n = 345 | 19.4 (1.74) n = 346 | ‐ | 29.0 (1.74) n = 346 | ‐ | ‐ | ‐‐ | |
| Change from baseline in % of symptom‐free 24‐hour periods during 12‐week treatment period | Change from baseline % symptom‐free days | 32.5 (2.14), n = 201 | 20.4 (2.13), n = 204 | ‐ | ‐ | ‐ | ‐ | 14.6 (2.15), n = 202 | 12.10 (6.18 to 18.02), 17.90 (11.95 to 23.85), 5.80 (‐0.13 to 11.73) |
| Trial reported as conference abstract with limited information | Change from baseline ACT score | ||||||||
| LS mean change in symptom‐free days during 2‐week treatment period | LS mean change in symptom‐free days (SE) | 7.3 (1.67) n = 172 | 5.8 (1.64) n = 187 | ‐ | ‐ | ‐ | ‐ | ‐ | ‐ |
| % of symptom‐free 24‐hour periods, weeks 1 to 12 | % symptom‐free days | ‐ | ‐ | ‐ | 25.4 (2.74), n = 155 | ‐ | 20.6 (2.77), n = 152 | ‐ | 4.9 (‐2.8 to 12.5) |
| Change from baseline in ACT scores at week 12 | Change from baseline ACT score | ‐ | ‐ | 3.9 (0.29), n = 164 | 4.8 (0.27), n = 183 | ‐ | 3.9 (0.28), n = 169 | ‐ | ‐0.90 (‐1.68 to ‐0.12), 0.00 (‐0.79 to 0.79), 0.90 (0.14 to 1.66) |
| Change from baseline in ACT scores at week 24 | Change from baseline ACT score | ‐ | ‐ | 5.2 (0.30), n = 147 | 5.5 (0.28), n = 170 | ‐ | 4.7 (0.29), n = 162 | ‐ | ‐0.30 (‐1.10 to 0.50), 0.50 (‐0.32 to 1.32), 0.80 (0.01 to 1.59) |
| Change from baseline in ACT scores at day 168 and at 24 weeks | Change from baseline ACT score | 2.3 (0.16), n = 354 | ‐ | ‐ | ‐ | 2.0 (0.16), n = 348 | ‐ | ‐ | 0.2 (‐0.2 to 0.7) |
ACT: asthma control test; CI: confidence interval; FF: fluticasone furoate; FP: fluticasone propionate; LS: least squares; MD: mean difference; NR: not reported; OR: odds ratio; SAL: salmeterol; SE: standard error; VI: vilanterol
Bleecker 2012 reported a significant difference in favour of VI and FF 100/25 mcg with respect to change in asthma symptoms as measured by the Asthma Control Test (ACT) (MD 1.90, 95% CI 1.22 to 2.58; Analysis 1.7).
VI and FF 100/25 mcg versus same dose of FF
Primary outcomes
Health‐related quality of life
Bleecker 2012 provided data on the change in quality of life (as measured by the AQLQ at 12 weeks) that indicated no statistically reliable difference between the two arms of this trial (MD 0.15, 95% CI ‐0.00 to 0.30; Analysis 2.1).
Severe asthma exacerbation as defined by hospital admission or treatment with a course of oral corticosteroid
Two studies provided data on exacerbations (Bateman 2014; Bleecker 2012). The difference between the two arms was not significant (odds ratio (OR) 1.38, 95% CI 0.86 to 2.22; Analysis 2.2).
Serious adverse events
No serious adverse events were observed in either of the two arms in three of the five included studies (NCT01453023; Oliver 2012; Oliver 2013) combined in Analysis 2.3. The difference between the two arms was not significant (OR 1.61, 95% CI 0.42 to 6.17).
Secondary outcomes
Measures of lung function: FEV1, PEF
The trough FEV1 at 12 weeks was significant in favour of VI and FF 100/25 mcg in a single study (Bernstein 2014) (MD 0.08L, 95% CI 0.02 to 0.14; Analysis 2.4).
Researchers reported a significant difference in favour of VI and FF 100/25 mcg for PEFR AM (change from baseline at 12 weeks) (MD 20.29, 95% CI 15.72 to 24.85; Analysis 2.5) and for PEFR PM (change from baseline at 12 weeks) (MD 18.52, 95% CI 14.03 to 23.01; Analysis 2.6).
Data from a three‐period crossover study (Lee 2014), which are reported in a format that cannot be aggregated in lung function analyses, also show a significant difference in favour of VI and FF 100/25 mcg of a similar magnitude for trough FEV1 and PEFR AM and PM.
Asthma symptoms
One study (Bleecker 2012) contributed data to this outcome, reporting no significant differences between the two arms with respect to change in asthma symptoms as measured by ACT (MD 0.60, 95% CI ‐0.04 to 1.24; Analysis 2.7). The minimal important difference on this scale is 0.5 unit.
VI and FF 100/25 mcg versus same dose of VI
For this comparison, data on only one outcome were available for analysis: serious adverse events. Investigators observed no serious adverse events in either of the two arms of a single short‐term trial (Oliver 2013; Analysis 3.1).
VI and FF 100/25 mcg versus FP 500 mcg twice‐daily
Primary outcomes
For this comparison, data were available for analysis on only two outcomes: exacerbations and serious adverse events.
Severe asthma exacerbation as defined by hospital admission or treatment with a course of oral corticosteroid
Only one study of 52 weeks' duration contributed data to this analysis (Busse 2013). Researchers reported no significant differences between VI and FF 100/25 mcg versus FP 500 mcg twice‐daily for this outcome (OR 0.49, 95% CI 0.10 to 2.47; Analysis 4.1).
Serious adverse events
Only Busse 2013 contributed data to this analysis. Investigators observed significantly fewer serious adverse events in the VI and FF 100/25 mcg arm (OR 0.20, 95% CI 0.05 to 0.80; Analysis 4.2).
VI and FF 100/25 mcg versus FP/SAL 250/50 mcg twice‐daily
Primary outcomes
Health‐related quality of life
One study (Woodcock 2013) of 24 weeks' duration considered change in quality of life (as measured by the AQLQ at 12 weeks). Investigators reported no significant differences between VI and FF 100/25 mcg versus FP/SAL 250/50 mcg twice‐daily (MD 0.09, 95% CI ‐0.03 to 0.21; Analysis 5.1).
Severe asthma exacerbation as defined by hospital admission or treatment with a course of oral corticosteroid
Researchers reported no significant differences between the two arms in terms of exacerbations (OR 0.50, 95% CI 0.05 to 5.52; Analysis 5.2).
Serious adverse events
Study authors described no significant difference between the two arms for serious adverse events (OR 0.80, 95% CI 0.21 to 2.99; Analysis 5.3).
Secondary outcomes
Measures of lung function: FEV1, PEF
Woodcock 2013 reported no significant differences between the two arms for FEV1 (MD ‐0.02, 95% CI ‐0.07 to 0.03; Analysis 5.4).
Asthma symptoms
Study authors also described no significant differences between the two arms in terms of asthma symptoms (MD 0.24, 95% CI ‐0.20 to 0.68; Analysis 5.5).
VI and FF 100/25 mcg versus FP/SAL 250/25 mcg twice‐daily
Primary outcomes
For this comparison, data on only two outcomes were available for analysis: exacerbations and serious adverse events.
Severe asthma exacerbation as defined by hospital admission or treatment with a course of oral corticosteroid
Only two studies provided data for this outcome: one short‐term trial (Allen 2013) and one of 52 weeks' duration (Busse 2013). Investigators reported no significant differences between the two arms (OR 2.02, 95% CI 0.50 to 8.19; Analysis 6.1).
Serious adverse events
Allen 2013 and Busse 2013 also contributed data for serious adverse events, noting no significant differences between the two arms (OR 0.33, 95% CI 0.03 to 3.18; Analysis 6.2).
VI and FF 200/25 mcg versus placebo
For this comparison, data on four outcomes were available for analysis: exacerbations, serious adverse events, FEV1 and symptoms.
Primary outcomes
Severe asthma exacerbation as defined by hospital admission or treatment with a course of oral corticosteroid
Only one short‐term trial contributed data to this outcome (Allen 2013), indicating no exacerbations in either arm.
Serious adverse events
Study authors also described no adverse events in either arm (Allen 2013).
Secondary outcomes
Measures of lung function: FEV1, PEF
Only one study (24 weeks' duration; NCT01134042) provided data for this outcome (FEV1 in litres), noting a significant advantage for VI and FF 200/25 mcg (MD 0.21, 95% CI 0.13 to 0.29; Analysis 7.3).
Asthma symptoms
NCT01134042 described a similar significant advantage related to change in asthma symptoms for VI and FF 200/25 mcg (MD 0.90, 95% CI 0.12 to 1.68; Analysis 7.4).
VI and FF 200/25 mcg versus FP/SAL 500/50 mcg
Primary outcomes
The four week cross‐over trial addressing this comparison did not include the review's primary outcomes (Hojo 2015).
Secondary outcomes
Measures of lung function: FEV1, PEF
Hojo 2015 reported an improvement in AM PEF in the VI/FF 200/25 mcg condition. However, investigators provided no information on this outcome in relation to the FP/SAL 500/50 mcg condition.
Asthma symptoms
Only Hojo 2015 looked at this comparison, noting no significant improvement on the ACT with either treatment.
VI and FF 200/25 mcg versus FP 500 mcg
Primary outcomes
Health‐related quality of life
Two studies (Lin 2013; NCT01134042) of 12 and 24 weeks' duration, respectively, looked at change in quality of life at 12 weeks (MD 0.05, 95% CI ‐0.08 to 0.17; Analysis 8.1) and at 24 weeks (MD 0.03, 95% CI ‐0.15 to 0.21; Analysis 8.2). Neither analysis indicated a significant difference between the two arms.
Severe asthma exacerbation as defined by hospital admission or treatment with a course of oral corticosteroid
Busse 2013 (52 weeks' duration) and Lin 2013 provided data for this outcome, noting no significant differences between the two arms (OR 0.70, 95% CI 0.22 to 2.20; Analysis 8.4).
Serious adverse events
Busse 2013,Lin 2013 and NCT01134042 contributed data, indicating no significant differences between the two arms for this outcome (OR 0.61, 95% CI 0.25 to 1.49; Analysis 8.5).
Secondary outcomes
Measures of lung function: FEV1, PEF
Only one study (Lin 2013) provided data on PEF, reporting a significant advantage in favour of VI and FF 200/25 mcg (MD 28.60, 95% CI 20.23 to 36.97; Analysis 8.6). NCT01134042 provided additional data specifically for AM and PM PEFR. With respect to both the former (MD 33.00, 95% CI 24.84 to 41.16; Analysis 8.7) and the latter (MD 26.20, 95% CI 18.04 to 34.36; Analysis 8.8), a significant advantage favoured VI and FF 200/25 mcg.
Asthma symptoms
Lin 2013 reported the proportion of symptom‐free days as a percentage for this comparison (MD 4.80, 95% CI ‐2.84 to 12.44; Analysis 8.9), revealing no significant differences for VI and FF 200/25 mcg versus FP 500 mcg in this analysis. However, for change in asthma symptoms, NCT01134042 provided an indication of significance in favour of VI and FF 200/25 mcg (MD 0.80, 95% CI 0.01 to 1.59; Analysis 8.10), based on the ACT, which has a minimal important difference of 0.5 unit.
VI and FF 200/25 mcg versus same dose of FF
Primary outcomes
Health‐related quality of life
One study (NCT01134042) considered change in health‐related quality of life at 12 weeks (MD 0.08, 95% CI ‐0.08 to 0.24; Analysis 9.1) and at 24 weeks (MD 0.05, 95% CI ‐0.14 to 0.24; Analysis 9.2). Both cases reported no significant differences between VI and FF 200/25 mcg versus the same dose of FF for this outcome.
Severe asthma exacerbation as defined by hospital admission or treatment with a course of oral corticosteroid
No data were available for inclusion in our analyses for this outcome.
Serious adverse events
NCT01134042 provided data showing no significant differences between VI and FF 200/25 mcg versus the same dose of FF for this outcome (OR 6.06, 95% CI 0.72 to 50.84; Analysis 9.3).
Secondary outcomes
Measures of lung function: FEV1, PEF
NCT01134042 contributed data showing a significant advantage in favour of VI and FF 200/25 mcg for FEV1 (litres) (MD 0.19, 95% CI 0.10 to 0.28; Analysis 9.4), PEFR AM (MD 33.60, 95% CI 25.41 to 41.79; Analysis 9.5) and PEFR PM (MD 30.70, 95% CI 22.51 to 38.89; Analysis 9.6).
Asthma symptoms
Data from NCT01134042 revealed no significant differences between VI and FF 200/25 mcg versus the same dose of FF for this outcome (MD 0.30, 95% CI ‐0.50 to 1.10; Analysis 9.7).
Discussion
Summary of main results
We found very few opportunities to combine results from the 14 included studies into meta‐analyses. We tabulated the data for our pre‐specified primary outcomes: health‐related quality of life (Table 2), exacerbations (Table 3) and serious adverse events (Table 4). We included nine comparisons in this review, six for which the dose of vilanterol (VI) and fluticasone furoate (FF) was 100/25 mcg (VI and FF 100/25 mcg vs placebo; VI and FF 100/25 mcg vs same dose of FF; VI and FF 100/25 mcg vs same dose of VI; VI and FF 100/25 mcg vs fluticasone propionate (FP) 500 mcg twice‐daily; VI and FF 100/25 mcg vs FP/salmeterol (SAL) 250/50 mcg twice‐daily; VI and FF 100/25 mcg vs FP/SAL 250/25 mcg twice‐daily) and three for which the dose of VI and FF was 200/25 mcg (VI and FF 200/25 mcg vs placebo; VI and FF 200/25 mcg vs FP 500 mcg; VI and FF 200/25 mcg vs same dose of FF). In this review, we focused on our pre‐specified primary outcomes: health‐related quality of life, severe asthma exacerbation as defined by hospital admission, treatment with a course of oral corticosteroid and serious adverse events.
In the comparison between VI and FF 100/25 mcg versus placebo, only one study (Bleecker 2012) provided data on health‐related quality of life, showing a significant difference in favour of VI and FF 100/25 mcg (mean difference (MD) 0.30, 95% confidence interval (CI) 0.14 to 0.46; Analysis 1.1) when using the Asthma Quality of Life Questionnaire (AQLQ) with a minimally important difference of 0.5 unit. The two studies contributing data (Allen 2013; Kempsford 2012) reported no exacerbations in the VI and FF 100/25 mcg or placebo arms, and the five aggregated studies (Allen 2013; Bleecker 2012; Kempsford 2012; Oliver 2012; Oliver 2013) described no serious adverse events in the VI and FF 100/25 mcg or placebo arms. When viewed together, these data provide some evidence of benefit; however, in light of the small number of studies contributing to this impression and their mostly very short duration, it should be noted that this does not constitute strong evidence for efficacy nor for safety.
The second comparison (VI and FF 100/25 mcg vs same dose of FF) indicated no statistically reliable difference for health‐related quality of life between the two arms of the single contributing study (Bleecker 2012; MD 0.15, 95% CI ‐0.00 to 0.30). Only two studies provided data on exacerbations (Bateman 2014; Bleecker 2012), noting that the difference between the two arms was not significant (odds ratio (OR) 1.38, 95% CI 0.86 to 2.22). Researchers noted no serious adverse events in either of the two arms in three of the five included studies (NCT01453023; Oliver 2012; Oliver 2013), and no significant differences between the two conditions for this outcome (OR 1.61, 95% CI 0.42 to 6.17). The small number of studies contributing data to this comparison precludes opportunities for drawing robust conclusions for this comparison as well.
In terms of our comparison between VI and FF 100/25 mcg versus same dose of VI, data were available for analysis on only one of our pre‐specified primary outcomes: serious adverse events; no serious adverse events were observed in either of the two arms of the aggregated study (Oliver 2013).
For the comparison between VI and FF 100/25 mcg versus FP 500 mcg twice‐daily, data were available for analysis for only two outcomes: exacerbations and serious adverse events. Only one study contributed data with respect to the former (Busse 2013), reporting no significant differences between the two interventions (OR 0.49, 95% CI 0.10 to 2.4). With regard to serious adverse events only, Busse 2013 contributed data, revealing significantly fewer serious adverse events in the VI and FF 100/25 mcg arm (OR 0.20, 95% CI 0.05 to 0.80). Again, the small number of contributing studies precludes the opportunity for reaching any robust conclusions.
Researchers also compared VI and FF 100/25 mcg versus FP/SAL 250/50 mcg twice‐daily. In terms of health‐related quality of life, which was considered by only one study (Woodcock 2013), data show no significant differences between the two arms (MD 0.09, 95% CI ‐0.03 to 0.21) and no significant differences between the two arms in terms of exacerbations (OR 0.50, 95% CI 0.05 to 5.52), or between the two arms for serious adverse events (OR 0.80, 95% CI 0.21 to 2.99).
Finally, in terms of comparisons including VI and FF at 100/25 mcg, we considered VI and FF 100/25 mcg versus FP/SAL 250/25 mcg twice‐daily. Data on only two outcomes were available for analysis: exacerbations and serious adverse events.
For exacerbations, only two studies (Allen 2013; Busse 2013) provided data, revealing no significant differences between the two arms (OR 2.02, 95% CI 0.50 to 8.19). These studies also contributed data on serious adverse events, showing no significant differences between the two arms (OR 0.33, 95% CI 0.03 to 3.18).
In summary, with respect to VI and FF at 100/25 mcg, it is not possible to draw strong conclusions in relation to our pre‐specified primary outcomes.
Investigators also considered VI and FF at the higher dose of 200/25 mcg. For the comparison VI and FF 200/25 mcg versus placebo, data on only two of our primary outcomes were available for analysis: exacerbations and serious adverse events. Only one study contributed data on these two outcomes (Allen 2013), noting no exacerbations in either arm and no adverse events in either arm.
Study authors also compared VI and FF 200/25 mcg versus FP 500 mcg. Two studies (Lin 2013; NCT01134042) looked at change in quality of life at 12 weeks (MD 0.05, 95% CI ‐0.08 to 0.17) and at 24 weeks (MD 0.03, 95% CI ‐0.15 to 0.21; Analysis 8.2); neither analysis indicated a significant difference between the two arms. Busse 2013 and Lin 2013 provided data on exacerbations, showing no significant differences between the two arms (OR 0.70, 95% CI 0.22 to 2.20). Three studies (Busse 2013; Lin 2013; NCT01134042) contributed data on serious adverse events, showing no significant differences between the two arms for this outcome (OR 0.61, 95% CI 0.25 to 1.49).
In addition, study authors described the comparison between VI and FF 200/25 mcg versus same dose of FF. NCT01134042 considered change in health‐related quality of life at 12 weeks (MD 0.08, 95% CI ‐0.08 to 0.24) and at 24 weeks (MD 0.05, 95% CI ‐0.14 to 0.24), with neither analysis indicating a significant difference between the two interventions. No data were available for inclusion in our analyses on exacerbations. With regard to serious adverse events, NCT01134042 provided data, revealing no significant differences between the two interventions for this outcome (OR 6.06, 95% CI 0.72 to 50.84).
In summary, the evidence gathered in relation to our primary outcomes for VI and FF at 100/25 mcg and at 200/25 mcg is too inconclusive to provide the basis of robust conclusions.
Overall completeness and applicability of evidence
At the present time, inhaled corticosteroid (ICS) and long‐acting beta2‐agonist (LABA) combination inhalers are recommended at step 3 of the British Thoracic Society (BTS) guidelines for asthma management in children and adults. This means that patients taking a low dose of ICS should have their treatment 'stepped up' to include a LABA in addition to continued ICS only if their asthma is not well controlled. This treatment pathway has a clear evidence base. The question is whether the combination of VI and FF could be also be used at this stage. Owing to the wide range of comparisons and the short duration of most trials, applicability of the evidence is very limited.
From the limited number of available studies, some evidence has supported the use of VI/FF, particularly with regard to forced expiratory volume in one second (FEV1) and peak expiratory flow (PEF) (Bleecker 2012; Kempsford 2012; NCT01134042); however, additional studies are required to support its role. Research has suggested that the combination may improve health‐related quality of life compared with placebo (Bleecker 2012), but longer‐term placebo‐controlled studies are required to support this finding. The evidence reviewed reveals no significant short‐term increase in asthma exacerbations (Allen 2013; Kempsford 2012) nor in serious adverse events (Allen 2013; Bleecker 2012; Kempsford 2012; Oliver 2012; Oliver 2013) in the VI/FF group. Evidence is presently insufficient for comparison of VI/FF versus alternative twice‐daily combination therapy inhalers.
Studies have excluded participants with an episode of life‐threatening asthma, so potentially, these trials may have excluded a group of participants with more severe disease.
Most studies included adult and adolescent participants, and only one study enrolled only paediatric participants (NCT01453023). Confirmation of benefit for paediatric patients is important ‐ particularly as a once‐daily dosing regimen may improve adherence in the paediatric population. Large variability in study duration and in the severity of asthma heterogeneity makes it difficult to examine safety and side effects.
Quality of the evidence
In our judgement, 12 of the 14 studies had low risk of selection bias; in Bleecker 2012 and Hojo 2015, the risk was considered to be unclear. We also judged performance bias and detection bias based on blinding processes to be low in 12 of the 14 studies; in Kempsford 2012 and Hojo 2015, we judged this risk to be unclear. We evaluated attrition bias to be similarly low in 12 of the 14 studies; we judged the risk to be unclear in Kempsford 2012 and Hojo 2015. In our judgement, risk of reporting bias was low in 13 studies, and we judged Hojo 2015 as having unclear risk in this respect. In summary, we believe the quality of the evidence with respect to risk of bias was generally uniform across the various categories assessed (Figure 3).
The small number of included studies precluded formal assessment of publication bias using funnel plots. However, we designed our search strategy, which extended to conference abstracts and ongoing studies, with the goal of identifying unpublished studies.
Potential biases in the review process
Potential for publication bias can be seen in this review in that unpublished trials may not have been included. These studies may have had positive or negative outcomes that would have affected described treatment benefits. We undertook a thorough and systematic search of databases, and to the best of our knowledge, we assessed all relevant studies for inclusion in this review. Two review authors independently evaluated all studies that met the inclusion criteria to reduce potential selection bias. Assessment of each study was consistent in relation to the inclusion criteria.
Agreements and disagreements with other studies or reviews
We found the main body of evidence for use of VI and FF in the randomised controlled trials (RCTs) represented in this review. We are not aware of any other systematic review on this topic.

Study flow diagram.

Risk of bias graph: review authors' judgements about each risk of bias item presented as percentages across all included studies.
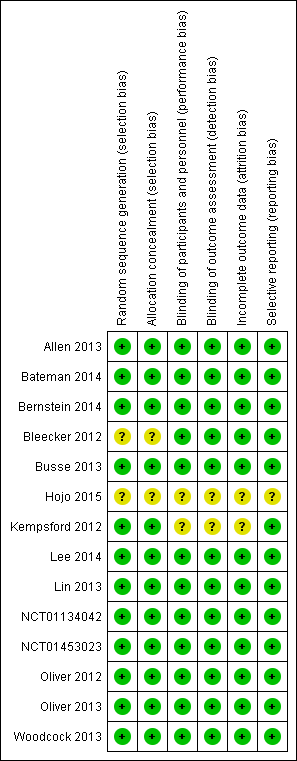
Risk of bias summary: review authors' judgements about each risk of bias item for each included study.

Comparison 1 FF/VI 100/25 versus placebo, Outcome 1 Change in quality of life (measured by AQLQ at 12 wk).

Comparison 1 FF/VI 100/25 versus placebo, Outcome 2 Exacerbations.

Comparison 1 FF/VI 100/25 versus placebo, Outcome 3 Serious adverse events.
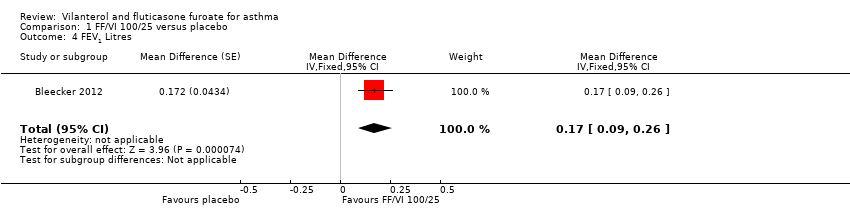
Comparison 1 FF/VI 100/25 versus placebo, Outcome 4 FEV1 Litres.
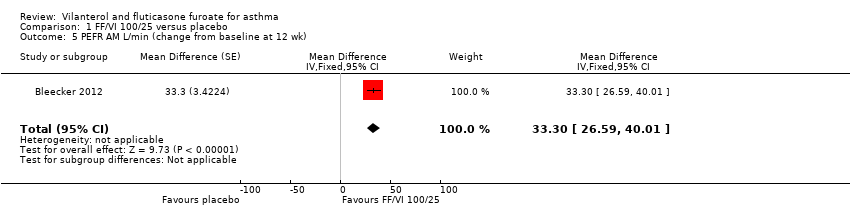
Comparison 1 FF/VI 100/25 versus placebo, Outcome 5 PEFR AM L/min (change from baseline at 12 wk).
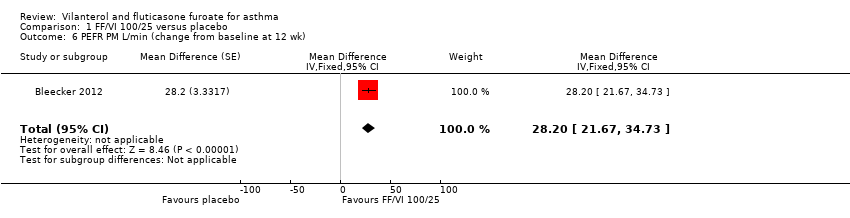
Comparison 1 FF/VI 100/25 versus placebo, Outcome 6 PEFR PM L/min (change from baseline at 12 wk).

Comparison 1 FF/VI 100/25 versus placebo, Outcome 7 Change in asthma symptoms (measured by ACT).

Comparison 2 FF/VI 100/25 versus same dose of FF, Outcome 1 Change in quality of life (measured by AQLQ at 12 wk).
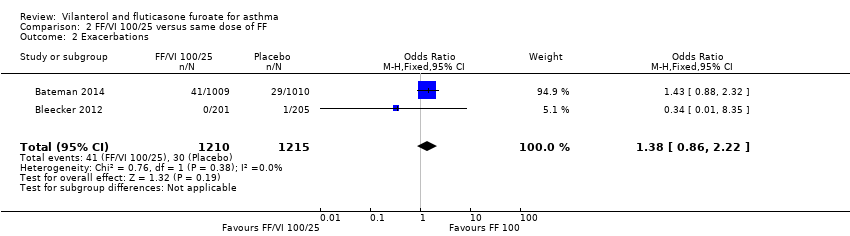
Comparison 2 FF/VI 100/25 versus same dose of FF, Outcome 2 Exacerbations.

Comparison 2 FF/VI 100/25 versus same dose of FF, Outcome 3 Serious adverse events.

Comparison 2 FF/VI 100/25 versus same dose of FF, Outcome 4 Trough FEV1 (L).

Comparison 2 FF/VI 100/25 versus same dose of FF, Outcome 5 PEFR AM (change from baseline at 12 wk).
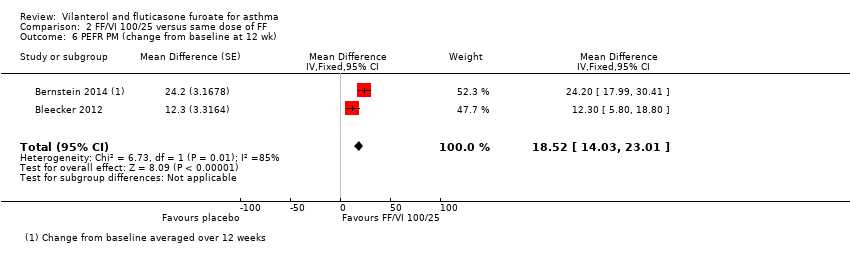
Comparison 2 FF/VI 100/25 versus same dose of FF, Outcome 6 PEFR PM (change from baseline at 12 wk).

Comparison 2 FF/VI 100/25 versus same dose of FF, Outcome 7 Change in asthma symptoms (measured by ACT).

Comparison 3 FF/VI 100/25 versus same dose VI, Outcome 1 Serious adverse events.
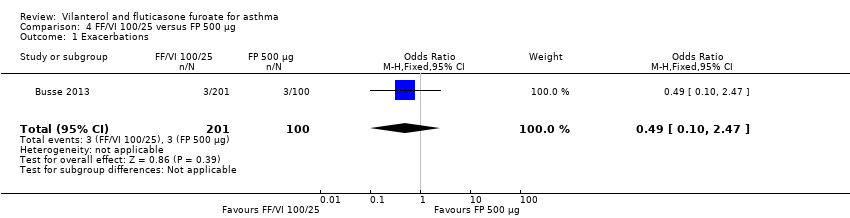
Comparison 4 FF/VI 100/25 versus FP 500 µg, Outcome 1 Exacerbations.

Comparison 4 FF/VI 100/25 versus FP 500 µg, Outcome 2 Serious adverse events.

Comparison 5 FF/VI 100/25 versus FPS 250/50 bd, Outcome 1 Change in quality of life (measured by AQLQ at 24 wk).
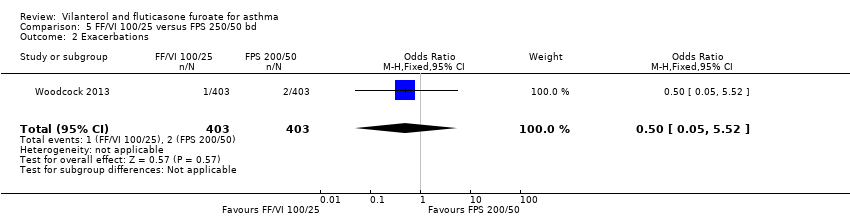
Comparison 5 FF/VI 100/25 versus FPS 250/50 bd, Outcome 2 Exacerbations.

Comparison 5 FF/VI 100/25 versus FPS 250/50 bd, Outcome 3 Serious adverse events.

Comparison 5 FF/VI 100/25 versus FPS 250/50 bd, Outcome 4 FEV1.

Comparison 5 FF/VI 100/25 versus FPS 250/50 bd, Outcome 5 Change in asthma symptoms (measured by ACT).

Comparison 6 FF/VI 100/25 µg versus FF/VI 200/25 µg, Outcome 1 Exacerbations.
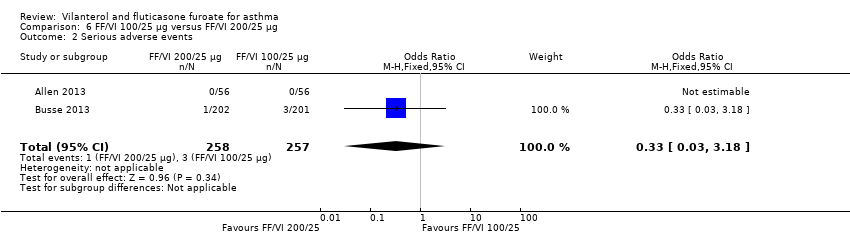
Comparison 6 FF/VI 100/25 µg versus FF/VI 200/25 µg, Outcome 2 Serious adverse events.

Comparison 7 FF/VI 200/25 versus placebo, Outcome 1 Exacerbations.

Comparison 7 FF/VI 200/25 versus placebo, Outcome 2 Serious adverse events.

Comparison 7 FF/VI 200/25 versus placebo, Outcome 3 FEV1 Litres.

Comparison 7 FF/VI 200/25 versus placebo, Outcome 4 Change in asthma symptoms (measured by ACT).
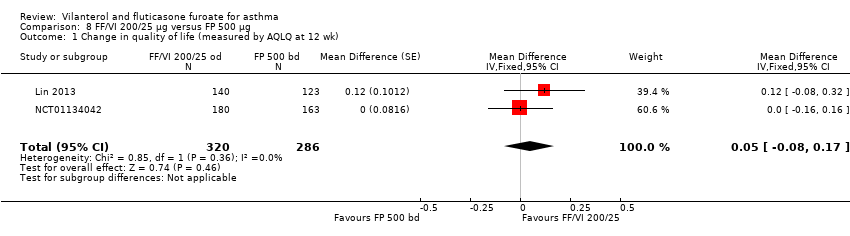
Comparison 8 FF/VI 200/25 µg versus FP 500 µg, Outcome 1 Change in quality of life (measured by AQLQ at 12 wk).
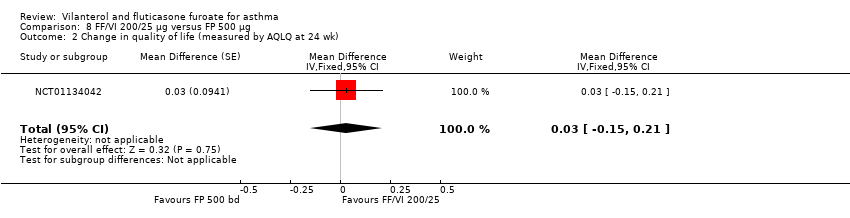
Comparison 8 FF/VI 200/25 µg versus FP 500 µg, Outcome 2 Change in quality of life (measured by AQLQ at 24 wk).
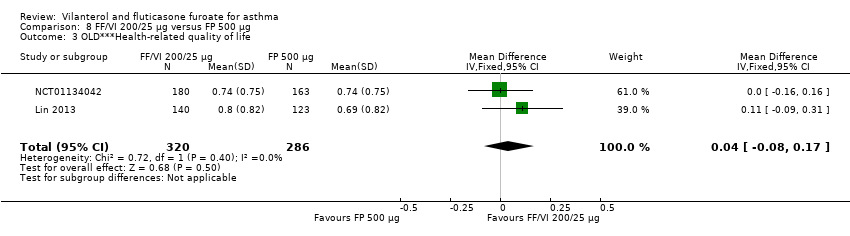
Comparison 8 FF/VI 200/25 µg versus FP 500 µg, Outcome 3 OLD***Health‐related quality of life.

Comparison 8 FF/VI 200/25 µg versus FP 500 µg, Outcome 4 Exacerbations.

Comparison 8 FF/VI 200/25 µg versus FP 500 µg, Outcome 5 Serious adverse events.

Comparison 8 FF/VI 200/25 µg versus FP 500 µg, Outcome 6 PEFR.
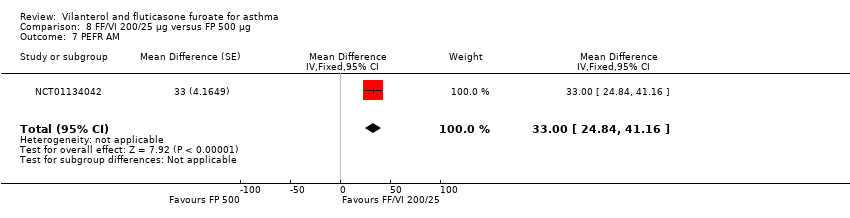
Comparison 8 FF/VI 200/25 µg versus FP 500 µg, Outcome 7 PEFR AM.

Comparison 8 FF/VI 200/25 µg versus FP 500 µg, Outcome 8 PEFR PM.
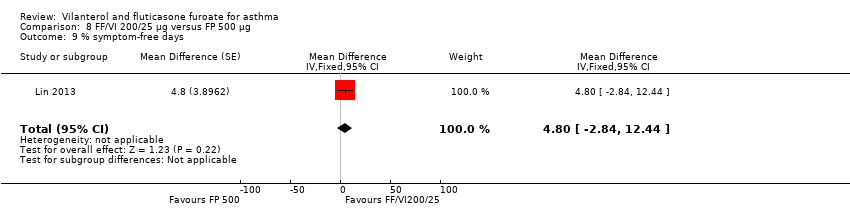
Comparison 8 FF/VI 200/25 µg versus FP 500 µg, Outcome 9 % symptom‐free days.

Comparison 8 FF/VI 200/25 µg versus FP 500 µg, Outcome 10 Change in asthma symptoms (measured by ACT).

Comparison 9 FF/VI 200/25 versus same dose of FF, Outcome 1 Change in quality of life (measured by AQLQ at 12 wk).

Comparison 9 FF/VI 200/25 versus same dose of FF, Outcome 2 Change in quality of life (measured by AQLQ at 24 wk).

Comparison 9 FF/VI 200/25 versus same dose of FF, Outcome 3 Serious adverse events.

Comparison 9 FF/VI 200/25 versus same dose of FF, Outcome 4 FEV1 Litres.

Comparison 9 FF/VI 200/25 versus same dose of FF, Outcome 5 PEFR AM.
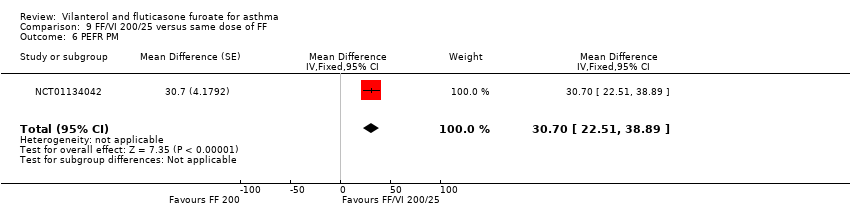
Comparison 9 FF/VI 200/25 versus same dose of FF, Outcome 6 PEFR PM.

Comparison 9 FF/VI 200/25 versus same dose of FF, Outcome 7 Change in asthma symptoms (measured by ACT).
| VI and FF compared with placebo for asthma | |||||
| Patient or population: people with asthma Settings: community Intervention: VI and FF Comparison: placebo | |||||
| Outcomes | Illustrative comparative risks* (95% CI) | Relative effect | Number of participants | Quality of the evidence | |
| Assumed risk | Corresponding risk | ||||
| Placebo | VI and FF | ||||
| Health‐related quality of life | 0.61 | 0.91 (SE 0.055), n = 180 | MD 0.30, 95% CI 0.14 to 0.46 | Bleecker 2012 (N = 609 participants, 515 completed study) compared VI/FF 100/25 mcg vs placebo in respect of health‐related quality of life and indicated a significant advantage for VI/FF 100/25 mcg | Moderatea |
| Asthma exacerbation | Not estimable | Only 2 studies (Allen 2013 and Kempsford 2012a) compared VI/FF 100/25 mcg vs placebo in respect of exacerbations; both studies reported no exacerbations in either treatment arm | Very lowb | ||
| Serious adverse events | Not estimable | Five trials (Allen 2013; Bleecker 2012; Kempsford 2012a; Oliver 2012; Oliver 2013) made this same comparison in relation to serious adverse events; all 5 reported no serious adverse events in VI/FF100/25 mcg or placebo arms | Very lowb | ||
| FEV1 | 0.196 L n = 193 | 0.368 L (SE 0.0304), n = 200 | MD 0.17 L, 95% CI 0.09 to 0.26 | Significant difference in favour of VI/FF 100/25 mcg vs placebo with respect to mean change in trough FEV1 (pre‐bronchodilator and pre‐dose) from baseline to week 12 in 1 trial (Bleecker 2012) (N = 609 participants, 515 completed study) (MD 0.17 L, 95% CI 0.09 to 0.26), and a similar effect was found in a small cross‐over trial (Kempsford 2012a) over a 2‐week period in the morning (MD 0.377 L, 90% CI 0.293 to 0.462) and in the evening (MD 0.422 L, 90% CI 0.337 to 0.507) | Moderatec |
| Peak expiratory flow | ‐0.4 L/min (SE 2.42), | 32.9 L/min (SE 2.42), n = 201 | MD 33.30 L/min, 95% CI 26.59 to 40.01 | Bleecker 2012 (N = 609 participants, 515 completed study) compared VI/FF 100/25 mcg vs placebo as mean change from baseline in daily morning (AM) PEF averaged over 12‐week treatment period; researchers noted a significant difference in favour of VI/FF 100/25 mcg (MD 33.30 L/min, 95% CI 26.59 to 40.01). The same trial showed a similar advantage in favour of VI/FF 100/25 mcg vs placebo in the evening over this period (28.20 L/min, 95% CI 21.67 to 34.73). A small cross‐over trial (Kempsford 2012a) produced a similar effect in favour of VI/FF 100/25 mcg vs placebo over a 2‐week period in the morning (MD 44.0 L/min, 90% CI 31.2 to 56.9) and in the evening (MD 69.0 L/min, 90% CI 55.9 to 82.1) | Moderatec |
| Asthma symptoms | 14.6 (SE 2.15), n = 202 | 32.5 (SE 2.14), n = 201 | MD 17.90, 95% CI 11.95 to 23.85 | Only 1 trial (Bleecker 2012) (N = 609 participants, 515 completed study) made VI/FF vs placebo comparison with respect to asthma symptoms, indicating a clear advantage for VI/FF 100/25 mcg | Moderatea |
| Adverse events | Not estimable | Several trials reported a range of adverse events for which overall aggregation was not possible. These are tabulated in Table 8 | Moderated | ||
| *The basis for the assumed risk (e.g. median control group risk across studies) is provided in footnotes. The corresponding risk (and its 95% confidence interval) is based on the assumed risk in the comparison group and the relative effect of the intervention (and its 95% CI) | |||||
| GRADE Working Group grades of evidence | |||||
| aPoint deducted to reflect that these data were derived from only one trial bInvestigators reported no events in either arm of these trials cPoint deducted to reflect that data contributing to the main result (MD 0.17 L, 95% CI 0.09 to 0.26) were obtained from only one trial dPoint deducted, as we were unable to combine data on this outcome; results are presented in a separate table | |||||
| Study | FF/VI 100/25 mcg | FF 100 mcg | FF 200 mcg | FF/VI 200/25 mcg | VI 25 mcg | FP/SAL 250/50 mcg twice‐daily | FP 500 mcg | Prednisolone 10 mg | Placebo |
| 6 weeks' duration. On‐treatment AEs | 23/56 (41.00%) | ‐ | ‐ | 21/56 (38.00%) | ‐ | ‐ | ‐ | 5/15 (33.00%) | 16/58 (28.00%) |
| ≥24 to 78 weeks' duration. On‐treatment AEs | 636/1009 (63.00%) | 652/1010 (65.00%) | ‐ | ‐ | ‐ | ‐ | ‐ | ‐ | ‐ |
| 12 weeks' duration | 54/346 (15.61%) | 67/347 (19.31%) | ‐ | 52/346 (15.03%) | ‐‐ | ‐ | ‐ | ‐ | |
| 12 weeks' duration | 29/201 (14.43%) | 20/205 (9.76%) | ‐ | ‐ | ‐ | ‐ | ‐ | ‐ | 22/203 (10.84%) |
| 52 weeks' duration. On‐treatment AEs | 139/201 (69.15%) | ‐ | ‐ | 134/202 (66.34%) | ‐ | ‐ | 73/100 (73.00%) | ‐ | ‐ |
| Cross‐over trial. 3 of 7 treatments (2 weeks) separated by 12 to 14‐day washout periods | 43/172 (25%) | 25/187 (13%) | ‐ | ‐ | ‐ | ‐ | ‐ | ‐ | ‐ |
| 12 weeks' duration. Any AE | ‐ | ‐ | ‐ | 40/155 (26.00%) | ‐ | ‐ | 41/154 (27.00%) | ‐ | ‐ |
| Cross‐over trial. Each period lasted 14 days with a 14 to 21‐day washout period between periods | 11/24 (45.83%) AM 12/25 (48.00%) PM | ‐ | ‐ | ‐ | ‐ | ‐ | ‐ | ‐ | 8/23 (34.78%) |
| 24 weeks' duration | ‐ | ‐ | 66/194 (34.02%) | 62/197 (31.47%) | ‐ | ‐ | 73/195 (37.44%) | ‐ | ‐ |
| Cross‐over trial. 11 weeks (for a single period) | 4/25 (16.00%) | 1/25 (4.00%) | ‐ | ‐ | ‐ | ‐ | ‐ | ‐ | ‐ |
| Cross‐over trial. 28 days for each period | 11/51 (21.57%) | 18/51 (35.29%) | ‐ | ‐ | ‐ | ‐ | ‐ | ‐ | 15/51 (29.41%) |
| Cross‐over trial. 21 days | 20/27 (74.07%) | 19/27 (70.37%) | ‐ | ‐ | 22/26 (84.62%) | ‐ | ‐ | ‐ | 19/27 (70.37%) |
| 24 weeks' duration | 110/403 (27.30%) | ‐ | ‐ | ‐ | ‐ | 106/403 (26.30%) | ‐ | ‐ | ‐ |
| Fractions shown in the table indicate the proportions of people who suffered one or more adverse events of any cause in each treatment arm AE: adverse event; F: fluticasone furoate; FP: fluticasone propionate; SAL: salmeterol; VI: vilanterol | |||||||||
| Study | Duration (weeks) | Severity at baseline | Inclusion criteria | Adverse events |
| 6 | Reversibility > 12%
FEV1 > 50% of predicted | Adults Comply with treatment
Clinical diagnosis of asthma for ≥ 12 weeks | Cortisol urinary excretion, serum AUC and trough | |
| 24 to 78 | Reversibility > 12%
FEV1 > 50% to 90% of predicted | Adults Using ICS
History of ≥ 1 exacerbation requiring hospitalisation or steroids in the past year | None | |
| 12 | Reversibility > 12% FEV1 50% to 80% of predicted | ICS for > 12 weeks before study
> 12 years of age | Yes, not clear | |
| 12 | Pre‐bronchodilator FEV1 40% to 90% of predicted normal Reversibility FEV1 ≥ 12% | ICS for 12 weeks before study
> 12 years of age | Details not stated | |
| 52 | Pre‐bronchodilator FEV1 40% to 90% of predicted normal Reversibility FEV1 ≥ 12%
| Adults Clinical diagnosis of asthma
ICS at high dose | Details not stated | |
| 4 | ACT suggesting poor control and FEV1 mean 70% (SD 11%) | Asthma ≥ 20 years of age | No, conference abstract only | |
| 4 | Pre‐bronchodilator FEV1 40% to 80% of predicted Demonstrated reversibility by ≥ 12% | Need for regular controller therapy for minimum of 8 weeks Stable dose of ICS for ≥ 4 weeks ≥ 18 years of age Diagnosis of asthma for ≥ 6 months
| No | |
| 12 | Reversibility of disease: demonstrated ≥ 12% and FEV1 40% to 90%
| ICS, with or without LABA, for ≥ 12 weeks Clinical diagnosis of asthma for 12 weeks
Adults | No | |
| 6 to 8 | Pre‐bronchodilator FEV1 ≥ 60% of predicted.
| 18 and 70 years of age inclusive Using an ICS, with or without a SABA, for ≥ 12 weeks before screening Participants who are current non‐smokers, who have not used inhaled tobacco products in the 12‐month period preceding screening visit Body weight ≥ 50 kg and BMI within the range 19.0 to 29.9 kg/m2 | Yes, details not stated | |
| 24 | Pre‐bronchodilator FEV1 40% to 90% of predicted Reversibility FEV1 ≥ 12%
| Current asthma therapy that includes an ICS for ≥ 12 weeks before first visit Adults | Cortisol, ECG, mouth swabs, various blood parameters | |
| 14 | Mild to moderate (GINA) | Stable asthma therapy (FP, total daily dose ≤ 400 mcg or equivalent) and SABA inhaler for ≥ 4 weeks before screening 5 to 12 years of age Clinical diagnosis of asthma 6 months before Controlled asthma (Childhood ACT > 19) | Not stated | |
| 8 | Pre‐bronchodilator FEV1 > 70% of predicted at screening
Methacholine challenge PC20 < 8 mg/mL at screening
| Adults Stable asthma therapy (FP, total daily dose ≤ 400 mcg or equivalent) and SABA inhaler for ≥ 4 weeks before screening BMI within the range 18.5 to 35.0 kg/m2
| Not stated | |
| 3 with 3 weeks' washout | Pre‐bronchodilator FEV1 > 70% of predicted at screening
Methacholine challenge PC20 < 8 mg/mL at screening
| Stable asthma therapy (FP, total daily dose ≤ 400 mcg or equivalent) and SABA inhaler for ≥ 4 weeks before screening BMI within the range 18.5 to 35.0 kg/m2 Adults | Not stated | |
| 24 | Reversibility ≥ 12% and 200 mL within 10 to 40 minutes following 2 to 4 inhalations of albuterol FEV1 40% to 85% predicted normal | Currently using ICS therapy Clinical diagnosis of asthma Adults | Not stated | |
| ACT: Asthma Control Test AUC: area under the curve BMI: body mass index ECG: electrocardiogram FEV1: forced expiratory volume in one second FP: fluticasone propionate GINA: Global Initiative for Asthma ICS: inhaled corticosteroid LABA: long‐acting beta2‐agonist PC20: provocative concentration of methacholine estimated to result in a 20% reduction in FEV1 SABA: short‐acting beta2‐agonist | ||||
| Study score (change from baseline) | FF/VI 100/25 mcg Mean (SE), N | FF 100 mcg Mean (SE), N | FF 200 mcg Mean (SE), N | FF/VI 200/25 mcg Mean (SE), N | FP/SAL 250/50 mcg twice‐daily | FP 500 mcg | Placebo | MD (95% CI) |
| AQLQ change from baseline at 12 weeks | 0.91 (0.055), n = 180 | 0.76 (0.055), n = 184 | ‐ | ‐ | ‐ | ‐ | 0.61 (0.061), n = 149 | 0.15 (0.00 to 0.30), 0.30 (0.14 to 0.46), 0.15 (‐0.01 to 0.31) |
| AQLQ change from baseline at 12 weeks | ‐ | ‐ | ‐ | 0.80 (0.069), n = 140 | ‐ | 0.69 (0.074), n = 123 | ‐ | 0.12 (‐0.08 to 0.32) |
| AQLQ change from baseline at 12 weeks | ‐ | ‐ | 0.66 (0.061), n = 154 | 0.74 (0.056), n = 180 | ‐ | 0.74 (0.059), n = 163 | ‐ | ‐0.08 (‐0.24 to 0.08), ‐0.08 (‐0.25 to 0.09), 0.00 (‐0.16 to 0.16) |
| AQLQ change from baseline at 24 weeks | ‐ | ‐ | 0.88 (0.071), n = 140 | 0.93 (0.065), n = 167 | ‐ | 0.90 (0.068), n = 156 | ‐ | ‐0.05 (‐0.24 to 0.14), ‐0.02 (‐0.21 to 0.17), 0.03 (‐0.15 to 0.21) |
| AQLQ change from baseline at 168 days | 0.46 (0.043), n = 342 | ‐ | ‐ | ‐ | 0.37 (0.043), n = 335 | ‐ | ‐ | 0.09 (‐0.03 to 0.21) |
| EQ‐5D change from baseline at 168 days | 5.5 (0.60), n = 343 | ‐ | ‐ | ‐ | 4.1 (0.60), n = 349 | ‐ | ‐ | 1.4 (‐0.3 to 3.0) |
| AQLQ: asthma quality of life questionnaire; CI: confidence interval; EQ‐5D: EuroQuality of Life‐5D questionnaire; FF: fluticasone furoate; FP: fluticasone propionate; MD: mean difference; SAL: salmeterol; SE: standard error; VI: vilanterol | ||||||||
| Study | FF/VI 100/25 mcg | FF 100 mcg | FF 200 mcg | FF/VI 200/25 mcg | FP/SAL 250/50 mcg twice‐daily | FP 500 mcg | Prednisolone 10 mg | Placebo |
| 6 weeks' duration | 0/56 (0.00%) | ‐ | ‐ | 0/56 (0.00%) | ‐ | ‐ | 0/15 (0.00%) | 0/58 (0.00%) |
| ≥ 24 to 78 weeks' duration Time to first severe exacerbation (HR 0.80, 95% CI 0.64 to 0.99). Annualised rate of severe exacerbation 25% reduction (95% CI 5% to 40%) | 154/1009 (15.26%) | 186/1010 (18.42%) | ‐ | ‐ | ‐ | ‐ | ‐ | ‐ |
| 52 weeks' duration | 3/201 (1.49%) | ‐ | ‐ | 6/202 (2.97%) | ‐ | 3/100 (3.00%) | ‐ | ‐ |
| 12 weeks' duration | ‐ | ‐ | ‐ | 1/155 (0.65%) | ‐ | 3/154 (1.95%) | ‐ | ‐ |
| Cross‐over trial. Each period lasted 14 days with a 14 to 21‐day washout period between periods | 0/24 (0.00%) AM 0/25 (0.00%) PM | ‐ | ‐ | ‐ | ‐ | ‐ | ‐ | 0/23 (0.00%) |
| 24 weeks' duration | 1/403 (0.25%) | ‐ | ‐ | ‐ | 2/403 (0.50%) | ‐ | ‐ | ‐ |
| aOne participant in the FF/VI 100/25 mcg group experienced a severe asthma exacerbation concurrent with sinusitis and was withdrawn owing to lack of efficacy. The participant did not require hospitalisation, and the event, which was not classified as an AE, resolved following treatment with prednisone bThe incidence of asthma exacerbations was low, and no difference was noted between groups (3% vs 2% on FP/SAL vs FF/VI, respectively (on‐treatment events)). Eight (2%) participants in the FF/VI group and seven (2%) in the FP/SAL group withdrew because of exacerbation. One patient in the FF/VI group and two in the FP/SAL group were hospitalised because of exacerbation AM: morning; CI: confidence interval; FF: fluticasone furoate; FP: fluticasone propionate; HR: hazard ratio; PM: afternoon; SAL: salmeterol; VI: vilanterol | ||||||||
| Study | FF/VI 100/25 mcg | FF 100 mcg | FF 200 mcg | FF/VI 200/25 mcg | VI 25 mcg | FP/SAL 250/50 mcg twice‐daily | FP 500 mcg | Prednisolone 10 mg | Placebo |
| 6 weeks' duration. Post‐treatment period SAEs | 0/56 (0.00%) | ‐ | ‐ | 0/56 (0.00%) | ‐ | ‐ | ‐ | 0/15 (0.00%) | 0/58 (0.00%) |
| ≥ 24 to 78 weeks' duration. On‐treatment SAEs | 41/1009 (4.06%) | 29/1010 (2.87%) | ‐ | ‐ | ‐ | ‐ | ‐ | ‐ | ‐ |
| 12 weeks' duration | 4/346 (1.16%) | 3/347 (0.86%) | ‐ | 1/346 (0.29%) | ‐ | ‐ | ‐ | ‐ | ‐ |
| 12 weeks' duration | 0/201 (0.00%) | 1/205 (0.49%) | ‐ | ‐ | ‐ | ‐ | ‐ | ‐ | 0/203 (0.00%) |
| 52 weeks' duration. On‐treatment SAEs | 3/201 (1.49%) | ‐ | ‐ | 1/202 (0.50%) | ‐ | ‐ | 7/100 (7.00%) | ‐ | ‐ |
| Cross‐over trial. Three of 7 treatments (2 weeks) separated by 12 to 14‐day washout periods | 1/172 (0.006%) | 0/187 (0%) | ‐ | ‐ | ‐ | ‐ | ‐ | ‐ | ‐ |
| 12 weeks' duration | ‐ | ‐ | ‐ | 1/155 (0.65%) | ‐ | ‐ | 2/154 (1.30%) | ‐ | ‐ |
| Cross‐over trial. Each period lasted 14 days with a 14 to 21‐day washout period | 0/24 (0.00%) AM. 0/25 (0.00%) PM. | ‐ | ‐ | ‐ | ‐ | ‐ | ‐ | ‐ | 0/23 (0.00%) |
| 24 weeks' duration | ‐ | ‐ | 1/194 (0.52%) | 6/197 (3.05%) | ‐ | ‐ | 2/195 (1.03%) | ‐ | ‐ |
| Cross‐over trial. 11 weeks (for a single period) | 0/25 (0.00%) | 0/25 (0.00%) | ‐ | ‐ | ‐ | ‐ | ‐ | ‐ | ‐ |
| Cross‐over trial. 28 days for each period | 0/51 (0.00%) | 0/51 (0.00%) | ‐ | ‐ | ‐ | ‐ | ‐ | ‐ | 0/51 (0.00%) |
| Cross‐over trial. 21 days | 0/27 (0.00%) | 0/27 (0.00%) | ‐ | ‐ | 0/26 (0.00%) | ‐ | ‐ | ‐ | 0/27 (0.00%) |
| 24 weeks' duration | 4/403 (0.99%) | ‐ | ‐ | ‐ | ‐ | 5/403 (1.24%) | ‐ | ‐ | ‐ |
| aThe main paper reports that 1 of the 52 withdrew during the study owing to an SAE, which occurred 4 days after the last dose in the FF 100 treatment period. This participant was provisionally diagnosed with moderate (grade 2) Still’s disease. Six weeks later, the participant was hospitalised. A diagnosis of histiocytic necrotising lymphadenitis (Kikuchi’s disease) was made on the basis of histology of an excised lymph node. Tapered prednisolone treatment, initiated at 60 mg per day, has been successful FF: fluticasone furoate; FP: fluticasone propionate; SAE: serious adverse event; SAL: salmeterol; VI: vilanterol | |||||||||
| Study measure time point/ duration | FF/VI 100/25 mcg Mean (SE), N, of MD (95% CI) | FF 100 mcg Mean (SE), N | FF 200 mcg Mean (SE), N | FF/VI 200/25 mcg Mean (SE), N | VI 25 mcg Mean (SE), N | FP/SAL250/50 mcg twice‐daily Mean (SE), N | FP 500 mcg Mean (SE), N | Placebo Mean (SE), N | MD (95% CI, unless otherwise stated) |
| Trough FEV1 At 0 to 12 weeks Change in baseline trough FEV1 from baseline to week 12 | 0.441 L (0.022) | 0.365 L (0.022) | ‐ | 0.457 L (0.022) | ‐ | ‐ | ‐‐ | ‐ | ‐ |
| Trough FEV1 At 0 to 12 weeks Mean change in trough FEV1 (pre‐bronchodilator and pre‐dose) from baseline to week 12 | 0.368 L (0.0304), n = 200 | 0.332 L (0.0302), n = 203 | ‐ | ‐ | ‐ | ‐ | ‐ | 0.196 L (0.0310), n = 193 | 0.04 L (‐0.05 to 0.12) 0.17 L (0.09 to 0.26) 0.14 L (0.05 to 0.22) |
| Trough FEV1 combining all treatment periods At 0 to 2 weeks 3 of 7 treatments (2 weeks) separated by 12 to 14‐day washout periods | 0.200 L, n = 158 | 0.087 L, n = 158 | ‐ | ‐ | ‐ | ‐ | ‐ | ‐ | ‐ |
| 12 weeks' duration | ‐ | ‐ | ‐ | ‐ | ‐ | ‐ | ‐ | ‐ | Adjusted treatment difference 0.108 L (0.040 to 0.176) |
| Weighted mean FEV1 over the day At day 14 Weighted mean FEV1, over 0 to 24 hours post dose at day 14 Cross‐over trial. Each period lasted 14 days with a 14 to 21‐day washout period | AM dose: 3.188 L PM dose: 3.233 L | ‐ | ‐ | ‐ | ‐ | ‐ | ‐ | 2.811 L n = 20 | AM vs placebo 0.377 L (90% CI 0.293 to 0.462) PM vs placebo 0.422 L (90% CI 0.337 to 0.507) AM vs PM ‐0.44 L (90% CI ‐0.125 to 0.36) |
| Day 14 pre‐treatment (trough) AM FEV1 At day 14 | AM dose: 3.191 L PM dose: 3.285 L n = 25 | ‐ | ‐ | ‐ | ‐ | ‐ | ‐ | 2.788 L n = 22 | AM vs placebo 0.403 L (90% CI 0.272 to 0.533) PM vs placebo 0.496 L (90% CI 0.369 to 0.624) AM vs PM ‐0.094 L (90% CI ‐0.221 to 0.034) |
| Day 14 pre‐treatment (trough) PM FEV1 At day 14 | AM dose: 3.153 L PM dose: 3.188 L | ‐ | ‐ | ‐ | ‐ | ‐ | ‐ | 2.879 L n = 23 | AM vs placebo 0.275 L (90% CI 0.169 to 0.380) PM vs placebo 0.309 L (90% CI 0.205 to 0.413) AM vs PM ‐0.034 (90% CI ‐0.138 to 0.070) |
| Change in baseline trough FEV1 At 24 weeks Change from baseline in clinic visit trough (pre‐bronchodilator and pre‐dose) FEV1 at end of 24‐week treatment period | ‐ | ‐ | 0.201 L (0.0303), n = 186 | 0.394 L (0.0302), n = 187 | ‐ | ‐ | 0.183 L (0.0300), n = 190 | ‐ | ‐0.19 L (‐0.28 to ‐0.11) 0.02 L (‐0.06 to 0.10) 0.21 L (0.13 to 0.29) |
| Change from baseline in weighted mean serial FEV1 over 24 hours At 24 weeks Change from baseline in weighted mean serial FEV1 over 0 to 24 hours post dose at week 24 | ‐ | ‐ | 0.328 L (0.0493), n = 83 | 0.464 L (0.0470), n = 89 | ‐ | ‐ | 0.258 L (0.0483), n = 86 | ‐ | ‐0.14 L (‐0.27 to ‐0.00) 0.07 L (‐0.07 to 0.21) 0.21 L (0.07, 0.34) |
| 23 hours post challenge At day 29 Cross‐over trial ‐ 28 days for each period Weighted mean change from baseline in FEV1 between 0 and 2 hours following 22 to 23‐hour post‐treatment allergen challenge at day 29 of each treatment period | ‐0.227 L (0.0550), n = 46 | ‐0.210 L (0.0549), n = 49 | ‐ | ‐ | ‐ | ‐ | ‐ | ‐0.372 L (0.0557), n = 45 | FF vs placebo 0.162 L (0.087 to 0.237) FF/VI vs placebo 0.145 L (0.069 to 0.222) FF/VI vs FF ‐0.017 L (‐0.091 to 0.057) |
| Decrease from baseline 23 hours post challenge At day 29 Maximum % decrease from baseline FEV1 between 0 and 2 hours following 22 to 23‐hour post‐treatment allergen challenge at day 29 of each treatment period (time frame: baseline and at day 29 of each treatment period (up to study day 197)) | ‐13.206% (2.0491), n = 46 | ‐14.040% (2.0435), n = 49 | ‐ | ‐ | ‐ | ‐ | ‐ | ‐24.991% (2.0736), n = 45 | FF vs placebo 10.951% (8.053 to 13.848) (8.849 to 14.721) |
| Change from baseline FEV1 23 hours post challenge Minimum FEV1 absolute change from baseline between 0 and 2 hours following 22 to 23‐hour post‐treatment allergen challenge at day 29 of each treatment period | ‐0.478 L (0.0767), n = 46 | ‐0.479 L (0.0765), n = 49 | ‐ | ‐ | ‐ | ‐ | ‐ | ‐0.809 L (0.0775), n = 45 | FF vs placebo 0.330 L (0.232 to 0.429) |
| Change from baseline 4 to 10 hours post challenge At day 21 Cross‐over trial ‐ 21 days LAR: absolute change from baseline in minimum FEV1 between 4 and 10 hours following 1‐hour post‐treatment allergen challenge at day 21 of each treatment period | ‐0.216 L n = 26 | ‐0.188 L n = 27 | ‐ | ‐ | ‐0.536 L n = 22 | ‐ | ‐ | ‐0.731 L n = 20 | ‐ |
| Change from baseline 4 to 10 hours post challenge At day 21 LAR: absolute change from baseline in weighted mean FEV1 between 4 and 10 hours following 1‐hour post‐treatment allergen challenge at day 21 of each treatment period | 0.018 L | 0.018 L n = 27 | ‐ | ‐ | ‐0.298 L n = 22 | ‐ | ‐ | ‐0.466 L n = 20 | ‐ |
| Change from baseline trough FEV1 At day 168 24 weeks' duration | 0.281 L (0.0191), n = 397 | ‐ | ‐ | ‐ | ‐ | 0.300 L (0.0193), n = 389 | ‐ | ‐ | ‐0.019 L (‐0.073 to 0.034) |
| AM: morning; CI: confidence interval; FEV1: forced expiratory volume in one second; FF: fluticasone furoate; FP: fluticasone propionate; h: hour; LAR: late asthmatic response; MD: mean difference; PM: afternoon; SAL: salmeterol; SE: standard error; VI: vilanterol | |||||||||
| Study | Duration (weeks) | Measure of PEF | FF/VI 100/25 mcg Mean (SD, unless otherwise stated), N | FF 100 mcg Mean (SD, unless otherwise stated), N | FF 200 mcg Mean (SE), N | FF/VI 200/25 mcg Mean (SE ), N | FP 500 mcg Mean (SE), N | Placebo Mean (SE, unless otherwise stated), N | MD (95% CI, unless otherwise stated) |
| 12 | Change from baseline, AM Change from baseline in AM PEF Averaged over 12‐week treatment period | 44.3 L/min (2.25) | 19.1 L/min (2.25) | ‐ | 47.7 L/min (2.25) | ‐ | 25.20 L/min (18.96 to 31.44), 100/25 vs 100 FF | ||
| 12 | Change from baseline, PM Change from baseline in AM PEF Averaged over 12‐week treatment period | 39.7 L/min (2.24) | 15.5 L/min (2.24) | ‐ | 41.7 L/min (2.24) | ‐ | 24.20 L/min (17.99 to 30.41), 100/25 vs 100 FF | ||
| 12 | Change from baseline, PM Mean change from baseline in daily PM PEF averaged over 12‐week treatment period | 26.4 L/min (SE 2.35), n = 201 | 14.1 L/min (SE 2.34), n = 204 | ‐ | ‐ | ‐ | ‐1.8 L/min (2.36), n = 202 | 12.30 L/min (5.80 to 18.80), 28.20 L/min (21.67 to 34.73), 15.90 L/min (9.39 to 22.41) | |
| 4 | Change from baseline, AM Only 1 (FF/VI) condition reported. Trial reported as conference abstract with limited information | ||||||||
| Baseline to day 15 | Least squares mean change calculated from baseline to day 15 Least squares mean change in last 7 days, mean PEF | 24.1 (2.46) AM 21.4 (2.58) PM n = 172 | ‐2.9 (2.44) AM ‐5.2 (2.51) PM n = 187 | ‐ | ‐ | ‐ | ‐ | ‐ | |
| 12 | 12 weeks' duration. | ‐ | ‐ | ‐ | 39.1 L/min (3.01), n = 155 | 10.5 L/min (3.03), n = 154 | ‐ | Adjusted treatment difference 28.5 L/min (20.1 to 36.9) | |
| 12 days | Pre‐treatment Pre‐treatment PEF at days 1 to 12 Cross‐over trial. Each period lasted 14 days with a 14 to 21‐day washout period | AM dose: 510.4 L/min PM dose: 535.3 L/min | ‐ | ‐ | ‐ | ‐ | 466.3 L/min | AM vs placebo 44.0 L/min (90% CI 31.2 to 56.9) PM vs placebo 69.0 L/min (90% CI 55.9 to 82.1) AM vs PM ‐25.0 L/min (90% CI ‐37.9 to ‐12.0) | |
| 12 days | Pre‐treatment Pre‐treatment PEF (PM) at days 1 to 12 | AM dose: 517.6 L/min PM dose: 521.4 L/min | ‐ | ‐ | ‐ | ‐ | 453.2 L/min | AM vs placebo 64.4 L/min (90% CI 52.9 to 76.0) PM vs placebo 68.2 L/min (90% CI 56.5 to 79.8) AM vs PM ‐3.7 L/min (90% CI ‐15.2 to 7.7) | |
| 24 | Change from baseline, AM 4 weeks Mean change from baseline in daily trough (AM) PEF averaged over 24‐week treatment period | ‐ | ‐ | 18.2 L/min (2.97), n = 193 | 51.8L/min (2.94), n = 197 | 18.8L/min (2.95), n = 195 | ‐ | ‐33.60 L/min (‐41.79 to, ‐25.41), ‐0.60 L/min (‐8.80 to 7.60), 33.00 L/min (24.84 to 41.16) | |
| 24 | Change from baseline, PM Mean change from baseline in daily trough (PM) PEF averaged over 24‐week treatment period | ‐ | ‐ | 9.1 L/min (2.98), n = 192 | 39.8 L/min (2.93), n = 197 | 13.6 L/min (2.96), n = 194 | ‐ | ‐30.70 L/min (‐38.89 to ‐22.51), ‐4.50 L/min (‐12.73 to 3.73), 26.20 L/min (18.04 to 34.36) | |
| AM: morning; CI: confidence interval; FF: fluticasone furoate; PEF: peak expiratory flow; PM: evening; SD: standard deviation; SE: standard error; VI: vilanterol | |||||||||
| Study | Measure | FF/VI 100/25 mcg Mean (SE) | FF 100 mcg Mean (SE) | FF 200 mcg Mean (SE) | FF/VI 200/25 mcg Mean (SE) | FP/SAL250/50 mcg twice‐daily Mean (SE) | FP 500 mcg Mean (SE) | Placebo Mean (SE) | MD (95% CI) |
| ≥ 24 to 78 weeks' duration Responder analysis results: ORs for FF/VI vs FF at week 12 (1.49, 95% CI 1.20 to 1.84), week 36 (1.49, 95% CI 1.21 to 1.83) and at endpoint (1.50, 95% CI 1.23 to 1.82) | ACQ7 mean difference and responder analysis | NR | NR | ‐ | ‐ | ‐ | ‐ | ‐ | ‐ |
| Change from baseline in percentage of symptom‐free 24‐hour periods during 12‐week treatment | Change from baseline % symptom‐free days | 27.2 (1.74) n = 345 | 19.4 (1.74) n = 346 | ‐ | 29.0 (1.74) n = 346 | ‐ | ‐ | ‐‐ | |
| Change from baseline in % of symptom‐free 24‐hour periods during 12‐week treatment period | Change from baseline % symptom‐free days | 32.5 (2.14), n = 201 | 20.4 (2.13), n = 204 | ‐ | ‐ | ‐ | ‐ | 14.6 (2.15), n = 202 | 12.10 (6.18 to 18.02), 17.90 (11.95 to 23.85), 5.80 (‐0.13 to 11.73) |
| Trial reported as conference abstract with limited information | Change from baseline ACT score | ||||||||
| LS mean change in symptom‐free days during 2‐week treatment period | LS mean change in symptom‐free days (SE) | 7.3 (1.67) n = 172 | 5.8 (1.64) n = 187 | ‐ | ‐ | ‐ | ‐ | ‐ | ‐ |
| % of symptom‐free 24‐hour periods, weeks 1 to 12 | % symptom‐free days | ‐ | ‐ | ‐ | 25.4 (2.74), n = 155 | ‐ | 20.6 (2.77), n = 152 | ‐ | 4.9 (‐2.8 to 12.5) |
| Change from baseline in ACT scores at week 12 | Change from baseline ACT score | ‐ | ‐ | 3.9 (0.29), n = 164 | 4.8 (0.27), n = 183 | ‐ | 3.9 (0.28), n = 169 | ‐ | ‐0.90 (‐1.68 to ‐0.12), 0.00 (‐0.79 to 0.79), 0.90 (0.14 to 1.66) |
| Change from baseline in ACT scores at week 24 | Change from baseline ACT score | ‐ | ‐ | 5.2 (0.30), n = 147 | 5.5 (0.28), n = 170 | ‐ | 4.7 (0.29), n = 162 | ‐ | ‐0.30 (‐1.10 to 0.50), 0.50 (‐0.32 to 1.32), 0.80 (0.01 to 1.59) |
| Change from baseline in ACT scores at day 168 and at 24 weeks | Change from baseline ACT score | 2.3 (0.16), n = 354 | ‐ | ‐ | ‐ | 2.0 (0.16), n = 348 | ‐ | ‐ | 0.2 (‐0.2 to 0.7) |
| ACT: asthma control test; CI: confidence interval; FF: fluticasone furoate; FP: fluticasone propionate; LS: least squares; MD: mean difference; NR: not reported; OR: odds ratio; SAL: salmeterol; SE: standard error; VI: vilanterol | |||||||||
| Outcome or subgroup title | No. of studies | No. of participants | Statistical method | Effect size |
| 1 Change in quality of life (measured by AQLQ at 12 wk) Show forest plot | 1 | 329 | Mean Difference (Fixed, 95% CI) | 0.3 [0.14, 0.46] |
| 2 Exacerbations Show forest plot | 2 | 161 | Odds Ratio (M‐H, Fixed, 95% CI) | 0.0 [0.0, 0.0] |
| 3 Serious adverse events Show forest plot | 5 | 721 | Odds Ratio (M‐H, Fixed, 95% CI) | 0.0 [0.0, 0.0] |
| 4 FEV1 Litres Show forest plot | 1 | Mean Difference (Fixed, 95% CI) | 0.17 [0.09, 0.26] | |
| 5 PEFR AM L/min (change from baseline at 12 wk) Show forest plot | 1 | Mean Difference (Fixed, 95% CI) | 33.3 [26.59, 40.01] | |
| 6 PEFR PM L/min (change from baseline at 12 wk) Show forest plot | 1 | Mean Difference (Fixed, 95% CI) | 28.2 [21.67, 34.73] | |
| 7 Change in asthma symptoms (measured by ACT) Show forest plot | 1 | 339 | Mean Difference (Fixed, 95% CI) | 1.9 [1.22, 2.58] |
| Outcome or subgroup title | No. of studies | No. of participants | Statistical method | Effect size |
| 1 Change in quality of life (measured by AQLQ at 12 wk) Show forest plot | 1 | Mean Difference (Fixed, 95% CI) | 0.15 [‐0.00, 0.30] | |
| 2 Exacerbations Show forest plot | 2 | 2425 | Odds Ratio (M‐H, Fixed, 95% CI) | 1.38 [0.86, 2.22] |
| 3 Serious adverse events Show forest plot | 5 | 1258 | Odds Ratio (M‐H, Fixed, 95% CI) | 1.61 [0.42, 6.17] |
| 4 Trough FEV1 (L) Show forest plot | 1 | Mean Difference (Fixed, 95% CI) | 0.08 [0.02, 0.14] | |
| 5 PEFR AM (change from baseline at 12 wk) Show forest plot | 2 | Mean Difference (Fixed, 95% CI) | 20.29 [15.72, 24.85] | |
| 6 PEFR PM (change from baseline at 12 wk) Show forest plot | 2 | Mean Difference (Fixed, 95% CI) | 18.52 [14.03, 23.01] | |
| 7 Change in asthma symptoms (measured by ACT) Show forest plot | 1 | Mean Difference (Fixed, 95% CI) | 0.6 [‐0.04, 1.24] | |
| Outcome or subgroup title | No. of studies | No. of participants | Statistical method | Effect size |
| 1 Serious adverse events Show forest plot | 1 | 53 | Odds Ratio (M‐H, Fixed, 95% CI) | 0.0 [0.0, 0.0] |
| Outcome or subgroup title | No. of studies | No. of participants | Statistical method | Effect size |
| 1 Exacerbations Show forest plot | 1 | 301 | Odds Ratio (M‐H, Fixed, 95% CI) | 0.49 [0.10, 2.47] |
| 2 Serious adverse events Show forest plot | 1 | 301 | Odds Ratio (M‐H, Fixed, 95% CI) | 0.20 [0.05, 0.80] |
| Outcome or subgroup title | No. of studies | No. of participants | Statistical method | Effect size |
| 1 Change in quality of life (measured by AQLQ at 24 wk) Show forest plot | 1 | 677 | Mean Difference (Fixed, 95% CI) | 0.09 [‐0.03, 0.21] |
| 2 Exacerbations Show forest plot | 1 | 806 | Odds Ratio (M‐H, Fixed, 95% CI) | 0.50 [0.05, 5.52] |
| 3 Serious adverse events Show forest plot | 1 | 806 | Odds Ratio (M‐H, Fixed, 95% CI) | 0.80 [0.21, 2.99] |
| 4 FEV1 Show forest plot | 1 | Mean Difference (Fixed, 95% CI) | ‐0.02 [‐0.07, 0.03] | |
| 5 Change in asthma symptoms (measured by ACT) Show forest plot | 1 | Mean Difference (Fixed, 95% CI) | 0.24 [‐0.20, 0.68] | |
| Outcome or subgroup title | No. of studies | No. of participants | Statistical method | Effect size |
| 1 Exacerbations Show forest plot | 2 | 515 | Odds Ratio (M‐H, Fixed, 95% CI) | 2.02 [0.50, 8.19] |
| 2 Serious adverse events Show forest plot | 2 | 515 | Odds Ratio (M‐H, Fixed, 95% CI) | 0.33 [0.03, 3.18] |
| Outcome or subgroup title | No. of studies | No. of participants | Statistical method | Effect size |
| 1 Exacerbations Show forest plot | 1 | 114 | Odds Ratio (M‐H, Fixed, 95% CI) | 0.0 [0.0, 0.0] |
| 2 Serious adverse events Show forest plot | 1 | 114 | Odds Ratio (M‐H, Fixed, 95% CI) | 0.0 [0.0, 0.0] |
| 3 FEV1 Litres Show forest plot | 1 | Mean Difference (Fixed, 95% CI) | 0.21 [0.13, 0.29] | |
| 4 Change in asthma symptoms (measured by ACT) Show forest plot | 1 | Mean Difference (Fixed, 95% CI) | 0.9 [0.12, 1.68] | |
| Outcome or subgroup title | No. of studies | No. of participants | Statistical method | Effect size |
| 1 Change in quality of life (measured by AQLQ at 12 wk) Show forest plot | 2 | 606 | Mean Difference (Fixed, 95% CI) | 0.05 [‐0.08, 0.17] |
| 2 Change in quality of life (measured by AQLQ at 24 wk) Show forest plot | 1 | Mean Difference (Fixed, 95% CI) | 0.03 [‐0.15, 0.21] | |
| 3 OLD***Health‐related quality of life Show forest plot | 2 | 606 | Mean Difference (IV, Fixed, 95% CI) | 0.04 [‐0.08, 0.17] |
| 4 Exacerbations Show forest plot | 2 | 611 | Odds Ratio (M‐H, Fixed, 95% CI) | 0.70 [0.22, 2.20] |
| 5 Serious adverse events Show forest plot | 3 | 1003 | Odds Ratio (M‐H, Fixed, 95% CI) | 0.61 [0.25, 1.49] |
| 6 PEFR Show forest plot | 1 | Mean Difference (Fixed, 95% CI) | 28.6 [20.23, 36.97] | |
| 7 PEFR AM Show forest plot | 1 | Mean Difference (Fixed, 95% CI) | 33.0 [24.84, 41.16] | |
| 8 PEFR PM Show forest plot | 1 | Mean Difference (Fixed, 95% CI) | 26.2 [18.04, 34.36] | |
| 9 % symptom‐free days Show forest plot | 1 | Mean Difference (Fixed, 95% CI) | 4.8 [‐2.84, 12.44] | |
| 10 Change in asthma symptoms (measured by ACT) Show forest plot | 1 | 332 | Mean Difference (Fixed, 95% CI) | 0.8 [0.01, 1.59] |
| Outcome or subgroup title | No. of studies | No. of participants | Statistical method | Effect size |
| 1 Change in quality of life (measured by AQLQ at 12 wk) Show forest plot | 1 | Mean Difference (Fixed, 95% CI) | 0.08 [‐0.08, 0.24] | |
| 2 Change in quality of life (measured by AQLQ at 24 wk) Show forest plot | 1 | 307 | Mean Difference (Fixed, 95% CI) | 0.05 [‐0.14, 0.24] |
| 3 Serious adverse events Show forest plot | 1 | 391 | Odds Ratio (M‐H, Fixed, 95% CI) | 6.06 [0.72, 50.84] |
| 4 FEV1 Litres Show forest plot | 1 | Mean Difference (Fixed, 95% CI) | 0.19 [0.10, 0.28] | |
| 5 PEFR AM Show forest plot | 1 | Mean Difference (Fixed, 95% CI) | 33.6 [25.41, 41.79] | |
| 6 PEFR PM Show forest plot | 1 | Mean Difference (Fixed, 95% CI) | 30.7 [22.51, 38.89] | |
| 7 Change in asthma symptoms (measured by ACT) Show forest plot | 1 | 317 | Mean Difference (Fixed, 95% CI) | 0.3 [‐0.50, 1.10] |