Restricción o prohibición de la publicidad del alcohol para reducir el consumo de alcohol en adultos y adolescentes
Información
- DOI:
- https://doi.org/10.1002/14651858.CD010704.pub2Copiar DOI

- Base de datos:
-
- Cochrane Database of Systematic Reviews
- Versión publicada:
-
- 04 noviembre 2014see what's new
- Tipo:
-
- Intervention
- Etapa:
-
- Review
- Grupo Editorial Cochrane:
-
Grupo Cochrane de Alcohol y drogas
- Copyright:
-
- Copyright © 2014 The Cochrane Collaboration. Published by John Wiley & Sons, Ltd.
Cifras del artículo
Altmetric:
Citado por:
Autores
Contributions of authors
The study was commissioned by the Alcohol and Drug Abuse Research Unit and the South African Cochrane Centre of the South Medical Research Council. NS co‐ordinated the author team. NS and DCP extracted data and JEA served as the arbiter. NS inputted data and conducted analysis, and DCP and JEA checked them. CDHP and JV regularly reviewed results and provided guidance in the interpretation of results and recommendations for ensuring the comprehensiveness of the review. MJ provided expertise in marketing. All authors contributed to the interpretation of the results. NS wrote the initial draft of the review and all authors contributed to writing the final draft.
Sources of support
Internal sources
-
Alcohol and other Drug Research Unit, Medical Research Council, South Africa.
The Unit commissioned the study in partnership with the South African Cochrane Centre and co‐funded the lead author of the review.
-
South African Cochrane Centre, Medical Research Council, South Africa.
The Unit commissioned the study in partnership with the Alcohol and other Drug Research Unit and co‐funded the lead author of the review.
External sources
-
No sources of support supplied
Declarations of interest
NS, DCP, JV, TK and MJ declare no conflicts of interest.
JEA is a member of the WHO Working Group on Alcohol Taxation and Pricing. This working group is involved in drafting a technical resource on alcohol pricing and taxation policies and guidelines on how best to implement such policies.
CDHP is a member of the WHO Expert Panel on Drug Dependence and Alcohol Problems and a board member of the Global Alcohol Policy Alliance, a network whose mission is to reduce alcohol‐related harm worldwide by promoting science‐based policies independent of commercial interests.
Acknowledgements
The authors are grateful to Zuzana Mitrova of the Cochrane Drugs and Alcohol Review Group for her guidance and searching. We thank Tara Carney of the Medical Research Council Alcohol and Drug Abuse Research Unit for assisting so ably with article retrieval, and Joy Oliver of the South African Cochrane Centre for her assistance with procuring articles and administrative assistance.
We are very grateful to the two peer referees of our protocol who provided invaluable feedback to improve the protocol, and to the referees and contact editor who provided constructive criticism during the peer review process for the review.
We thank the following researchers who kindly shared data and presentations with us: Rogers Kasirye of the Uganda Youth Development Link; Prof Robin Room of Turning Point, Australia; Craig Ross of Virtual Media Resource Inc. The following organisations and associations responded to our requests for further information: Research Society on Alcoholism, Kettil Bruun Society, International Network on Brief Interventions for Alcohol Problems and the European Advertising Standards Alliance. We are grateful for their assistance.
Version history
| Published | Title | Stage | Authors | Version |
| 2014 Nov 04 | Restricting or banning alcohol advertising to reduce alcohol consumption in adults and adolescents | Review | Nandi Siegfried, David C Pienaar, John E Ataguba, Jimmy Volmink, Tamara Kredo, Mlenga Jere, Charles DH Parry | |
| 2013 Sep 13 | Restricting or banning of alcohol advertising to reduce alcohol consumption in adults and adolescents | Protocol | Nandi Siegfried, David C Pienaar, John E Ataguba, Jimmy Volmink, Tamara Kredo, Mlenga Jere, Charles DH Parry | |
Differences between protocol and review
The review followed the protocol as it was published, with no differences in methodology.
Keywords
MeSH
Medical Subject Headings (MeSH) Keywords
Medical Subject Headings Check Words
Adolescent; Adult; Humans; Male; Young Adult;
PICO

Flow diagram of screening and eligibility of records of electronic databases: PubMed, EMBASE, The Cochrane Library (CENTRAL and UK National Health Service Economic Evaluations Database) and PsychINFO
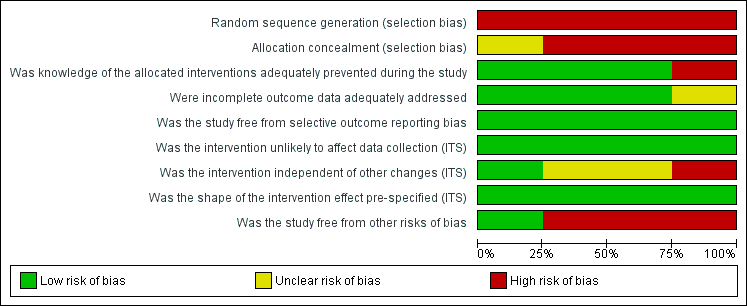
'Risk of bias' graph: review authors' judgements about each risk of bias item presented as percentages across all included studies (N = 4).

'Risk of bias' summary: review authors' judgements about each risk of bias item for each included study (N = 4).

Comparison 1 Low‐alcohol content movies versus high‐alcohol content movies, Outcome 1 Total alcohol consumption in number of glasses.
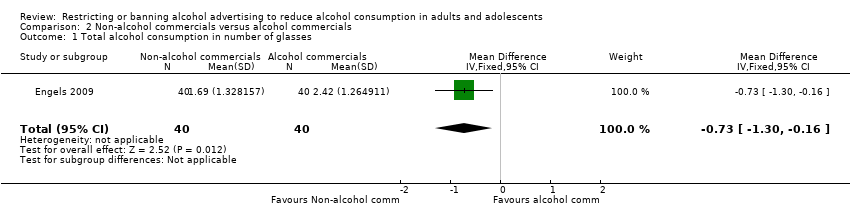
Comparison 2 Non‐alcohol commercials versus alcohol commercials, Outcome 1 Total alcohol consumption in number of glasses.

Comparison 3 High‐alcohol content movies versus low‐alcohol content movies adjusted for clustering effects, Outcome 1 Total alcohol consumption.

Comparison 4 Alcohol commercials versus non‐alcohol commercials adjusted for clustering effects, Outcome 1 Total alcohol consumption.

Comparison 5 Total advertising ban versus Partial advertising ban Abrupt permanent model, Outcome 1 Volume of alcohol (beer, wine and spirits) sales in kilolitres.
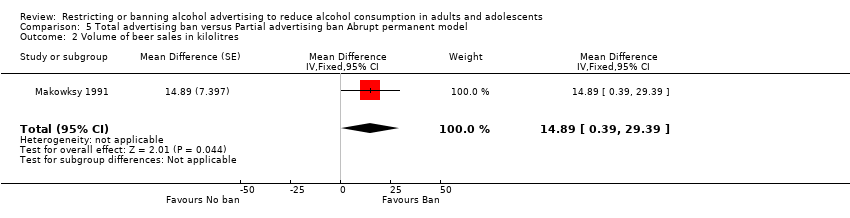
Comparison 5 Total advertising ban versus Partial advertising ban Abrupt permanent model, Outcome 2 Volume of beer sales in kilolitres.

Comparison 5 Total advertising ban versus Partial advertising ban Abrupt permanent model, Outcome 3 Volume of wine sales in kilolitres.

Comparison 5 Total advertising ban versus Partial advertising ban Abrupt permanent model, Outcome 4 Volume of spirits sales in kilolitres.
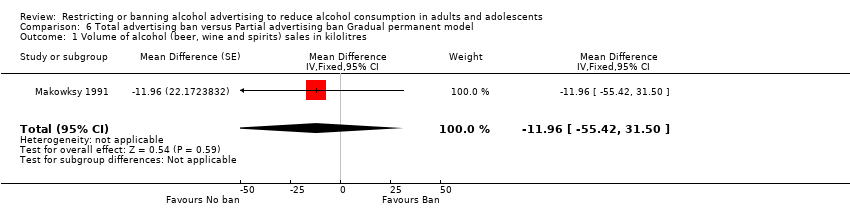
Comparison 6 Total advertising ban versus Partial advertising ban Gradual permanent model, Outcome 1 Volume of alcohol (beer, wine and spirits) sales in kilolitres.
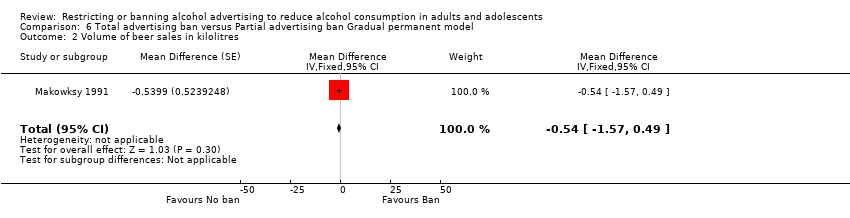
Comparison 6 Total advertising ban versus Partial advertising ban Gradual permanent model, Outcome 2 Volume of beer sales in kilolitres.
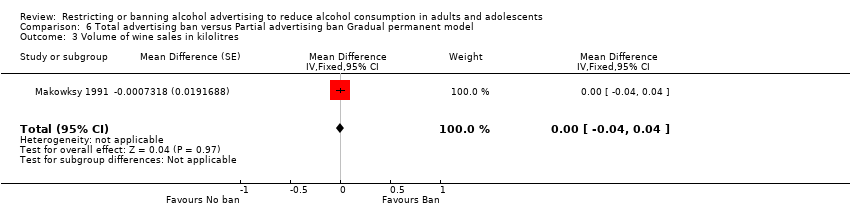
Comparison 6 Total advertising ban versus Partial advertising ban Gradual permanent model, Outcome 3 Volume of wine sales in kilolitres.
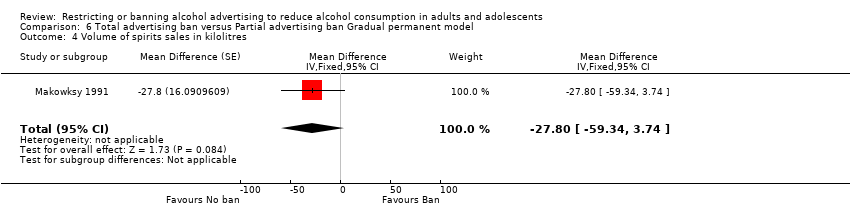
Comparison 6 Total advertising ban versus Partial advertising ban Gradual permanent model, Outcome 4 Volume of spirits sales in kilolitres.
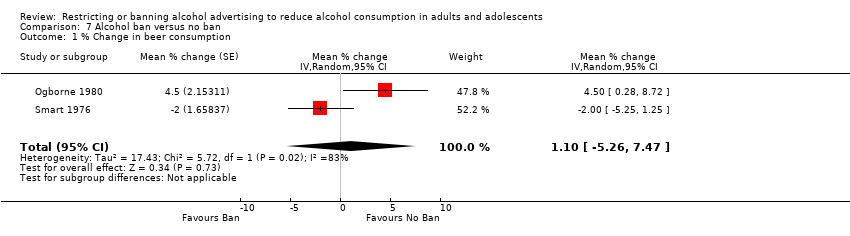
Comparison 7 Alcohol ban versus no ban, Outcome 1 % Change in beer consumption.
| Non‐alcohol commercials compared to alcohol commercials for reduction of alcohol consumption | ||||||
| Patient or population: General population | ||||||
| Outcomes | Illustrative comparative risks* (95% CI) | Relative effect | No. of participants | Quality of the evidence | Comments | |
| Assumed risk | Corresponding risk | |||||
| Alcohol commercials | Non‐alcohol commercials | |||||
| Total alcohol consumption in number of glasses | The mean total alcohol consumption in number of glasses in the intervention groups was | 80 | ⊕⊝⊝⊝ | |||
| Delayed age of initiation of alcohol use ‐ not measured | Not estimable | ‐ | This outcome was not applicable in this trial | |||
| Reduction in rate of reported risk behaviour ‐ not measured | Not estimable | ‐ | ||||
| Reduction in alcohol‐related injuries or accidents ‐ not measured | Not estimable | ‐ | ||||
| Reduction in individual spending on alcohol ‐ not measured | Not estimable | ‐ | ||||
| Loss of revenue from alcohol industry ‐ not measured | Not estimable | ‐ | This outcome was not applicable in this trial | |||
| Loss of advertising revenue ‐ not measured | Not estimable | ‐ | This outcome was not applicable in this trial | |||
| *The basis for the assumed risk (e.g. the median control group risk across studies) is provided in footnotes. The corresponding risk (and its 95% confidence interval) is based on the assumed risk in the comparison group and the relative effect of the intervention (and its 95% CI). | ||||||
| GRADE Working Group grades of evidence | ||||||
| 1 Risk of bias: rated as serious. In the Engels 2009 trial, randomisation was inadequate (the groups differed on the baseline prognostic factor prior drinking levels), allocation concealment was unclear and the researchers were not blinded to group allocation so detection bias may be present. | ||||||
| Alcohol ban compared to no ban for the general population | ||||||
| Patient or population: General population | ||||||
| Outcomes | Illustrative comparative risks* (95% CI) | Relative effect | No. of pParticipants | Quality of the evidence | Comments | |
| Assumed risk | Corresponding risk | |||||
| No ban | Alcohol ban | |||||
| Alcohol consumption: % change in beer consumption | The mean % change in beer consumption in the intervention groups was | 2 ITS studies | ⊕⊝⊝⊝ | Results for consumption of other types of alcoholic beverages and total consumption were inconsistent in the three ITS studies | ||
| Reduction in rate of reported risk behaviour ‐ not reported | See comment | See comment | Not estimable | ‐ | See comment | None of the studies measured this outcome |
| Delayed age of initiation of alcohol use ‐ not reported | See comment | See comment | Not estimable | ‐ | See comment | None of the studies measured this outcome |
| Reduction in alcohol‐related injuries or accidents ‐ not reported | See comment | See comment | Not estimable | ‐ | See comment | None of the studies measured this outcome |
| Reduction in individual spending on alcohol ‐ not reported | See comment | See comment | Not estimable | ‐ | See comment | None of the studies measured this outcome |
| Loss of revenue from alcohol industry ‐ not reported | See comment | See comment | Not estimable | ‐ | See comment | None of the studies measured this outcome |
| Loss of advertising revenue ‐ not reported | See comment | See comment | Not estimable | ‐ | See comment | None of the studies measured this outcome |
| *The basis for the assumed risk (e.g. the median control group risk across studies) is provided in footnotes. The corresponding risk (and its 95% confidence interval) is based on the assumed risk in the comparison group and the relative effect of the intervention (and its 95% CI). | ||||||
| GRADE Working Group grades of evidence | ||||||
| 1 Risk of bias: rated as serious: the risk of a dilution effect is present in both studies (Ogborne 1980 and Smart 1976) and seasonality may not be adequately addressed in the analyses. The studies were not further downgraded for limitations in causal inference due to a lack of randomisation, as the initial GRADE rating commenced at low quality. | ||||||
| Outcome or subgroup title | No. of studies | No. of participants | Statistical method | Effect size |
| 1 Total alcohol consumption in number of glasses Show forest plot | 1 | 80 | Mean Difference (IV, Fixed, 95% CI) | ‐0.65 [‐1.23, ‐0.07] |
| Outcome or subgroup title | No. of studies | No. of participants | Statistical method | Effect size |
| 1 Total alcohol consumption in number of glasses Show forest plot | 1 | 80 | Mean Difference (IV, Fixed, 95% CI) | ‐0.73 [‐1.30, ‐0.16] |
| Outcome or subgroup title | No. of studies | No. of participants | Statistical method | Effect size |
| 1 Total alcohol consumption Show forest plot | 1 | Coefficient (Fixed, 95% CI) | 0.74 [0.05, 1.43] | |
| Outcome or subgroup title | No. of studies | No. of participants | Statistical method | Effect size |
| 1 Total alcohol consumption Show forest plot | 1 | Coefficient (Fixed, 95% CI) | 0.83 [0.14, 1.52] | |
| Outcome or subgroup title | No. of studies | No. of participants | Statistical method | Effect size |
| 1 Volume of alcohol (beer, wine and spirits) sales in kilolitres Show forest plot | 1 | Mean Difference (Fixed, 95% CI) | ‐11.11 [‐27.56, 5.34] | |
| 2 Volume of beer sales in kilolitres Show forest plot | 1 | Mean Difference (Fixed, 95% CI) | 14.89 [0.39, 29.39] | |
| 3 Volume of wine sales in kilolitres Show forest plot | 1 | Mean Difference (Fixed, 95% CI) | 1.15 [‐0.91, 3.21] | |
| 4 Volume of spirits sales in kilolitres Show forest plot | 1 | Mean Difference (Fixed, 95% CI) | ‐22.49 [‐36.83, ‐8.15] | |
| Outcome or subgroup title | No. of studies | No. of participants | Statistical method | Effect size |
| 1 Volume of alcohol (beer, wine and spirits) sales in kilolitres Show forest plot | 1 | Mean Difference (Fixed, 95% CI) | ‐11.96 [‐55.42, 31.50] | |
| 2 Volume of beer sales in kilolitres Show forest plot | 1 | Mean Difference (Fixed, 95% CI) | ‐0.54 [‐1.57, 0.49] | |
| 3 Volume of wine sales in kilolitres Show forest plot | 1 | Mean Difference (Fixed, 95% CI) | ‐0.00 [‐0.04, 0.04] | |
| 4 Volume of spirits sales in kilolitres Show forest plot | 1 | Mean Difference (Fixed, 95% CI) | ‐27.8 [‐59.34, 3.74] | |
| Outcome or subgroup title | No. of studies | No. of participants | Statistical method | Effect size |
| 1 % Change in beer consumption Show forest plot | 2 | Mean % change (Random, 95% CI) | 1.10 [‐5.26, 7.47] | |