Ограничение или запрет на рекламу алкоголя с целью сокращения потребления алкоголя взрослыми и подростками.
Appendices
Appendix 1. PubMed search strategy
| Search | Query |
| Search (#20) NOT #21 | |
| Search animals [mh] NOT humans [mh] | |
| Search ((#6) AND #10) AND #19 | |
| Search (((((((#11) OR #12) OR #13) OR #14) OR #15) OR #16) OR #17) OR #18 | |
| Search policy[tiab] OR policies[tiab] | |
| Search forbid*[tiab] OR prohibit*[tiab] OR interdict*[tiab] OR regulat*[tiab] OR reducing[tiab] OR reduce[tiab] OR reduced[tiab] OR reduction*[tiab] OR restrict*[tiab] | |
| Search ban[tiab] OR bans[tiab] OR banned[tiab] OR banning[tiab] | |
| Search limit*[tiab] | |
| Search law[tiab] OR laws[tiab] | |
| Search "Legislation as Topic"[MeSH] | |
| Search "Health Policy"[MeSH] | |
| Search "Policy"[MeSH] | |
| Search ((#7) OR #8) OR #9 | |
| Search ((ad[tiab] OR ads[tiab] OR spot[tiab]) AND (Televis*[tiab] OR TV*[tiab] OR Radio[tiab] OR Radios[tiab] OR Movie*[tiab] OR Film*[tiab] OR Display*[tiab] OR media[tiab] OR Newspaper*[tiab] OR Magazine*[tiab] OR internet[tiab])) | |
| Search Advert*[tiab] OR Promot*[tiab] OR Sponsor*[tiab] OR Billboard*[tiab] OR Poster[tiab] OR Posters[tiab] OR branding[tiab] OR social marketing[mh] OR marketing[mh:noexp] OR marketing[tiab] OR commercial[tiab] OR commercials[tiab] | |
| Search "Advertising as Topic"[MeSH] | |
| Search ((((#1) OR #2) OR #3) OR #4) OR #5 | |
| Search Wine*[tiab] OR Liquor*[tiab] OR Spirits[tiab] OR Beer*[tiab] | |
| Search (alcohol*[tiab] AND (drink*[tiab] OR beverage*[tiab] OR intoxicat*[tiab] OR abus*[tiab] OR misus*[tiab] OR risk*[tiab] OR consum*[tiab] OR excess*[tiab] OR problem*[tiab])) | |
| Search (drink*[tiab] AND (excess*[tiab] OR heavy[tiab] OR heavily[tiab] OR hazard*[tiab] OR binge[tiab] OR harmful[tiab] OR problem*[tiab])) | |
| Search "Alcohol Drinking"[MeSH] | |
| Search "Alcohol‐Related Disorders"[MeSH] |
Appendix 2. EMBASE search strategy
| No. | Query | Results |
| #1 | alcohol abuse'/exp | 20.128 |
| #2 | alcohol intoxication'/exp | 11.57 |
| #3 | drinking behavior'/exp | 32.649 |
| #4 | (drink* NEAR/3 (excess* OR heavy OR heavily OR hazard* OR binge OR harmful OR problem*)):ab,ti | 15.566 |
| #5 | (alcohol* NEAR/3 (drink* OR beverage* OR intoxicat* OR abus* OR misus* OR risk* OR consum* OR excess* OR problem*)):ab,ti | 82.144 |
| #6 | wine*:ab,ti OR liquor*:ab,ti OR spirits:ab,ti OR beer*:ab,ti | 33.266 |
| #7 | #1 OR #2 OR #3 OR #4 OR #5 OR #6 | 148.236 |
| #8 | advertizing'/exp | 15.076 |
| #9 | advert*:ab,ti OR promot*:ab,ti OR sponsor*:ab,ti OR billboard*:ab,ti OR poster:ab,ti OR posters:ab,ti OR branding:ab,ti OR marketing:ab,ti OR commercial:ab,ti OR commercials:ab,ti | 800.025 |
| #10 | ((ad OR ads OR spot) NEAR/5 (televis* OR tv OR radio OR radios OR movie* OR film* OR display* OR media OR newspaper* OR magazine* OR OR film* OR display* OR media OR newspaper* OR magazine* OR internet)):ab,ti | 1.556 |
| #11 | social marketing'/exp | 2.211 |
| #12 | marketing'/de | 14.236 |
| #13 | #8 OR #9 OR #10 OR #11 OR #12 | 817.051 |
| #14 | policy'/exp OR policy:ab,ti OR policies:ab,ti | 192.939 |
| #15 | law'/exp | 79.431 |
| #16 | law:ab,ti OR laws:ab,ti | 83.918 |
| #17 | limit*:ab,ti OR forbid*:ab,ti OR prohibit*:ab,ti OR interdict*:ab,ti OR regulat*:ab,ti OR reducing:ab,ti OR reduce:ab,ti OR reduced:ab,ti OR reduction*:ab,ti OR restrict*:ab,ti OR ban:ab,ti OR bans:ab,ti OR banned:ab,ti OR banning:ab,ti | 4,530,066 |
| #18 | #14 OR #15 OR #16 OR #17 | 4,775,966 |
| #19 | #7 AND #13 AND #18 | 3.424 |
| #20 | #7 AND #13 AND #18 AND [humans]/lim AND [embase]/lim | 1.569 |
Appendix 3. Cochrane Library search strategy
| No. | Query | Results |
| #1 | MeSH descriptor: [Alcohol‐Related Disorders] explode all trees | 3159 |
| #2 | MeSH descriptor: [Alcohol Drinking] explode all trees | 2082 |
| #3 | (drink* near (excess* or heavy or heavily or hazard* or binge or harmful or problem*)):ti,ab,kw (Word variations have been searched) | 1034 |
| #4 | alcohol:ti,ab,kw (Word variations have been searched) | 9402 |
| #5 | (Wine* or Liquor* or Spirits or Beer*):ti,ab,kw (Word variations have been searched) | 867 |
| #6 | #1 or #2 or #3 or #4 or #5 | 10846 |
| #7 | MeSH descriptor: [Advertising as Topic] explode all trees | 130 |
| #8 | MeSH descriptor: [Marketing] this term only | 18 |
| #9 | (Advert* or Promot* or Sponsor* or Billboard* or Poster or Posters or branding or marketing or commercial or commercials):ti,ab,kw (Word variations have been searched) | 18515 |
| #10 | ((ad or ads or spot) near (Televis* or TV or Radio or Radios or Movie* or Film* or Display* or media or Newspaper* or Magazine* or internet)):ti,ab,kw (Word variations have been searched) | 83 |
| #11 | #7 or #8 or #9 or #10 | 18572 |
| #12 | MeSH descriptor: [Policy] explode all trees | 534 |
| #13 | MeSH descriptor: [Health Policy] explode all trees | 417 |
| #14 | MeSH descriptor: [Legislation as Topic] explode all trees | 607 |
| #15 | (law or laws):ti,ab,kw (Word variations have been searched) | 576 |
| #16 | (limit* or ban or bans or banned or banning or forbid* or prohibit* or interdict* or regulat* or reducing or reduce or reduced or reduction* or restrict*):ti,ab,kw (Word variations have been searched) | 176183 |
| #17 | (policy or policies):ti,ab,kw (Word variations have been searched) | 3534 |
| #18 | #12 or #13 or #14 or #15 or #16 or #17 | 179102 |
| #19 | #6 and #11 and #18 in Trials | 242 |
| #20 | #6 and #11 and #18 in Economic Evaluations | 4 |
Appendix 4. PsycINFOsearch strategy
| No. | Query |
| S20 | S6 AND S10 AND S19 |
| S19 | S11 OR S12 OR S13 OR S14 OR S15 OR S16 OR S17 OR S18 |
| S18 | TI policy OR AB policy OR TI policies OR AB policies |
| S17 | TI forbid* OR AB forbid* OR TI prohibit* OR AB prohibit* OR TI interdict* OR AB interdict* OR TI regulat* OR AB regulat* OR TI reducing OR AB reducing OR TI reduce OR AB reduce OR TI reduced OR AB reduced OR TI reduction* OR AB reduction OR TI restrict* OR AB restrict* |
| S16 | TI ban OR AB ban OR TI bans OR AB bans OR TI banned OR AB banned OR TI banning OR AB banning |
| S15 | TI limit* OR AB limit* |
| S14 | TI law OR AB law OR TI laws OR AB laws |
| S13 | SU Legislation as Topic |
| S12 | SU Health Policy |
| S11 | SU Policy |
| S10 | S7 OR S8 OR S9 |
| S9 | (TI ad OR AB ad OR TI ads OR AB ads OR TI spot OR AB spot) AND (TI Televis* OR AB Televis* OR TI TV* OR AB TV OR TI Radio OR AB Radio OR TI Radios OR AB Radios OR TI Movie* OR AB Movie* OR TI Film* Or AB Film* OR TI Display* OR AB Display* OR TI media OR AB media OR TI Newspaper* OR AB Newspaper* OR TI Magazine* OR AB Magazine* OR TI internet OR AB Internet) |
| S8 | TI Advert* OR AB Advert* OR TI Promot* OR AB Promot* OR TI Sponsor* OR AB Sponsor OR TI Billboard* OR AB Billboard OR TI Poster OR AB Poster OR TI Posters OR AB Posters OR TI branding OR AB branding OR MJ social marketing OR MJ marketing OR TI marketing OR AB marketing OR TI commercial OR AB commercial OR TI commercials OR AB commercials |
| S7 | SU Advertising as Topic |
| S6 | S1 OR S2 OR S3 OR S4 OR S5 |
| S5 | TI Wine* OR AB Wine* OR TI Liquor* OR AB Liquor OR TI Spirits OR AB Spirits OR TI Beer* OR AB Beer* |
| S4 | (TI alcohol* OR AB alcohol*) AND (TI drink* OR AB drink* OR TI beverage* OR AB beverage* OR TI intoxicat* OR AB intoxicat* OR TI abus* OR AB abus OR TI misus* OR AB misus* OR TI risk* OR AB misus* OR TI consum* OR AB consum* OR TI excess* Or AB excess* OR TI problem* OR AB problem*) |
| S3 | (TI drink* OR AB drink*) AND (TI excess* OR AB excess* OR TI heavy OR AB heavy OR TI heavily OR AB heavily OR TI hazard* OR AB hazard* OR TI binge OR AB binge OR TI harmful OR AB harmful OR TI problem* OR AB problem*) |
| S2 | SU Alcohol Drinking |
| S1 | SU Alcohol‐Related Disorders |
Appendix 5. 'Risk of bias' criteria for RCTs, CCTs and prospective observational studies
| Item | Low risk | High risk | Unclear risk |
| Sequence generation (Selection bias) | Investigators described a random component in the sequence generation process such as the use of random number table, coin tossing, cards or envelope shuffling | Investigators described a non‐random component in the sequence generation process such as the use of odd or even date of birth, algorithm based on the day/date of birth, hospital or clinic record number | Insufficient information to permit judgement of the sequence generation process |
| Allocation concealment (Selection bias) | Participants and the investigators enrolling participants cannot foresee assignment, e.g. central allocation; or sequentially numbered, opaque, sealed envelopes | Participants and investigators enrolling participants can foresee upcoming assignment, e.g. an open random allocation schedule (e.g. a list of random numbers); or envelopes were unsealed or nonopaque or not sequentially numbered | Insufficient information to permit judgement of the allocation concealment or the method not described |
| Blinding of participants and providers (Performance bias) Objective outcomes | No blinding or incomplete blinding, but the review authors judge that the outcome is not likely to be influenced by lack of blinding Blinding of participants and key study personnel ensured, and unlikely that the blinding could have been broken | No blinding or incomplete blinding, and the outcome is likely to be influenced by lack of blinding Blinding of key study participants and personnel attempted, but likely that the blinding could have been broken, and the outcome is likely to be influenced by lack of blinding | Insufficient information to permit judgement of low or high risk |
| Blinding of participants and providers (Performance bias) Subjective outcomes | Blinding of participants and providers and unlikely that the blinding could have been broken | No blinding or incomplete blinding, and the outcome is likely to be influenced by lack of blinding Blinding of key study participants and personnel attempted, but likely that the blinding could have been broken, and the outcome is likely to be influenced by lack of blinding | Insufficient information to permit judgement of low or high risk |
| Blinding of outcome assessor (Detection bias) Objective outcomes | No blinding of outcome assessment, but the review authors judge that the outcome measurement is not likely to be influenced by lack of blinding Blinding of outcome assessment ensured, and unlikely that the blinding could have been broken | No blinding of outcome assessment, and the outcome measurement is likely to be influenced by lack of blinding Blinding of outcome assessment, but likely that the blinding could have been broken, and the outcome measurement is likely to be influenced by lack of blinding | Insufficient information to permit judgement of low or high risk |
| Blinding of outcome assessor (Detection bias) Subjective outcomes | No blinding of outcome assessment, but the review authors judge that the outcome measurement is not likely to be influenced by lack of blinding Blinding of outcome assessment ensured, and unlikely that the blinding could have been broken | No blinding of outcome assessment, and the outcome measurement is likely to be influenced by lack of blinding Blinding of outcome assessment, but likely that the blinding could have been broken, and the outcome measurement is likely to be influenced by lack of blinding | Insufficient information to permit judgement of low or high risk |
| Incomplete outcome data | No missing outcome data, reasons for missing outcome data unlikely to be related to true outcome, or missing outcome data balanced in number across groups For dichotomous outcome data, the proportion of missing outcomes compared with observed event risk not enough to have a clinically relevant impact on the intervention effect estimate For continuous outcome data, plausible effect size (difference in means or standardised difference in means) among missing outcomes not enough to have a clinically relevant impact on observed effect size Missing data have been imputed using appropriate methods All randomised patients are reported/analysed in the group they were allocated to by randomisation irrespective of non‐compliance and co‐interventions (intention to treat) | Reason for missing outcome data likely to be related to true outcome, with either imbalance in number across groups or reasons for missing data For dichotomous outcome data, the proportion of missing outcomes compared with observed event risk enough to induce clinically relevant bias in intervention effect estimate For continuous outcome data, plausible effect size (difference in means or standardised difference in means) among missing outcomes enough to induce clinically relevant bias in observed effect size ‘As‐treated’ analysis done with substantial departure of the intervention received from that assigned at randomisation | Insufficient reporting of attrition or exclusions (e.g. number randomised not stated, no reasons for missing data provided; number of drop out not reported for each group) |
| Selective reporting | A protocol is available which clearly states the primary outcome as the same as in the final trial report The study protocol is not available but it is clear that the published reports include all expected outcomes, including those that were pre‐specified (convincing text of this nature may be uncommon) | The primary outcome differs between the protocol and final trial report One or more reported primary outcomes were not pre‐specified (unless clear justification for their reporting is provided, such as an unexpected adverse effect) One or more outcomes of interest in the review are reported incompletely so that they cannot be entered in a meta‐analysis The study report fails to include results for a key outcome that would be expected to have been reported for such a study | No trial protocol is available or there is insufficient reporting to determine if selective reporting is present |
| Free of other bias: Comparability of cohorts for baseline characteristics and outcome measures on the basis of the design or analysis | Exposed and non exposed individuals are matched in the design for most important confounding factors Authors demonstrated balance between group for the confounders Analysis are adjusted for most important confounding factors and imbalance Randomised controlled trial | No matching or no adjustment for most important confounding factor | No information about comparability of cohort |
| Free of other bias: selection of the non‐exposed cohort | The sample has been drawn from the same community as the exposed cohort Randomised controlled trial | The sample has been drawn from a different source | No description of the derivation of the non‐exposed cohort |
| Free of other bias: protection against contamination | Allocation was by community, institution or practice and it is unlikely that the control group received the intervention Randomised controlled trial | It is likely that the control group received the intervention | It is possible that communication between intervention and control groups could have occurred |
| Ascertainment of exposure | Information in the study was obtained from a secure record (e.g. clinical records or structured interview) Randomised controlled trial | Self report | No description |
Appendix 6. 'Risk of bias' criteria for ITS studies
| Item | Low risk | High risk | Unclear risk |
| Was the intervention independent of other changes? | Compelling arguments that the intervention occurred independently of other changes over time and the outcome was not influenced by other confounding variables/historic events during study period. If events/variables identified, note what they are | The intervention was not independent of other changes in time | Insufficient information to permit judgement of low or high risk |
| Was the shape of the intervention effect prespecified? | Point of analysis is the point of intervention OR a rational explanation for the shape of intervention effect was given by the author(s). Where appropriate, this should include an explanation if the point of analysis is NOT the point of intervention | It is clear that the shape of the intervention was not prespecified | Insufficient information to permit judgement of low or high risk |
| Was the intervention unlikely to affect data collection? | The intervention itself was unlikely to affect data collection (e.g. sources and methods of data collection were the same before and after the intervention) | The intervention itself was likely to affect data collection (e.g. any change in source or method of data collection reported) | Insufficient information to permit judgement of low or high risk |
| Was knowledge of the allocated interventions adequately prevented during the study? | The authors state explicitly that the primary outcome variables were assessed blindly, or the outcomes are objective, e.g. length of hospital stay. Primary outcomes are those variables that correspond to the primary hypothesis or question as defined by the authors | If the outcomes were not assessed blindly | Insufficient information to permit judgement of low or high risk |
| Were incomplete outcome data adequately addressed? (If some primary outcomes were assessed blindly or affected by missing data and others were not, each primary outcome can be scored separately) | Missing outcome measures were unlikely to bias the results (e.g. the proportion of missing data was similar in the pre‐ and post‐intervention periods or the proportion of missing data was less than the effect size, i.e. unlikely to overturn the study result) | Missing outcome data were likely to bias the results. Do not assume 100% follow up unless stated explicitly) | Insufficient information to permit judgement of low or high risk |
| Was the study free from selective outcome reporting? | There is no evidence that outcomes were selectively reported (e.g. all relevant outcomes in the methods section are reported in the results section) | If some important outcomes are subsequently omitted from the results | Insufficient information to permit judgement of low or high risk |
| Was the study free from other risks of bias? | There is no evidence of other risks of bias, e.g. should consider if seasonality is an issue (i.e. if January to June comprises the pre‐intervention period and July to December the post, could the 'seasons' have caused a spurious effect) | There is evidence that other risks of bias exist, such as seasonality | Insufficient information to permit judgement of low or high risk |
Appendix 7. May 2014 search: records retrieved per database
| Database | No. of records retrieved | Potentially eligible | Included | Date searched |
| PubMed | 432 | 0 | 0 | 2014‐05‐28 |
| EMBASE | 319 | 0 | 0 | 2014‐05‐27 |
| CENTRAL | 55 | 0 | 0 | 2014‐05‐28 |
| NHS Economic Evaluations Database | 0 | 0 | 0 | 2014‐05‐28 |
| Cochrane Drug and Alcohol Specialised Register | 0 | 0 | 0 | 2014‐05‐28 |
Appendix 8. Results of searches of economic and marketing databases
| Database | URL | Search term | No. of records retrieved | Potentially eligible | Included | Date searched |
| AgEcon | alcohol | 154 | 1 | 0 | 2013‐10‐16 | |
| Business Source Premier | EBSCOHost | alcohol advertising | 654 | 16 | 0 | 2013‐10‐18 |
| ETOH databases on the National Institute of Health Alcohol and Alcohol Problems database (1972 to 2003) | ban; restriction | 29; 134 | 0;1 | 0;0 | 2013‐10‐22 | |
| The Chartered Institute of Marketing (UK‐based) | alcohol | 237 | 3 | 0 (2 reviews) | 2013‐10‐22 | |
| Association for Consumer Research | http://www.acrwebsite.org/search/search‐conference‐proceedings.aspx | alcohol | 560 | 3 | 0 | 2013‐10‐22 |
Appendix 9. Results of conferences and manual report archives searched
| Conference | URL | Search term | No. of records retrieved | Potentially eligible | Included | Date searched |
| International Health Economics Association | alcohol | 699 | 20 | 0 | 2013‐06‐03 | |
| Research Society on Alcoholism | No proceedings published. Oral and poster presentations are published in the journal, Alcoholism: Clinical and Experimental Research and should therefore have been identified in the journal database searches | |||||
| International Society for Biomedical Research in Alcoholism | We were not able to obtain access to this and no response to email requests was received | |||||
| Kettil Bruun Society | The contact person responded that the Society is in the process of archiving conference papers and there is no means to search electronically at the current time. The 2013 symposium was manually searched | 2013‐10‐21 | ||||
| 39th Annual Alcohol Epidemiology Symposium of the Kettil Bruun Society, Kampala, Uganda, 3 ‐ 7 June, 2013 | Manual search of conference abstract book | ‐ | 143 | 2 | 0 | 2013‐10‐24 |
| International Network on Brief Interventions for Alcohol Problems (INEBRIA) | INEBRIA contact person responded that INEBRIA conferences do not cover alcohol advertising | 2013‐10‐22 | ||||
| Vietnam Alcohol Policy Workshop 2009 | Manual handsearch | 0 | 0 | 0 | 2013‐10‐18 | |
| ICAP Africa Region Conference 2008 | Manual handsearch | 0 | 0 | 0 | 2013‐10‐18 | |
| ICAP Asia‐Pacific Alcohol Forum 2008 | Manual handsearch | 0 | 0 | 0 | 2013‐10‐18 | |
| The Foundation for Alcohol research | The Foundation supports the Research Society on Alcoholism. No proceedings published. Oral and poster presentations are published in the journal, Alcoholism: Clinical and Experimental Research and should therefore have been identified in the journal database searches. See above under Research Society on Alcoholism | |||||
| European Advertising Standards Alliance | EASA does not have a database of meeting abstracts but provided relevant articles and papers for consideration | |||||

Flow diagram of screening and eligibility of records of electronic databases: PubMed, EMBASE, The Cochrane Library (CENTRAL and UK National Health Service Economic Evaluations Database) and PsychINFO
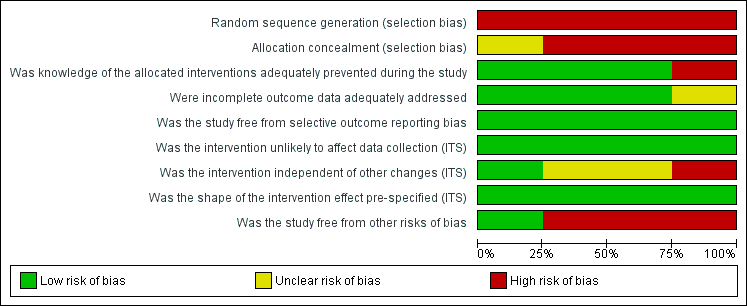
'Risk of bias' graph: review authors' judgements about each risk of bias item presented as percentages across all included studies (N = 4).

'Risk of bias' summary: review authors' judgements about each risk of bias item for each included study (N = 4).

Comparison 1 Low‐alcohol content movies versus high‐alcohol content movies, Outcome 1 Total alcohol consumption in number of glasses.
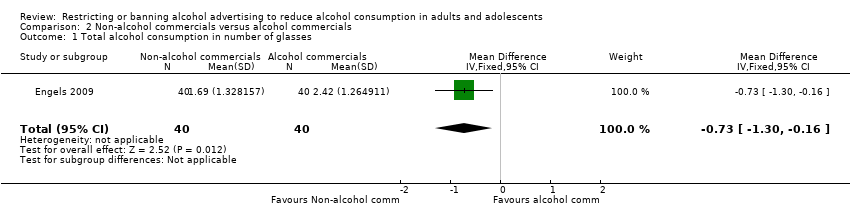
Comparison 2 Non‐alcohol commercials versus alcohol commercials, Outcome 1 Total alcohol consumption in number of glasses.

Comparison 3 High‐alcohol content movies versus low‐alcohol content movies adjusted for clustering effects, Outcome 1 Total alcohol consumption.

Comparison 4 Alcohol commercials versus non‐alcohol commercials adjusted for clustering effects, Outcome 1 Total alcohol consumption.

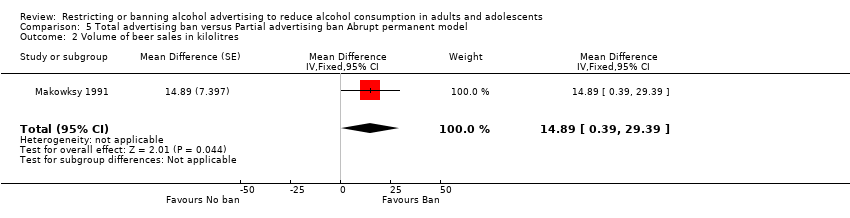
Comparison 5 Total advertising ban versus Partial advertising ban Abrupt permanent model, Outcome 1 Volume of alcohol (beer, wine and spirits) sales in kilolitres.
Comparison 5 Total advertising ban versus Partial advertising ban Abrupt permanent model, Outcome 2 Volume of beer sales in kilolitres.

Comparison 5 Total advertising ban versus Partial advertising ban Abrupt permanent model, Outcome 3 Volume of wine sales in kilolitres.

Comparison 5 Total advertising ban versus Partial advertising ban Abrupt permanent model, Outcome 4 Volume of spirits sales in kilolitres.
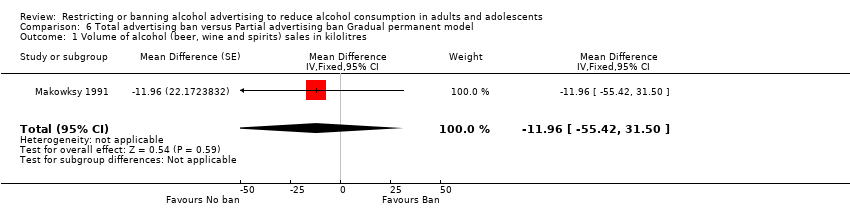
Comparison 6 Total advertising ban versus Partial advertising ban Gradual permanent model, Outcome 1 Volume of alcohol (beer, wine and spirits) sales in kilolitres.
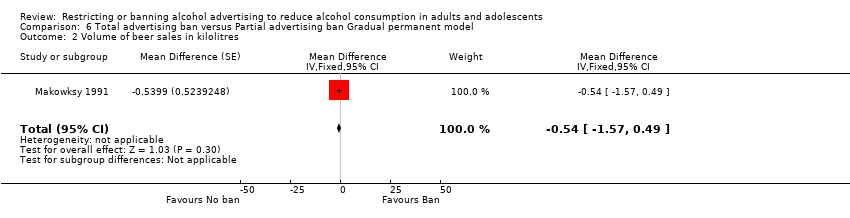
Comparison 6 Total advertising ban versus Partial advertising ban Gradual permanent model, Outcome 2 Volume of beer sales in kilolitres.
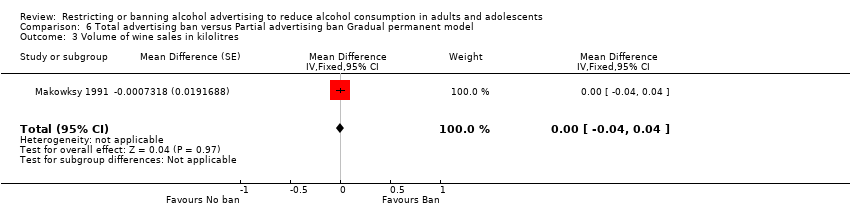
Comparison 6 Total advertising ban versus Partial advertising ban Gradual permanent model, Outcome 3 Volume of wine sales in kilolitres.
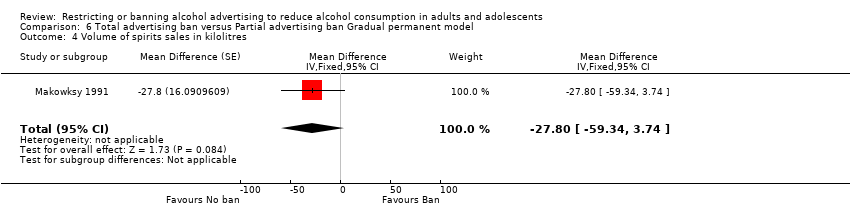
Comparison 6 Total advertising ban versus Partial advertising ban Gradual permanent model, Outcome 4 Volume of spirits sales in kilolitres.
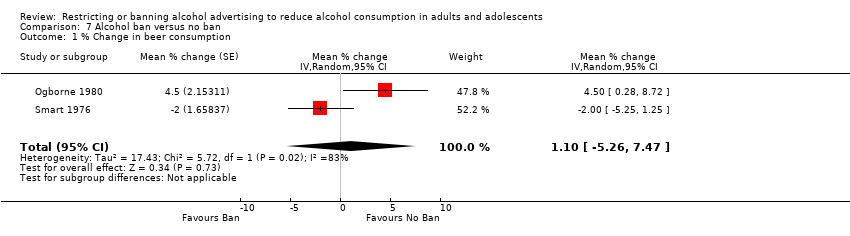
Comparison 7 Alcohol ban versus no ban, Outcome 1 % Change in beer consumption.
| Non‐alcohol commercials compared to alcohol commercials for reduction of alcohol consumption | ||||||
| Patient or population: General population | ||||||
| Outcomes | Illustrative comparative risks* (95% CI) | Relative effect | No. of participants | Quality of the evidence | Comments | |
| Assumed risk | Corresponding risk | |||||
| Alcohol commercials | Non‐alcohol commercials | |||||
| Total alcohol consumption in number of glasses | The mean total alcohol consumption in number of glasses in the intervention groups was | 80 | ⊕⊝⊝⊝ | |||
| Delayed age of initiation of alcohol use ‐ not measured | Not estimable | ‐ | This outcome was not applicable in this trial | |||
| Reduction in rate of reported risk behaviour ‐ not measured | Not estimable | ‐ | ||||
| Reduction in alcohol‐related injuries or accidents ‐ not measured | Not estimable | ‐ | ||||
| Reduction in individual spending on alcohol ‐ not measured | Not estimable | ‐ | ||||
| Loss of revenue from alcohol industry ‐ not measured | Not estimable | ‐ | This outcome was not applicable in this trial | |||
| Loss of advertising revenue ‐ not measured | Not estimable | ‐ | This outcome was not applicable in this trial | |||
| *The basis for the assumed risk (e.g. the median control group risk across studies) is provided in footnotes. The corresponding risk (and its 95% confidence interval) is based on the assumed risk in the comparison group and the relative effect of the intervention (and its 95% CI). | ||||||
| GRADE Working Group grades of evidence | ||||||
| 1 Risk of bias: rated as serious. In the Engels 2009 trial, randomisation was inadequate (the groups differed on the baseline prognostic factor prior drinking levels), allocation concealment was unclear and the researchers were not blinded to group allocation so detection bias may be present. | ||||||
| Alcohol ban compared to no ban for the general population | ||||||
| Patient or population: General population | ||||||
| Outcomes | Illustrative comparative risks* (95% CI) | Relative effect | No. of pParticipants | Quality of the evidence | Comments | |
| Assumed risk | Corresponding risk | |||||
| No ban | Alcohol ban | |||||
| Alcohol consumption: % change in beer consumption | The mean % change in beer consumption in the intervention groups was | 2 ITS studies | ⊕⊝⊝⊝ | Results for consumption of other types of alcoholic beverages and total consumption were inconsistent in the three ITS studies | ||
| Reduction in rate of reported risk behaviour ‐ not reported | See comment | See comment | Not estimable | ‐ | See comment | None of the studies measured this outcome |
| Delayed age of initiation of alcohol use ‐ not reported | See comment | See comment | Not estimable | ‐ | See comment | None of the studies measured this outcome |
| Reduction in alcohol‐related injuries or accidents ‐ not reported | See comment | See comment | Not estimable | ‐ | See comment | None of the studies measured this outcome |
| Reduction in individual spending on alcohol ‐ not reported | See comment | See comment | Not estimable | ‐ | See comment | None of the studies measured this outcome |
| Loss of revenue from alcohol industry ‐ not reported | See comment | See comment | Not estimable | ‐ | See comment | None of the studies measured this outcome |
| Loss of advertising revenue ‐ not reported | See comment | See comment | Not estimable | ‐ | See comment | None of the studies measured this outcome |
| *The basis for the assumed risk (e.g. the median control group risk across studies) is provided in footnotes. The corresponding risk (and its 95% confidence interval) is based on the assumed risk in the comparison group and the relative effect of the intervention (and its 95% CI). | ||||||
| GRADE Working Group grades of evidence | ||||||
| 1 Risk of bias: rated as serious: the risk of a dilution effect is present in both studies (Ogborne 1980 and Smart 1976) and seasonality may not be adequately addressed in the analyses. The studies were not further downgraded for limitations in causal inference due to a lack of randomisation, as the initial GRADE rating commenced at low quality. | ||||||
| Outcome or subgroup title | No. of studies | No. of participants | Statistical method | Effect size |
| 1 Total alcohol consumption in number of glasses Show forest plot | 1 | 80 | Mean Difference (IV, Fixed, 95% CI) | ‐0.65 [‐1.23, ‐0.07] |
| Outcome or subgroup title | No. of studies | No. of participants | Statistical method | Effect size |
| 1 Total alcohol consumption in number of glasses Show forest plot | 1 | 80 | Mean Difference (IV, Fixed, 95% CI) | ‐0.73 [‐1.30, ‐0.16] |
| Outcome or subgroup title | No. of studies | No. of participants | Statistical method | Effect size |
| 1 Total alcohol consumption Show forest plot | 1 | Coefficient (Fixed, 95% CI) | 0.74 [0.05, 1.43] | |
| Outcome or subgroup title | No. of studies | No. of participants | Statistical method | Effect size |
| 1 Total alcohol consumption Show forest plot | 1 | Coefficient (Fixed, 95% CI) | 0.83 [0.14, 1.52] | |
| Outcome or subgroup title | No. of studies | No. of participants | Statistical method | Effect size |
| 1 Volume of alcohol (beer, wine and spirits) sales in kilolitres Show forest plot | 1 | Mean Difference (Fixed, 95% CI) | ‐11.11 [‐27.56, 5.34] | |
| 2 Volume of beer sales in kilolitres Show forest plot | 1 | Mean Difference (Fixed, 95% CI) | 14.89 [0.39, 29.39] | |
| 3 Volume of wine sales in kilolitres Show forest plot | 1 | Mean Difference (Fixed, 95% CI) | 1.15 [‐0.91, 3.21] | |
| 4 Volume of spirits sales in kilolitres Show forest plot | 1 | Mean Difference (Fixed, 95% CI) | ‐22.49 [‐36.83, ‐8.15] | |
| Outcome or subgroup title | No. of studies | No. of participants | Statistical method | Effect size |
| 1 Volume of alcohol (beer, wine and spirits) sales in kilolitres Show forest plot | 1 | Mean Difference (Fixed, 95% CI) | ‐11.96 [‐55.42, 31.50] | |
| 2 Volume of beer sales in kilolitres Show forest plot | 1 | Mean Difference (Fixed, 95% CI) | ‐0.54 [‐1.57, 0.49] | |
| 3 Volume of wine sales in kilolitres Show forest plot | 1 | Mean Difference (Fixed, 95% CI) | ‐0.00 [‐0.04, 0.04] | |
| 4 Volume of spirits sales in kilolitres Show forest plot | 1 | Mean Difference (Fixed, 95% CI) | ‐27.8 [‐59.34, 3.74] | |
| Outcome or subgroup title | No. of studies | No. of participants | Statistical method | Effect size |
| 1 % Change in beer consumption Show forest plot | 2 | Mean % change (Random, 95% CI) | 1.10 [‐5.26, 7.47] | |