Scolaris Content Display Scolaris Content Display

Search flow diagram.
Figuras y tablas -
Figure 1

Search flow diagram.

Risk of bias summary: review authors' judgements about each risk of bias item for each included study.
Figuras y tablas -
Figure 2

Risk of bias summary: review authors' judgements about each risk of bias item for each included study.

Risk of bias graph: review authors' judgements about each risk of bias item presented as percentages across all included studies.
Figuras y tablas -
Figure 3

Risk of bias graph: review authors' judgements about each risk of bias item presented as percentages across all included studies.

Forest plot of comparison: capnography plus standard monitoring versus standard monitoring, outcome: 1.1 oxygen desaturation.
Figuras y tablas -
Figure 4

Forest plot of comparison: capnography plus standard monitoring versus standard monitoring, outcome: 1.1 oxygen desaturation.

Forest plot of comparison: capnography plus standard monitoring) versus standard monitoring, outcome: 1.6 oxygen desaturation (sensitivity analysis based on definition of oxygen desaturation. Deitch 2010 excluded).
Figuras y tablas -
Figure 5

Forest plot of comparison: capnography plus standard monitoring) versus standard monitoring, outcome: 1.6 oxygen desaturation (sensitivity analysis based on definition of oxygen desaturation. Deitch 2010 excluded).

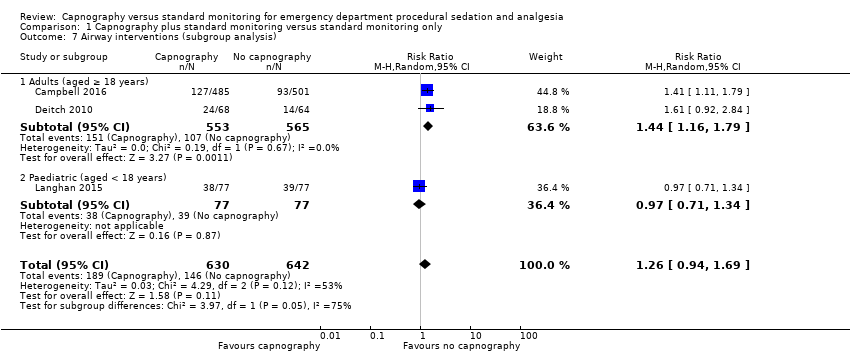
Forest plot of comparison: capnography plus standard monitoring versus standard monitoring, outcome: 1.7 airway interventions (subgroup analysis based on participant age).
Figuras y tablas -
Figure 6

Forest plot of comparison: capnography plus standard monitoring versus standard monitoring, outcome: 1.7 airway interventions (subgroup analysis based on participant age).

Comparison 1 Capnography plus standard monitoring versus standard monitoring only, Outcome 1 Oxygen desaturation.
Figuras y tablas -
Analysis 1.1

Comparison 1 Capnography plus standard monitoring versus standard monitoring only, Outcome 1 Oxygen desaturation.

Comparison 1 Capnography plus standard monitoring versus standard monitoring only, Outcome 2 Hypotension.
Figuras y tablas -
Analysis 1.2

Comparison 1 Capnography plus standard monitoring versus standard monitoring only, Outcome 2 Hypotension.

Comparison 1 Capnography plus standard monitoring versus standard monitoring only, Outcome 3 Emesis, pulmonary aspiration.
Figuras y tablas -
Analysis 1.3

Comparison 1 Capnography plus standard monitoring versus standard monitoring only, Outcome 3 Emesis, pulmonary aspiration.

Comparison 1 Capnography plus standard monitoring versus standard monitoring only, Outcome 4 Airway interventions.
Figuras y tablas -
Analysis 1.4

Comparison 1 Capnography plus standard monitoring versus standard monitoring only, Outcome 4 Airway interventions.

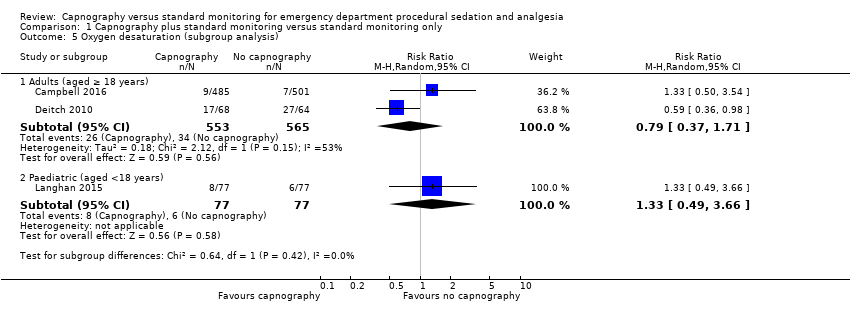
Comparison 1 Capnography plus standard monitoring versus standard monitoring only, Outcome 5 Oxygen desaturation (subgroup analysis).
Figuras y tablas -
Analysis 1.5

Comparison 1 Capnography plus standard monitoring versus standard monitoring only, Outcome 5 Oxygen desaturation (subgroup analysis).

Comparison 1 Capnography plus standard monitoring versus standard monitoring only, Outcome 6 Oxygen desaturation (sensitivity analysis), Deitch 2010 excluded.
Figuras y tablas -
Analysis 1.6

Comparison 1 Capnography plus standard monitoring versus standard monitoring only, Outcome 6 Oxygen desaturation (sensitivity analysis), Deitch 2010 excluded.

Comparison 1 Capnography plus standard monitoring versus standard monitoring only, Outcome 7 Airway interventions (subgroup analysis).
Figuras y tablas -
Analysis 1.7

Comparison 1 Capnography plus standard monitoring versus standard monitoring only, Outcome 7 Airway interventions (subgroup analysis).

Summary of findings for the main comparison. Capnography and standard monitoring compared with standard monitoring for emergency department patients undergoing procedural sedation and analgesia

Capnography and standard monitoring compared with standard monitoring for emergency department patients undergoing procedural sedation and analgesia

Patient or population: patients undergoing PSA

Settings: emergency departments in North America

Intervention: capnography and standard monitoring

Comparison: standard monitoring

Outcomes

Illustrative comparative risks* (95% CI)

Relative effect
(95% CI)

No of Participants
(studies)

Quality of the evidence
(GRADE)

Comments

Assumed risk

Corresponding risk

Standard monitoring

Capnography and standard monitoring

Oxygen desaturation

Medium risk population

RR 0.89 (0.48 to 1.63)

1272 participants (3 studies)

⊕⊕⊕⊝
Moderateb

8 per 1000a

7 per 1000
(4 to 13)

Hypotension

Medium risk population

RR 2.36 (0.98 to 5.69)

986 participants (1 study)

⊕⊕⊕⊝
Moderated

6 per 1000c

14 per 1000
(6 to 34)

Emesis, pulmonary aspiration

Medium risk population

RR 3.10 (0.13 to 75.88)

986 participants (1 study)

⊕⊕⊕⊝
Moderated

None of the studies recorded pulmonary aspiration events.

4 per 1000e

4 per 1000

(1 to 304)

Airway interventions

Medium risk population

RR 1.26 (0.94 to 1.69)

1272 participants (3 studies)

⊕⊕⊕⊝
Moderateg

2 studies included verbal/physical stimulation and supplemental oxygen as airway interventions (not consistent with our definition) but only reported total airway interventions (as dichotomous outcomes).

150 per 1000f

189 per 1000
(141 to 254)

Airway interventions adult subgroup analysis (aged ≥ 18 years)h

Medium risk population

RR 1.44 (1.16 to 1.79)

1118 participants (2 studies)

⊕⊕⊕⊝
Moderatej

190 per 1000i

274 per 1000
(220 to 340)

Recovery time

None of the studies reported recovery time.

*The basis for the assumed risk (e.g. the median control group risk across studies) is provided in footnotes. The corresponding risk (and its 95% confidence interval) is based on the assumed risk in the comparison group and the relative effect of the intervention (and its 95% CI).

CI: confidence interval; PSA: procedural sedation and analgesia; RR: risk ratio.

GRADE Working Group grades of evidence
High quality: Further research is very unlikely to change our confidence in the estimate of effect.
Moderate quality: Further research is likely to have an important impact on our confidence in the estimate of effect and may change the estimate.
Low quality: Further research is very likely to have an important impact on our confidence in the estimate of effect and is likely to change the estimate.
Very low quality: We are very uncertain about the estimate.

aCampbell 2006; Cudny 2013. No study found to determine assumed risk for all‐age population, combined incidence of these studies used as a surrogate. Hypoxia defined as oxygen saturation < 90% at any time with baseline oxygen saturation ≥ 95% for Campbell 2006. Unknown definition of hypoxia for Cudny 2013.

b Although statistics show low to moderate heterogeneity (I2 = 42%, P = 0.18), quality downgraded due to heterogeneity in study designs.

cCampbell 2006. Hypotension defined as systolic blood pressure < 85 mmHg at any time with baseline systolic blood pressure ≥ 100 mmHg.

d Downgraded for reporting bias in one study.

eLanghan 2012. Used this paediatric study as surrogate for all ages population.

fBurton 2006.

g Downgraded due to significant heterogeneity (I2 = 53%).

h The study by Campbell 2016 reported adults aged 16 years or greater whereas the study by Deitch 2010 reported adults aged greater than 18 years.

iCampbell 2016.

j Downgraded due to heterogeneity in outcome definitions as well as small number of studies.

Figuras y tablas -
Summary of findings for the main comparison. Capnography and standard monitoring compared with standard monitoring for emergency department patients undergoing procedural sedation and analgesia
Comparison 1. Capnography plus standard monitoring versus standard monitoring only

Outcome or subgroup title

No. of studies

No. of participants

Statistical method

Effect size

1 Oxygen desaturation Show forest plot

3

1272

Risk Ratio (M‐H, Random, 95% CI)

0.89 [0.48, 1.63]

2 Hypotension Show forest plot

1

Risk Ratio (M‐H, Random, 95% CI)

Totals not selected

3 Emesis, pulmonary aspiration Show forest plot

1

Risk Ratio (M‐H, Random, 95% CI)

Totals not selected

4 Airway interventions Show forest plot

3

1272

Risk Ratio (M‐H, Random, 95% CI)

1.26 [0.94, 1.69]

5 Oxygen desaturation (subgroup analysis) Show forest plot

3

Risk Ratio (M‐H, Random, 95% CI)

Subtotals only

5.1 Adults (aged ≥ 18 years)

2

1118

Risk Ratio (M‐H, Random, 95% CI)

0.79 [0.37, 1.71]

5.2 Paediatric (aged <18 years)

1

154

Risk Ratio (M‐H, Random, 95% CI)

1.33 [0.49, 3.66]

6 Oxygen desaturation (sensitivity analysis), Deitch 2010 excluded Show forest plot

2

1140

Risk Ratio (M‐H, Random, 95% CI)

1.33 [0.66, 2.69]

7 Airway interventions (subgroup analysis) Show forest plot

3

1272

Risk Ratio (M‐H, Random, 95% CI)

1.26 [0.94, 1.69]

7.1 Adults (aged ≥ 18 years)

2

1118

Risk Ratio (M‐H, Random, 95% CI)

1.44 [1.16, 1.79]

7.2 Paediatric (aged < 18 years)

1

154

Risk Ratio (M‐H, Random, 95% CI)

0.97 [0.71, 1.34]

Figuras y tablas -
Comparison 1. Capnography plus standard monitoring versus standard monitoring only