Capnografía versus monitorización estándar para la analgesia y la sedación durante la realización de procedimientos en el servicio de urgencias
Información
- DOI:
- https://doi.org/10.1002/14651858.CD010698.pub2Copiar DOI

- Base de datos:
-
- Cochrane Database of Systematic Reviews
- Versión publicada:
-
- 23 marzo 2017see what's new
- Tipo:
-
- Intervention
- Etapa:
-
- Review
- Grupo Editorial Cochrane:
-
Grupo Cochrane de Atención crítica y de emergencia
- Copyright:
-
- Copyright © 2019 The Cochrane Collaboration. Published by John Wiley & Sons, Ltd.
Cifras del artículo
Altmetric:
Citado por:
Autores
Contributions of authors
Brian F Wall (BFW), Kirk Magee (KDM), Samuel G Campbell (SGC), Peter J Zed (PJZ)
Conceiving the review: BFW, KDM, PJZ.
Co‐ordinating the review: BFW, KDM.
Undertaking manual searches: BFW, KDM.
Screening search results: BFW, KDM.
Organizing retrieval of papers: BFW.
Screening retrieved papers against inclusion criteria: BFW, KDM, SGC.
Appraising quality of papers: BFW, KDM.
Abstracting data from papers: BFW, KDM.
Writing to authors of papers for additional information: BFW.
Providing additional data about papers: BFW.
Obtaining and screening data on unpublished studies: BFW.
Data management for the review: BFW, KDM.
Entering data into Review Manager 5 (RevMan 2014): BFW, KDM.
RevMan statistical data: BFW, KDM.
Other statistical analysis not using RevMan: BFW, KDM.
Interpretation of data: BFW, KDM, PJZ.
Statistical inferences: BFW, KDM, PJZ.
Writing the review: BFW, KDM, PJZ.
Securing funding for the review: BFW, KDM.
Performing previous work that was the foundation of the present study: SGC, PJZ.
Guarantor for the review: BFW.
Person responsible for reading and checking review before submission: KDM.
Sources of support
Internal sources
-
No sources of support supplied
External sources
-
Canadian Association of Emergency Physicians (CAEP) Research Grant, Canada.
A national grant competition was won providing financial support to pay for statistician services and reference software.
Declarations of interest
Brian F Wall: none known.
Kirk Magee: was a listed author of one of the included studies in this review (Campbell 2016).
Samuel G Campbell: was a listed author of one of the included studies in this review (Campbell 2016).
Peter J Zed: was a listed author of one of the included studies in this review (Campbell 2016).
Acknowledgements
We would like to thank Jane Cracknell (managing editor), Harald Herkner (content editor), Vibeke E Horstmann (statistical editor), Baruch Krauss, Teresa A Williams, Cheuk San Law (peer reviewers), and Janet Wale (consumer editor) for their help and editorial advice during the preparation of this systematic review.
Anna MacDonald helped with the task of data extraction for one study as an independent researcher (Campbell 2016).
We would also like to thank Melissa Langhan (included study author) for responding to our requests for unpublished data. Finally, we thank the Canadian Association of Emergency Physicians for the resident research grant that helped fund this study (see Sources of support).
Version history
| Published | Title | Stage | Authors | Version |
| 2017 Mar 23 | Capnography versus standard monitoring for emergency department procedural sedation and analgesia | Review | Brian F Wall, Kirk Magee, Samuel G Campbell, Peter J Zed | |
| 2013 Aug 14 | Capnography versus standard monitoring for emergency department procedural sedation and analgesia | Protocol | Brian F Wall, Kirk Magee, Samuel G Campbell, Peter J Zed | |
Differences between protocol and review
We made the following changes to the published protocol (Wall 2013).
-
An explanation for the definition of the primary outcome oxygen desaturation was added to the 'Types of outcome measures' section.
-
The description in the 'Objectives' section was simplified to conform to Cochrane standards but no prespecified primary or secondary objectives were changed.
Keywords
MeSH
Medical Subject Headings (MeSH) Keywords
- *Analgesia;
- *Emergency Service, Hospital;
- Blood Pressure Determination;
- Capnography [*methods];
- Emergency Treatment [adverse effects, *methods];
- Heart Rate;
- Hypotension [prevention & control];
- Hypoxia [prevention & control];
- Monitoring, Physiologic [*methods];
- Oximetry;
- Pneumonia, Aspiration [prevention & control];
- Randomized Controlled Trials as Topic;
- Vomiting [prevention & control];
Medical Subject Headings Check Words
Humans;
PICO

Search flow diagram.

Risk of bias summary: review authors' judgements about each risk of bias item for each included study.

Risk of bias graph: review authors' judgements about each risk of bias item presented as percentages across all included studies.
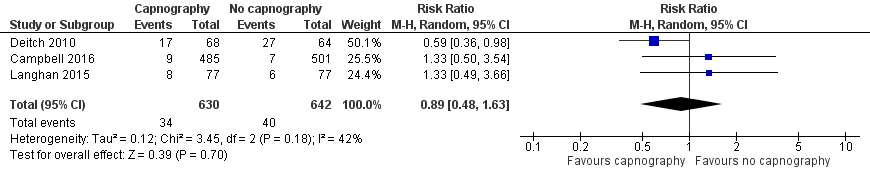
Forest plot of comparison: capnography plus standard monitoring versus standard monitoring, outcome: 1.1 oxygen desaturation.
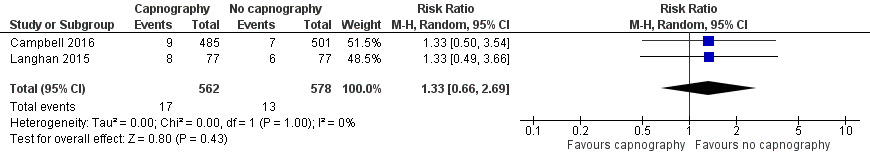
Forest plot of comparison: capnography plus standard monitoring) versus standard monitoring, outcome: 1.6 oxygen desaturation (sensitivity analysis based on definition of oxygen desaturation. Deitch 2010 excluded).

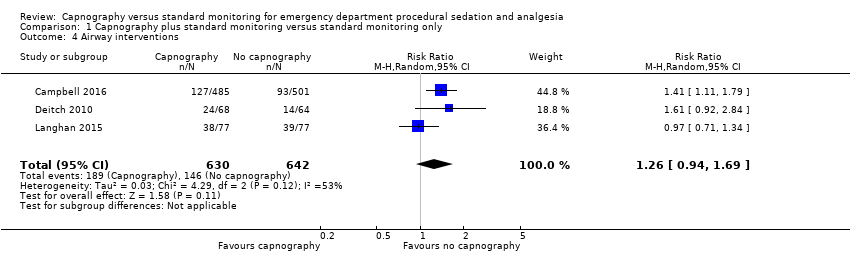
Forest plot of comparison: capnography plus standard monitoring versus standard monitoring, outcome: 1.7 airway interventions (subgroup analysis based on participant age).

Comparison 1 Capnography plus standard monitoring versus standard monitoring only, Outcome 1 Oxygen desaturation.

Comparison 1 Capnography plus standard monitoring versus standard monitoring only, Outcome 2 Hypotension.
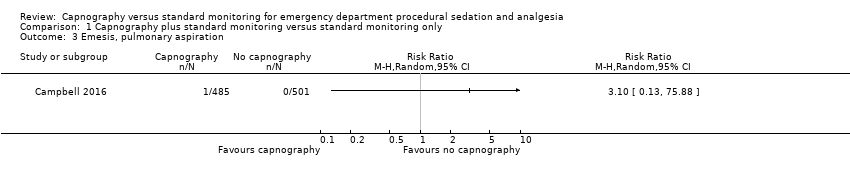
Comparison 1 Capnography plus standard monitoring versus standard monitoring only, Outcome 3 Emesis, pulmonary aspiration.
Comparison 1 Capnography plus standard monitoring versus standard monitoring only, Outcome 4 Airway interventions.
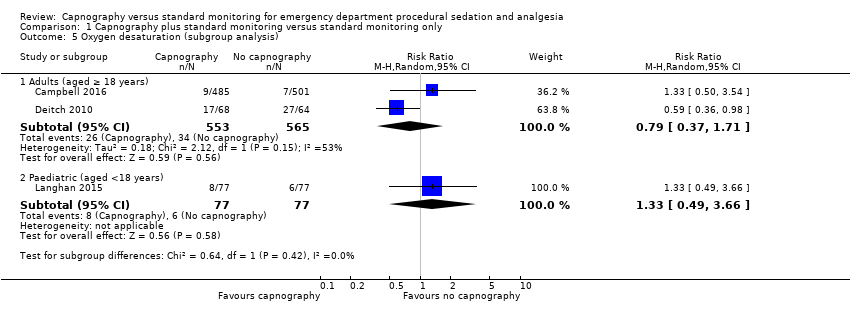
Comparison 1 Capnography plus standard monitoring versus standard monitoring only, Outcome 5 Oxygen desaturation (subgroup analysis).

Comparison 1 Capnography plus standard monitoring versus standard monitoring only, Outcome 6 Oxygen desaturation (sensitivity analysis), Deitch 2010 excluded.
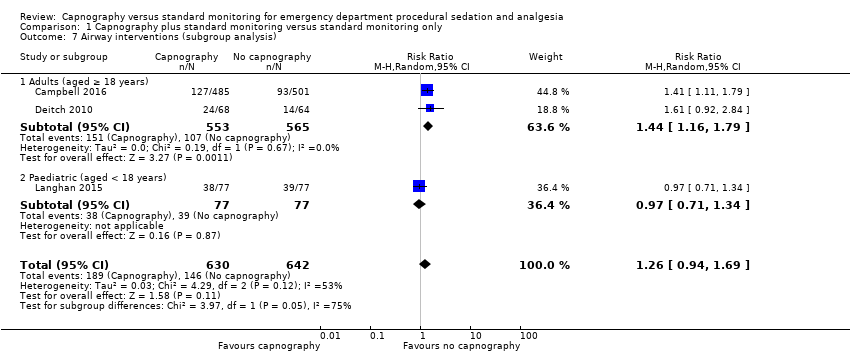
Comparison 1 Capnography plus standard monitoring versus standard monitoring only, Outcome 7 Airway interventions (subgroup analysis).
| Capnography and standard monitoring compared with standard monitoring for emergency department patients undergoing procedural sedation and analgesia | ||||||
| Patient or population: patients undergoing PSA Settings: emergency departments in North America Intervention: capnography and standard monitoring Comparison: standard monitoring | ||||||
| Outcomes | Illustrative comparative risks* (95% CI) | Relative effect | No of Participants | Quality of the evidence | Comments | |
| Assumed risk | Corresponding risk | |||||
| Standard monitoring | Capnography and standard monitoring | |||||
| Oxygen desaturation | Medium risk population | RR 0.89 (0.48 to 1.63) | 1272 participants (3 studies) | ⊕⊕⊕⊝ | ‐ | |
| 8 per 1000a | 7 per 1000 | |||||
| Hypotension | Medium risk population | RR 2.36 (0.98 to 5.69) | 986 participants (1 study) | ⊕⊕⊕⊝ | ‐ | |
| 6 per 1000c | 14 per 1000 | |||||
| Emesis, pulmonary aspiration | Medium risk population | RR 3.10 (0.13 to 75.88) | 986 participants (1 study) | ⊕⊕⊕⊝ | None of the studies recorded pulmonary aspiration events. | |
| 4 per 1000e | 4 per 1000 (1 to 304) | |||||
| Airway interventions | Medium risk population | RR 1.26 (0.94 to 1.69) | 1272 participants (3 studies) | ⊕⊕⊕⊝ | 2 studies included verbal/physical stimulation and supplemental oxygen as airway interventions (not consistent with our definition) but only reported total airway interventions (as dichotomous outcomes). | |
| 150 per 1000f | 189 per 1000 | |||||
| Airway interventions adult subgroup analysis (aged ≥ 18 years)h | Medium risk population | RR 1.44 (1.16 to 1.79) | 1118 participants (2 studies) | ⊕⊕⊕⊝ | ‐ | |
| 190 per 1000i | 274 per 1000 | |||||
| Recovery time | None of the studies reported recovery time. | |||||
| *The basis for the assumed risk (e.g. the median control group risk across studies) is provided in footnotes. The corresponding risk (and its 95% confidence interval) is based on the assumed risk in the comparison group and the relative effect of the intervention (and its 95% CI). CI: confidence interval; PSA: procedural sedation and analgesia; RR: risk ratio. | ||||||
| GRADE Working Group grades of evidence | ||||||
| aCampbell 2006; Cudny 2013. No study found to determine assumed risk for all‐age population, combined incidence of these studies used as a surrogate. Hypoxia defined as oxygen saturation < 90% at any time with baseline oxygen saturation ≥ 95% for Campbell 2006. Unknown definition of hypoxia for Cudny 2013. b Although statistics show low to moderate heterogeneity (I2 = 42%, P = 0.18), quality downgraded due to heterogeneity in study designs. cCampbell 2006. Hypotension defined as systolic blood pressure < 85 mmHg at any time with baseline systolic blood pressure ≥ 100 mmHg. d Downgraded for reporting bias in one study. eLanghan 2012. Used this paediatric study as surrogate for all ages population. g Downgraded due to significant heterogeneity (I2 = 53%). h The study by Campbell 2016 reported adults aged 16 years or greater whereas the study by Deitch 2010 reported adults aged greater than 18 years. j Downgraded due to heterogeneity in outcome definitions as well as small number of studies. | ||||||
| Outcome or subgroup title | No. of studies | No. of participants | Statistical method | Effect size |
| 1 Oxygen desaturation Show forest plot | 3 | 1272 | Risk Ratio (M‐H, Random, 95% CI) | 0.89 [0.48, 1.63] |
| 2 Hypotension Show forest plot | 1 | Risk Ratio (M‐H, Random, 95% CI) | Totals not selected | |
| 3 Emesis, pulmonary aspiration Show forest plot | 1 | Risk Ratio (M‐H, Random, 95% CI) | Totals not selected | |
| 4 Airway interventions Show forest plot | 3 | 1272 | Risk Ratio (M‐H, Random, 95% CI) | 1.26 [0.94, 1.69] |
| 5 Oxygen desaturation (subgroup analysis) Show forest plot | 3 | Risk Ratio (M‐H, Random, 95% CI) | Subtotals only | |
| 5.1 Adults (aged ≥ 18 years) | 2 | 1118 | Risk Ratio (M‐H, Random, 95% CI) | 0.79 [0.37, 1.71] |
| 5.2 Paediatric (aged <18 years) | 1 | 154 | Risk Ratio (M‐H, Random, 95% CI) | 1.33 [0.49, 3.66] |
| 6 Oxygen desaturation (sensitivity analysis), Deitch 2010 excluded Show forest plot | 2 | 1140 | Risk Ratio (M‐H, Random, 95% CI) | 1.33 [0.66, 2.69] |
| 7 Airway interventions (subgroup analysis) Show forest plot | 3 | 1272 | Risk Ratio (M‐H, Random, 95% CI) | 1.26 [0.94, 1.69] |
| 7.1 Adults (aged ≥ 18 years) | 2 | 1118 | Risk Ratio (M‐H, Random, 95% CI) | 1.44 [1.16, 1.79] |
| 7.2 Paediatric (aged < 18 years) | 1 | 154 | Risk Ratio (M‐H, Random, 95% CI) | 0.97 [0.71, 1.34] |