Methods to decrease blood loss during liver resection: a network meta‐analysis
Abstract
Background
Liver resection is a major surgery with significant mortality and morbidity. Specialists have tested various methods in attempts to limit blood loss, transfusion requirements, and morbidity during elective liver resection. These methods include different approaches (anterior versus conventional approach), use of autologous blood donation, cardiopulmonary interventions such as hypoventilation, low central venous pressure, different methods of parenchymal transection, different methods of management of the raw surface of the liver, different methods of vascular occlusion, and different pharmacological interventions. A surgeon typically uses only one of the methods from each of these seven categories. The optimal method to decrease blood loss and transfusion requirements in people undergoing liver resection is unknown.
Objectives
To assess the effects of different interventions for decreasing blood loss and blood transfusion requirements during elective liver resection.
Search methods
We searched the Cochrane Central Register of Controlled Trials (CENTRAL), MEDLINE, Embase, and Science Citation Index Expanded to September 2015 to identify randomised clinical trials. We also searched trial registers and handsearched the references lists of identified trials.
Selection criteria
We included only randomised clinical trials (irrespective of language, blinding, or publication status) comparing different methods of decreasing blood loss and blood transfusion requirements in people undergoing liver resection.
Data collection and analysis
Two review authors independently identified trials and collected data. We assessed the risk of bias using Cochrane domains. We conducted a Bayesian network meta‐analysis using the Markov chain Monte Carlo method in WinBUGS 1.4, following the guidelines of the National Institute for Health and Care Excellence Decision Support Unit guidance documents. We calculated the odds ratios (OR) with 95% credible intervals (CrI) for the binary outcomes, mean differences (MD) with 95% CrI for continuous outcomes, and rate ratios with 95% CrI for count outcomes, using a fixed‐effect model or random‐effects model according to model‐fit. We assessed the evidence with GRADE.
Main results
We identified 67 randomised clinical trials involving a total of 6197 participants. All the trials were at high risk of bias. A total of 5771 participants from 64 trials provided data for one or more outcomes included in this review. There was no evidence of differences in most of the comparisons, and where there was, these differences were in single trials, mostly of small sample size. We summarise only the evidence that was available in more than one trial below. Of the primary outcomes, the only one with evidence of a difference from more than one trial under the pair‐wise comparison was in the number of adverse events (complications), which was higher with radiofrequency dissecting sealer than with the clamp‐crush method (rate ratio 1.85, 95% CrI 1.07 to 3.26; 250 participants; 3 studies; very low‐quality evidence). Among the secondary outcomes, the only differences we found from more than one trial under the pair‐wise comparison were the following: blood transfusion (proportion) was higher in the low central venous pressure group than in the acute normovolemic haemodilution plus low central venous pressure group (OR 3.19, 95% CrI 1.56 to 6.95; 208 participants; 2 studies; low‐quality evidence); blood transfusion quantity (red blood cells) was lower in the fibrin sealant group than in the control (MD −0.53 units, 95% CrI −1.00 to −0.07; 122 participants; 2; very low‐quality evidence); blood transfusion quantity (fresh frozen plasma) was higher in the oxidised cellulose group than in the fibrin sealant group (MD 0.53 units, 95% CrI 0.36 to 0.71; 80 participants; 2 studies; very low‐quality evidence); blood loss (MD −0.34 L, 95% CrI −0.46 to −0.22; 237 participants; 4 studies; very low‐quality evidence), total hospital stay (MD −2.42 days, 95% CrI −3.91 to −0.94; 197 participants; 3 studies; very low‐quality evidence), and operating time (MD −15.32 minutes, 95% CrI −29.03 to −1.69; 192 participants; 4 studies; very low‐quality evidence) were lower with low central venous pressure than with control. For the other comparisons, the evidence for difference was either based on single small trials or there was no evidence of differences. None of the trials reported health‐related quality of life or time needed to return to work.
Authors' conclusions
Paucity of data meant that we could not assess transitivity assumptions and inconsistency for most analyses. When direct and indirect comparisons were available, network meta‐analysis provided additional effect estimates for comparisons where there were no direct comparisons. However, the paucity of data decreases the confidence in the results of the network meta‐analysis. Low‐quality evidence suggests that liver resection using a radiofrequency dissecting sealer may be associated with more adverse events than with the clamp‐crush method. Low‐quality evidence also suggests that the proportion of people requiring a blood transfusion is higher with low central venous pressure than with acute normovolemic haemodilution plus low central venous pressure; very low‐quality evidence suggests that blood transfusion quantity (red blood cells) was lower with fibrin sealant than control; blood transfusion quantity (fresh frozen plasma) was higher with oxidised cellulose than with fibrin sealant; and blood loss, total hospital stay, and operating time were lower with low central venous pressure than with control. There is no evidence to suggest that using special equipment for liver resection is of any benefit in decreasing the mortality, morbidity, or blood transfusion requirements (very low‐quality evidence). Radiofrequency dissecting sealer should not be used outside the clinical trial setting since there is low‐quality evidence for increased harm without any evidence of benefits. In addition, it should be noted that the sample size was small and the credible intervals were wide, and we cannot rule out considerable benefit or harm with a specific method of liver resection.
PICO
Plain language summary
Surgical methods to decrease blood loss during liver surgery
Background
Many cancerous and non‐cancerous growths that develop in the liver are treated by removing part of the liver (liver resection), which is major surgery with high risk of complications, including blood loss during division of the liver tissue. Specialists have tested several methods to decrease blood loss during liver resection. These include lowering the pressure in the liver veins (low central venous pressure) or decreasing the amount of air that enters and leaves the lungs (hypoventilation), again aimed at decreasing central venous pressure; different ways of cutting the liver, for example, without any special equipment or using ultrasound waves or high‐frequency (radiofrequency); applying glue to decrease bleeding from the cut surface; blocking the blood supply to the liver during the operation, a process known as vascular occlusion, which could be performed continuously or intermittently. In addition, medical treatments that improve clotting of blood can be given to decrease blood loss. A surgeon typically uses one or more methods to decrease blood loss during liver surgery. The optimal method is unknown. We sought to identify the best methods of decreasing blood loss during liver surgery by performing a literature search that included all studies reported until September 2015. We used special statistical methods, so‐called network meta‐analyses. to compare the different treatments simultaneously as compared to the traditional Cochrane method of comparing two treatments at a time as there are multiple treatment strategies.
Study characteristics
We identified 67 randomised clinical trials involving a total of 6197 participants that met our inclusion criteria. However, we were only able to include 5771 participants from 64 trials since investigators either did not include the remaining participants in the analysis or did not report any outcomes of interest.
Source of funding: 24 trials (35.8%) were funded by parties with no financial interest in obtaining positive results for the treatment being evaluated. The remaining trials received funding from either parties who would gain financially from the results of the study or did not report the funding.
Quality of evidence
All the trials were at high risk of bias, that is, investigators may have overestimated the benefits or underestimated the harms of one method or the other because of the way that the studies were conducted. Many trials included few participants, and there was a good chance of arriving at the wrong conclusions because of this. The overall quality of evidence was low or very low.
Key results
There was no evidence of differences in most of the comparisons, and where there was, these differences were in single trials, mostly of small sample size. Such evidence is unreliable. So, we mention only the evidence that was available in more than one trial. Of the primary outcomes, the only one where there was evidence of difference was in the number of adverse events, which was higher with radiofrequency dissecting sealer than with clamp‐crush method. Among the secondary outcomes, the only evidence of difference was in the following:
Blood transfusion (percentage): higher in the low central venous pressure group than in the acute normovolemic haemodilution (diluting the blood by giving fluids during operation) plus low central venous pressure group.
Blood transfusion amount: lower in the fibrin sealant group (a type of glue applied to the cut surface of the liver) than in the control.
Blood transfusion (fresh frozen plasma − a component of blood): higher in the oxidised cellulose (another type of glue applied to the cut surface of the liver) group than in the fibrin sealant group.
Blood loss, total hospital stay, and operating time: lower with the low central venous pressure group than control.
For other comparisons, the evidence for difference was based on single small trials, or there was no evidence of differences. None of the trials reported health‐related quality of life or time needed to return to work. There is no evidence to suggest that using special equipment for liver resection is of any benefit.
Authors' conclusions
Summary of findings
| Methods to decrease blood loss during liver resection: a network meta‐analysis. Primary outcomes | |||||||
| Patient or population: people undergoing liver resection Settings: secondary or tertiary setting Intervention and control: various treatments Follow‐up: until discharge or 1 month (except for mortality (long‐term follow‐up) which was reported at 1 year | |||||||
| Outcomes | Anterior approach versus conventional approach | Autologous blood donation versus control | Cardiopulmonary interventions | Methods of parenchymal transection | Methods of dealing with cut surface | Methods of vascular occlusion | Pharmacological interventions |
| Treatments The first treatment listed is the control. The remaining are interventions. |
|
|
|
|
|
|
|
| Link for detailed 'Summary of Findings tables' | |||||||
| Mortality (perioperative) | There was no evidence of differences in perioperative mortality between the 2 groups. Quality of evidence = very low1,2,3. | There was no evidence of differences in perioperative mortality between the two groups. Quality of evidence = very low1,2,3. | There was no evidence of differences in perioperative mortality for any of the comparisons. Quality of evidence = very low1,2,3. | There was no evidence of differences in perioperative mortality for any of the comparisons. Quality of evidence = very low1,2,3. | There was no evidence of differences in perioperative mortality for any of the comparisons Quality of evidence = very low1,2,3. | There was no evidence of differences in perioperative mortality for any of the comparisons. Quality of evidence = very low1,2,3. | There was no evidence of differences in perioperative mortality for any of the comparisons. Quality of evidence = very low1,2,3. |
| Mortality (longest follow‐up) | None of the trials reported this outcome. | There was no evidence of differences in mortality at 1 year between the 2 groups. Quality of evidence = very low)1,2,3. | None of the trials reported this outcome. | None of the trials reported this outcome. | None of the trials reported this outcome. | None of the trials reported this outcome. | None of the trials reported this outcome. |
| Serious adverse events (proportion) | There was no evidence of differences in the proportion of participants experiencing serious adverse events between the 2 groups. Quality of evidence = very low1,2,3. | None of the trials reported this outcome. | There was no evidence of differences in the proportion of participants experiencing serious adverse events (for any of the comparisons Quality of evidence = very low1,2,3. | There was no evidence of differences in the proportion of participants experiencing serious adverse events for any of the comparisons Quality of evidence = very low1,2,3. | There was no evidence of differences in the proportion of participants experiencing serious adverse events for any of the comparisons Quality of evidence = very low1,2,3. | The proportion of participants experiencing serious adverse eventsa was lower in continuous selective portal triad clamping than continuous portal triad clamping
There was no evidence of differences in other comparisons. Quality of evidence = very low1,2,3 | There was no evidence of differences in the proportion of participants experiencing serious adverse events for any of the comparisons Quality of evidence = very low1,2,3. |
| Serious adverse events (number) | None of the trials reported this outcome. | None of the trials reported this outcome. | There was no evidence of differences in the number of serious adverse events for any of the comparisons Quality of evidence = very low1,2,3. | The number of serious adverse events was higher in radiofrequency dissecting sealer than clamp‐crush method.
There was no evidence of differences in other comparisons. Quality of evidence = very low1,2,3. | The number of serious adverse events was higher in fibrin sealant than argon beam.
There was no evidence of differences in other comparisons. Quality of evidence = very low1,2,3. | The number of serious adverse events was lower in intermittent portal triad clamping than continuous portal triad clamping.
There was no evidence of differences in other comparisons Quality of evidence = very low1,2,3. | There was no evidence of differences in the number of serious adverse events for any of the comparisons Quality of evidence = very low1,2,3. |
| Health‐related quality of life | None of the trials reported this outcome. | None of the trials reported this outcome. | None of the trials reported this outcome at any time point. | None of the trials reported this outcome at any time point. | None of the trials reported this outcome at any time point. | None of the trials reported this outcome at any time point. | None of the trials reported this outcome at any time point. |
| CrI: credible intervals; OR: odds ratio. | |||||||
| GRADE Working Group grades of evidence | |||||||
| 1 Risk of bias was unclear or high in the trial(s) (downgraded by 1 point). | |||||||
| Outcomes | Illustrative comparative risks* (95% CrI) | Relative effect (95% CrI) | No of participants | Quality of the evidence | |
| Assumed risk | Corresponding risk | ||||
| Control | Intervention | ||||
| Mortality (perioperative) | 76 per 1000 | 19 per 1000 | OR 0.23 | 185 | ⊕⊝⊝⊝ |
| Mortality (longest follow‐up) | None of the trials reported this outcome. | ||||
| Serious adverse events (proportion) | 125 per 1000 | 154 per 1000 | OR 1.27 | 65 | ⊕⊝⊝⊝ |
| Serious adverse events (number) | None of the trials reported this outcome. | ||||
| Health‐related quality of life (30 days, 3 months) | None of the trials reported this outcome. | ||||
| Health‐related quality of life (maximal follow‐up) | None of the trials reported this outcome. | ||||
| *The basis for the assumed risk is the mean control group proportion. The corresponding risk (and its 95% credible interval) is based on the assumed risk in the comparison group and the relative effect of the intervention (and its 95% CrI). Network meta‐analysis was not performed for any of the outcomes since there were only two treatments. CrI: credible intervals; OR: odds ratio. | |||||
| GRADE Working Group grades of evidence | |||||
| 1 Risk of bias was unclear or high in the trial(s) (downgraded by 1 point). | |||||
| Outcomes | Illustrative comparative risks* (95% CrI) | Relative effect (95% CrI) | No of participants | Quality of the evidence | |
| Assumed risk | Corresponding risk | ||||
| Control | Intervention | ||||
| Mortality (perioperative) | There was no mortality in either group. | 28 (1 study) | ⊕⊝⊝⊝ Very low1,2,3 | ||
| Mortality (longest follow‐up): reported at 1 year | There was no mortality in either group. | 28 (1 study) | ⊕⊝⊝⊝ Very low1,2,3 | ||
| Serious adverse events (proportion) | None of the trials reported this outcome. | ||||
| Serious adverse events (number) | None of the trials reported this outcome. | ||||
| Health‐related quality of life (30 days, 3 months) | None of the trials reported this outcome. | ||||
| Health‐related quality of life (longest follow‐up) | None of the trials reported this outcome. | ||||
| *The basis for the assumed risk is the mean control group proportion. The corresponding risk (and its 95% credible interval) is based on the assumed risk in the comparison group and the relative effect of the intervention (and its 95% CrI). Network meta‐analysis was not performed for any of the outcomes since there were only two treatments. CrI: credible intervals; OR: odds ratio | |||||
| GRADE Working Group grades of evidence | |||||
| 1 Risk of bias was unclear or high in the trial(s) (downgraded by 1 point). | |||||
| Outcomes | Illustrative comparative risks* (95% CrI) | Relative effect (95% CrI) | No of participants | Quality of the evidence | |
| Assumed risk | Corresponding risk | ||||
| Control | Intervention | ||||
| Mortality (perioperative) | |||||
| Hypoventilation vs control | There was no mortality in either group. | 79 (1 study) | ⊕⊝⊝⊝ Very low1,2,3 | ||
| Low central venous pressure vs control | There was no mortality in either group. | 85 (1 study) | ⊕⊝⊝⊝ Very low1,2,3 | ||
| Mortality (longest follow‐up) | None of the trials reported this outcome. | ||||
| Serious adverse events (proportion) | |||||
| Hypoventilation vs control | 26 per 1000 | 60 per 1000 (5 to 679) | OR 2.41 (0.18 to 80.4) | 79 (1 study) | ⊕⊝⊝⊝ Very low1,2,3 |
| Low central venous pressure vs acute normovolemic haemodilution plus low CVP | 302 per 1000 | 284 per 1000 (157 to 460) | OR 0.92 (0.43 to 1.97) | 63 (1 study) | ⊕⊝⊝⊝ Very low1,2,3 |
| Serious adverse events (number) | |||||
| Low central venous pressure vs control | 100 per 1000 | 0 per 1000 (0 to 2) | Rate ratio 0.00 (0 to 0.02) | 42 (1 study) | ⊕⊝⊝⊝ Very lowa,b,c |
| Low central venous pressure vs acute normovolemic haemodilution plus low central venous pressure | 103 per 1000 | 77 per 1000 (15 to 287) | Rate ratio 0.73 (0.13 to 3.53) | 78 (1 study) | ⊕⊝⊝⊝ Very lowa,b,c |
| Health‐related quality of life (30 days, 3 months) | None of the trials reported this outcome. | ||||
| Health‐related quality of life (longest follow‐up) | None of the trials reported this outcome. | ||||
| *The basis for the assumed risk is the mean control group proportion. The corresponding risk (and its 95% credible interval) is based on the assumed risk in the comparison group and the relative effect of the intervention (and its 95% CrI). Network meta‐analysis was not performed for any of the outcomes because of the lack of availability of direct and indirect comparisons in the network. CrI: credible intervals; OR: odds ratio. | |||||
| GRADE Working Group grades of evidence | |||||
| 1aRisk of bias was unclear or high in the trial(s) (downgraded by 1 point). | |||||
| Outcomes | Illustrative comparative risks* (95% CrI) | Relative effect (95% CrI) | No of participants | Quality of the evidence | |
| Assumed risk | Corresponding risk | ||||
| Control | Intervention | ||||
| Mortality (perioperative) | |||||
| CUSA vs clamp‐crush method | 23 per 1000 | 6 per 1000 (0 to 54) | OR 0.24 (0.01 to 2.41) | 172 (2 studies) | ⊕⊝⊝⊝ Very low1,2,3 |
| Radiofrequency dissecting sealer vs clamp‐crush method | 10 per 1000 | 16 per 1000 (4 to 65) | OR 1.60 (0.43 to 6.7) | 390 (5 studies) | ⊕⊝⊝⊝ Very low1,2,3 |
| Sharp transection method vs clamp‐crush method | There was no mortality in either group. | 82 (1 study) | ⊕⊝⊝⊝ Very low1,2,3 | ||
| Stapler vs clamp‐crush method | 31 per 1000 | 67 per 1000 (12 to 375) | OR 2.26 (0.39 to 18.93) | 130 (1 study) | ⊕⊝⊝⊝ Very low1,2,3 |
| Hydrojet vs CUSA | 55 per 1000 | 54 per 1000 (9 to 258) | OR 0.98 (0.16 to 6.04) | 111 (2 studies) | ⊕⊝⊝⊝ Very low1,2,3 |
| Radiofrequency dissecting sealer vs CUSA | 44 per 1000 | 28 per 1000 (3 to 166) | OR 0.61 (0.07 to 4.28) | 90 (2 studies) | ⊕⊝⊝⊝ Very low1,2,3 |
| Stapler vs CUSA | There was no mortality in either group. | 79 (1 study) | ⊕⊝⊝⊝ Very low1,2,3 | ||
| Radiofrequency dissecting sealer vs hydrojet | 80 per 1000 | 9 per 1000 (0 to 145) | OR 0.10 (0 to 1.95) | 50 (1 study) | ⊕⊝⊝⊝ Very low1,2,3 |
| Mortality (longest follow‐up) | None of the trials reported this outcome. | ||||
| Serious adverse events (proportion) | |||||
| CUSA vs clamp‐crush method | 93 per 1000 | 31 per 1000 (6 to 110) | OR 0.31 (0.06 to 1.2) | 172 (2 studies) | ⊕⊝⊝⊝ Very low1,2,3 |
| Radiofrequency dissecting sealer vs clamp‐crush method | 58 per 1000 | 49 per 1000 (15 to 145) | OR 0.83 (0.24 to 2.74) | 240 (3 studies) | ⊕⊝⊝⊝ Very low1,2,3 |
| Sharp transection method vs clamp‐crush method | 49 per 1000 | 106 per 1000 (20 to 502) | OR 2.31 (0.39 to 19.69) | 82 (1 study) | ⊕⊝⊝⊝ Very low1,2,3 |
| Hydrojet vs CUSA | 100 per 1000 | 124 per 1000 (61 to 238) | OR 1.27 (0.58 to 2.81) | 61 (1 study) | ⊕⊝⊝⊝ Very low1,2,3 |
| Radiofrequency dissecting sealer vs CUSA | 50 per 1000 | 30 per 1000 (3 to 180) | OR 0.58 (0.06 to 4.16) | 40 (1 study) | ⊕⊝⊝⊝ Very low1,2,3 |
| Stapler vs CUSA | 246 per 1000 | 246 per 1000 (6 to 931) | OR 1.00 (0.02 to 41.22) | 130 (1 study) | ⊕⊝⊝⊝ Very low1,2,3 |
| Serious adverse events (number) | |||||
| CUSA vs clamp‐crush method | 45 per 1000 | 29 per 1000 (3 to 166) | Rate ratio 0.63 (0.07 to 4.17) | 132 (1 study) | ⊕⊝⊝⊝ Very low1,2,3 |
| Radiofrequency dissecting sealer vs clamp‐crush method | 61 per 1000 | 190 per 1000 (75 to 474) | Rate ratio 3.64 (1.25 to 13.97) | 130 (2 studies) | ⊕⊕⊝⊝ Low1,2 |
| Hydrojet vs CUSA | 80 per 1000 | 121 per 1000 (20 to 546) | Rate ratio 1.59 (0.24 to 13.83) | 50 (1 study) | ⊕⊝⊝⊝ Very low1,2,3 |
| Radiofrequency dissecting sealer vs CUSA | 80 per 1000 | 121 per 1000 (20 to 546) | Rate ratio 1.59 (0.24 to 13.83) | 50 (1 study) | ⊕⊝⊝⊝ Very low1,2,3 |
| Stapler vs CUSA | 180 per 1000 | 230 per 1000 (109 to 424) | Rate ratio 1.36 (0.56 to 3.36) | 100 (1 study) | ⊕⊝⊝⊝ Very low1,2,3 |
| Radiofrequency dissecting sealer vs hydrojet | 120 per 1000 | 120 per 1000 (23 to 445) | Rate ratio 1.00 (0.17 to 5.88) | 50 (1 study) | ⊕⊝⊝⊝ Very low1,2,3 |
| Health‐related quality of life (30 days, 3 months) | None of the trials reported this outcome. | ||||
| Health‐related quality of life (maximal follow‐up) | None of the trials reported this outcome. | ||||
| *The basis for the assumed risk is the mean control group proportion. The corresponding risk (and its 95% credible interval) is based on the assumed risk in the comparison group and the relative effect of the intervention (and its 95% CrI). Network meta‐analysis was not performed for any of the outcomes because of the lack of availability of direct and indirect comparisons in the network. CrI: credible intervals; CUSA: cavitron ultrasonic surgical aspirator; OR: odds ratio | |||||
| GRADE Working Group grades of evidence | |||||
| 1 Risk of bias was unclear or high in the trial(s) (downgraded by 1 point). | |||||
| Outcomes | Illustrative comparative risks* (95% CrI) | Relative effect (95% CrI) | No of participants | Quality of the evidence | |
| Assumed risk | Corresponding risk | ||||
| Control | Intervention | ||||
| Mortality (perioperative) | |||||
| Fibrin sealant vs control | 11 per 1000 | 41 per 1000 (10 to 253) | OR 4.03 (0.9 to 31.72) | 380 (2 studies) | ⊕⊝⊝⊝ Very low1,2,3 |
| Fibrin sealant and collagen vs control | 13 per 1000 | 45 per 1000 (10 to 268) | OR 3.48 (0.74 to 27.03) | 300 (1 study) | ⊕⊝⊝⊝ Very low1,2,3 |
| Fibrin sealant vs argon beam | 53 per 1000 | 72 per 1000 (25 to 198) | OR 1.39 (0.46 to 4.45) | 227 (2 studies) | ⊕⊝⊝⊝ Very low1,2,3 |
| Fibrin sealant vs collagen | 33 per 1000 | 30 per 1000 (7 to 123) | OR 0.91 (0.2 to 4.14) | 256 (3 studies) | ⊕⊝⊝⊝ Very low1,2,3 |
| Oxidised cellulose vs fibrin sealant | 56 per 1000 | 31 per 1000 (1 to 565) | OR 0.54 (0.01 to 22.09) | 50 (1 study) | ⊕⊝⊝⊝ Very low1,2,3 |
| Plasmajet vs fibrin sealant | 103 per 1000 | 65 per 1000 (7 to 332) | OR 0.60 (0.06 to 4.31) | 58 (1 study) | ⊕⊝⊝⊝ Very low1,2,3 |
| Mortality (longest follow‐up) | None of the trials reported this outcome. | ||||
| Serious adverse events (proportion) | |||||
| Fibrin sealant vs control | 186 per 1000 | 191 per 1000 (128 to 275) | OR 1.03 (0.64 to 1.66) | 457 (3 studies) | ⊕⊝⊝⊝ Very low1,2,3 |
| Fibrin sealant vs argon beam | 269 per 1000 | 183 per 1000 (78 to 360) | OR 0.61 (0.23 to 1.53) | 106 (1 study) | ⊕⊝⊝⊝ Very low1,2,3 |
| Fibrin sealant vs collagen | 258 per 1000 | 356 per 1000 (205 to 547) | OR 1.59 (0.74 to 3.47) | 127 (1 study) | ⊕⊝⊝⊝ Very low1,2,3 |
| Oxidised cellulose vs fibrin sealant | 444 per 1000 | 309 per 1000 (113 to 603) | OR 0.56 (0.16 to 1.9) | 50 (1 study) | ⊕⊝⊝⊝ Very low1,2,3 |
| Plasmajet vs fibrin sealant | 207 per 1000 | 25 per 1000 (0 to 165) | OR 0.10 (0 to 0.76) | 58 (1 study) | ⊕⊝⊝⊝ Very low1,2,3 |
| Serious adverse events (number) | |||||
| Fibrin sealant vs control | 486 per 1000 | 470 per 1000 (307 to 640) | Rate ratio 0.94 (0.47 to 1.88) | 70 (1 study) | ⊕⊝⊝⊝ Very low1,2,3 |
| Fibrin sealant & collagen vs control | 147 per 1000 | 186 per 1000 (116 to 286) | Rate ratio 1.33 (0.76 to 2.33) | 300 (1 study) | ⊕⊝⊝⊝ Very low1,2,3 |
| Fibrin sealant vs argon beam | 65 per 1000 | 249 per 1000 (107 to 547) | Rate ratio 4.81 (1.73 to 17.5) | 121 (1 study) | ⊕⊕⊝⊝ Low1,2 |
| Fibrin sealant vs collagen | 323 per 1000 | 369 per 1000 (266 to 488) | Rate ratio 1.23 (0.76 to 2) | 189 (2 studies) | ⊕⊝⊝⊝ Very low1,2,3 |
| Fibrin sealant vs cyanoacrylate | 67 per 1000 | 67 per 1000 (2 to 733) | Rate ratio 1.01 (0.03 to 38.36) | 30 (1 study) | ⊕⊝⊝⊝ Very low1,2,3 |
| Oxidised cellulose vs cyanoacrylate | 67 per 1000 | 277 per 1000 (46 to 921) | Rate ratio 5.37 (0.67 to 163.2) | 30 (1 study) | ⊕⊝⊝⊝ Very low1,2,3 |
| Oxidised cellulose vs fibrin sealant | 67 per 1000 | 278 per 1000 (46 to 926) | Rate ratio 5.40 (0.67 to 174.86) | 30 (1 study) | ⊕⊝⊝⊝ Very low1,2,3 |
| Health‐related quality of life (30 days, 3 months) | None of the trials reported this outcome. | ||||
| Health‐related quality of life (longest follow‐up) | None of the trials reported this outcome. | ||||
| *The basis for the assumed risk is the mean control group proportion. The corresponding risk (and its 95% credible interval) is based on the assumed risk in the comparison group and the relative effect of the intervention (and its 95% CrI). Network meta‐analysis was not performed for any of the outcomes because of the lack of availability of direct and indirect comparisons in the network. CrI: credible intervals; OR: odds ratio. | |||||
| GRADE Working Group grades of evidence | |||||
| 1 Risk of bias was unclear or high in the trial(s) (downgraded by 1 point). | |||||
| Outcomes | Illustrative comparative risks* (95% CrI) | Relative effect (95% CrI) | No of participants | Quality of the evidence | |
| Assumed risk | Corresponding risk | ||||
| Control | Intervention | ||||
| Mortality (perioperative) | |||||
| Continuous portal triad clamping vs control | There was no mortality in either group. | 15 (1 study) | ⊕⊝⊝⊝ Very low1,2,3 | ||
| Intermittent portal triad clamping vs control | 26 per 1000 | 15 per 1000 (3 to 60) | OR 0.60 (0.13 to 2.42) | 392 (4 studies) | ⊕⊝⊝⊝ Very low1,2,3 |
| Continuous portal triad clamping vs continuous hepatic vascular exclusion | 1 per 1000 | 5 per 1000 (4 to 15) | OR 4.91 (3.68 to 15.64) | 170 (2 studies) | ⊕⊝⊝⊝ Very low1,2,3 |
| Continuous selective hepatic vascular exclusion vs continuous portal triad clamping | There was no mortality in either group. | 160 (1 study) | ⊕⊝⊝⊝ Very low1,2,3 | ||
| Continuous selective portal triad clamping vs continuous portal triad clamping | There was no mortality in either group. | 120 (1 study) | ⊕⊝⊝⊝ Very low1,2,3 | ||
| Intermittent portal triad clamping vs continuous portal triad clamping | 67 per 1000 | 10 per 1000 (0 to 70) | OR 0.14 (0 to 1.05) | 121 (2 studies) | ⊕⊝⊝⊝ Very low1,2,3 |
| Intermittent portal triad clamping vs continuous selective portal triad clamping | There was no mortality in either group. | 80 (1 study) | ⊕⊝⊝⊝ Very low1,2,3 | ||
| Intermittent selective portal triad clamping vs intermittent portal triad clamping | 1 per 1000 | 2 per 1000 (0 to 69) | OR 2.27 (0.17 to 74) | 138 (2 studies) | ⊕⊝⊝⊝ Very low1,2,3 |
| Mortality (longest follow‐up) | None of the trials reported this outcome. | ||||
| Serious adverse events (proportion)* | |||||
| Continuous hepatic vascular exclusion vs control | 99 per 1000 | 200 per 1000 (19 to 785) | Rate ratio 2.27 (0.18 to 33.05) | 815 (6 studies) | ⊕⊝⊝⊝ Very low1,2,3 |
| Continuous portal triad clamping vs control | 99 per 1000 | 135 per 1000 (30 to 439) | Rate ratio 1.42 (0.28 to 7.09) | 815 (6 studies) | ⊕⊝⊝⊝ Very low1,2,3 |
| Continuous selective hepatic vascular exclusion vs control | 99 per 1000 | 15 per 1000 (0 to 325) | Rate ratio 0.14 (0 to 4.37) | 815 (6 studies) | ⊕⊝⊝⊝ Very low1,2,3 |
| Continuous selective portal triad clamping vs control | 99 per 1000 | 55 per 1000 (11 to 226) | Rate ratio 0.53 (0.1 to 2.65) | 815 (6 studies) | ⊕⊝⊝⊝ Very low1,2,3 |
| Intermittent portal triad clamping vs control | 99 per 1000 | 113 per 1000 (56 to 217) | Rate ratio 1.16 (0.54 to 2.51) | 815 (6 studies) | ⊕⊝⊝⊝ Very low1,2,3 |
| Continuous portal triad clamping vs continuous hepatic vascular exclusion | 50 per 1000 | 32 per 1000 (2 to 412) | Rate ratio 0.63 (0.03 to 13.31) | 815 (6 studies) | ⊕⊝⊝⊝ Very low1,2,3 |
| Continuous selective hepatic vascular exclusion vs continuous hepatic vascular exclusion | 50 per 1000 | 3 per 1000 (0 to 442) | Rate ratio 0.06 (0 to 15.06) | 815 (6 studies) | ⊕⊝⊝⊝ Very low1,2,3 |
| Continuous selective portal triad clamping vs continuous hepatic vascular exclusion | 50 per 1000 | 12 per 1000 (1 to 209) | Rate ratio 0.23 (0.01 to 5.02) | 815 (6 studies) | ⊕⊝⊝⊝ Very low1,2,3 |
| Intermittent portal triad clamping vs continuous hepatic vascular exclusion | 50 per 1000 | 26 per 1000 (2 to 288) | Rate ratio 0.51 (0.03 to 7.68) | 815 (6 studies) | ⊕⊝⊝⊝ Very low1,2,3 |
| Continuous selective hepatic vascular exclusion vs continuous portal triad clamping | 139 per 1000 | 16 per 1000 (0 to 724) | Rate ratio 0.10 (0 to 16.28) | 815 (6 studies) | ⊕⊝⊝⊝ Very low1,2,3 |
| Continuous selective portal triad clamping vs continuous portal triad clamping | 139 per 1000 | 56 per 1000 (6 to 374) | Rate ratio 0.37 (0.04 to 3.7) | 815 (6 studies) | ⊕⊝⊝⊝ Very low1,2,3 |
| Intermittent portal triad clamping vs continuous portal triad clamping | 139 per 1000 | 117 per 1000 (22 to 439) | Rate ratio 0.82 (0.14 to 4.86) | 815 (6 studies) | ⊕⊝⊝⊝ Very low1,2,3 |
| Continuous selective portal triad clamping vs continuous selective hepatic vascular exclusion | As there were no serious adverse events in either group, the credible intervals were extremely wide. This is equivalent to not estimable in direct comparisons. | 815 (6 studies) | ⊕⊝⊝⊝ Very low1,2,3 | ||
| Intermittent portal triad clamping vs continuous selective hepatic vascular exclusion | As there were no serious adverse events in either group, the credible intervals were extremely wide. This is equivalent to not estimable in direct comparisons. | 815 (6 studies) | ⊕⊝⊝⊝ Very low1,2,3 | ||
| Intermittent portal triad clamping vs continuous selective portal triad clamping | 130 per 1000 | 247 per 1000 (51 to 665) | Rate ratio 2.19 (0.36 to 13.26) | 815 (6 studies) | ⊕⊝⊝⊝ Very low1,2,3 |
| Serious adverse events (number) | |||||
| Intermittent portal triad clamping vs control | 80 per 1000 | 119 per 1000 (36 to 358) | Rate ratio 1.55 (0.43 to 6.4) | 100 (1 study) | ⊕⊝⊝⊝ Very lowa,b,c |
| Continuous portal triad clamping vs continuous hepatic vascular exclusion | 179 per 1000 | 36 per 1000 (2 to 218) | Rate ratio 0.17 (0.01 to 1.28) | 52 (1 study) | ⊕⊝⊝⊝ Very lowa,b,c |
| Intermittent portal triad clamping vs continuous portal triad clamping | 190 per 1000 | 21 per 1000 (0 to 116) | Rate ratio 0.09 (0 to 0.56) | 86 (1 study) | ⊕⊕⊝⊝ Lowa,b |
| Intermittent selective portal triad clamping vs intermittent portal triad clamping | 134 per 1000 | 165 per 1000 (76 to 328) | Rate ratio 1.27 (0.53 to 3.15) | 138 (2 studies) | ⊕⊝⊝⊝ Very lowa,b,c |
| Health‐related quality of life (30 days, 3 months) | None of the trials reported this outcome. | ||||
| Health‐related quality of life (longest follow‐up) | None of the trials reported this outcome. | ||||
| *The basis for the assumed risk is the mean control group proportion. The corresponding risk (and its 95% credible interval) is based on the assumed risk in the comparison group and the relative effect of the intervention (and its 95% CrI). Network meta‐analysis was not performed for any of the outcomes other than serious adverse events (proportion) because of the lack of availability of direct and indirect comparisons in the network. CrI: credible intervals; OR: odds ratio. | |||||
| GRADE Working Group grades of evidence | |||||
| 1 Risk of bias was unclear or high in the trial(s) (downgraded by 1 point). | |||||
| Outcomes | Illustrative comparative risks* (95% CrI) | Relative effect (95% CrI) | No of participants | Quality of the evidence | |
| Assumed risk | Corresponding risk | ||||
| Control | Intervention | ||||
| Mortality (perioperative) | |||||
| Recombinant factor VIIa vs control | 51 per 1000 | 33 per 1000 (7 to 158) | OR 0.63 (0.13 to 3.51) | 185 (1 study) | ⊕⊝⊝⊝ Very low1,2,3 |
| Tranexamic acid vs control | There was no mortality in either group. | 214 (1 study) | ⊕⊝⊝⊝ Very low1,2,3 | ||
| Mortality (longest follow‐up) | None of the trials reported this outcome. | ||||
| Serious adverse events (proportion) | |||||
| Anti‐thrombin III vs control | 273 per 1000 | 312 per 1000 (67 to 761) | OR 1.21 (0.19 to 8.49) | 24 (1 study) | ⊕⊝⊝⊝ Very low1,2,3 |
| Recombinant Factor VIIa vs control | 376 per 1000 | 396 per 1000 (256 to 555) | OR 1.09 (0.57 to 2.07) | 432 (2 studies) | ⊕⊝⊝⊝ Very low1,2,3 |
| Serious adverse events (number) | |||||
| Recombinant Factor VIIa vs control | 81 per 1000 | 120 per 1000 (68 to 217) | Rate ratio 1.55 (0.83 to 3.16) | 432 (2 studies) | ⊕⊝⊝⊝ Very low1,2,3 |
| Tranexamic acid vs control | 75 per 1000 | 65 per 1000 (23 to 164) | Rate ratio 0.85 (0.29 to 2.41) | 214 (1 study) | ⊕⊝⊝⊝ Very low1,2,3 |
| Health‐related quality of life (30 days, 3 months) | None of the trials reported this outcome. | ||||
| Health‐related quality of life (maximal follow‐up) | None of the trials reported this outcome. | ||||
| *The basis for the assumed risk is the mean control group proportion. The corresponding risk (and its 95% credible interval) is based on the assumed risk in the comparison group and the relative effect of the intervention (and its 95% CrI). Network meta‐analysis was not performed for any of the outcomes because of the lack of availability of direct and indirect comparisons in the network. CrI: credible intervals; OR: odds ratio | |||||
| GRADE Working Group grades of evidence | |||||
| 1 Risk of bias was unclear or high in the trial(s) (downgraded by 1 point). | |||||
Background
Description of the condition
Liver resection refers to removal of part of the liver. Every year, an average of 2400 people undergo liver resections in England (HSCIC 2015), 11,000 in the USA (Asiyanbola 2008), and 7200 in France (Farges 2012). In the West, the main indication for liver resection is colorectal liver metastases. Colorectal cancer is the third most common cancer in the world. Approximately 1.36 million people develop colorectal cancer each year (IARC 2012), and 50% to 60% will have colorectal liver metastases (Garden 2006). Liver resection, the only curative option for people with colorectal liver metastases, is indicated in 20% to 30% of people in whom the metastasis is confined to the liver (Garden 2006). Five‐year survival for people with colorectal liver metastases who undergo liver resection is about 45% (Garden 2006; Nordlinger 2013).
The second most common reason for liver resection is hepatocellular carcinoma. Hepatocellular carcinoma is one of the most common cancers, with a worldwide annual incidence of 780,000 people (IARC 2012). Most hepatocellular carcinomas develop in cirrhotic livers (Llovet 2005). Liver resection and liver transplantation are the main curative treatments (Llovet 2005; Taefi 2013). Of people who present with hepatocellular carcinoma, about 5% are candidates for liver resection (Chen 2006). Survival after surgery depends on the stage of cancer and the severity of the underlying chronic liver disease. People with early‐stage disease (cancers smaller than 5 cm) have a five‐year survival of about 50%, whereas people with more advanced disease have a five‐year survival of about 30% (Chen 2006; Navadgi 2016). Screening programmes in theory should lead to a diagnosis at an earlier stage, when surgery is feasible and associated with better outcomes.
Liver resection may also be performed for benign liver tumours (Belghiti 1993).
The liver can be subdivided into eight segments (Couinaud 1999), which can be removed individually or by right hemi‐hepatectomy (Couinaud segments 5 to 8), left hemi‐hepatectomy (segments 2 to 4), right trisectionectomy (segments 4 to 8), or left trisectionectomy (segments 2 to 5 and 8 ± 1) (Strasberg 2000). Although every liver resection is considered major surgery, only resection of three or more segments is considered a major liver resection (Belghiti 1993).
Blood loss during liver resection is an important factor affecting complications and mortality in people undergoing liver resection (Shimada 1998; Yoshimura 2004; Ibrahim 2006). Estimates of blood loss have ranged from 200 mL to 2 L per patient (Gurusamy 2009a). Major blood loss during surgery or in the immediate postoperative period may result in death of the patient. Major blood loss can be defined based on the Advanced Trauma Life Support (ATLS definition of class 3 or class 4 shock, where there is a loss of 30% or more of blood volume) (ATLS 2008). During liver resection, the liver parenchyma is transected at the plane of resection. The blood vessels and the bile duct branches in the plane of resection (cut surface) are then sealed by different methods to prevent blood or bile leakage.
Description of the intervention
Specialists have tested various interventions in attempts to decrease blood loss during liver resection. These interventions include anterior approach as compared to the standard (conventional) surgical approach (Capussotti 2012); autologous blood donation with an aim of decreasing the use of others' blood (heterologous blood transfusion) (Kajikawa 1994), various cardiopulmonary interventions such as acute normovolemic haemodilution (ANH), low central venous pressure (central venous pressure), and hypoventilation that can be used either alone or in combination to decrease blood loss (Gurusamy 2012; Table 1); different methods of liver parenchymal transection (the way that the liver parenchyma is divided), such as the clamp‐crush method, the cavitron ultrasonic surgical aspirator, or the radiofrequency dissecting sealer (Gurusamy 2009b; Table 2); different methods of management of the cut surface of the liver (the way that the resection plane of the remnant liver is managed), such as use of fibrin sealant, argon beamer, or electrocautery and suture material (Frilling 2005; Table 3); temporary occlusion of the blood vessels that supply the liver (Gurusamy 2009a; Table 4); and various pharmacological interventions such as recombinant factor VIIa, antithrombin III, and tranexamic acid (Gurusamy 2009c).
| Acute normovolemic haemodilution (ANH) |
| Low central venous pressure (central venous pressure) |
| Hypoventilation |
| Combination of ANH with central venous pressure or hypotension |
| Finger‐fracture method |
| Clamp‐crush method |
| Cavitron ultrasonic surgical aspirator |
| Sharp dissection |
| Radiofrequency dissecting sealer |
| Ultrasonic shears |
| Stapler |
| Waterjet (Hydrojet) |
| Suturing for large and medium vessels and ducts and performing electrocauterisation of small vessels and ducts |
| Suturing for large vessels and performing ultrasonic shears for medium‐sized and small vessels and ducts |
| Suturing and argon beam coagulator |
| Suturing and fibrin sealant |
| Suturing and collagen |
| Suturing and oxidised cellulose |
| Suturing and cyanoacrylate |
| Suturing and combination of fibrin sealant with collagen or oxidised cellulose |
| No vascular occlusion |
| Portal triad clamping (continuous) (occlusion of inflow alone) |
| Portal triad clamping (intermittent) (occlusion of inflow alone) |
| Hepatic vascular exclusion (occlusion of inflow and outflow) (continuous or intermittent) |
| Selective portal trial clamping (occlusion of inflow to the hemi‐liver that is being resected) (continuous or intermittent) |
| Selective hepatic vascular exclusion (occlusion of inflow to the hemi‐liver and outflow from the hemi‐liver that is being resected) (continuous or intermittent) |
Interventions selected to decrease blood loss can be used alone or in various combinations. Usually surgeons at different centres follow their own protocol for decreasing blood loss. The finger‐fracture and clamp‐crush techniques do not involve specialist equipment. The minimum and standard method of managing the cut surface involves electrocautery for sealing small vessels and suturing larger vessels. Altogether, the goal of these interventions is to decrease blood loss and the associated morbidity and mortality.
How the intervention might work
Temporarily occluding the vessels that supply blood to the liver may reduce the blood loss from the cut vessels. Different methods of liver transection are used to identify major vessels and allow them to be sutured and divided. This might result in clear visualisation of the blood vessels, which can be clamped and then divided. Different topical methods of managing the cut surface attempt to seal the blood vessels on the resection plane, preventing blood loss. Cardiopulmonary interventions decrease the amount of blood lost by dilution of blood or reducing the pressure in the hepatic veins (low central venous pressure). Autologous blood donation involves venesection of the patient prior to surgery and storage of blood which can be replaced if required during or after surgery with the aim of reducing homologous blood transfusion. Pharmacological interventions work by increasing the clotting of blood with a view to decreasing the blood loss. The anterior approach is a surgical technique that involves occluding the inflow and outflow vessels and performing parenchymal transection prior to mobilisation of the right liver (Liu 2006). The potential advantage of anterior approach over the conventional approach, in which liver is mobilised first, is that inadvertent injury to the blood vessels and the resulting bleeding can be avoided since the blood vessels are occluded before liver mobilisation in the anterior approach. Blood vessels may also be occluded first in conventional approach if one of the methods of vascular occlusion is used.
Why it is important to do this review
Liver resection is a major surgical procedure with significant mortality (estimated at 3.5%) and morbidity (estimated around 40%) (Finch 2007; Reissfelder 2011). Interventions that decrease blood loss may improve outcomes of liver resection. Previous systematic reviews have assessed some of the categories of interventions (Gurusamy 2009a; Gurusamy 2009b; Gurusamy 2009c; Gurusamy 2012). We also performed a network meta‐analysis assessing the combination of a method of vascular occlusion, parenchymal transection, and method of dealing with raw surface as a package (Simillis 2014). However, in that review, we found that most authors did not report the different aspects of the method of liver resection other than the factor being randomised or allowed surgeons to choose how to deal with the other factors according to their preference. Since that review excluded such trials, reviewers could only include a few studies. In this updated review, we have covered all the different aspects of the methods to decrease blood loss and blood transfusion requirements during liver resection. We included trials where at least one of the methods to decrease blood loss and blood transfusion requirements during liver resection was included in a randomised comparison with the other aspects either not reported or allowed to vary according to surgeons' preference. This systematic review is intended as a useful guide for patients and healthcare providers as they seek to understand the role of different methods in decreasing blood loss and blood transfusion requirements in people undergoing elective liver resection.
Objectives
To assess the effects of different interventions for decreasing blood loss and blood transfusion requirements during elective liver resection.
Methods
Criteria for considering studies for this review
Types of studies
We considered only randomised clinical trials for this network meta‐analysis. We excluded studies of other designs.
Types of participants
We included randomised clinical trials in which participants underwent elective liver resection using different types of vascular occlusion or no vascular occlusion, irrespective of the method of vascular occlusion or the nature of the background liver (i.e. normal or cirrhotic), different types of parenchymal transection, different types of management of cut surface, or whether pharmacological interventions were used. We excluded randomised clinical trials in which participants underwent liver resection combined with other major surgical procedures (e.g. one‐stage liver and bowel resection for synchronous metastases from colorectal tumours).
Types of interventions
We included randomised clinical trials that assessed one or more of the following interventions in this review.
-
Anterior approach versus conventional approach.
-
Autologous blood donation versus control.
-
Cardiopulmonary interventions.
-
Methods of liver parenchymal transection.
-
Methods of management of the raw surface (resection plane) of the liver.
-
Methods of vascular occlusion (including no vascular occlusion).
-
Pharmacological interventions.
The surgeon (and hence the trialists) may use a particular combination of each of the above. For example, one surgeon may perform liver resection using intermittent vascular occlusion, clamp‐crush technique as the method of liver parenchymal transection, and a fibrin sealant on the cut surface, while another surgeon may perform liver resection without using any method of vascular occlusion, with the cavitron ultrasonic surgical aspirator as the method of liver parenchymal transection, without any fibrin sealant on the cut surface, or any additional pharmacological intervention.
Commonly used surgical techniques under each of the above categories are listed in Table 1, Table 2, Table 3, and Table 4. In practice, surgeons can use any intervention in Table 1 in combination with an intervention from Table 2, Table 3, or Table 4. Any intervention in Table 2 can be used in combination with an intervention from Table 3 or Table 4. Any intervention in Table 3 can be used in combination with an intervention in Table 4. Any of these combinations can be used in combination with anterior or conventional approach, with autologous blood donation, and with or without a pharmacological intervention.
Types of outcome measures
We assessed the comparative effectiveness of available treatment strategies that aimed to decrease blood loss during liver resection for the following outcomes.
Primary outcomes
-
Mortality.
-
Peri‐operative (30‐day mortality or postoperative mortality). We used in‐hospital mortality as defined in the included trials.
-
Long‐term (at longest follow‐up).
-
-
Adverse events. We defined an adverse event as any untoward medical occurrence not necessarily having a causal relationship with the treatment but resulting in a dose reduction or discontinuation of treatment (ICH‐GCP 1997). We considered a serious adverse event to be any event that would increase mortality; was life‐threatening; required inpatient hospitalisation; resulted in persistent or significant disability; might have jeopardised the person; or required intervention to prevent it. Serious adverse events correspond approximately to grade III or above of the Clavien‐Dindo classification ‐ the only validated system for classifying postoperative complications (Dindo 2004; Clavien 2009;Table 5). In cases where the authors did not classify the severity of adverse events, we followed the criteria provided in Table 5 to classify the severity. We analysed the following information.
-
Proportion of participants experiencing serious adverse events.
-
Number of serious adverse events.
-
Proportion of participants experiencing adverse events.
-
Number of adverse events.
-
-
Quality of life as defined in the included trials.
-
Short‐term (30 days, three months).
-
Long‐term (longest follow‐up).
-
| Grades | Definitions | Examples |
| I | Any deviation from the normal postoperative course without the need for pharmacological treatment or surgical, endoscopic, or radiological interventions | Drugs such as antiemetics, antipyretics, analgesics, diuretics, and electrolytes; physiotherapy; wound infections opened at the bedside |
| II | Requiring pharmacological treatment with drugs other than those allowed for grade I complications | Blood transfusions, total parenteral nutrition |
| III | Requiring surgical, endoscopic, or radiological intervention | Bile leak requiring endoscopic stent; re‐operation for any cause; drainage of infected intra‐abdominal collection |
| IV | Life‐threatening complication requiring high dependency or intensive care management | Dialysis |
| V | Death of patient | — |
| Suffix d | If the patient suffers from a complication at the time of discharge and needs further follow‐up to evaluate the complication fully | — |
Adapted from Dindo 2004; Clavien 2009.
Secondary outcomes
-
Blood transfusion requirements.
-
Number of participants who required red blood cells or whole blood heterologous blood transfusion.
-
Quantity of blood transfusion (heterologous red blood cells or whole blood product, platelet, or fresh frozen plasma).
-
Total operative blood loss.
-
Number of participants who had major operative blood loss.
-
-
Hospital stay.
-
Length of total hospital stay (including re‐admissions).
-
Intensive therapy unit stay.
-
-
Operating time.
-
Time needed to return to work.
Search methods for identification of studies
Electronic searches
We aimed to identify all relevant randomised clinical trials regardless of language or publication status (published, unpublished, in press, or in progress) (Royle 2003).
We searched the following databases up to 23 September 2015.
-
The Cochrane Central Register of Controlled Trials (CENTRAL; 2015, Issue 9) in the Cochrane Library.
-
MEDLINE via PubMed (from 1947).
-
EMBASE via Ovid SP (from 1974).
-
Science Citation Index Expanded via Web of Science (from 1975).
We also searched the World Health Organization International Clinical Trials Registry Platform search portal (www.who.int/ictrp), which searches various trial registers, including ISRCTN and ClinicalTrials.gov, to identify further trials (searched 23 September 2015). Because existing Cochrane systematic reviews have comprehensively assessed subsets of all available interventions on this topic, we also used these reviews as a way to identify trials(Gurusamy 2009a; Gurusamy 2009b). We present full search strategies in Appendix 1.
Searching other resources
We searched the references of the identified trials for additional trials eligible for inclusion.
Data collection and analysis
Selection of studies
Two review authors (EM and KG) independently screened the titles and abstracts of all records retrieved. We sought full text for any references that at least one of the authors identified as potentially eligible. We assessed the full text for inclusion and listed the reasons for the excluding trials in the Characteristics of excluded studies tables. We listed any ongoing trials in Characteristics of ongoing studies for further follow‐up in updates of the reviews. We resolved discrepancies through discussion.
Data extraction and management
Two review authors (KG and EM) independently extracted the following data.
-
Year and language of publication.
-
Country in which investigators recruited the participants.
-
Year(s) in which the trial took place.
-
Inclusion and exclusion criteria.
-
Participant characteristics such as age, sex, underlying disease, comorbidity, number and proportion of participants with cirrhosis, and number and proportion of participants undergoing major versus minor liver resection.
-
Details of the intervention and treatment strategy that aimed to decrease blood loss and blood transfusion requirements (e.g. surgical technique, procedure and co‐intervention, concurrent surgery, and medications).
-
Outcomes (Primary outcomes; Secondary outcomes).
-
Follow‐up time points.
-
Risk of bias (Assessment of risk of bias in included studies).
We sought unclear or missing information by contacting the authors of the individual trials. If there had been any doubt whether trials shared the same participants – completely or partially (by identifying common authors and centres) – we would have contacted the authors of the trials to clarify whether the trial report was duplicated. We resolved any differences in opinion through discussion.
Assessment of risk of bias in included studies
We followed the guidance in the Cochrane Handbook for Systematic Reviews of Intervention and those described in the Cochrane Hepato‐Biliary Group Module to assess the risk of bias in included studies (Higgins 2011; Gluud 2013). Specifically, we assessed the risk of bias in included trials for the following domains (Schulz 1995; Moher 1998; Kjaergard 2001; Wood 2008; Lundh 2012; Savovic 2012a; Savovic 2012b).
Allocation sequence generation
-
Low risk of bias: sequence generation was achieved using computer random number generation or a random number table. Drawing lots, tossing a coin, shuffling cards, and throwing dice were adequate if an independent adjudicator performed them.
-
Uncertain risk of bias: authors described the trial as randomised but did not specify the method of sequence generation.
-
High risk of bias: the sequence generation method was not, or may not have been, random. Quasi‐randomised studies (those using dates, names, or admittance numbers to allocate participants) were inadequate, and we excluded them for the assessment of benefits butof harms.
Allocation concealment
-
Low risk of bias: allocation was controlled by a central and independent randomisation unit and involved sequentially numbered, opaque, sealed envelopes, or something similar, so that neither participants nor investigators could have foreseen intervention allocations in advance of or during enrolment.
-
Uncertain risk of bias: authors described the trial as randomised but did not describe the method used to conceal the allocation, so participants or operators may have been able to foresee intervention allocations in advance of, or during, enrolment.
-
High risk of bias: the investigators who assigned participants were aware of the allocation sequence, or the study was quasi‐randomised. We excluded quasi‐randomised studies for assessment of benefits but not of harms.
Blinding of participants and personnel
-
Low risk of bias: blinding was performed adequately, or the outcome measurement was not likely to be influenced by lack of blinding.
-
Uncertain risk of bias: information was insufficient to allow assessment of whether the type of blinding used was likely to induce bias on the estimate of effect.
-
High risk of bias: no blinding or incomplete blinding and the outcome or the outcome measurements were likely to be influenced by lack of blinding.
Blinding of outcome assessors
-
Low risk of bias: blinding was performed adequately, or the outcome measurement was not likely to be influenced by lack of blinding.
-
Uncertain risk of bias: information was insufficient to allow assessment of whether the type of blinding used was likely to induce bias on the estimate of effect.
-
High risk of bias: no blinding or incomplete blinding and the outcome or the outcome measurements were likely to be influenced by lack of blinding.
Incomplete outcome data
-
Low risk of bias: the underlying reasons for missing data were unlikely to make treatment effects depart from plausible values, or proper methods were employed to handle missing data.
-
Uncertain risk of bias: information was insufficient to allow assessment of whether the missing data mechanism in combination with the method used to handle missing data was likely to induce bias on the estimate of effect.
-
High risk of bias: the crude estimate of effects (e.g. complete case estimate) were clearly biased because of the underlying reasons for missing data, and the methods used to handle missing data were unsatisfactory.
Selective outcome reporting
-
Low risk of bias: authors reported pre‐defined or clinically relevant and reasonably expected outcomes (mortality and serious adverse events).
-
Uncertain risk of bias: authors did not fully report all pre‐defined or clinically relevant and reasonably expected outcomes, or it was unclear whether authors recorded data on these outcomes.
-
High risk of bias: authors failed to report one or more clinically relevant and reasonably expected outcomes; data on these outcomes were likely to have been recorded.
Vested interest bias
-
Low risk of bias: a party with no vested interests in the outcome (i.e. a party that would not benefit from the results of the trial) conducted the trial.
-
Uncertain risk of bias: it was not clear if those conducting the trial had a vested interest in its outcome.
-
High risk of bias: a party with vested interests in the outcome of the trial (such as a drug manufacturer) conducted the trial.
We considered a trial to be at low risk of bias if we assessed it as being at low risk of bias for all domains. We considered a trial at low risk of bias for an outcome if we assessed it as being at low risk of bias for all study level domains, as well as for outcome‐specific domains (e.g. blinding, incomplete outcome data). Otherwise, we considered trials with uncertain or high risk of bias regarding one or more domains to be trials at high risk of bias.
Measures of treatment effect
For dichotomous variables (short‐term mortality, serious adverse events, participants requiring blood transfusion), we calculated the odds ratio (OR) with 95% credible interval (CrI). For continuous variables, such as quantity of blood transfused, blood loss, hospital stay, and operating time, we calculated the mean difference (MD) with 95% CrI. When trials reported the blood transfusion as mL or L rather than units, we converted these into units by considering that each unit of whole blood or red blood cell transfusion was 400 mL and each unit of fresh frozen plasma was 250 mL. We planned to use MD and 95% CrI for time needed to return to work, but we did not use this because none of the included trials reported this outcome. We planned to use standardised mean difference (SMD) with 95% CrI for quality of life if trials used different scales, but we did not plan to combine the quality of life at different time points. For time‐to‐event data, such as long‐term survival, we planned to use the hazard ratio (HR) with 95% CrI.
Relative ranking
We estimated the probabilities for each intervention of being at each possible rank. Then we obtained a treatment hierarchy using the probability of each intervention being the best treatment by using the surface under the cumulative ranking curve (SUCRA) (Salanti 2011).
Unit of analysis issues
The unit of analysis was the person undergoing elective liver resection according to the intervention group to which they were randomly assigned.
Dealing with missing data
We performed an intention‐to‐treat analysis whenever possible (Newell 1992). Otherwise, we used data that were available to us (e.g. a trial may have reported only per protocol analysis results). As per protocol analyses may be biased, we planned to conduct best‐worst case scenario and worst‐best case scenario analyses as sensitivity analyses, if there was a possibility that authors could have judged a treatment as effective because of attrition bias.
For continuous outcomes, we imputed the standard deviation from P values according to guidance in the Cochrane Handbook for Systematic Reviews of Intervention (Higgins 2011). If the data were likely to be normally distributed and the mean was not available, we used the median for meta‐analysis. If it was not possible to calculate the standard deviation from the P value or the confidence intervals, we imputed the standard deviation using the largest standard deviation in other trials for that outcome. This form of imputation may decrease the weight of the study for calculation of mean differences and may bias the effect estimate to no effect for calculation of SMDs (Higgins 2011).
Assessment of heterogeneity
We assessed clinical and methodological heterogeneity by carefully examining the characteristics and design of included trials. Major sources of clinical heterogeneity included cirrhotic compared to non‐cirrhotic livers and major compared to minor liver resections. In addition, we anticipated considerable heterogeneity in the way the intervention was performed. For example, surgeons may perform intermittent portal triad clamping with different time periods of occlusion and non‐occlusion. In addition, they may use different doses of fibrin sealant. Different study design and risk of bias may contribute to methodological heterogeneity.
We used the residual deviance and Deviance Information Criteria (DIC) for assessing between‐study heterogeneity as per the guidance from the National Institute for Health and Care Excellence (NICE) Decision Support Unit (DSU) Technical Support Documents (Dias 2012b; Dias 2013a). We also calculated the between‐trial standard deviation and reported this if we used a random‐effects model. See Data synthesis for further details regarding residual deviance, DIC, and choice of model.
If we identified substantial heterogeneity ‐ clinical, methodological, or statistical ‐ we planned to explore and address it in a subgroup analysis (see section on Subgroup analysis and investigation of heterogeneity).
Assessment of reporting biases
We planned to use visual asymmetry on a funnel plot to explore reporting bias in case at least 10 trials were included for the outcome (Egger 1997; Macaskill 2001). In the presence of heterogeneity that we could explain by subgroup analysis, we planned to perform the funnel plot for each subgroup in the presence of the adequate number of trials. We planned to perform the linear regression approach described by Egger 1997 to determine the funnel plot asymmetry in the presence of at least 10 trials for the direct comparison. However, we did not perform this because there were not enough trials.
We also considered selective reporting as evidence of reporting bias.
Data synthesis
We applied classifications described in Table 1, Table 2, Table 3, and Table 4 to categorise cardiopulmonary interventions, parenchymal transection methods, methods of dealing with cut surface, and different vascular occlusion methods. Each category in the table is broadly defined to encompass a relatively homogeneous group of interventions, although we noted variations in the way each method is carried out. For example, surgeons may perform intermittent portal triad clamping with different time periods of occlusion and non‐occlusion. We categorised them under intermittent portal triad clamping regardless of the time intervals. Likewise, we did not distinguish different maximum periods for continuous vascular occlusion (Clavien 1996). These practice variations might be a source of heterogeneity; however, evidence was insufficient to suggest that they could affect the outcome. For the comparisons of anterior approach versus conventional approach and autologous blood donation versus control, there are only two treatments for each comparison. For pharmacological interventions, we treated each pharmacological treatment as a separate category.
In liver resection, a surgeon typically uses one item each from Table 1, Table 2, Table 3, and Table 4. Liver resection is usually performed using conventional approach without autologous blood donation or any pharmacological agent. Compared to the previous version of the review (Simillis 2014), where we considered a combination of one method each from Table 2, Table 3, and Table 4 as a treatment strategy, in this review, we considered each of these interventions (different methods of cardiopulmonary interventions, parenchymal transection methods, methods of dealing with raw surface, vascular occlusion methods, and pharmacological interventions) as separate networks. This approach was in response to the lack of information on the details of co‐interventions in the trials and the design of the trials, which limited the number of trials included in the previous analysis. In many of the trials, the surgeons involved were allowed to choose their method of liver resection apart from the factor being randomised, based on the assumption that the factors are independent of each other (i.e. there is no interaction between the factors, or the choice of one factor is independent of the choice of other factors). There is no evidence to support or refute this assumption. However, if we had included only trials that reported all the intervention variables adequately, and none were left to the choice of the surgeons, this would have resulted in inclusion of fewer trials than the previous version, as we have now included all the interventions aimed at decreasing blood loss and blood transfusion requirements during liver resection.
Direct comparison
We performed pair‐wise meta‐analyses using WinBUGS by Bayesian analysis using the same codes and methods described immediately below in the network meta‐analysis section (i.e. same burn‐in, number of simulations, choice of initial values, and choice of models). In addition, we performed the meta‐analysis using frequentist methods with Review Manager 5 (RevMan 2014), in accordance with recommendations of Higgins 2011 and those described in the Cochrane Hepato‐Biliary Group Module (Gluud 2013). For frequentist analyses, we presented the results of the model that was used for Bayesian analysis (which was determined by the model fit).
Network meta‐analysis
We conducted network meta‐analyses to compare multiple interventions simultaneously for each of the outcomes listed in the Types of outcome measures section. Network meta‐analysis combines direct evidence within trials and indirect evidence across trials (Mills 2012).
We obtained a network plot to ensure that the trials were connected by treatments using Stata/IC 11 (StataCorp LP). We performed a network meta‐analysis only when it was possible to compare the direct and indirect estimates. This is because one cannot assess whether there is consistency between the direct and indirect estimates unless both are available. We planned to exclude any trials that were not connected to the network. We conducted a Bayesian network meta‐analysis using the Markov chain Monte Carlo method in WinBUGS 1.4. We modelled the treatment contrast (e.g. log OR for binary outcomes, MD for continuous outcomes) for any two interventions ('functional parameters') as a function of comparisons between each individual intervention and an arbitrarily selected reference group ('basic parameters') (Lu 2006). We used inconsistency models to assess this consistency assumption (Dias 2013e). The reference groups selected for the different comparisons are as follows.
-
Anterior approach versus conventional approach: conventional approach.
-
Autologous blood donation versus control: inactive control.
-
Cardiopulmonary interventions: inactive control.
-
Methods of parenchymal transection: clamp‐crush method.
-
Methods of dealing with raw surface: inactive control.
-
Methods of vascular occlusion: no vascular occlusion.
-
Pharmacological interventions: inactive control.
We performed the network analysis as per the guidance from the NICE DSU documents (Dias 2013a; Dias 2013c). Further details of the codes used, the raw data, and the technical details of how we performed the analysis are in Appendix 2, Appendix 3, and Appendix 4. We tested the codes on simulated data (Appendix 5) using predetermined effect estimates with no inconsistency between direct and indirect comparisons. This simulation testing demonstrated that the codes produced similar effect estimates as the predetermined effect estimates (allowing for some variability because of simulation) and that the effect estimates obtained using these codes were almost identical to the effect estimates obtained by direct estimates using RevMan (Appendix 6).
The codes allow handling of trials with multiple arms to be dealt in the same way as two‐armed trials, that is, one can enter the data from all the intervention arms in a trial as number of events and the number of people exposed to the event for binary outcomes; for continuous outcomes, one can enter the mean and standard error for all intervention arms in the trial. The choice between the fixed‐effect model and random‐effects model was based on the model fit as per the guidelines of the NICE TSU (a difference of three to five for deviance information criterion (DIC)) is important (Dias 2013a; Dias 2013c); we used a difference of three as important). We reported the treatment contrasts (i.e. log ORs for binary outcomes and MDs for continuous outcomes) of the different treatments in relation to the reference treatment, the deviance residuals, the number of effective parameters, and DIC for the fixed‐effect model and random‐effects model for each outcome. We also reported the parameters used to assess the model fit (i.e. deviance residuals, number of effective parameters, and DIC) for the inconsistency model in Table 6, Table 7, and Table 8.
| Blood transfusion (red blood cell) (units) | |||
| Treatment number | Treatment name | ||
| 1 | Control | ||
| 2 | Acute normovolemic haemodilution | ||
| 3 | Acute normovolemic haemodilution plus hypotension | ||
| 4 | Acute normovolemic haemodilution plus low central venous pressure | ||
| 5 | Low central venous pressure | ||
| Fixed‐effect model | Random‐effects model | Inconsistency model | |
| Dbara | 2.68 | −8.90 | −9.80 |
| pDb | 10.05 | 12.67 | 11.96 |
| DICc | 12.73 | 3.77 | 2.17 |
| d[2]d | −1.23 (95% CrI −1.74 to −0.73) | −1.26 (95% CrI −4.92 to 2.39) | — |
| d[3]e | −1.65 (95% CrI −2.06 to −1.25) | −1.68 (95% CrI −5.33 to 1.98) | — |
| d[4]f | 0.15 (95% CrI −0.10 to 0.40) | −0.57 (95% CrI −3.35 to 1.88) | — |
| d[5]g | −0.81 (95% CrI −1.33 to −0.30) | −1.08 (95% CrI −3.43 to 1.13) | — |
| Between‐study standard deviation | — | 1.446 | |
| Model used | Random‐effects model | ||
| Evidence of inconsistency | There is no evidence of inconsistency since the difference in DIC between consistency and inconsistency models was not significant. | ||
| Blood loss (litres) | |||
| Treatment number | Treatment name | ||
| 1 | Control | ||
| 2 | Acute normovolemic haemodilution | ||
| 3 | Acute normovolemic haemodilution plus hypotension | ||
| 4 | Acute normovolemic haemodilution plus low central venous pressure | ||
| 5 | Hypoventilation | ||
| 6 | Low central venous pressure | ||
| Fixed‐effect model | Random‐effects model | Inconsistency model | |
| Dbara | −24.73 | −36.06 | −36.65 |
| pDb | 14.00 | 17.77 | 18.26 |
| DICc | −10.73 | −18.29 | −18.39 |
| d[2]d | 0.00 (95% CrI −0.10 to 0.10) | 0.00 (95% CrI −0.95 to 0.96) | — |
| d[3]e | −0.25 (95% CrI −0.37 to −0.13) | −0.25 (95% CrI −1.20 to 0.71) | — |
| d[4]f | 0.01 (95% CrI −0.04 to 0.07) | −0.10 (95% CrI −0.88 to 0.46) | — |
| d[5]g | 0.00 (95% CrI −1.12 to 1.12) | −0.01 (95% CrI −1.44 to 1.43) | — |
| d[6]h | −0.29 (95% CrI −0.40 to −0.18) | −0.32 (95% CrI −0.86 to 0.09) | — |
| Between‐study standard deviation | — | 0.3734 | — |
| Model used | Random‐effects model | ||
| Evidence of inconsistency | There is no evidence of inconsistency since the difference in DIC between consistency and inconsistency models was not significant. | ||
aDbar = posterior mean of deviance.
bpD = effective number of parameters.
cDIC = deviance information criterion.
dd[2] indicates effect estimate (mean difference) of treatment 2 versus treatment 1.
ed[3] indicates effect estimate (mean difference) of treatment 3 versus treatment 1.
fd[4] indicates effect estimate (mean difference) of treatment 4 versus treatment 1.
gd[5] indicates effect estimate (mean difference) of treatment 5 versus treatment 1.
hd[6] indicates effect estimate (mean difference) of treatment 6 versus treatment 1.
| Adverse events (proportion) | |||
| Treatment number | Treatment name | ||
| 1 | Clamp‐crush method | ||
| 2 | Cavitron ultrasonic surgical aspirator | ||
| 3 | Hydrojet | ||
| 4 | Radiofrequency dissecting sealer | ||
| 5 | Sharp transection method | ||
| 6 | Stapler | ||
| Fixed‐effect model | Random‐effects model | Inconsistency model* | |
| Dbara | 95.62 | 80.26 | 81.67 |
| pDb | 13.05 | 17.04 | 16.71 |
| DICc | 108.67 | 97.30 | 98.37 |
| d[2]d | 0.32 (95% CrI −0.28 to 0.92) | 0.76 (95% CrI −2.18 to 4.69) | — |
| d[3]e | −0.99 (95% CrI −2.76 to 0.54) | −0.56 (95% CrI −6.84 to 6.60) | — |
| d[4]f | 0.11 (95% CrI −0.46 to 0.68) | 0.19 (95% CrI −2.95 to 3.50) | — |
| d[5]g | 0.10 (95% CrI −0.79 to 1.00) | 0.1 (95% CrI −5.59 to 5.80) | — |
| d[6]h | 0.06 (95% CrI −0.63 to 0.76) | 0.06 (95% CrI −5.59 to 5.76) | — |
| Between‐study standard deviation | — | 2.436 | — |
| Model used | Random‐effects model | ||
| Evidence of inconsistency | There is no evidence of inconsistency since the difference in DIC between consistency and inconsistency models was not significant. | ||
| Adverse events (number) | |||
| Treatment number | Treatment name | ||
| 1 | Clamp‐crush method | ||
| 2 | Cavitron ultrasonic surgical aspirator | ||
| 3 | Hydrojet | ||
| 4 | Radiofrequency dissecting sealer | ||
| 5 | Sharp transection method | ||
| 6 | Stapler | ||
| Fixed‐effect model | Random‐effects model | Inconsistency model* | |
| Dbara | 80.99 | 80.94 | 79.59 |
| pDb | 11.93 | 11.88 | 14.76 |
| DICc | 92.92 | 92.83 | 94.35 |
| d[2]d | 0.47 (95% CrI −0.08 to 1.03) | 0.47 (95% CrI −0.08 to 1.03) | — |
| d[3]e | 0.34 (95% CrI −0.71 to 1.29) | 0.33 (95% CrI −0.71 to 1.28) | — |
| d[4]f | 0.61 (95% CrI 0.12 to 1.12) | 0.61 (95% CrI 0.12 to 1.11) | — |
| d[5]g | 0.12 (95% CrI −0.56 to 0.81) | 0.12 (95% CrI −0.56 to 0.81) | — |
| d[6]h | 0.62 (95% CrI −0.21 to 1.48) | 0.62 (95% CrI −0.20 to 1.45) | — |
| Between‐study standard deviation | — | 2.499 | — |
| Model used | Fixed‐effect model | — | |
| Evidence of inconsistency | There is no evidence of inconsistency since the difference in DIC between consistency and inconsistency models was not significant. | ||
| Blood transfusion (proportion) | |||
| Treatment number | Treatment name | ||
| 1 | Clamp‐crush method | ||
| 2 | Cavitron ultrasonic surgical aspirator | ||
| 3 | Hydrojet | ||
| 4 | Radiofrequency dissecting sealer | ||
| 5 | Sharp transection method | ||
| Fixed‐effect model | Random‐effects model | Inconsistency model* | |
| Dbara | 72.41 | 71.86 | 72.23 |
| pDb | 11.91 | 13.99 | 14.98 |
| DICc | 84.33 | 85.85 | 87.21 |
| d[2]d | 0.39 (95% CrI −0.62 to 1.42) | 0.42 (95% CrI −1.09 to 1.96) | — |
| d[3]e | 0.55 (95% CrI −0.75 to 1.83) | 0.60 (95% CrI −1.47 to 2.83) | — |
| d[4]f | 0.09 (95% CrI −0.50 to 0.68) | 0.14 (95% CrI −0.77 to 1.32) | — |
| d[5]g | −0.22 (95% CrI −1.16 to 0.71) | −0.22 (95% CrI −2.21 to 1.75) | — |
| Between‐study standard deviation | — | 0.6464 | — |
| Model used | Fixed‐effect model | — | |
| Evidence of inconsistency | There is no evidence of inconsistency since the difference in DIC between consistency and inconsistency models was not significant. | ||
aDBar = posterior mean of deviance.
bpD = effective number of parameters.
cDIC = deviance information criterion.
dd[2] indicates log transformed effect estimate (odds ratio or rate ratio) of treatment 2 versus treatment 1.
ed[3] indicates log transformed effect estimate (odds ratio or rate ratio) of treatment 3 versus treatment 1.
fd[4] indicates log transformed effect estimate (odds ratio or rate ratio) of treatment 4 versus treatment 1.
gd[5] indicates log transformed effect estimate (odds ratio or rate ratio) of treatment 5 versus treatment 1.
hd[6] indicates log transformed effect estimate (odds ratio or rate ratio) of treatment 6 versus treatment 1.
| Serious adverse events (proportion) | |||
| Treatment number | Treatment name | ||
| 1 | Control | ||
| 2 | ConHVE | ||
| 3 | ConPTC | ||
| 4 | ConSelectiveHVE | ||
| 5 | ConSelectivePTC | ||
| 6 | IntPTC | ||
| Fixed‐effect model | Random‐effects model | Inconsistency model | |
| Dbara | 64.25 | 63.57 | 64.03 |
| pDb | 12.54 | 14.37 | 14.83 |
| DICc | 76.79 | 77.95 | 78.86 |
| d[2]d | 0.82 (95% CrI −1.70 to 3.50) | 0.62 (95% CrI −5.00 to 5.89) | — |
| d[3]e | 0.35 (95% CrI −1.26 to 1.96) | 0.16 (95% CrI −3.87 to 3.71) | — |
| d[4]f | −1.98 (95% CrI −8.24 to 1.48) | −2.25 (95% CrI −9.99 to 3.38) | — |
| d[5]g | −0.63 (95% CrI −2.29 to 0.97) | −1.01 (95% CrI −5.35 to 2.36) | — |
| d[6]h | 0.15 (95% CrI −0.61 to 0.92) | −0.07 (95% CrI −2.53 to 1.85) | — |
| Between‐study standard deviation | — | 1.216 | — |
| Model used | Fixed‐effect model | ||
| Evidence of inconsistency | There is no evidence of inconsistency since the difference in DIC between consistency and inconsistency models was not significant. | ||
| Adverse events (proportion) | |||
| Treatment number | Treatment name | ||
| 1 | Control | ||
| 2 | ConHVE | ||
| 3 | ConPTC | ||
| 4 | ConSelectiveHVE | ||
| 5 | ConSelectivePTC | ||
| 6 | IntPTC | ||
| 7 | IntSelectivePTC | ||
| Fixed‐effect model | Random‐effects model | Inconsistency model | |
| Dbara | 120.82 | 118.76 | 119.07 |
| pDb | 18.10 | 21.01 | 21.93 |
| DICc | 138.92 | 139.77 | 141.00 |
| d[2]d | 0.95 (95% CrI −0.21 to 2.12) | 0.90 (95% CrI −1.12 to 2.84) | — |
| d[3]e | 0.83 (95% CrI 0.00 to 1.69) | 0.78 (95% CrI −0.58 to 2.09) | — |
| d[4]f | 0.05 (95% CrI −1.19 to 1.27) | 0.00 (95% CrI −2.05 to 1.96) | — |
| d[5]g | 0.10 (95% CrI −0.81 to 1.01) | 0.07 (95% CrI −1.42 to 1.50) | — |
| d[6]h | 0.24 (95% CrI −0.19 to 0.68) | 0.18 (95% CrI −0.66 to 0.88) | — |
| d[7]i | 0.09 (95% CrI −0.75 to 0.93) | 0.04 (95% CrI −1.37 to 1.35) | — |
| Between‐study standard deviation | — | 0.4825 | — |
| Model used | Fixed‐effect model | ||
| Evidence of inconsistency | There is no evidence of inconsistency since the difference in DIC between consistency and inconsistency models was not significant. | ||
| Blood transfusion (proportion) | |||
| Treatment number | Treatment name | ||
| 1 | Control | ||
| 2 | ConHVE | ||
| 3 | ConPTC | ||
| 4 | ConSelectiveHVE | ||
| 5 | ConSelectivePTC | ||
| 6 | IntPTC | ||
| 7 | IntSelectivePTC | ||
| Fixed‐effect model | Random‐effects model | Inconsistency model | |
| Dbara | 139.87 | 120.00 | 120.10 |
| pDb | 19.04 | 25.25 | 25.72 |
| DICc | 158.91 | 145.25 | 145.82 |
| d[2]d | −2.55 (95% CrI −3.80 to −1.36) | −2.88 (95% CrI −7.47 to 1.47) | — |
| d[3]e | −0.77 (95% CrI −1.56 to 0.01) | −1.11 (95% CrI −3.72 to 1.28) | — |
| d[4]f | −1.46 (95% CrI −2.58 to −0.36) | −1.79 (95% CrI −6.38 to 2.53) | — |
| d[5]g | −0.26 (95% CrI −1.18 to 0.67) | −0.48 (95% CrI −3.83 to 2.72) | — |
| d[6]h | −0.34 (95% CrI −0.84 to 0.16) | −0.47 (95% CrI −2.32 to 1.28) | — |
| d[7]i | −0.92 (95% CrI −1.96 to 0.08) | −0.97 (95% CrI −4.24 to 2.24) | — |
| Between study standard deviation | — | 1.613 | — |
| Model used | Random‐effects model | ||
| Evidence of inconsistency | There is no evidence of inconsistency since the difference in DIC between consistency and inconsistency models was not significant. | ||
| Blood transfusion (red blood cell) (units) | |||
| Treatment number | Treatment name | ||
| 1 | Control | ||
| 2 | ConHVE | ||
| 3 | ConPTC | ||
| 4 | ConSelectiveHVE | ||
| 5 | ConSelectivePTC | ||
| 6 | IntPTC | ||
| 7 | IntSelectivePTC | ||
| Fixed‐effect model | Random‐effects model | Inconsistency model | |
| Dbara | −1.55 | −1.05 | 0.24 |
| pDb | 15.99 | 17.36 | 19.34 |
| DICc | 14.44 | 16.32 | 19.58 |
| d[2]d | −1.65 (95% CrI −3.96 to 0.67) | −1.56 (95% CrI −4.18 to 1.14) | — |
| d[3]e | −1.25 (95% CrI −2.39 to −0.10) | −1.18 (95% CrI −2.54 to 0.31) | — |
| d[4]f | −2.45 (95% CrI −4.08 to −0.82) | −2.37 (95% CrI −4.33 to −0.30) | — |
| d[5]g | −1.45 (95% CrI −2.59 to −0.31) | −1.41 (95% CrI −2.86 to 0.12) | — |
| d[6]h | −1.36 (95% CrI −2.48 to −0.23) | −1.35 (95% CrI −2.69 to 0.01) | — |
| d[7]i | −1.43 (95% CrI −2.61 to −0.24) | −1.43 (95% CrI −3.01 to 0.08) | — |
| Between‐study standard deviation | — | 0.3149 | — |
| Model used | Fixed‐effect model | ||
| Evidence of inconsistency | There is no evidence of inconsistency since the difference in DIC between consistency and inconsistency models was not significant. | ||
| Blood loss (litres) | |||
| Treatment number | Treatment name | ||
| 1 | Control | ||
| 2 | ConHVE | ||
| 3 | ConPTC | ||
| 4 | ConSelectiveHVE | ||
| 5 | ConSelectivePTC | ||
| 6 | IntPTC | ||
| 7 | IntSelectivePTC | ||
| Fixed‐effect model | Random‐effects model | Inconsistency model | |
| Dbara | −45.73 | −61.66 | −63.13 |
| pDb | 22.01 | 29.37 | 30.58 |
| DICc | −23.72 | −32.29 | −32.55 |
| d[2]d | −0.36 (95% CrI −0.50 to −0.23) | −0.37 (95% CrI −0.94 to 0.22) | — |
| d[3]e | −0.02 (95% CrI −0.12 to 0.07) | −0.14 (95% CrI −0.52 to 0.14) | — |
| d[4]f | −0.27 (95% CrI −0.54 to −0.01) | −0.39 (95% CrI −1.16 to 0.27) | — |
| d[5]g | 0.09 (95% CrI −0.04 to 0.21) | 0.00 (95% CrI −0.57 to 0.45) | — |
| d[6]h | 0.01 (95% CrI −0.05 to 0.07) | −0.06 (95% CrI −0.39 to 0.17) | — |
| d[7]i | 0.00 (95% CrI −0.21 to 0.2) | −0.18 (95% CrI −0.84 to 0.30) | — |
| Between‐study standard deviation | — | 0.2539 | — |
| Model used | Random‐effects model | ||
| Evidence of inconsistency | There is no evidence of inconsistency since the difference in DIC between consistency and inconsistency models was not significant. | ||
| Con: continuous; Int: intermittent; HVE: hepatic vascular exclusion; PTC: portal triad clamping. | |||
aDBar = posterior mean of deviance.
bpD = effective number of parameters.
cDIC = deviance information criterion.
dd[2] indicates effect estimate (mean difference) of treatment 2 versus treatment 1.
ed[3] indicates effect estimate (mean difference) of treatment 3 versus treatment 1.
fd[4] indicates effect estimate (mean difference) of treatment 4 versus treatment 1.
gd[5] indicates effect estimate (mean difference) of treatment 5 versus treatment 1.
hd[6] indicates effect estimate (mean difference) of treatment 6 versus treatment 1.
id[7] indicates effect estimate (mean difference) of treatment 7 versus treatment 1.
We reported estimates of treatment effects (ORs for binary outcomes, MDs for continuous outcomes, and rate ratios for count outcomes). We calculated the 95% credible intervals of treatment effects (e.g. odd ratios for binary outcomes, mean differences for continuous outcomes, and so on) in the Bayesian meta‐analysis and indicate that the average effect in the population lies within the credible intervals with 95% probability. We used the posterior median as the point estimate of treatment effect, the posterior 2.5 percentile as the lower bounds of its 95% credible interval, and the 97.5 percentile as the upper bounds, and we reported the effect estimates and associated 95% credible intervals for each pair‐wise comparison in a table. We presented these in Table 9, Table 10, and Table 11. We also presented the cumulative probability of the treatment ranks (i.e. the probability that the treatment is within the top two, top three, etc.) in SUCRA graphs (Salanti 2011). We also plotted the probability of each rank for each treatment (rankograms), which are generally considered more informative (Salanti 2011; Dias 2012a; Dias 2013b).
| Blood transfusion (red blood cell) (units) | ||||
| Acute normovolemic haemodilution | Acute normovolemic haemodilution plus hypotension | Acute normovolemic haemodilution plus low central venous pressure | Low central venous pressure | |
| Control | MD −1.26; 95% CrI −4.92 to 2.39 | MD −1.68; 95% CrI −5.33 to 1.98 | MD −0.57; 95% CrI −3.35 to 1.88 | MD −1.08; 95% CrI −3.43 to 1.13 |
| Acute normovolemic haemodilution | — | MD −0.42; 95% CrI −5.59 to 4.75 | MD 0.69; 95% CrI −3.80 to 5.18 | MD 0.18; 95% CrI −4.12 to 4.49 |
| Acute normovolemic haemodilution plus hypotension | — | — | MD 1.11; 95% CrI −3.39 to 5.60 | MD 0.60; 95% CrI −3.71 to 4.91 |
| Acute normovolemic haemodilution plus low central venous pressure | — | — | — | MD −0.51; 95% CrI −3.97 to 2.96 |
| Blood loss (litres) | ||||
| Acute normovolemic haemodilution | Acute normovolemic haemodilution plus hypotension | Acute normovolemic haemodilution plus low central venous pressure | Hypoventilation | |
| Control | MD 0.00; 95% CrI −0.95 to 0.96 | MD −0.25; 95% CrI −1.20 to 0.71 | MD −0.10; 95% CrI −0.88 to 0.46 | MD −0.01; 95% CrI −1.44 to 1.43 |
| Acute normovolemic haemodilution | — | MD −0.25; 95% CrI −1.60 to 1.10 | MD −0.11; 95% CrI −1.27 to 1.06 | MD −0.01; 95% CrI −1.73 to 1.71 |
| Acute normovolemic haemodilution plus hypotension | — | — | MD 0.14; 95% CrI −1.02 to 1.31 | MD 0.24; 95% CrI −1.48 to 1.96 |
| Acute normovolemic haemodilution plus low central venous pressure | — | — | — | MD 0.10; 95% CrI −1.49 to 1.68 |
| Hypoventilation | — | — | — | — |
aThe table provides the effect estimate of each pair‐wise comparison. To identify the effect estimate of a comparison (e.g. A versus B), look at the cell that occupies the column corresponding to treatment A and the row corresponding to treatment B. This gives the information directly. If that cell is empty (indicated by a '—', you have to look at column corresponding to treatment B and row corresponding to treatment A. You will have to take the inverse of this number (i.e. 1/number) to get the treatment effect.
bTreatment effects with evidence of difference are shown by italics (not applicable).
| Adverse events (proportion) | ||||
| Cavitron ultrasonic surgical aspirator | Hydrojet | Radiofrequency dissecting sealer | Sharp transection method | |
| Clamp‐crush method | OR 2.15; 95% CrI 0.11 to 108.74 | OR 0.57; 95% CrI 0.00 to 732.89 | OR 1.20; 95% CrI 0.05 to 33.05 | OR 1.11; 95% CrI 0.00 to 331.29 |
| Cavitron ultrasonic surgical aspirator | — | OR 0.27; 95% CrI 0.00 to 501.34 | OR 0.56; 95% CrI 0.01 to 62.38 | OR 0.52; 95% CrI 0.00 to 398.54 |
| Hydrojet | — | — | OR 2.12; 95% CrI 0.00 to 3638.36 | OR 1.94; 95% CrI 0.00 to 12959.09 |
| Radiofrequency dissecting sealer | — | — | — | OR 0.92; 95% CrI 0.00 to 638.06 |
| Sharp transection method | — | — | — | ‐ |
| Adverse events (number) | ||||
| Cavitron ultrasonic surgical aspirator | Hydrojet | Radiofrequency dissecting sealer | Sharp transection method | |
| Clamp‐crush method | rate ratio 1.60; 95% CrI 0.92 to 2.79 | rate ratio 1.40; 95% CrI 0.49 to 3.63 | rate ratio 1.84; 95% CrI 1.13 to 3.06 | rate ratio 1.13; 95% CrI 0.57 to 2.24 |
| Cavitron ultrasonic surgical aspirator | — | rate ratio 0.88; 95% CrI 0.28 to 2.75 | rate ratio 1.15; 95% CrI 0.54 to 2.42 | rate ratio 0.71; 95% CrI 0.29 to 1.71 |
| Hydrojet | — | — | rate ratio 1.31; 95% CrI 0.43 to 4.01 | rate ratio 0.81; 95% CrI 0.24 to 2.71 |
| Radiofrequency dissecting sealer | — | — | — | rate ratio 0.62; 95% CrI 0.26 to 1.44 |
| Sharp transection method | — | — | — | — |
| Blood transfusion (proportion) | ||||
| Cavitron ultrasonic surgical aspirator | Hydrojet | Radiofrequency dissecting sealer | Sharp transection method | |
| Clamp‐crush method | OR 1.48; 95% CrI 0.54 to 4.13 | OR 1.73; 95% CrI 0.47 to 6.25 | OR 1.09; 95% CrI 0.61 to 1.97 | OR 0.80; 95% CrI 0.31 to 2.03 |
| Cavitron ultrasonic surgical aspirator | — | OR 1.17; 95% CrI 0.23 to 6.05 | OR 0.74; 95% CrI 0.23 to 2.39 | OR 0.54; 95% CrI 0.14 to 2.15 |
| Hydrojet | — | — | OR 0.63; 95% CrI 0.15 to 2.61 | OR 0.46; 95% CrI 0.09 to 2.27 |
| Radiofrequency dissecting sealer | — | — | — | OR 0.73; 95% CrI 0.24 to 2.21 |
aThe table provides the effect estimate of each pair‐wise comparison. To identify the effect estimate of a comparison (e.g. A versus B), look at the cell that occupies the column corresponding to treatment A and the row corresponding to treatment B. This gives the information directly. If that cell is empty (indicated by a '—', you have to look at column corresponding to treatment B and row corresponding to treatment A. You will have to take the inverse of this number (i.e. 1/number) to get the treatment effect.
bTreatment effects with evidence of difference are shown by italics (not applicable).
| Serious adverse events (proportion) | |||||
| ConHVE | ConPTC | ConSelectiveHVE | ConSelectivePTC | IntPTC | |
| Control | OR 2.27; 95% CrI 0.18 to 33.05 | OR 1.42; 95% CrI 0.28 to 7.09 | OR 0.14; 95% CrI 0.00 to 4.37 | OR 0.53; 95% CrI 0.10 to 2.65 | OR 1.16; 95% CrI 0.54 to 2.51 |
| ConHVE | — | OR 0.63; 95% CrI 0.03 to 13.31 | OR 0.06; 95% CrI 0.00 to 15.06 | OR 0.23; 95% CrI 0.01 to 5.02 | OR 0.51; 95% CrI 0.03 to 7.68 |
| ConPTC | — | — | OR 0.10; 95% CrI 0.00 to 16.28 | OR 0.37; 95% CrI 0.04 to 3.70 | OR 0.82; 95% CrI 0.14 to 4.86 |
| ConSelectiveHVE | — | — | — | Not estimable | Not estimable |
| ConSelectivePTC | — | — | — | — | OR 2.19; 95% CrI 0.36 to 13.26 |
| Adverse events (proportion) | |||||
| ConHVE | ConPTC | ConSelectiveHVE | ConSelectivePTC | IntPTC | |
| Control | OR 2.58; 95% CrI 0.81 to 8.30 | OR 2.30; 95% CrI 1.00 to 5.41 | OR 1.06; 95% CrI 0.31 to 3.58 | OR 1.11; 95% CrI 0.45 to 2.75 | OR 1.28; 95% CrI 0.83 to 1.97 |
| ConHVE | — | OR 0.89; 95% CrI 0.21 to 3.75 | OR 0.41; 95% CrI 0.08 to 2.22 | OR 0.43; 95% CrI 0.10 to 1.88 | OR 0.49; 95% CrI 0.14 to 1.71 |
| ConPTC | — | — | OR 0.46; 95% CrI 0.10 to 2.04 | OR 0.48; 95% CrI 0.14 to 1.67 | OR 0.55; 95% CrI 0.21 to 1.43 |
| ConSelectiveHVE | — | — | — | OR 1.05; 95% CrI 0.23 to 4.84 | OR 1.21; 95% CrI 0.33 to 4.45 |
| ConSelectivePTC | — | — | — | — | OR 1.15; 95% CrI 0.42 to 3.16 |
| IntPTC | — | — | — | — | — |
| Blood transfusion (proportion) | |||||
| ConHVE | ConPTC | ConSelectiveHVE | ConSelectivePTC | IntPTC | |
| Control | OR 0.06; 95% CrI 0.00 to 4.33 | OR 0.33; 95% CrI 0.02 to 3.59 | OR 0.17; 95% CrI 0.00 to 12.59 | OR 0.62; 95% CrI 0.02 to 15.18 | OR 0.63; 95% CrI 0.10 to 3.59 |
| ConHVE | — | Not estimable | Not estimable | Not estimable | Not estimable |
| ConPTC | — | — | OR 0.51; 95% CrI 0.00 to 83.52 | Not estimable | OR 1.89; 95% CrI 0.09 to 41.17 |
| ConSelectiveHVE | — | — | — | Not estimable | Not estimable |
| ConSelectivePTC | — | — | — | — | OR 1.01; 95% CrI 0.02 to 42.32 |
| IntPTC | — | — | — | — | — |
| Blood transfusion (red blood cell) | |||||
| ConHVE | ConPTC | ConSelectiveHVE | ConSelectivePTC | IntPTC | |
| Control | MD −1.65; 95% CrI −3.96 to 0.67 | MD −1.25; 95% CrI −2.39 to −0.10 | MD −2.45; 95% CrI −4.08 to −0.82 | MD −1.45; 95% CrI −2.59 to −0.31 | MD −1.36; 95% CrI −2.48 to −0.23 |
| ConHVE | — | MD 0.40; 95% CrI −2.18 to 2.98 | MD −0.80; 95% CrI −3.64 to 2.03 | MD 0.20; 95% CrI −2.39 to 2.78 | MD 0.29; 95% CrI −2.29 to 2.86 |
| ConPTC | — | — | MD −1.20; 95% CrI −3.20 to 0.79 | MD −0.20; 95% CrI −1.82 to 1.42 | MD −0.11; 95% CrI −1.72 to 1.50 |
| ConSelectiveHVE | — | — | — | MD 1.00; 95% CrI −0.99 to 2.99 | MD 1.09; 95% CrI −0.89 to 3.07 |
| ConSelectivePTC | — | — | — | — | MD 0.09; 95% CrI −1.51 to 1.70 |
| IntPTC | — | — | — | — | — |
| Blood loss | |||||
| ‐ | ConHVE | ConPTC | ConSelectiveHVE | ConSelectivePTC | IntPTC |
| Control | MD −0.37; 95% CrI −0.94 to 0.22 | MD −0.14; 95% CrI −0.52 to 0.14 | MD −0.39; 95% CrI −1.16 to 0.27 | MD 0.00; 95% CrI −0.57 to 0.45 | MD −0.06; 95% CrI −0.39 to 0.17 |
| ConHVE | — | MD 0.23; 95% CrI −0.44 to 0.90 | MD −0.02; 95% CrI −0.94 to 0.90 | MD 0.37; 95% CrI −0.41 to 1.14 | MD 0.31; 95% CrI −0.34 to 0.95 |
| ConPTC | — | — | MD −0.25; 95% CrI −1.04 to 0.54 | MD 0.14; 95% CrI −0.47 to 0.74 | MD 0.08; 95% CrI −0.35 to 0.52 |
| ConSelectiveHVE | — | — | — | MD 0.39; 95% CrI −0.49 to 1.26 | MD 0.33; 95% CrI −0.44 to 1.10 |
| ConSelectivePTC | — | — | — | — | MD −0.06; 95% CrI −0.64 to 0.52 |
| IntPTC | — | — | — | — | — |
| Con: continuous; Int: intermittent; HVE: hepatic vascular exclusion; PTC: portal triad clamping. | |||||
aThe table provides the effect estimate of each pair‐wise comparison. To identify the effect estimate of a comparison (e.g. A versus B), look at the cell that occupies the column corresponding to treatment A and the row corresponding to treatment B. This gives the information directly. If that cell is empty (indicated by a ' —', you have to look at column corresponding to treatment B and row corresponding to treatment A. You will have to take the inverse of this number (i.e. 1/number) to get the treatment effect.
bTreatment effects with evidence of difference are shown by italics.
Sample size calculations and imprecision
To control for the risk of random errors, we interpreted the information with caution when the accrued sample size in the meta‐analysis was less than the required sample size (required information size). For calculation of the required information size, please see Appendix 7. We considered a 20% relative risk reduction as the minimal clinically important difference for binary outcomes and count outcomes. For continuous outcomes, we used or planned to use the following minimal clinically important differences: a standardised mean difference of 0.5 for health‐related quality of life, a mean difference of one unit for blood transfusion quantity, a mean difference of 500 mL for blood loss, a mean difference of one day of hospital stay and time‐to‐return to activity, and a mean difference of 15 minutes for operating time.
Subgroup analysis and investigation of heterogeneity
We planned to assess the differences in the effect estimates between the following subgroups using meta‐regression with the help of the WinBUGS code if we included a sufficient number of trials (Appendix 8). We planned to use study level co‐variates for meta‐regression.
-
Trials at low risk of bias compared to trials at
-
high risk of bias.
-
Participants with cirrhosis compared to those without cirrhosis.
-
Participants undergoing major liver resections compared to those undergoing minor liver resections.
We planned to calculate the interaction term (Dias 2012b; Dias 2013d). If the 95% credible intervals of the interaction term did not cross zero, we planned to consider this statistically significant. We did not perform any of the above because of the paucity of data.
Sensitivity analysis
We performed a sensitivity analysis when we imputed the mean, the standard deviation, or both.
Summary of findings table
We presented a 'Summary of findings' table, similar to the ones used in direct comparisons. We modified the table from the original format because of the presence of many comparisons and many outcomes. We presented only the comparisons in which there was evidence of differences with the illustrative examples. For other comparisons, we simply mentioned that there was no evidence of differences. This is to ensure that the most important information is available in the table. We provided links in the table to specific tables using more a traditional format.
In addition to this 'Summary of findings' table, we also provided the 'Summary of findings' table for network meta‐analysis in a graphical format (in the form of forest plots along with the quality of evidence), in which we used the methodology of grading the quality of evidence in network meta‐analysis suggested by the GRADE Working group (Puhan 2014). The first step was to estimate the evidence from direct and indirect effect estimates. Further steps included rating the quality of evidence from direct and indirect effect estimates, presenting the estimate combined from the direct estimate and indirect estimate, and rating the quality of the network meta‐analysis effect estimates (Puhan 2014). Although codes are available for node splitting, they resulted in numerical errors because of the data. So we calculated the direct estimates (including only the trials which compared the specific intervention and control) and indirect estimates (after removing the trials which compared the specific intervention and control).
Results
Description of studies
Results of the search
We identified 2938 references through electronic searches of CENTRAL (N = 342), MEDLINE (N = 1431), Embase (N = 445), Science Citation Index Expanded (N = 641), WHO ICTRP (N = 47), and ClinicalTrials.gov (N = 32). We excluded 893 duplicates and 1883 clearly irrelevant references through screening titles and reading abstracts. We retrieved 162 references for further assessment. We did not identify any references by scanning reference lists of the identified randomised trials. We excluded 76 references (67 studies) for the reasons listed in the Characteristics of excluded studies table. In total, 83 references for 67 completed randomised clinical trials met the inclusion criteria. Two references were for ongoing studies (Schmidt 2008; Chen 2015). We were unable to obtain one reference (Franceschi 2006). We included three studies under 'Studies awaiting classification' because there were no separate data for people who underwent liver resection, that is, the studies included a number of different surgical procedures, and information on people who underwent liver resection was not available (Chapman 2006; Bochicchio 2015; Wright 2015). This is summarised in the study flow diagram (Figure 1).

Study flow diagram.
Included studies
We describe the treatments used in the 67 randomised clinical trials in the Characteristics of included studies table and in Table 12.
| Study | Intervention | Co‐interventions | ||||||||
| Intervention | Control | Other information | Type of intervention | Vascular occlusion | Parenchymal transection method | Raw surface | Pharmacological methods | Cardiopulmonary methods | Autologous transfusion | |
| Anterior approach | Control | — | Anterior approach | Not stated | Clamp‐crush, bipolar dissecting sealer | Not stated | Not stated | Not stated | Not stated | |
| Anterior approach | Control | — | Anterior approach | Not stated | Cavitron ultrasonic surgical aspirator | Not stated | Not stated | Not stated | Not stated | |
| Autologous blood donation | Control | Note: autologous blood donation group was further randomised to recombinant erythropoietin and no erythropoietin | Autologous transfusion | Not stated | Not stated | Not stated | Not stated | Not stated | Factor being randomised | |
| Autologous blood donation | Control | Autologous blood donation: 2 units of blood were withdrawn before surgery | Autologous transfusion | Hepatic vascular exclusion | Not stated | Not stated | Not stated | Not stated | Factor being randomised | |
| Acute normovolemic haemodilution plus low central venous pressure | Control | Acute normovolemic dilution plus low central venous pressure: blood withdrawn to a target of 28% haematocrit and replaced with fluid. Target for central venous pressure was not reported | Cardiopulmonary methods | Not stated | Not stated | Not stated | Not stated | Factor being randomised | Not stated | |
| Acute normovolemic haemodilution plus low central venous pressure | Low central venous pressure | Acute normovolemic haemodilution: blood was withdrawn and replaced by colloids and crystalloids to reach a haematocrit target of 8 gm/dL. | Cardiopulmonary methods | Intermittent portal triad clamping | Not stated | Not stated | Not stated | Factor being randomised | Not stated | |
| Acute normovolemic haemodilution plus low central venous pressure | Low central venous pressure | Acute normovolemic haemodilution: blood was withdrawn and replaced by colloids to reach a haematocrit target of 24%. | Cardiopulmonary methods | Not stated | Not stated | Not stated | Not stated | Factor being randomised | Not stated | |
| Acute normovolemic haemodilution | Acute normovolemic haemodilution with hypotension | Acute normovolemic haemodilution: withdrawal of blood and replacement with fluids to maintain a target haematocrit of 30%. | Cardiopulmonary methods | Not stated | Not stated | Not stated | Not stated | Factor being randomised | Not stated | |
| Hypoventilation | Control | — | Cardiopulmonary methods | Intermittent portal triad clamping or selective occlusion | Clamp crush or cavitron ultrasonic surgical aspirator | Not stated | Not stated | Factor being randomised | None | |
| Low central venous pressure | Control | Low central venous pressure: by restricting flow from legs | Cardiopulmonary methods | Not stated | Not stated | Not stated | Not stated | Factor being randomised | Not stated | |
| Low central venous pressure | Control | Low central venous pressure: nitroglycerine | Cardiopulmonary intervention | Intermittent portal triad clamping | Not stated | Not stated | Not stated | Factor being randomised | Not stated | |
| Low central venous pressure | Control | Low central venous pressure: by inferior IVC clamping | Cardiopulmonary methods | Intermittent portal triad clamping | Cavitron ultrasonic surgical aspirator | Fibrin glue used | Not stated | Factor being randomised | Not stated | |
| Low central venous pressure | Control | Low central venous pressure: by limiting fluid, nitroglycerine, and furosemide | Cardiopulmonary methods | Varied | Clamp‐crush | Not stated | Not stated | Factor being randomised | Not stated | |
| Low central venous pressure | Low central venous pressure + acute normovolemic haemodilution. | Low central venous pressure: fluid restriction and nitroglycerine. | Cardiopulmonary methods | Not stated | Not stated | Not stated | Not stated | Factor being randomised | Not stated | |
| Stapler | Clamp‐crush method | Stapler: Autosuture EndoGIA stapler (Covidien) | Parenchumal transection | Variable | Factor being randomised | Variable | Not stated | Low central venous pressure | Not stated | |
| Cavitron ultrasonic surgical aspirator | Clamp‐crush method | — | Parenchymal transection | No vascular occlusion | Factor being randomised | Not stated | Not stated | Not stated | Not stated | |
| Cavitron ultrasonic surgical aspirator | Clamp‐crush method | — | Parenchymal transection | Intermittent total or selective portal triad clamping | Factor being randomised | Fibrin glue used | Not stated | Not stated | Not stated | |
| Cavitron ultrasonic surgical aspirator | Clamp‐crush method | Ultrasonic dissector: cavitron ultrasonic surgical aspirator. | Parenchymal transection | Intermittent portal triad clamping | Factor being randomised | Not stated | Not stated | Low central venous pressure | Not stated | |
| Cavitron ultrasonic surgical aspirator | Hydrojet | Hydrojet: Jet Cutter | Parenchymal transection | Portal triad clamping | Factor being randomised | Variable | Not stated | Not stated | Not stated | |
| Cavitron ultrasonic surgical aspirator | Stapler | Stapler: Endostapler (Covidien) | Parenchymal transection | Variable | Factor being randomised | Not stated | Not stated | Not stated | Not stated | |
| Cavitron ultrasonic surgical aspirator | Radiofrequency dissecting sealer. | Radiofrequency dissecting sealer: Tissue Link | Parenchymal transection | No vascular occlusion | Factor being randomised | Not stated | Not stated | Not stated | Not stated | |
| Radiofrequency dissecting sealer | Clamp‐crush method | Radiofrequency dissecting sealer: Ligasure | Parenchymal transection | Intermittent portal triad clamping or hemihepatic occlusion | Factor being randomised | Not stated | Not stated | Not stated | No | |
| Radiofrequency dissecting sealer | Clamp‐crush method | Radiofrequency dissecting sealer: Radionics needles | Parenchymal transection | No vascular occlusion | Factor being randomised | Not stated | Not stated | Not stated | Not stated | |
| Radiofrequency dissecting sealer | Clamp‐crush method | Radiofrequency dissecting sealer: Ligasure (Covidien) | Parenchymal transection | Not stated | Factor being randomised | No fibrin glue used | Not stated | Low central venous pressure | Not stated | |
| Radio‐frequency dissecting sealer | Clamp‐crush method | Radio‐frequency dissecting sealer: Tissue Link (Valley Lab) | Parenchymal transection | Variable | Factor being randomised | Not stated | Not stated | Not stated | Not stated | |
| Sharp transection | Clamp‐crush method | Sharp transection: using scalpel | Parenchymal transection | Selective hepatic vascular exclusion | Factor being randomised | Not stated | Not stated | Low central venous pressure | Not stated | |
| Anti‐thrombin III concentrate | Control | Anti‐thrombin concentrate: 1500 IU IV over 30 min: immediately before the operation, just before hepatic division, and immediately after operation | Pharmacological methods | Not stated | Not stated | Not stated | Factor being randomised | Not stated | Not stated | |
| Aprotinin | Control | Aprotinin: | Pharmacological methods | Intermittent portal triad clamping | Kelly clamp | Fibrin glue used | Factor being randomised | None | Not stated | |
| Desmopressin | Control | Desmopressin: 30 mcg/kg shortly after induction | Pharmacological methods | Varied | Cavitron ultrasonic surgical aspirator | Not stated | Factor being randomised | Not stated | Not stated | |
| Recombinant factor VIIa | Control | Recombinant factor VIIa: | Pharmacological methods | Mixture of methods | Not stated | No fibrin glue used | Factor being randomised | Not stated | No | |
| Recombinant factor VIIa | Control | Recombinant factor VIIa: brand not stated | Pharmacological methods | Not stated | Not stated | Not stated | Factor being randomised | Not stated | Not stated | |
| Tranexamic acid | Control | Tranexamic acid: 500 mg just before the surgery followed by 250 mg 4x/day for 3 days | Pharmacological methods | Varied | Clamp‐crush method | Not stated | Factor being randomised | Not stated | Not stated | |
| Collagen | Fibrin sealant | Collagen: Instat (Johnson & Johnson) | Raw surface | Not stated | Not stated | Factor being randomised | Not stated | Not stated | Not stated | |
| Collagen | Fibrin sealant | Collagen: Instat (Ethicon) | Raw surface | Not stated | Not stated | Factor being randomised | Not stated | Not stated | Not stated | |
| Collagen | Fibrin sealant | Collagen: Avitene (Alcon Inc). | Raw surface | Not stated | Not stated | Factor being randomised | Not stated | Not stated | Not stated | |
| Collagen | Fibrin sealant | Collagen: Sangustop fleece (Aesculap AG). | Raw surface | Not stated | A number of parenchymal transection techniques | Factor being randomised | None | Not stated | Not stated | |
| Fibrin sealant | Argon beam coagulator | Fibrin sealant: Tacchosil (Nycomed) | Raw surface | A mixture of approaches | A mixture of approaches | Factor being randomised | Not stated | Not stated | Not stated | |
| Fibrin sealant | Argon beam coagulator | Fibrin sealant: Tacchosil | Raw surface | Not stated | A mixture of approaches | Factor being randomised | Not stated | Not stated | Not stated | |
| Fibrin sealant | Control | Fibrin sealant: TISSEEL (Baxter Health Corporation) Spray; 5 mL of fibrinogen with synthetic aprotinin and 5 mL of thrombin (500 IU/mL) | Raw surface | Intermittent portal triad clamping | Different types of liver resection | Factor being randomised | Not stated | Not stated | Not stated | |
| Fibrin sealant | Control | Fibrin sealant: Quixil (Johnson & Johnson Medical) spray; 5 mL of fibrinogen and tranexamic acid and 5 mL of thrombin | Raw surface | With and without inflow occlusion | Clamp‐crush, cavitron ultrasonic surgical aspirator, electric coagulation based, combined | Factor being randomised | Not stated | Not stated | Not stated | |
| Fibrin sealant | Control | Fibrin sealant: name not available | Raw surface | Not stated | Not stated | Factor being randomised | Not stated | Not stated | Not stated | |
| Fibrin sealant | Control | Fibrin sealant: Biocol | Raw surface | Varied | Clamp‐crush method or cavitron ultrasonic surgical aspirator | Factor being randomised | Not stated | Not stated | Not stated | |
| Fibrin sealant | Gelatin | Fibrin sealant: Fibrocaps (ProFibrix) | Raw surface | Not stated | Not stated | Factor being randomised | Not stated | Not stated | Not stated | |
| Fibrin sealant | Oxidised cellulose | Fibrin sealant: Tacchosil | Raw surface | Not stated | Not stated | Factor being randomised | Not stated | Not stated | Not stated | |
| Fibrin sealant | Oxidised cellulose | Fibrin sealant: Fibrin Pad | Raw surface | Not stated | Not stated | Factor being randomised | Not stated | Not stated | Not stated | |
| Fibrin sealant | Oxidised cellulose | Fibrin sealant: Tachosil (Nycomed) | Raw surface | Varied | Not stated | Factor being randomised | Not stated | Not stated | Not stated | |
| Fibrin sealant | Oxidised cellulose | Oxidised cellulose: Surgicel (Ethicon Inc) | Raw surface | Not stated | Clamp‐crush method | Factor being randomised | Not stated | Not stated | Not stated | |
| Fibrin sealant | PlasmaJet coagulator | Fibrin sealant: fibrin glue (no further details) | Raw surface | Not stated | Cavitron ultrasonic surgical aspirator | Factor being randomised | Not stated | Not stated | Not stated | |
| Fibrin sealant plus collagen | Control | Fibrin sealant spray: Tissucol | Raw surface | Intermittent portal triad or selective clamping | Cavitron ultrasonic surgical aspirator | Factor being randomised | Not stated | Not stated | Not stated | |
| Continuous portal triad clamping | Continuous hepatic vascular exclusion | Hepatic vascular exclusion by encircling the entire retrohepatic inferior vena cava | Vascular occlusion | Factor being randomised | Clamp‐crush or cavitron ultrasonic surgical aspirator | Fibrin glue used | Not stated | Not stated | Not stated | |
| Continuous portal triad clamping | Continuous hepatic vascular exclusion | Hepatic vascular exclusion by encircling the entire infrahepatic inferior vena cava | Vascular occlusion | Factor being randomised | Clamp‐crush method | Not stated | Not stated | Not stated | Not stated | |
| Continuous portal triad clamping | Continuous selective hepatic vascular exclusion | — | Vascular occlusion | Factor being randomised | Not stated | Not stated | Not stated | Low central venous pressure | Not stated | |
| Continuous portal triad clamping | Continuous selective portal triad clamping | — | Vascular occlusion | Factor being randomised | Clamp‐crush method | Not stated | Not stated | Low central venous pressure | Not stated | |
| Continuous portal triad clamping | Control | — | Vascular occlusion | Factor being randomised | Not stated | Not stated | Not stated | Not stated | Not stated | |
| Continuous portal triad clamping | Control | Note: After every 1 hour of continuous portal triad clamping (or 30 minutes for cirrhotic patients), the clamp was released for 10 minutes before reclamping | Vascular occlusion | Factor being randomised | Not stated | Not stated | Not stated | Not stated | Not stated | |
| Continuous portal triad clamping | Control | — | Vascular occlusion | Factor being randomised | Not stated | Not stated | Not stated | Not stated | Not stated | |
| Continuous portal triad clamping | Control | — | Vascular occlusion | Factor being randomised | Not stated | Not stated | Not stated | Not stated | Not stated | |
| Continuous portal triad clamping | Intermittent portal triad clamping | Continuous portal triad clamping: until end of transection | Vascular occlusion | Factor being randomised | Cavitron ultrasonic surgical aspirator | Not stated | Not stated | Low central venous pressure | Not stated | |
| Continuous portal triad clamping | Intermittent portal triad clamping | Intermittent portal triad clamping: 15 minutes on and 5 minutes off | Vascular occlusion | Factor being randomised | Clamp‐crush | Fibrin glue used | Not stated | Not stated | Not stated | |
| Continuous selective portal triad clamping | Intermittent portal triad clamping | Intermittent portal triad clamping: 20 minutes on and 5 minutes off | Vascular occlusion | Factor being randomised | Clamp crush | Not stated | None | Not stated | Not stated | |
| Intermittent portal triad clamping | Control | Intermittent portal triad clamping: 15 minutes on and 5 minutes off | Vascular occlusion | Factor being randomised | Clamp‐crush or bipolar dissecting sealer | Not stated | Not stated | Low central venous pressure | Not stated | |
| Intermittent portal triad clamping | Control | Intermittent portal triad clamping: 15 minutes on and 5 minutes off | Vascular occlusion | Factor being randomised | Cavitron ultrasonic surgical aspirator | Fibrin glue used | Not stated | Low central venous pressure | Not stated | |
| Intermittent portal triad clamping | Control | Intermittent portal triad clamping: 20 minutes on and 5 minutes off | Vascular occlusion | Factor being randomised | Cavitron ultrasonic surgical aspirator | Not stated | Not stated | Not stated | Not stated | |
| Intermittent portal triad clamping | Control | Intermittent portal triad clamping: 20 minutes on and 5 minutes off (until resection is completed or a maximum of 6 cycles) | Vascular occlusion | Factor being randomised | Not stated | Not stated | Not stated | Not stated | Not stated | |
| Intermittent portal triad clamping | Control | Intermittent portal triad clamping: 15 minutes on and 5 minutes off | Vascular occlusion | Factor being randomised | Not stated | Not stated | Not stated | Not stated | Not stated | |
| Intermittent portal triad clamping | Intermittent selective portal triad clamping | Intermittent clamping: 15 minutes on and 5 minutes off | Vascular occlusion | Factor being randomised | Not stated | Not stated | Not stated | Not stated | Not stated | |
| Intermittent portal triad clamping | Intermittent selective portal triad clamping | Intermittent portal triad clamping: 15 minutes on and 5 minutes off | Vascular occlusion | Factor being randomised | Clamp‐crush method | Not stated | Not stated | Not stated | Not stated | |
Two trials compared anterior approach versus conventional approach (Liu 2006; Capussotti 2012). Two trials compared autologous blood donation versus control (Kajikawa 1994; Kostopanagiotou 2007). Ten trials compared different methods of cardiopulmonary interventions (Hasegawa 2002; Matot 2002; El‐Kharboutly 2004; Wang 2006; Yao 2006; Choi 2007; Jarnagin 2008; Kato 2008; Guo 2013; Guo 2014). Twelve trials different compared methods of parenchymal transection (Takayama 2001; Rau 2001; Arita 2005; Koo 2005; Lesurtel 2005; Smyrniotis 2005; Lupo 2007; Ikeda 2009; Doklestic 2012; Savlid 2013; Muratore 2014; Rahbari 2014). Seventeen trials compared different methods of dealing with raw surface (Kohno 1992; Liu 1993; Noun 1996; Chapman 2000; Frilling 2005; Franceschi 2006; Figueras 2007; Fischer 2011; Gugenheim 2011; De Boer 2012; Porte 2012; Kakaei 2013; Koea 2013; Ollinger 2013; Bektas 2014; Genyk 2014; Moench 2014). Eighteen trials compared different methods of vascular occlusion (Belghiti 1996; Clavien 1996; Man 1997; Belghiti 1999; Wu 2002; Capussotti 2003; Man 2003; Chouker 2004; Figueras 2005; Capussotti 2006; Chen 2006; Liang 2009; Dayangac 2010; Pietsch 2010; Lee 2012; Park 2012; Ni 2013; Si‐Yuan 2014). Six trials compared different pharmacological interventions (Shimada 1994; Lentschener 1997; Wong 2003; Lodge 2005; Shao 2006; Wu 2006).
All the trials assessed different methods of open liver resection. Four trials were three‐armed trials (Yao 2006; Doklestic 2012; Kakaei 2013; Guo 2014), one trial was a four‐armed trial of which we included three arms (Lesurtel 2005), and the remaining trials were two‐armed trials. The 67 trials involved a total of 6197 participants. After exclusion of 133 participants after randomisation and 293 participants in three trials that did not provide any information about the outcomes included in this review (Franceschi 2006; Porte 2012; Koea 2013), we included 5771 participants who contributed to one or more outcomes of interest in this review.
Excluded studies
Of the 64 excluded studies, we excluded 6 because they were comments on included or excluded studies (Gonzalez 2009; Petras 2009; Schilling 2009; Strobel 2012; Strobel 2014; Hamady 2015); 19 because they were not randomised clinical trials (Le Treut 1995; Man 2002; Yin 2003; Azoulay 2005; Arru 2007; Kim 2008; Nagano 2009; Wang 2010; Wang 2011; Bellolio 2012; Beppu 2012; Narita 2012; NCT01651182; Palibrk 2012; Yang 2012; Dominioni 2014; Vlad 2014; Li 2015; Takatsuki 2015); 7 because of inadequate randomisation (Rau 1995; Smyrniotis 2002; Smyrniotis 2003a; Smyrniotis 2003b; Richter 2009; Obiekwe 2014; Shu 2014); 6 because they were comparisons of interventions that were not of interest to this review (Figueras 2003; Grobmyer 2009; Harimoto 2011; Levit 2012; Correa‐Gallego 2015; Feldheiser 2015); 18 since they were trials comparing variations within the treatments included in this review (for example, different periods of intermittent vascular occlusion or different methods of achieving low central venous pressure) (Standl 1998; Esaki 2006; Saiura 2006; Chapman 2007; Hashimoto 2007; Kim 2007; Torzilli 2008; El‐Moghazy 2009; Ryu 2010; Broek 2011; Rahbari 2011; Dello 2012; Zhu 2012; Frankel 2013; Kaibori 2013; Yang 2013; Saiura 2014; Zhang 2014); and 8 because the co‐interventions were not used equally in the intervention and control (Schwartz 2004; Petrowsky 2006; Smyrniotis 2006; Si‐Yuan 2011; Li 2013; Lu 2014; Gotohda 2015; Hanyong 2015).
Risk of bias in included studies
We summarise the risk of bias in the included trials in Figure 2 and Figure 3. Overall, we judged all trials to be at high risk of bias. The risk of bias according to the type of comparison is shown in Table 13.

Risk of bias graph: review authors' judgements about each risk of bias item presented as percentages across all included studies.
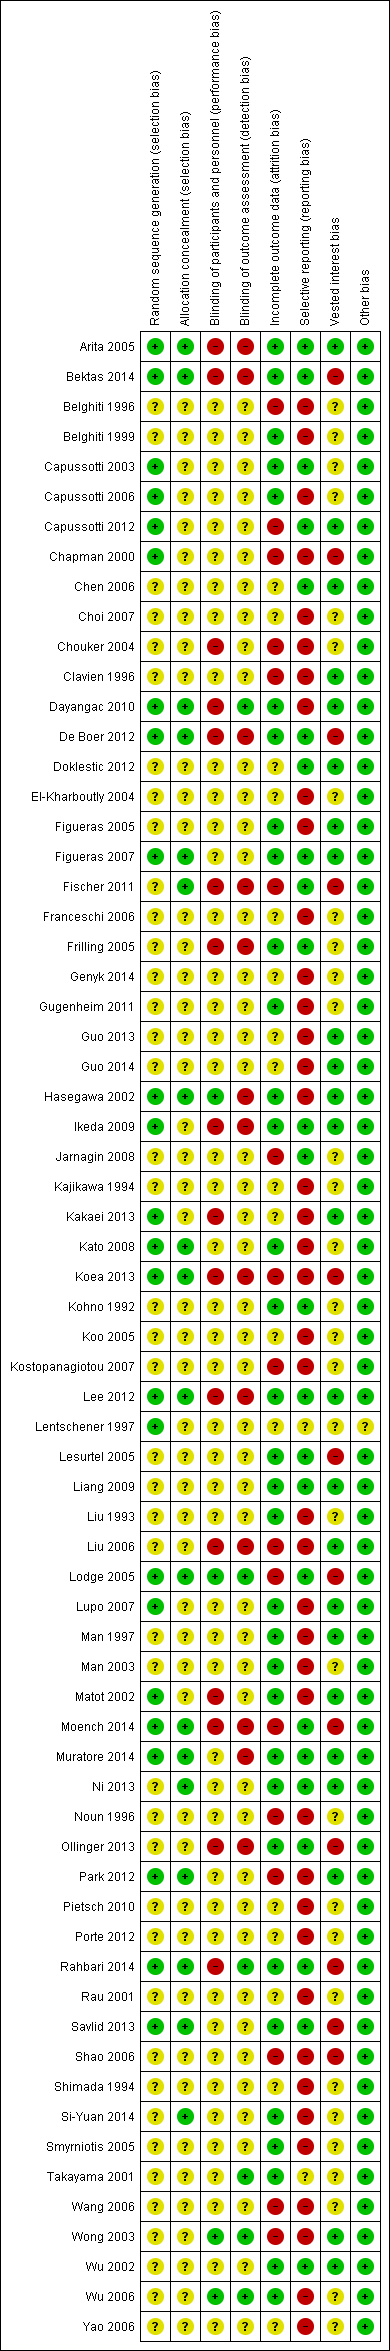
Risk of bias summary: review authors' judgements about each risk of bias item for each included study.
| Study | Intervention | Control | Sequence generation | Allocation concealment | Blinding of participants and healthcare providers | Blinding of outcome assessors | Missing outcome bias | Selective reporting bias | Source of funding bias | Other bias | Overall risk of bias |
| Anterior approach | Control | Low | Unclear | Unclear | Unclear | High | Low | Low | Low | Unclear or high | |
| Anterior approach | Control | Unclear | Unclear | High | High | High | High | Low | Low | Unclear or high | |
| Autologous blood donation | Control | Unclear | Unclear | Unclear | Unclear | Unclear | High | Unclear | Low | Unclear or high | |
| Autologous blood donation | Control | Unclear | Unclear | Unclear | Unclear | High | High | Unclear | Low | Unclear or high | |
| Acute normovolemic haemodilution plus low central venous pressure | Control | Unclear | Unclear | Unclear | Unclear | Unclear | High | Low | Low | Unclear or high | |
| Acute normovolemic haemodilution plus low central venous pressure | Low central venous pressure | Unclear | Unclear | Unclear | Unclear | High | Low | Unclear | Low | Unclear or high | |
| Acute normovolemic haemodilution plus low central venous pressure | Low central venous pressure | Low | Unclear | High | Unclear | Low | High | Low | Low | Unclear or high | |
| Acute normovolemic haemodilution | Acute normovolemic haemodilution with hypotension | Unclear | Unclear | Unclear | Unclear | Unclear | High | Unclear | Low | Unclear or high | |
| Hypoventilation | Control | Low | Low | Low | High | Low | High | Low | Low | Unclear or high | |
| Low central venous pressure | Control | Unclear | Unclear | Unclear | Unclear | Unclear | High | Unclear | Low | Unclear or high | |
| Low central venous pressure | Control | Unclear | Unclear | Unclear | Unclear | Unclear | High | Unclear | Low | Unclear or high | |
| Low central venous pressure | Control | Low | Low | Unclear | Unclear | Low | High | Unclear | Low | Unclear or high | |
| Low central venous pressure | Control | Unclear | Unclear | Unclear | Unclear | High | High | Unclear | Low | Unclear or high | |
| Low central venous pressure | Low central venous pressure + acute normovolemic haemodilution. | Unclear | Unclear | Unclear | Unclear | Unclear | High | Low | Low | Unclear or high | |
| Stapler | Clamp‐crush method | Low | Low | High | Low | Low | Low | High | Low | Unclear or high | |
| Cavitron ultrasonic surgical aspirator | Clamp‐crush method | Unclear | Unclear | Unclear | Unclear | Unclear | High | Unclear | Low | Unclear or high | |
| Cavitron ultrasonic surgical aspirator | Clamp‐crush method | Unclear | Unclear | Unclear | Unclear | Low | Low | Unclear | Low | Unclear or high | |
| Cavitron ultrasonic surgical aspirator | Clamp‐crush method. | Unclear | Unclear | Unclear | Unclear | Unclear | Low | Low | Low | Unclear or high | |
| Cavitron ultrasonic surgical aspirator | Hydrojet | Unclear | Unclear | Unclear | Unclear | Unclear | High | Unclear | Low | Unclear or high | |
| Cavitron ultrasonic surgical aspirator | Stapler | Low | Low | Unclear | Unclear | Low | Low | High | Low | Unclear or high | |
| Cavitron ultrasonic surgical aspirator | Radiofrequency dissecting sealer. | Unclear | Unclear | Unclear | Unclear | Low | Low | High | Low | Unclear or high | |
| Radiofrequency dissecting sealer | Clamp‐crush method | Low | Unclear | High | High | Low | Low | Low | Low | Unclear or high | |
| Radiofrequency dissecting sealer | Clamp‐crush method | Low | Unclear | Unclear | Unclear | Low | High | Low | Low | Unclear or high | |
| Radiofrequency dissecting sealer | Clamp‐crush method | Low | Low | Unclear | High | Low | Low | Low | Low | Unclear or high | |
| Radio‐frequency dissecting sealer | Clamp‐crush method | Low | Low | High | High | Low | Low | Low | Low | Unclear or high | |
| Sharp transection | Clamp‐crush method | Unclear | Unclear | Unclear | Unclear | Low | High | Unclear | Low | Unclear or high | |
| Anti‐thrombin III concentrate | Control | Unclear | Unclear | Unclear | Unclear | Unclear | High | Unclear | Low | Unclear or high | |
| Aprotinin | Control | Low | Unclear | Unclear | Low | High | High | High | Low | Unclear or high | |
| Desmopressin | Control | Unclear | Unclear | Low | Low | High | High | Low | Low | Unclear or high | |
| Recombinant factor VIIa | Control | Low | Low | Low | Low | High | Low | High | Low | Unclear or high | |
| Recombinant factor VIIa | Control | Unclear | Unclear | Unclear | Unclear | High | High | High | Low | Unclear or high | |
| Tranexamic acid | Control | Unclear | Unclear | Low | Low | Low | High | Unclear | Low | Unclear or high | |
| Collagen | Fibrin sealant | Low | Unclear | Unclear | Unclear | High | High | High | Low | Unclear or high | |
| Collagen | Fibrin sealant | Unclear | Unclear | Unclear | Unclear | Unclear | High | Unclear | Low | Unclear or high | |
| Collagen | Fibrin sealant | Unclear | Unclear | Unclear | Unclear | Low | Low | Unclear | Low | Unclear or high | |
| Collagen | Fibrin sealant | Low | Low | High | High | High | Low | High | Low | Unclear or high | |
| Fibrin sealant | Argon beam coagulator | Unclear | Low | High | High | High | Low | High | Low | Unclear or high | |
| Fibrin sealant | Argon beam coagulator | Unclear | Unclear | High | High | Low | Low | Unclear | Low | Unclear or high | |
| Fibrin sealant | Control | Low | Low | High | High | Low | Low | High | Low | Unclear or high | |
| Fibrin sealant | Control | Low | Low | High | High | Low | Low | High | Low | Unclear or high | |
| Fibrin sealant | Control | Unclear | Unclear | Unclear | Unclear | Low | High | Unclear | Low | Unclear or high | |
| Fibrin sealant | Control | Unclear | Unclear | Unclear | Unclear | High | High | Unclear | Low | Unclear or high | |
| Fibrin sealant | Gelatin | Unclear | Unclear | Unclear | Unclear | Unclear | High | Unclear | Low | Unclear or high | |
| Fibrin sealant | Oxidised cellulose | Unclear | Unclear | Unclear | Unclear | Unclear | High | Unclear | Low | Unclear or high | |
| Fibrin sealant | Oxidised cellulose | Low | Low | High | High | High | High | High | Low | Unclear or high | |
| Fibrin sealant | Oxidised cellulose | Unclear | Unclear | High | High | Low | Low | High | Low | Unclear or high | |
| Fibrin sealant | Oxidised cellulose | Low | Unclear | High | Unclear | Unclear | High | Low | Low | Unclear or high | |
| Fibrin sealant | PlasmaJet coagulator | Unclear | Unclear | Unclear | Unclear | Low | High | Unclear | Low | Unclear or high | |
| Fibrin sealant plus collagen | Control | Low | Low | Unclear | Unclear | Low | Low | Low | Low | Unclear or high | |
| Continuous portal triad clamping | Continuous hepatic vascular exclusion | Unclear | Unclear | Unclear | Unclear | High | High | Unclear | Low | Unclear or high | |
| Continuous portal triad clamping | Continuous hepatic vascular exclusion | Unclear | Unclear | Unclear | Unclear | Unclear | Low | Low | Low | Unclear or high | |
| Continuous portal triad clamping | Continuous selective hepatic vascular exclusion | Unclear | Low | Unclear | Unclear | Low | High | Unclear | Low | Unclear or high | |
| Continuous portal triad clamping | Continuous selective portal triad clamping | Unclear | Low | Unclear | Unclear | Low | Low | Low | Low | Unclear or high | |
| Continuous portal triad clamping | Control | Unclear | Unclear | High | Unclear | High | High | Unclear | Low | Unclear or high | |
| Continuous portal triad clamping | Control | Unclear | Unclear | Unclear | Unclear | High | High | Low | Low | Unclear or high | |
| Continuous portal triad clamping | Control | Low | Low | High | Low | Low | High | Low | Low | Unclear or high | |
| Continuous portal triad clamping | Control | Unclear | Unclear | Unclear | Unclear | Unclear | High | Unclear | Low | Unclear or high | |
| Continuous portal triad clamping | Intermittent portal triad clamping | Unclear | Unclear | Unclear | Unclear | Low | High | Unclear | Low | Unclear or high | |
| Continuous portal triad clamping | Intermittent portal triad clamping | Low | Unclear | Unclear | Unclear | Low | Low | Unclear | Low | Unclear or high | |
| Continuous selective portal triad clamping | Intermittent portal triad clamping | Unclear | Unclear | Unclear | Unclear | Low | Low | Low | Low | Unclear or high | |
| Intermittent portal triad clamping | Control | Low | Unclear | Unclear | Unclear | Low | High | Unclear | Low | Unclear or high | |
| Intermittent portal triad clamping | Control | Low | Low | High | High | Low | Low | Low | Low | Unclear or high | |
| Intermittent portal triad clamping | Control | Unclear | Unclear | Unclear | Unclear | Low | High | Low | Low | Unclear or high | |
| Intermittent portal triad clamping | Control | Unclear | Unclear | Unclear | Unclear | Low | High | Unclear | Low | Unclear or high | |
| Intermittent portal triad clamping | Control | Low | Low | Unclear | Unclear | High | High | Low | Low | Unclear or high | |
| Intermittent portal triad clamping | Intermittent selective portal triad clamping | Unclear | Unclear | Unclear | Unclear | Low | High | Low | Low | Unclear or high | |
| Intermittent portal triad clamping | Intermittent selective portal triad clamping | Unclear | Unclear | Unclear | Unclear | Low | Low | Low | Low | Unclear or high |
Allocation
Twenty‐four trials (35.8%) were at low risk of bias in the 'sequence generation' domain (Lentschener 1997; Chapman 2000; Hasegawa 2002; Matot 2002; Capussotti 2003; Arita 2005; Lodge 2005; Capussotti 2006; Figueras 2007; Lupo 2007; Kato 2008; Ikeda 2009; Dayangac 2010; Capussotti 2012; De Boer 2012; Lee 2012; Park 2012; Kakaei 2013; Koea 2013; Savlid 2013; Bektas 2014; Moench 2014; Muratore 2014; Rahbari 2014). Eighteen trials (26.9%) were at low risk of bias in the 'allocation concealment' domain (Hasegawa 2002; Arita 2005; Lodge 2005; Figueras 2007; Kato 2008; Dayangac 2010; Fischer 2011; De Boer 2012; Lee 2012; Park 2012; Koea 2013; Ni 2013; Savlid 2013; Bektas 2014; Moench 2014; Muratore 2014; Rahbari 2014; Si‐Yuan 2014). Fifteen trials (22.4%) were at low risk of bias in the 'both sequence generation and allocation concealment' domains and were free from selection bias (Hasegawa 2002; Arita 2005; Lodge 2005; Figueras 2007; Kato 2008; Dayangac 2010; De Boer 2012; Lee 2012; Park 2012; Koea 2013; Savlid 2013; Bektas 2014; Moench 2014; Muratore 2014; Rahbari 2014).
Blinding
Four trials (6.0%) were at low risk of bias in the 'blinding of participants and healthcare providers' domain (Hasegawa 2002; Wong 2003; Lodge 2005; Wu 2006). Six trials (9.0%) were at low risk of bias in the 'blinding of outcome assessors' domain (Lentschener 1997; Wong 2003; Lodge 2005; Wu 2006; Dayangac 2010; Rahbari 2014). Three trials (4.5%) were at low risk of bias in both the 'blinding of participants and healthcare providers' and 'blinding of outcome assessors' domains and were free from performance and detection bias (Wong 2003; Lodge 2005; Wu 2006).
Incomplete outcome data
Thirty‐three trials (49.3%) were at low risk of bias in the 'missing outcome bias' domain (Kohno 1992; Liu 1993; Man 1997; Belghiti 1999; Takayama 2001; Hasegawa 2002; Matot 2002; Wu 2002; Capussotti 2003; Man 2003; Arita 2005; Figueras 2005; Frilling 2005; Lesurtel 2005; Smyrniotis 2005; Capussotti 2006; Wu 2006; Figueras 2007; Lupo 2007; Kato 2008; Ikeda 2009; Liang 2009; Dayangac 2010; Gugenheim 2011; De Boer 2012; Lee 2012; Ni 2013; Ollinger 2013; Savlid 2013; Bektas 2014; Muratore 2014; Rahbari 2014; Si‐Yuan 2014).
Selective reporting
Twenty‐five trials (37.3%) reported mortality and serious adverse events and hence were considered to be at low risk of bias in the 'selective reporting bias' domain (Kohno 1992; Takayama 2001; Wu 2002; Capussotti 2003; Arita 2005; Frilling 2005; Lesurtel 2005; Lodge 2005; Chen 2006; Figueras 2007; Jarnagin 2008; Ikeda 2009; Liang 2009; Fischer 2011; Capussotti 2012; De Boer 2012; Doklestic 2012; Lee 2012; Ni 2013; Ollinger 2013; Savlid 2013; Bektas 2014; Moench 2014; Muratore 2014; Rahbari 2014).
Other potential sources of bias
Twenty‐four trials (35.8%) were at low risk of bias in the 'source of funding bias' domain (Clavien 1996; Man 1997; Hasegawa 2002; Matot 2002; Wu 2002; Wong 2003; Arita 2005; Figueras 2005; Chen 2006; Liu 2006; Figueras 2007; Lupo 2007; Ikeda 2009; Liang 2009; Dayangac 2010; Capussotti 2012; Doklestic 2012; Lee 2012; Park 2012; Guo 2013; Kakaei 2013; Ni 2013; Guo 2014; Muratore 2014).
We did not identify any other bias in the trials.
Effects of interventions
See: Summary of findings for the main comparison
We provide the data used in network meta‐analysis in Appendix 3; the data used for direct comparisons in Data and analyses; and the overall results in summary of findings Table for the main comparison, Appendix 9, and Appendix 10. We present the data in the following format for each comparison.
-
Outcome.
-
Different methods of measuring the outcome.
-
Direct comparison.
-
Network meta‐analysis (when applicable).
-
Differences between direct comparison and network meta‐analysis (when applicable).
-
-
-
Differences between Bayesian and frequentist meta‐analysis.
-
An overall summary for the comparison.
In addition, we also provide an overall summary for each outcome across all interventions at the end.
Anterior approach versus conventional approach
Two trials compared anterior approach versus conventional approach (Liu 2006; Capussotti 2012). Since this comparison only involved two treatments, we did not perform network meta‐analysis.
Quality of evidence
The quality of evidence was very low for all the outcomes. This was because of high risk of bias in the trials (downgraded by one point), imprecision due to small sample size (downgraded by one point), and wide credible intervals for all outcomes (downgraded by one point) as well as considerable heterogeneity for blood transfusion (proportion) and major blood loss (proportion) (downgraded by two points).
Mortality
Mortality (perioperative)
Two trials reported perioperative mortality (Liu 2006; Capussotti 2012). The unadjusted proportions of perioperative mortality are as follows.
-
Conventional approach: 7/92 (7.6%).
-
Anterior approach: 2/93 (2.2%).
Based on the DIC, we chose the fixed‐effect model. There was no evidence of differences in perioperative mortality between the two groups (OR 0.23, 95% CrI 0.03 to 1.08; 185 participants; 2 studies).
Mortality (longest follow‐up)
None of the trials reported this outcome.
Adverse events
Serious adverse events (proportion)
One trial reported serious adverse events as a proportion of participants who experienced one or more (Capussotti 2012). The unadjusted proportions of serious adverse events are as follows.
-
Conventional approach: 4/32 (12.5%).
-
Anterior approach: 5/33 (15.2%).
There was no evidence of differences in the proportion of participants experiencing serious adverse events between the two groups (OR 1.27, 95% CrI 0.29 to 5.89; 65 participants; 1 study).
Serious adverse events (number)
None of the trials reported this outcome.
Adverse events (proportion)
Two trials reported adverse events as a proportion (Liu 2006; Capussotti 2012). The unadjusted proportions of adverse events are as follows.
-
Conventional approach: 33/92 (35.9%).
-
Anterior approach: 31/93 (33.3%).
Based on the DIC, we chose the fixed‐effect model. There was no evidence of differences in the proportion of participants experiencing adverse events between the two groups (OR 0.89, 95% CrI 0.48 to 1.64; 185 participants; 2 studies).
Adverse events (number)
One trial reported the number of adverse events (Capussotti 2012). The unadjusted rates of adverse events (number) are as follows.
-
Conventional approach: 18/32 (56.3 per 100 participants).
-
Anterior approach: 17/33 (51.5 per 100 participants).
There was no evidence of differences in the number of adverse events between the two groups (rate ratio 0.91, 95% CrI 0.47 to 1.78; 65 participants; 2 studies).
Health‐related quality of life
None of the trials reported this outcome at any time point.
Blood transfusion requirements
Blood transfusion (proportion)
Two trials reported blood transfusion as a proportion of participants requiring one (Liu 2006; Capussotti 2012). The unadjusted proportions of participants receiving a blood transfusion are as follows.
-
Conventional approach: 20/92 (21.7%).
-
Anterior approach: 10/93 (10.8%).
Based on the DIC, we chose the random‐effects model. The between‐study standard deviation was 2.60. There was no evidence of differences in the proportion of participants receiving a blood transfusion between the two groups (OR 0.57, 95% CrI 0.01 to 50.91; 185 participants; 2 studies).
Blood transfusion (quantity)
None of the trials reported the quantity of blood transfusion in red blood cells, platelets, fresh frozen plasma, or cryoprecipitate.
Blood loss
Two trials reported blood loss (Liu 2006; Capussotti 2012). The median blood loss reported for each treatment in the two trials are as follows.
-
Conventional approach: 0.5 L and 1 L.
-
Anterior approach: 0.437 L and 0.8 L.
We did not perform meta‐analysis since both trials reported the median blood loss rather than the mean and standard deviation of blood loss. There was no evidence of differences in blood loss in either trial (Liu 2006; Capussotti 2012).
Major blood loss (proportion)
Two trials reported major blood loss as a proportion of participants experiencing it (Liu 2006; Capussotti 2012). One trial defined major blood loss as more than one litre of blood loss (Capussotti 2012), while the other trial defined it as more than two litres (Liu 2006). The unadjusted proportions of major blood loss (proportion) are as follows.
-
Conventional approach: 22/92 (23.9%).
-
Anterior approach: 12/93 (12.9%).
Based on the DIC, we chose the random‐effects model. The between‐study standard deviation was 2.3. There was no evidence of differences in the proportion of participants experiencing major blood loss between the two groups (OR 0.54, 95% CrI 0.01 to 34.54; 185 participants; 2 studies).
Hospital stay
Total hospital stay
Two trials reported hospital stay (Liu 2006; Capussotti 2012). The median hospital stay reported for each treatment in the two trials are as follows.
-
Conventional approach: 11.5 days (d) and 12.5 d.
-
Anterior approach: 10 d and 11 d.
We did not perform meta‐analysis since both trials reported the median hospital stay rather than the mean and standard deviation of hospital stay. There was no evidence of differences in hospital stay in either trial (Liu 2006; Capussotti 2012).
Intensive therapy unit (ITU) stay
One trial reported ITU stay (Liu 2006). The median ITU stay reported for each treatment is as follows.
-
Conventional approach: 2 d.
-
Anterior approach: 1.5 d.
We did not perform meta‐analysis since the trial reported the median ITU stay rather than the mean and standard deviation of ITU stay. There was no evidence of differences in ITU stay in this trial (Liu 2006).
Operating time
Two trials reported operating time (Liu 2006; Capussotti 2012). The median operating times reported for each treatment are as follows.
-
Conventional approach: 312.8 minutes (min) and 415 min.
-
Anterior approach: 295.8 min and 420 min.
We did not perform meta‐analysis since both trials reported the median operating time rather than the mean and standard deviation of operating time. There was no evidence of differences in operating time in either trial.
Time needed to return to work
None of the trials reported this outcome.
Difference between Bayesian and frequentist meta‐analysis
The interpretation of information and conclusions did not alter by using the frequentist meta‐analysis.
Overall summary
There was no evidence of differences between the anterior approach and conventional approach in any of the reported outcomes of interest for this review.
Autologous blood donation versus control
Two trials compared autologous blood donation versus control (Kajikawa 1994; Kostopanagiotou 2007). As this comparison only included two treatments, we did not perform network meta‐analysis.
Quality of evidence
The quality of evidence was very low for all the outcomes and comparisons unless specifically indicated within the results. This was because of unclear or high risk of bias in the trials (downgraded by one point), imprecision due to small sample size (downgraded by one point), and wide credible intervals (downgraded by one point) for all outcomes with very low quality of evidence.
Mortality
Mortality (perioperative)
One trial (28 participants) reported perioperative mortality (Kostopanagiotou 2007); there was none in either group.
Mortality (longest follow‐up)
One trial (28 participants) reported mortality at longest follow‐up (Kostopanagiotou 2007). There was no mortality in either group after a follow‐up period of one year.
Adverse events
Serious adverse events (proportion)
None of the trials reported this outcome.
Serious adverse events (number)
None of the trials reported this outcome.
Adverse events (proportion)
One trial reported adverse events as a proportion of participants experiencing at least one (Kostopanagiotou 2007). The unadjusted proportions of participants experiencing an adverse event are as follows.
-
Control: 5/13 (38.5%).
-
Autologous blood donation: 5/15 (33.3%).
There was no evidence of differences in the proportion of participants experiencing adverse events between groups (OR 0.79, 95% CrI 0.15 to 3.98; 28 participants; 1 study).
Adverse events (number)
None of the trials reported this outcome.
Health‐related quality of life
None of the trials reported this outcome at any time point.
Blood transfusion requirements
Blood transfusion (proportion)
One trial reported the proportion of participants requiring a blood transfusion (Kajikawa 1994). The unadjusted proportions are as follows.
-
Control: 13/21 (61.9%).
-
Autologous blood donation: 5/21 (23.8%).
The proportion of participants requiring a blood transfusion was lower in the autologous blood donation group than in the control (OR 0.18, 95% CrI 0.04 to 0.66; 42 participants; 1 study; low‐quality evidence: downgraded one point for unclear or high risk of bias and one point for small sample size).
Blood transfusion (red blood cells)
One trial reported blood transfusion quantity in red blood cells (Kostopanagiotou 2007). The mean blood transfusion quantities reported for each treatment are as follows.
-
Control: 1.7 units.
-
Autologous blood donation: 1.6 units.
There was no evidence of differences in blood transfusion quantity (red blood cells) between the groups (MD −0.10 units, 95% CrI −0.59 to 0.38; 28 participants; 1 study).
Blood transfusion (platelets)
None of the trials reported this outcome.
Blood transfusion (fresh frozen plasma)
None of the trials reported this outcome.
Blood transfusion (cryoprecipitate)
None of the trials reported this outcome.
Blood loss
Two trials reported blood loss (Kajikawa 1994; Kostopanagiotou 2007). The mean blood loss reported for each treatment are as follows.
-
Control: 0.78 L and 1.193 L
-
Autologous blood donation: 0.68 L and 1.272 L
Based on the DIC, we chose the fixed‐effect model. There was no evidence of differences in blood loss between the groups (MD −0.02 L, 95% CrI −0.37 to 0.34; 70 participants; 2 studies).
Major blood loss (proportion)
One trial reported the proportion of participants experiencing major blood loss, defined as the loss of more than two litres (Kajikawa 1994). The unadjusted proportions of participants with major blood loss are as follows.
-
Control: 2/21 (9.5%).
-
Autologous blood donation: 4/21 (19.0%).
There was no evidence of differences in the proportion of participants experiencing major blood loss between the groups (OR 2.44, 95% CrI 0.39 to 21.5; 42 participants; 1 study).
Hospital stay
Total hospital stay
One trial reported total hospital stay (Kostopanagiotou 2007). The mean hospital stays reported for each treatment are as follows.
-
Control: 10 d.
-
Autologous blood donation: 11 d.
There was no evidence of differences in hospital stay between the groups (MD 0.99 d, 95% CrI −0.92 to 2.91; 28 participants; 1 study).
ITU stay
None of the trials reported this outcome.
Operating time
Two trials reported operating time (Kajikawa 1994; Kostopanagiotou 2007). The mean operating times reported for each treatment are as follows.
-
Control: 190 min and 290 min.
-
Autologous blood donation: 175 min and 318 min.
Based on the DIC, we chose the fixed‐effect model. There was no evidence of differences in operating times between the groups (MD 1.78 min, 95% CrI −28.13 to 31.68; 70 participants; 2 studies).
Time needed to return to work
None of the trials reported this outcome.
Difference between Bayesian and frequentist meta‐analysis
The interpretation of information and conclusions did not alter by using the frequentist meta‐analysis.
Overall summary
There was no evidence of difference between autologous blood donation and control in any of the reported outcomes of interest for this review other than the proportion of people who required blood transfusion, which was lower in the autologous blood donation group than control (OR 0.18, 95% CrI 0.04 to 0.66; 42 participants; 1 study).
Cardiopulmonary interventions
Ten trials compared different methods of cardiopulmonary interventions (Hasegawa 2002; Matot 2002; El‐Kharboutly 2004; Wang 2006; Yao 2006; Choi 2007; Jarnagin 2008; Kato 2008; Guo 2013; Guo 2014). We performed network meta‐analysis only for blood transfusion quantity (red blood cells) and blood loss since direct comparison and indirect comparison effect estimates (which would enable assessment of inconsistency) were available only for these outcomes. We present only direct comparison results for other outcomes.
Quality of evidence
The quality of evidence was very low for all the outcomes and comparisons unless specifically indicated within the results. This was because of unclear or high risk of bias in the trials (downgraded by one point), imprecision due to small sample size (downgraded by one point), and wide credible intervals (downgraded by one point) for all outcomes with very low quality of evidence.
Mortality
Mortality (perioperative)
Four trials reported perioperative mortality (Hasegawa 2002; Matot 2002; Jarnagin 2008; Kato 2008). These studies used four treatments in 372 participants. The unadjusted proportions of perioperative mortality are as follows.
-
Control: 0/81 (0.0%).
-
Acute normovolemic haemodilution plus low central venous pressure: 1/102 (1.0%).
-
Hypoventilation: 0/40 (0.0%).
-
Low central venous pressure: 3/149 (2.0%).
There was no evidence of differences in perioperative mortality for any of the comparisons.
Mortality (longest follow‐up)
None of the trials reported this outcome.
Adverse events
Serious adverse events (proportion)
Two trials reported the proportion of participants experiencing serious adverse events (Hasegawa 2002; Jarnagin 2008). A total of four treatments were used in a total of 209 participants in these studies. The unadjusted proportions of participants with serious adverse events are as follows.
-
Control: 1/39 (2.6%).
-
Acute normovolemic haemodilution plus low central venous pressure: 19/63 (30.2%).
-
Hypoventilation: 2/40 (5.0%).
-
Low central venous pressure: 19/67 (28.4%).
There was no evidence of differences in the proportion of participants experiencing serious adverse events for any of the comparisons.
Serious adverse events (number)
Two trials reported the total number of serious adverse events (Matot 2002; El‐Kharboutly 2004). These studies used three treatments in 118 participants. The unadjusted rates of serious adverse events (number) are as follows.
-
Control: 2/20 (10.0 per 100 participants).
-
Acute normovolemic haemodilution plus low central venous pressure: 4/39 (10.3 per 100 participants).
-
Low central venous pressure: 3/59 (5.1 per 100 participants).
There was no evidence of differences in the number of serious adverse events observed for any of the comparisons.
Adverse events (proportion)
Four trials reported the proportion of participants experiencing adverse events (Hasegawa 2002; Matot 2002; Wang 2006; Jarnagin 2008). These studies used four treatments in 337 participants. The unadjusted proportions of participants experiencing adverse events are as follows.
-
Control: 19/64 (29.7%).
-
Acute normovolemic haemodilution plus low central venous pressure: 37/102 (36.3%).
-
Hypoventilation: 16/40 (40.0%).
-
Low central venous pressure: 35/131 (26.7%).
There was no evidence of differences in the proportion of participants experiencing adverse events for any of the comparisons.
Adverse events (number)
Two trials reported adverse events (number) (Matot 2002; El‐Kharboutly 2004). These studies used three treatments in 118 participants. The unadjusted rates of adverse events (number) are as follows.
-
Control: 6/20 (30.0 per 100 participants).
-
Acute normovolemic haemodilution plus low central venous pressure: 12/39 (30.8 per 100 participants).
-
Low central venous pressure: 15/59 (25.4 per 100 participants).
There was no evidence of differences in adverse events (number) for any of the comparisons.
Health‐related quality of life
None of the trials reported this outcome at any time point.
Blood transfusion requirements
Blood transfusion (proportion)
Six trials reported the proportion of participants requiring a blood transfusion (Hasegawa 2002; Matot 2002; El‐Kharboutly 2004; Wang 2006; Jarnagin 2008; Kato 2008). These studies used four treatments in 462 participants. The unadjusted proportions of participants requiring a blood transfusion are as follows.
-
Control: 29/126 (23.0%).
-
Acute normovolemic haemodilution plus low central venous pressure: 12/102 (11.8%).
-
Hypoventilation: 3/40 (7.5%).
-
Low central venous pressure: 48/194 (24.7%).
Based on the DIC, we chose the fixed‐effect model. The proportion of participants requiring a blood transfusion was higher in the low central venous pressure group than in the group receiving acute normovolemic haemodilution plus low central venous pressure (OR 3.19, 95% CrI 1.56 to 6.95; 208 participants; 2; low‐quality evidence: downgraded by one point for unclear or high risk of bias in the trials and one more point for small sample size). There was no evidence of differences in other comparisons.
Blood transfusion (red blood cells)
Six trials reported blood transfusion quantity (as red blood cells) (Matot 2002; El‐Kharboutly 2004; Wang 2006; Yao 2006; Jarnagin 2008; Guo 2013), testing five treatments in 358 participants. The median and range of the mean blood transfusion quantity (red blood cells) reported for each treatment are as follows.
-
Control: 1.38 units (range 0.88 to 3.22).
-
Acute normovolemic haemodilution: 0.17 units (range 0.17 to 0.17).
-
Acute normovolemic haemodilution plus hypotension: 0.00 units (range 0.00 to 0.00).
-
Acute normovolemic haemodilution plus low central venous pressure: 0.44 (range 0.00 to 1.15).
-
Low central venous pressure: 0.61 (range 0.00 to 1.31).
Direct comparison
Based on the DIC, we chose the fixed‐effect model. The blood transfusion quantity (in red blood cells) was lower in the group receiving acute normovolemic haemodilution (MD −1.25 units, 95% CrI −1.75 to −0.74; 20 participants; 1 study; low‐quality evidence: downgraded by one point for unclear or high risk of bias in the trials and one more point for small sample size) and acute normovolemic haemodilution plus hypotension (MD −1.67 units, 95% CrI −2.06 to −1.32; 20 participants; 1 study; low‐quality evidence: downgraded by one point for unclear or high risk of bias in the trials and one more point for small sample size) than control.The blood transfusion quantity (red blood cells) was higher inthe acute normovolemic haemodilution plus low central venous pressure group than in the control group (MD 0.27 units, 95% CrI 0.01 to 0.52; 30 participants; 1 study). There was no evidence of differences in other comparisons. We imputed either the mean or standard deviation in two trials (Matot 2002; Jarnagin 2008). Excluding these trials did not alter the conclusions.
Network meta‐analysis
We present the network plots in Figure 4. Based on the DIC, we chose the random‐effects model. There was no evidence of differences in blood transfusion quantity (red blood cells) for any of the comparisons. Excluding the trials in which we imputed the mean or standard deviation (Matot 2002; Jarnagin 2008), we could not assess whether the direct and indirect evidence was consistent. We show the probability of each treatment being best, second best, third best, and so on in Figure 5 and the cumulative probability of a treatment being best in Figure 6.
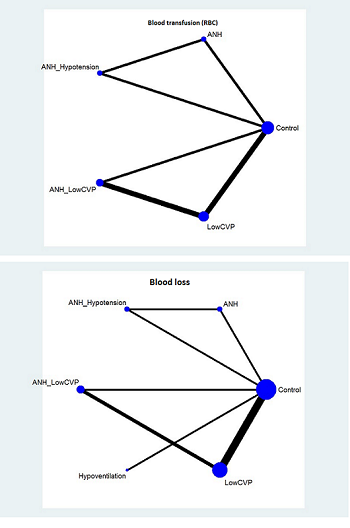
The network plot showing the comparisons in the trials included in the comparison of cardiopulmonary interventions in which network meta‐analysis was performed. The size of the node (circle) provides a measure of the number of trials in which the particular treatment was included as one of the arms. The thickness of the line provides a measure of the number of direct comparisons between two nodes (treatments).
ANH: acute normovolemic haemodilution; CVP: central venous pressure; RBC: red blood cells.

Probability of best treatment: probability of being best, second best, third best, etc. for each treatment for blood transfusion (red blood cells) (cardiopulmonary interventions). A probability of more than 90% is a reliable indicator that a treatment is best with regards to the specific outcome. A probability of less than 90% is less reliable. None of the treatments have a 90% probability of being best treatment.
ANH: acute normovolemic haemodilution; CVP: central venous pressure; RBC: red blood cells.
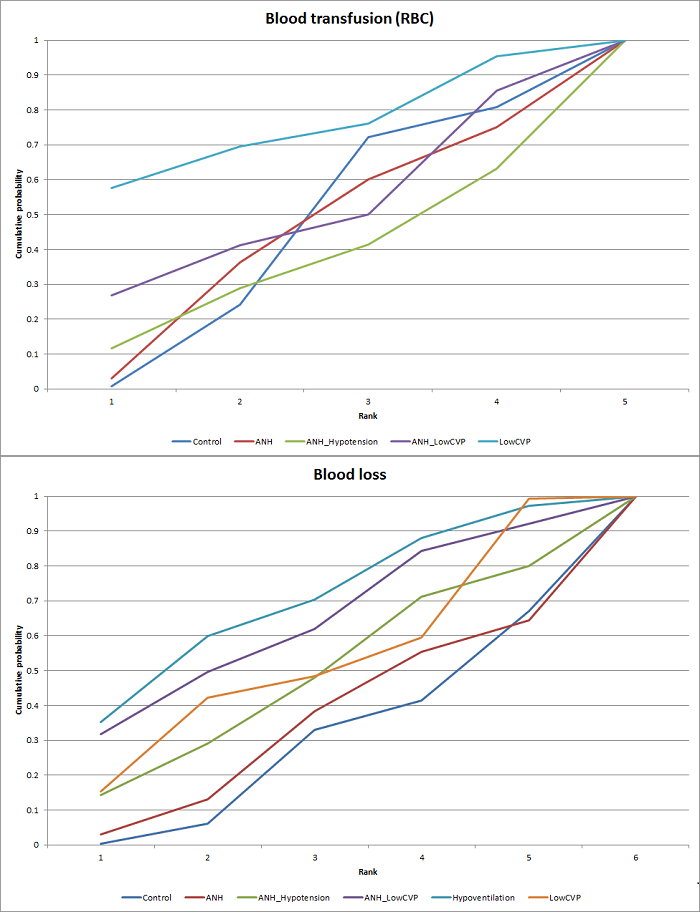
Cumulative probability of being best treatment: cumulative probability of being best for each treatment for cardiopulmonary interventions. Rank 1 indicates the probability that a treatment is best, rank 2 indicates the probability that a treatment is in the two best treatments, rank 3 indicates the probability that a treatment is in the three best treatments, and so on.
ANH: acute normovolemic haemodilution; CVP: central venous pressure; RBC: red blood cells.
Direct evidence compared to network meta‐analysis
We compare the information on direct evidence to network meta‐analysis in Figure 7. The mean effect goes in opposite directions in the indirect and direct estimates, suggesting that there may be discrepancies (incongruence or inconsistency) between direct and indirect estimates. Direct evidence appears to be preferable over indirect evidence and network meta‐analysis based on the quality of evidence.

Cardiopulmonary intervention: blood transfusion (red blood cells)
Forest plot of the comparisons in which direct and indirect estimates were available. The mean effect is in opposite directions in the indirect estimate and the direct estimates, thus suggesting that there may be discrepancies between direct and indirect estimates. Direct evidence appears to be preferable over indirect evidence and network meta‐analysis based on the quality of evidence.
1 Risk of bias was unclear or high in the trial(s) (downgraded by 1 point).
2 Sample size was low (downgraded by 1 point).
3Confidence intervals spanned no effect and clinically significant effect (downgraded by 1 point).
4There was substantial or considerable heterogeneity (downgraded by 2 points).
Blood transfusion (platelets)
None of the trials reported this outcome.
Blood transfusion (fresh frozen plasma)
Two trials reported blood transfusion quantity (as fresh frozen plasma) (Wang 2006; Jarnagin 2008), testing three interventions in 180 participants. The mean blood transfusion quantities (fresh frozen plasma) reported for each treatment are as follows.
-
Control: 4.23 units.
-
Acute normovolemic haemodilution plus low central venous pressure: 0.17 units.
-
Low central venous pressure: 0.28 and 1.75 units.
The blood transfusion quantity (fresh frozen plasma) was lower in the low central venous pressure group than the control group (MD −2.48 units, 95% CrI −3.58 to −1.37; 50 participants; 1 study; low‐quality evidence: downgraded by one point for unclear or high risk of bias in the trials and one more point for small sample size). There was no evidence of differences in the other comparison (low central venous pressure versus acute normovolemic haemodilution plus low central venous pressure) (MD 0.11 units, 95% CrI −0.79 to 1.01; 130 participants; 1 study). We imputed the standard deviation in one of the trials (Jarnagin 2008). Excluding this trial did not alter the outcome.
Blood transfusion (cryoprecipitate)
One trial reported blood transfusion quantity (cryoprecipitate) (Hasegawa 2002). The mean blood transfusion quantities (cryoprecipitate) are as follows.
-
Control: 0.076 units.
-
Hypoventilation: 0.052 units.
There was no evidence of differences in blood transfusion quantity (cryoprecipitate) between the groups (MD −0.02 units, 95% CrI −0.12 to 0.07; 79 participants; 1 study).
Blood loss
Nine trials reported blood loss (Hasegawa 2002; Matot 2002; El‐Kharboutly 2004; Wang 2006; Yao 2006; Choi 2007; Jarnagin 2008; Kato 2008; Guo 2013),testing six interventions in 584 participants. The median and range of the mean blood loss reported for each treatment are as follows.
-
Control: 0.711 L (range 0.584 to 2.329).
-
Acute normovolemic haemodilution: 0.654 L (one trial only).
-
Acute normovolemic haemodilution plus hypotension: 0.404 L (one trial only).
-
Acute normovolemic haemodilution plus low central venous pressure: 0.75 L (range 0.735 to 0.8).
-
Hypoventilation: 0.63 L (one trial only).
-
Low central venous pressure: 0.6445 L (range 0.49 to 0.904).
Direct comparison
Based on the DIC, we chose the fixed‐effect model. The blood loss was lower in the acute normovolemic haemodilution plus hypotension group (MD −0.25 L; 95% CrI −0.37 to −0.13; 20 participants; 1 study) and the low central venous pressure group than in the control (MD −0.34 L, 95% CrI −0.46 to −0.22; 237 participants; 4 studies).The blood loss was lower for acute normovolemic haemodilution plus hypotension than for acute normovolemic haemodilution (MD −0.25 L; 95% CrI −0.40 to −0.10; 20 participants; 1 study). There was no evidence of differences in other comparisons. We imputed either the mean or standard deviation in four trials (Hasegawa 2002; Matot 2002; Jarnagin 2008; Kato 2008). Excluding these trials did not alter the conclusions.
Network meta‐analysis
We present the network plots in Figure 4. Based on the DIC, we chose the random‐effects model. There was no evidence of differences in blood loss for any of the comparisons. Excluding the trials in which we imputed the mean or standard deviation (Hasegawa 2002; Matot 2002; Jarnagin 2008; Kato 2008) meant that there would be no evidence from direct and indirect evidence, which would allow the assessment of whether the direct and indirect evidence was consistent. We show the probability of each treatment being the best, second best, third best, and so on in Figure 8. The cumulative probability of a treatment being best is shown in Figure 6.
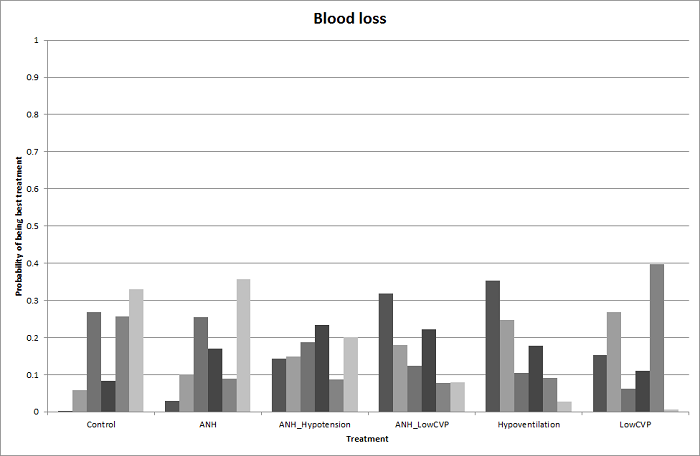
Probability of best treatment: probability of being best, second best, third best, etc. for each treatment for blood loss (cardiopulmonary interventions). A probability of more than 90% is a reliable indicator that a treatment is best with regards to the specific outcome. A probability of less than 90% is less reliable. None of the treatments have a 90% probability of being best treatment.
ANH: acute normovolemic haemodilution; CVP: central venous pressure.
Direct evidence compared to network meta‐analysis
We show the information on direct evidence compared to network meta‐analysis in Figure 9. There does not appear to be any discrepancy between the direct and indirect estimates, although the indirect estimates have wide credible intervals. Direct evidence appears to be preferable over indirect evidence and network meta‐analysis based on the quality of evidence.

Cardiopulmonary intervention: blood loss
Forest plot of the comparisons in which direct and indirect estimates were available. There does not appear to be any discrepancy between the direct and indirect estimates, although the indirect estimates have wide credible intervals.
Direct evidence appears to be preferable over indirect evidence and network meta‐analysis based on the quality of evidence.
ANH: acute normovolemic haemodilution; CVP: central venous pressure.
1Risk of bias was unclear or high in the trial(s) (downgraded by 1 point).
2Sample size was low (downgraded by 1 point).
3Confidence intervals spanned no effect and clinically significant effect (downgraded by 1 point).
4There was substantial or considerable heterogeneity (downgraded by 2 points).
Major blood loss (proportion)
One trial reported the proportion of participants experiencing major blood loss (Jarnagin 2008), defined as more than 0.8 L. The unadjusted proportions of of participants experiencing major blood loss are as follows.
-
Acute normovolemic haemodilution plus low central venous pressure: 33/63 (52.4%).
-
Low central venous pressure: 29/67 (43.3%).
There was no evidence of differences in the proportion of participants experiencing major blood loss between the groups (OR 0.69, 95% CrI 0.34 to 1.38; 130 participants; 1 study).
Hospital stay
Total hospital stay
Five trials reported hospital stay (Hasegawa 2002; Wang 2006; Choi 2007; Jarnagin 2008; Kato 2008). They used four treatments in 406 participants. The median length and range of the mean or median hospital stay reported for each treatment are as follows.
-
Control: 21 d (range 14 to 30).
-
Acute normovolemic haemodilution plus low central venous pressure: 7 d (one trial only).
-
Hypoventilation: 20 d (one trial only).
-
Low central venous pressure: 15 d (range 7 to 26).
Based on the DIC, we chose the fixed‐effect modelwhen there were two or more trials under the comparison. The total hospital stay was lower in the low central venous pressure group than in the control group (MD −2.42 d, 95% CrI −3.91 to −0.94; 197 participants; 3 studies). There was no evidence of differences in the remaining comparisons. In three trials, either the mean or the standard deviation was not available (Hasegawa 2002; Jarnagin 2008; Kato 2008), so we did not perform a meta‐analysis. Exclusion of these three trials did not alter the conclusions.
ITU stay
None of the trials reported this outcome.
Operating time
Seven trials reported operating time (Hasegawa 2002; Matot 2002; El‐Kharboutly 2004; Wang 2006; Choi 2007; Jarnagin 2008; Guo 2014). They used four treatments in 499 participants. The median and range of the mean operating times reported for each treatment are as follows.
-
Control: 246 min (range 190 to 498).
-
Acute normovolemic haemodilution plus low central venous pressure: 255 min (range 179 to 293).
-
Hypoventilation: 498 min (one trial only).
-
Low central venous pressure: 244 min (range 164 to 321).
Based on the DIC, we chose the fixed‐effect model. The operating time was lower in the low central venous pressure group than in the control group (MD −15.32 min, 95% CrI −29.03 to −1.69; 192 participants; 4 studies). There was no evidence of differences in other comparisons. Two trials failed to report the mean, standard deviation, or both (Hasegawa 2002; Jarnagin 2008). Excluding these trials did not alter the conclusions.
Time needed to return to work
None of the trials reported this outcome.
Difference between Bayesian and frequentist meta‐analysis
The interpretation of information and conclusions did not alter by using the frequentist meta‐analysis.
Overall summary
There was no evidence of differences between different cardiopulmonary interventions in any of the reported outcomes of interest for this review other than the following.
-
The proportion of participants requiring a blood transfusion was higher in those receiving low central venous pressure than in those receiving acute normovolemic haemodilution plus low central venous pressure (OR 3.19, 95% CrI 1.56 to 6.95; 208 participants; 2 studies).
-
The blood transfusion quantity (red blood cells) was lower in the acute normovolemic haemodilution group (MD −1.25 units, 95% CrI −1.75 to −0.74; 20 participants; 1 study) and the acute normovolemic haemodilution plus hypotension group (MD −1.67 units, 95% CrI −2.06 to −1.32; 20 participants; 1 study) than in the control group. The blood transfusion quantity (red blood cells) was higher in the acute normovolemic haemodilution plus low central venous pressure group than in the control group (MD 0.27 units, 95% CrI 0.01 to 0.52; 30 participants; 1 study).
-
The blood transfusion quantity (fresh frozen plasma) was lower for low central venous pressure than for control (MD −2.48 units, 95% CrI −3.58 to −1.37; 50 participants; 1 study).
-
The blood loss was lower in the acute normovolemic haemodilution plus hypotension group (MD −0.25 L; 95% CrI −0.37 to −0.13; 20 participants; 1 study) and the low central venous pressure group than in the control (MD −0.34 L, 95% CrI −0.46 to −0.22; 237 participants; 4 studies). The blood loss was lower in the acute normovolemic haemodilution plus hypotension group than in the acute normovolemic haemodilution group (MD −0.25; 95% CrI −0.40 to −0.10; 20 participants; 1 study).
-
The total hospital stay was lower in the low central venous pressure group than in the control (MD −2.42 d, 95% CrI −3.91 to −0.94; 197 participants; 3 studies).
-
The operating time was lower in the low central venous pressure group than in the control (MD −15.32 min, 95% CrI −29.03 to −1.69; 192 participants; 4 studies).
Methods of parenchymal transection
Twelve trials compared different methods of parenchymal transection (Rau 2001; Takayama 2001; Arita 2005; Koo 2005; Lesurtel 2005; Smyrniotis 2005; Lupo 2007; Ikeda 2009; Doklestic 2012; Savlid 2013; Muratore 2014; Rahbari 2014). We performed network meta‐analysis only for adverse events (proportion), adverse events (number), and proportion requiring blood transfusion, since direct comparison and indirect comparison effect estimates (which would enable assessment of inconsistency) were available only for these outcomes. We present only direct comparison results for other outcomes.
Quality of evidence
The quality of evidence was very low for all the outcomes and comparisons unless specifically indicated within the results. This was because of unclear or high risk of bias in the trials (downgraded by one point), imprecision due to small sample size (downgraded by one point), and wide credible intervals (downgraded by one point) for all outcomes with very low‐quality of evidence. In addition, we downgraded the outcome of blood transfusion (proportion) by two points because of the presence of substantial or considerable heterogeneity in the pair‐wise comparison or in the network.
Mortality
Mortality (perioperative)
Eleven trials reported perioperative mortality (Rau 2001; Takayama 2001; Arita 2005; Lesurtel 2005; Smyrniotis 2005; Lupo 2007; Ikeda 2009; Doklestic 2012; Savlid 2013; Muratore 2014; Rahbari 2014). They used six treatments in 990 participants. The unadjusted proportions of perioperative mortality are as follows.
-
Clamp‐crush method: 4/368 (1.1%).
-
Cavitron ultrasonic surgical aspirator: 3/191 (1.6%).
-
Hydrojet: 3/56 (5.4%).
-
Radiofrequency dissecting sealer: 4/219 (1.8%).
-
Sharp transection method: 0/41 (0.0%).
-
Stapler: 4/115 (3.5%).
Based on the DIC, the fixed‐effect model was chosen for all comparisons involving two or more trials. There was no evidence of differences in perioperative mortality for any of the comparisons.
Mortality (longest follow‐up)
None of the trials reported this outcome.
Adverse events
Serious adverse events (proportion)
Seven trials reported the proportion of participants experiencing serious adverse events (Rau 2001; Takayama 2001; Arita 2005; Smyrniotis 2005; Ikeda 2009; Doklestic 2012; Rahbari 2014). They used six treatments in 665 participants. The unadjusted proportions of participants experiencing serious adverse events are as follows.
-
Clamp‐crush method: 28/292 (9.6%).
-
Cavitron ultrasonic surgical aspirator: 6/116 (5.2%).
-
Hydrojet: 2/31 (6.5%).
-
Radiofrequency dissecting sealer: 6/120 (5.0%).
-
Sharp transection method: 4/41 (9.8%).
-
Stapler: 19/65 (29.2%).
Based on the DIC, we chose the fixed‐effect model for all comparisons involving two or more trials. There was no evidence of differences in serious adverse events (proportion) for any of the comparisons.
Serious adverse events (number)
Five trials reported the number of serious adverse events (Takayama 2001; Arita 2005; Lesurtel 2005; Lupo 2007; Savlid 2013). They used five treatments in 437 participants. The unadjusted rates of serious adverse events (number) are as follows.
-
Clamp‐crush method: 7/132 (5.3 per 100 participants).
-
Cavitron ultrasonic surgical aspirator: 13/141 (9.2 per 100 participants).
-
Hydrojet: 3/25 (12.0 per 100 participants).
-
Radiofrequency dissecting sealer: 16/89 (18.0 per 100 participants).
-
Stapler: 12/50 (24.0 per 100 participants)..
Based on the DIC, we chose the fixed‐effect model for all comparisons involving two or more trials. The number of serious adverse events was higher in the radiofrequency dissecting sealer group than in the clamp‐crush method group (rate ratio 3.64, 95% CrI 1.25 to 13.97; 130 participants; 2 studies; low‐quality evidence: downgraded by one point for unclear or high risk of bias in the trials and one more point for small sample size). There was no evidence of differences in other comparisons.
Adverse events (proportion)
Eight trials reported the proportion of participants experiencing adverse events (Rau 2001; Takayama 2001; Arita 2005; Koo 2005; Smyrniotis 2005; Doklestic 2012; Muratore 2014; Rahbari 2014). They used six treatments in 695 participants. The unadjusted proportions of participants experiencing adverse events are as follows.
-
Clamp‐crush method: 116/307 (37.8%).
-
Cavitron ultrasonic surgical aspirator: 60/141 (42.6%).
-
Hydrojet: 3/31 (9.7%).
-
Radiofrequency dissecting sealer: 37/110 (33.6%).
-
Sharp transection method: 17/41 (41.5%).
-
Stapler: 31/65 (47.7%).
Direct comparison
Based on the DIC, we chose the fixed‐effect model for all comparisons involving two or more trials. There was no evidence of differences in adverse events (proportion) for any of the comparisons.
Network meta‐analysis
We show the network plots in Figure 10. Based on the DIC, we chose the random‐effects model. The between‐study standard deviation was 2.44. There was no evidence of differences in the proportion of participants experiencing adverse events for any of the comparisons. We show the probability of each treatment being best, second best, third best, and so on in Figure 11 and the cumulative probability of a treatment being best in Figure 12.

The network plot showing the comparisons in the trials included in the comparison of methods for parenchymal transection in which network meta‐analysis was performed. The size of the node (circle) provides a measure of the number of trials in which the particular treatment was included as one of the arms. The thickness of the line provides a measure of the number of direct comparisons between two nodes (treatments).
CUSA: cavitron ultrsonic surgical aspirator; RFDS: radiofrequency dissecting sealer.

Probability of best treatment: probability of being best, second best, third best, etc. for each treatment for adverse events (proportion) (parenchymal transection methods). A probability of more than 90% is a reliable indicator that a treatment is best with regards to the specific outcome. A probability of less than 90% is less reliable. None of the treatments have a 90% probability of being best treatment.
CUSA: cavitron ultrsonic surgical aspirator; RFDS: radiofrequency dissecting sealer.

Cumulative probability of being best treatment: cumulative probability of being best for each treatment for parenchymal transection methods. Rank 1 indicates the probability that a treatment is best, rank 2 indicates the probability that a treatment is in the two best treatments, rank 3 indicates the probability that a treatment is in the three best treatments, and so on.
CUSA: cavitron ultrsonic surgical aspirator; RFDS: radiofrequency dissecting sealer.
Direct evidence compared to network meta‐analysis
Figure 13 shows the information on direct evidence compared to network meta‐analysis. There does not appear to be any discrepancy between the direct and indirect estimates, although the indirect estimates have wide credible intervals. Direct evidence appears to be preferable over indirect evidence and network meta‐analysis based on the quality of evidence.

Parenchymal transection: adverse events (proportion)
Forest plot of the comparisons in which direct and indirect estimates were available. There does not appear to be any discrepancy between the direct and indirect estimates, although the indirect estimates have wide credible intervals.
Direct evidence appears to be preferable over indirect evidence and network meta‐analysis based on the quality of evidence.
CUSA: cavitron ultrsonic surgical aspirator; RFDS: radiofrequency dissecting sealer.
1Risk of bias was unclear or high in the trial(s) (downgraded by 1 point).
2Sample size was low (downgraded by 1 point).
3Confidence intervals spanned no effect and clinically significant effect (downgraded by 1 point).
4There was substantial or considerable heterogeneity (downgraded by 2 points).
Adverse events (number)
Seven trials reported the number of adverse events (Takayama 2001; Arita 2005; Lesurtel 2005; Smyrniotis 2005; Lupo 2007; Ikeda 2009; Savlid 2013). They used six treatments in 639 participants. The unadjusted rates of adverse events (number) are as follows.
-
Clamp‐crush method: 52/233 (22.3 per 100 participants).
-
Cavitron ultrasonic surgical aspirator: 52/141 (36.9 per 100 participants).
-
Hydrojet: 7/25 (28.0 per 100 participants).
-
Radiofrequency dissecting sealer: 45/149 (30.2 per 100 participants).
-
Sharp transection method: 18/41 (43.9 per 100 participants)
-
Stapler: 22/50 (44.0 per 100 participants).
Direct comparison
Based on the DIC, we chose the fixed‐effect model for all comparisons involving two or more trials. There was evidence for a higher adverse events (number) with radiofrequency dissecting sealer than with the clamp‐crush method (rate ratio 1.85, 95% CrI 1.07 to 3.26; 250 participants; 3 studies). There was no evidence of differences in the number of adverse events for any of the comparisons.
Network meta‐analysis
Figure 10 shows the network plots. Based on the DIC, we chose the fixed‐effect model. There was evidence of more adverse events (number) with the radiofrequency dissecting sealer method than with the clamp‐crush method (rate ratio 1.84, 95% CrI 1.13 to 3.06). There was no evidence of differences in other comparisons. Figure 14 shows the probability of each treatment being best, second best, third best, and so on, and Figure 12 shows the cumulative probability of a treatment being best.
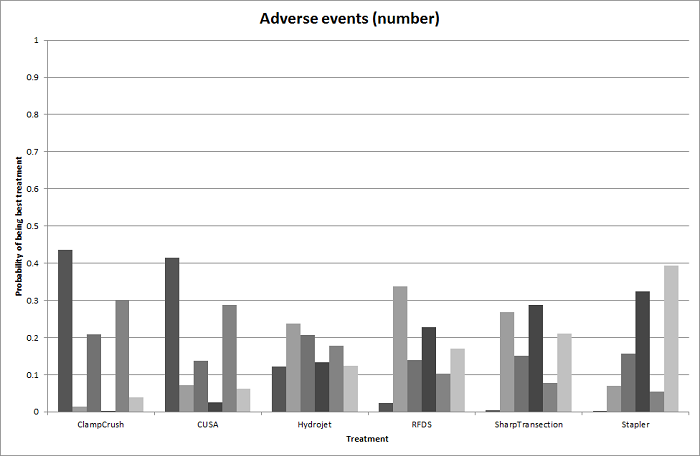
Probability of best treatment: probability of being best, second best, third best, etc. for each treatment for adverse events (number) (parenchymal transection methods). A probability of more than 90% is a reliable indicator that a treatment is best with regards to the specific outcome. A probability of less than 90% is less reliable. None of the treatments have a 90% probability of being best treatment.
CUSA: cavitron ultrsonic surgical aspirator; RFDS: radiofrequency dissecting sealer.
Direct evidence compared to network meta‐analysis
Figure 15 shows the information on direct evidence compared to network meta‐analysis. There does not appear to be any discrepancy between the direct and indirect estimates. Direct evidence appears to be preferable over indirect evidence and network meta‐analysis based on the quality of evidence.

Parenchymal transection: adverse events (number)
Forest plot of the comparisons in which direct and indirect estimates were available. There does not appear to be any discrepancy between the direct and indirect estimates.
Direct evidence appears to be preferable over indirect evidence and network meta‐analysis based on the quality of evidence.
CUSA: cavitron ultrsonic surgical aspirator; RFDS: radiofrequency dissecting sealer.
1Risk of bias was unclear or high in the trial(s) (downgraded by 1 point).
2Sample size was low (downgraded by 1 point).
3Confidence intervals spanned no effect and clinically significant effect (downgraded by 1 point).
Health‐related quality of life
None of the trials reported this outcome at any time point.
Blood transfusion requirements
Blood transfusion (proportion)
Eight trials reported the proportion of participants requiring a blood transfusion (Takayama 2001; Arita 2005; Lesurtel 2005; Smyrniotis 2005; Lupo 2007; Ikeda 2009; Doklestic 2012; Muratore 2014). They used five treatments in 699 participants. The unadjusted proportions of blood transfusion (proportion) are as follows.
-
Clamp‐crush method: 46/303 (15.2%).
-
Cavitron ultrasonic surgical aspirator: 12/111 (10.8%).
-
Hydrojet: 8/25 (32.0%).
-
Radiofrequency dissecting sealer: 37/219 (16.9%).
-
Sharp transection method: 13/41 (31.7%).
Direct comparison
Based on the DIC, we chose the fixed‐effect model for comparisons involving two or more trials. There was no evidence of differences in the proportion of participants requiring a blood transfusion for any of the comparisons.
Network meta‐analysis
Figure 10 shows the network plots. Based on the DIC, we chose the fixed‐effect model. There was no evidence of differences in the proportion of participants requiring a blood transfusion for any of the comparisons. Figure 16 shows the probability of each treatment being best, second best, third best, and so on. Figure 12 shows the cumulative probability of a treatment being best.

Probability of best treatment: probability of being best, second best, third best, etc. for each treatment for blood transfusion (proportion) (parenchymal transection methods). A probability of more than 90% is a reliable indicator that a treatment is best with regards to the specific outcome. A probability of less than 90% is less reliable. None of the treatments have a 90% probability of being best treatment.
CUSA: cavitron ultrsonic surgical aspirator; RFDS: radiofrequency dissecting sealer.
Direct evidence compared to network meta‐analysis
Figure 17 shows the information on direct evidence compared to network meta‐analysis. There does not appear to be any discrepancy between the direct and indirect estimates, although the indirect estimates have wide credible intervals for some comparisons. There was little apparent difference in the quality of evidence between direct, indirect estimates, and network meta‐analysis; so, we could not choose one estimate over the others based on the quality of evidence.
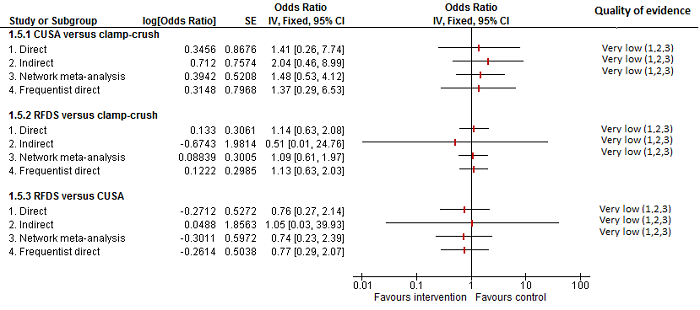
Parenchymal transection:blood transfusion (proportion)
Forest plot of the comparisons in which direct and indirect estimates were available. There does not appear to be any discrepancy between the direct and indirect estimates, although the indirect estimates have wide credible intervals for some comparisons. There was little apparent difference in the quality of evidence between direct, indirect estimates, and network meta‐analysis; so, we could not choose one estimate over the others based on the quality of evidence.
CUSA: cavitron ultrsonic surgical aspirator; RFDS: radiofrequency dissecting sealer.
1Risk of bias was unclear or high in the trial(s) (downgraded by 1 point).
2Sample size was low (downgraded by 1 point).
3Confidence intervals spanned no effect and clinically significant effect (downgraded by 1 point).
Blood transfusion (red blood cells)
Four trials reported blood transfusion quantity (in red blood cells) (Rau 2001; Smyrniotis 2005; Savlid 2013; Rahbari 2014). They used five treatments in 373 participants. The median or mean blood transfusion quantity (red blood cells) reported for each treatment are as follows.
-
Clamp‐crush method: 0.00 and 1.20 units (two trials only).
-
Cavitron ultrasonic surgical aspirator: 2.48 and 4.00 units (two trials only).
-
Hydrojet: 1.50 units (one trial only).
-
Sharp transection method: 0.00 units (one trial only).
-
Stapler: 1.10 and 4.00 units (two trials only).
The blood transfusion quantity (red blood cells) was lower in the hydrojet group than in the cavitron ultrasonic surgical aspirator group (MD −0.98 units, 95% CrI −1.90 to −0.06; 61 participants; 1 study). There was no evidence of difference in blood transfusion quantity (red blood cells) in the remaining comparisons. Either mean or standard deviation or both were not available in two trials (Smyrniotis 2005; Savlid 2013). Excluding these two trials did not change the conclusion.
Blood transfusion (platelets)
None of the trials reported this outcome.
Blood transfusion (fresh frozen plasma)
One trial reported blood transfusion quantity (fresh frozen plasma) (Rahbari 2014). It used two treatments in 130 participants in these studies. The mean blood transfusion quantity (fresh frozen plasma) reported for each treatment are as follows.
-
Clamp‐crush method: 0.5 units.
-
Stapler: 0.3 units.
There was no evidence of differences in blood transfusion quantity (fresh frozen plasma) between the groups (MD −0.20 units, 95% CrI −0.66 to 0.26; 130 participants;1 study).
Blood transfusion (cryoprecipitate)
None of the trials reported this outcome.
Blood loss
Ten trials reported blood loss (Rau 2001; Takayama 2001; Arita 2005; Koo 2005; Smyrniotis 2005; Ikeda 2009; Doklestic 2012; Savlid 2013; Muratore 2014; Rahbari 2014). They used six treatments in 915 participants. The median or mean blood loss reported for each treatment are as follows.
-
Clamp‐crush method: 0.56 L (range 0.2 to 1.05).
-
Cavitron ultrasonic surgical aspirator: 0.875 L (range 0.15 to 1.797).
-
Hydrojet: 1.479 L (range 1.479 to 1.479).
-
Radiofrequency dissecting sealer: 0.47 L (range 0.15 to 0.665).
-
Sharp transection method: 0.5 L (range 0.5 to 0.5).
-
Stapler: 0.9625 L (range 0.925 to 1).
Of the 10 trials, 8 did not provide either the mean, the standard deviation or both (Takayama 2001; Arita 2005; Smyrniotis 2005; Ikeda 2009; Doklestic 2012; Savlid 2013; Muratore 2014; Rahbari 2014), so we performed the analysis only for two trials (Rau 2001; Koo 2005). There was no evidence of differences in blood loss for any of the comparisons.
Major blood loss (proportion)
None of the trials reported this outcome.
Hospital stay
Total hospital stay
Ten trials reported hospital stay (Doklestic 2012; Takayama 2001; Arita 2005; Lesurtel 2005; Smyrniotis 2005; Lupo 2007; Ikeda 2009; Savlid 2013; Muratore 2014; Rahbari 2014). They used six treatments in 929 participants. The mean and range of the mean hospital stays reported for each treatment are as follows.
-
Clamp‐crush method: 11 d (range 7 to 18).
-
Cavitron ultrasonic surgical aspirator: 11.95 d (range 8.5 to 17).
-
Hydrojet: 9 d (one trial only).
-
Radiofrequency dissecting sealer: 10.5 d (range 8 to 16).
-
Sharp transection method: 11 d (one trial only).
-
Stapler: 10 to 14.9 d (two trials only).
All 10 trials failed to provide the mean, standard deviation or both. There was no evidence of differences in total hospital stay for any of the comparisons.
ITU stay
Four trials reported ITU stay (Lesurtel 2005; Smyrniotis 2005; Doklestic 2012; Rahbari 2014). They used six treatments in 347 participants. The median ITU stays reported for each treatment are as follows.
-
Clamp‐crush method: 1 d (range 0 to 1.5).
-
Cavitron ultrasonic surgical aspirator: 0 and 1 d (two trials only).
-
Hydrojet: 1 d (one trial only).
-
Radiofrequency dissecting sealer: 1 d (two trials only).
-
Sharp transection method: 1 d (one trial only).
-
Stapler: 0 d (one trial only).
Either the mean, the standard deviation, or both were not available in all the four trials. There was no evidence of differences in ITU stay for any of the comparisons.
Operating time
Six trials reported operating time (Koo 2005; Smyrniotis 2005; Lupo 2007; Doklestic 2012; Savlid 2013; Rahbari 2014). They used five treatments in 472 participants. The median or mean operating time reported for each treatment are as follows.
-
Clamp‐crush method: 231 min (range 211 to 278).
-
Cavitron ultrasonic surgical aspirator: 270 min (range 259 to 298).
-
Radiofrequency dissecting sealer: 292 and 295 min (two trials only).
-
Sharp transection method: 205 min (one trial only).
-
Stapler: 190 and 272 min (two trials only).
Based on the DIC, we chose the fixed‐effect model when there were two or more studies in a comparison. There was no evidence of differences in operating time in any of the comparisons. We imputed either the mean or the standard deviation in two trials (Lupo 2007; Doklestic 2012). Excluding this trial did not alter the results.
Time needed to return to work
None of the trials reported this outcome.
Difference between Bayesian and frequentist meta‐analysis
The interpretation of information and conclusions did not change upon use of the frequentist meta‐analysis except for the following.
Adverse events (number): the number of adverse events was higher in the radiofrequency dissecting sealer group than in the group receiving the clamp‐crush method with Bayesian meta‐analysis (rate ratio 1.85, 95% CrI 1.07 to 3.26; 250 participants; 3 studies), while there was no evidence of difference in adverse events (number) in any comparisons by frequentist meta‐analysis (rate ratio 1.67, 95% CI 0.95 to 2.94; 250 participants; 3 studies).
Operating time: there was no evidence of difference in operating time in any comparisons by Bayesian meta‐analysis (stapler resection versus clamp‐crush method: MD −27.99 min, 95% CrI −56.91 to 1.02; 130 participants; 1 study), while the operating time was lower in stapler resection than clamp‐crush method with frequentist meta‐analysis (MD −31.00 min, 95% CI −60.40 to −1.60; 130 participants; 1 study).
Overall summary
There was no evidence of differences between different parenchymal transection methods in any of the reported outcomes of interest for this review other than the following.
-
The adverse events (number) was higher with the radiofrequency dissecting sealer than with the clamp‐crush method (rate ratio 1.85, 95% CrI 1.07 to 3.26; 250 participants; 3 studies) (Bayesian analysis only: both direct and network meta‐analysis).
-
The blood transfusion quantity (red blood cells) was lower in the hydrojet group than with the cavitron ultrasonic surgical aspirator group (MD −0.98 units, 95% CrI −1.90 to −0.06; 61 participants; 1 study).
-
The operating time was lower with stapler resection than with the clamp‐crush method with frequentist meta‐analysis (MD −31.00 min, 95% CI −60.40 to −1.60; 130 participants; 1 study) (frequentist analysis only).
Methods of dealing with cut surface
Seventeen trials compared different methods of dealing with cut surface (Kohno 1992; Liu 1993; Noun 1996; Chapman 2000; Frilling 2005; Franceschi 2006; Figueras 2007; Fischer 2011; Gugenheim 2011; De Boer 2012; Porte 2012; Kakaei 2013; Koea 2013; Ollinger 2013; Bektas 2014; Genyk 2014; Moench 2014). We did not perform network meta‐analysis since direct comparison and indirect comparison effect estimates (which would enable assessment of inconsistency) were not available for any of the outcomes.
Quality of evidence
The quality of evidence was very low for all the outcomes and comparisons unless specifically indicated within the results. This was because of unclear or high risk of bias in the trials (downgraded by one point), imprecision due to small sample size (downgraded by one point), and wide credible intervals (downgraded by one point) for all outcomes with very low quality of evidence. In addition, some of the pair‐wise comparisons in blood transfusion proportion and blood transfusion (red blood cells) were downgraded by two points because of the presence of substantial or considerable heterogeneity.
Mortality
Mortality (perioperative)
Ten trials reported perioperative mortality (Kohno 1992; Chapman 2000; Frilling 2005; Figueras 2007; Fischer 2011; Gugenheim 2011; De Boer 2012; Ollinger 2013; Bektas 2014; Moench 2014). They used seven interventions in 1271 participants. The unadjusted proportions of perioperative mortality are as follows.
-
Control: 4/339 (1.2%).
-
Argon beam: 6/114 (5.3%).
-
Collagen: 4/122 (3.3%).
-
Fibrin sealant: 23/485 (4.7%).
-
Fibrin sealant plus collagen: 6/150 (4.0%).
-
Oxidised cellulose: 1/32 (3.1%).
-
Plasmajet: 2/29 (6.9%).
Based on the DIC, we chose the fixed‐effect model when there were two or more trials. There was no evidence of differences in perioperative mortality for any of the comparisons.
Mortality (longest follow‐up)
None of the trials reported this outcome.
Adverse events
Serious adverse events (proportion)
Seven trials reported the proportion of participants experiencing serious adverse events (Noun 1996; Fischer 2011; Gugenheim 2011; De Boer 2012; Ollinger 2013; Bektas 2014; Moench 2014). They used six interventions in 798 participants. The unadjusted proportions of serious adverse events (proportion) are as follows.
-
Control: 43/231 (18.6%).
-
Argon beam: 14/52 (26.9%).
-
Collagen: 16/62 (25.8%).
-
Fibrin sealant: 90/392 (23.0%).
-
Oxidised cellulose: 10/32 (31.3%).
-
Plasmajet: 1/29 (3.4%).
Based on the DIC, we chose the fixed‐effect model when there were two or more trials. There was no evidence of differences in serious adverse events (proportion) for any of the comparisons.
Serious adverse events (number)
Six trials reported the number of serious adverse events (Kohno 1992; Frilling 2005; Figueras 2007; Kakaei 2013; Bektas 2014; Moench 2014). They used seven interventions in 725 participants. The unadjusted rates of serious adverse events (number) are as follows.
-
Control: 39/185 (21.1 per 100 participants).
-
Argon beam: 4/62 (6.5 per 100 participants).
-
Collagen: 30/93 (32.3 per 100 participants).
-
Cyanoacrylate: 1/15 (6.7 per 100 participants).
-
Fibrin sealant: 72/205 (35.1 per 100 participants).
-
Fibrin sealant plus collagen: 29/150 (19.3 per 100 participants).
-
Oxidised cellulose: 4/15 (26.7 per 100 participants).
Based on the DIC, we chose the fixed‐effect model when there were two or more trials. The serious adverse events (number) was higher in the fibrin sealant group than in the argon beam group (rate ratio 4.81, 95% CrI 1.73 to 17.5; 121 participants; 1 study; low‐quality evidence: downgraded one point for unclear or high risk of bias in the trial and one more point for small sample size). There was no evidence of differences in other comparisons.
Adverse events (proportion)
Nine trials reported the proportion of participants experiencing adverse events (Noun 1996; Frilling 2005; Figueras 2007; Fischer 2011; De Boer 2012; Ollinger 2013; Bektas 2014; Genyk 2014; Moench 2014). They used six interventions in 1385 participants. The unadjusted proportions of adverse events (proportion) are as follows.
-
Control: 166/381 (43.6%).
-
Argon beam: 52/114 (45.6%).
-
Collagen: 38/62 (61.3%).
-
Fibrin sealant: 227/536 (42.4%).
-
Fibrin sealant plus collagen: 35/150 (23.3%).
-
Oxidised cellulose: 27/142 (19.0%).
Based on the DIC, we chose the fixed‐effect model when there were two or more trials. There was no evidence of differences in adverse events (proportion) for any of the comparisons.
Adverse events (number)
Five trials reported the number of adverse events (Kohno 1992; Frilling 2005; Kakaei 2013; Bektas 2014; Moench 2014). They used six interventions in 425 participants. The unadjusted rates of adverse events (number) are as follows.
-
Control: 89/35 (254.3 per 100 participants).
-
Argon beam: 47/62 (75.8 per 100 participants).
-
Collagen: 135/93 (145.2 per 100 participants).
-
Cyanoacrylate: 2/15 (13.3 per 100 participants).
-
Fibrin sealant: 302/205 (147.3 per 100 participants).
-
Oxidised cellulose: 7/15 (46.7 per 100 participants).
Based on the DIC, we chose the fixed‐effect model when there were two or more trials. There was no evidence of differences in adverse events (number) for any of the comparisons.
Health‐related quality of life
None of the trials reported this outcome at any time point.
Blood transfusion requirements
Blood transfusion (proportion)
Four trials reported the proportion of participants requiring a blood transfusion (Noun 1996; Figueras 2007; De Boer 2012; Kakaei 2013). They used five interventions in 737 participants. The unadjusted proportions of participants requiring a blood transfusion are as follows.
-
Control: 62/348 (17.8%).
-
Cyanoacrylate: 2/15 (13.3%).
-
Fibrin sealant: 38/209 (18.2%).
-
Fibrin sealant plus collagen: 40/150 (26.7%).
-
Oxidised cellulose: 4/15 (26.7%).
Based on the DIC, we chose the fixed‐effect model when there were two or more trials. There was no evidence of differences in blood transfusion (proportion) for any of the comparisons.
Blood transfusion (red blood cells)
Five trials reported blood transfusion (red blood cells) (Liu 1993; Noun 1996; Figueras 2007; Kakaei 2013; Ollinger 2013). They used five interventions in 517 participants. The median and range of the mean blood transfusion (red blood cells) reported for each treatment are as follows.
-
Control: 3.50 units (range 0.31 to 8.13).
-
Cyanoacrylate: 2.13 units (one trial only).
-
Fibrin sealant: 4.30 units (range 3.00 to 5.94).
-
Fibrin sealant plus collagen: 0.30 units (one trial only).
-
Oxidised cellulose: 1.86 and 4.35 units (two trials only).
Based on the DIC, we chose the fixed‐effect model for the comparison of fibrin sealant versus control and the random‐effects model for the comparison of oxidised cellulose versus fibrin sealant. The remaining comparisons had only one trial. The blood transfusion quantity (red blood cells) was lower in the fibrin sealant group than in the control (MD −0.53 units, 95% CrI −1.00 to −0.07; 122 participants; 2 studies). The blood transfusion quantity (red blood cells) was higher in the fibrin sealant group than the cyanoacrylate group (MD 2.20 units; 95% CrI 1.59 to 2.81; 30 participants; 1 study; low‐quality evidence: downgraded one point for unclear or high risk of bias in the trial and one more point for small sample size). There was no evidence of differences in other comparisons.
Blood transfusion (platelets)
None of the trials reported this outcome.
Blood transfusion (fresh frozen plasma)
Two trials reported blood transfusion quantity (fresh frozen plasma) (Kakaei 2013; Ollinger 2013). They used three treatments in 95 participants. The median blood transfusion quantities (fresh frozen plasma) reported for each treatment are as follows.
-
Cyanoacrylate: 0.80 units (one trial only).
-
Fibrin sealant: 0.00 and 17.64 units (two trials only).
-
Oxidised cellulose: 0.53 and 20.12 units (two trials only).
Based on the DIC, we chose the fixed‐effect model when there were two or more trials. The blood transfusion quantity (fresh frozen plasma) was lower in the fibrin sealant group than in the cyanoacrylate group (MD −0.81 units, 95% CrI −1.04 to −0.62; 30 participants; 1 study). The blood transfusion quantity (fresh frozen plasma) was higher with oxidised cellulose than with fibrin sealant (MD 0.53 units, 95% CrI 0.36 to 0.71; 80 participants; 2 studies). There was no evidence of differences in other comparisons.
Blood transfusion (cryoprecipitate)
None of the trials reported this outcome.
Blood loss
Five trials reported blood loss (Kohno 1992; Liu 1993; Figueras 2007; De Boer 2012; Kakaei 2013). They usedsix interventions in 757 participants. The median and range of the mean blood loss reported for each treatment are as follows.
-
Control: 0.82 L (range 0.55 to 4.052).
-
Collagen: 1.027 L (one trial only).
-
Cyanoacrylate: 0.653 L (one trial only).
-
Fibrin sealant: 0.9325 L (range 0.675 to 3.047).
-
Fibrin sealant plus collagen: 0.884 L (one trial only).
-
Oxidised cellulose: 0.573 L (one trial only).
Based on the DIC, we chose the fixed‐effect model when there were two or more trials. There was no evidence of differences in blood loss for any of the comparisons. Excluding the trial for which the mean and standard deviation were not available did not alter the conclusions (De Boer 2012).
Major blood loss (proportion)
None of the trials reported this outcome.
Hospital stay
Total hospital stay
Four trials reported hospital stay (Noun 1996; Figueras 2007; Kakaei 2013; Ollinger 2013). They used five interventions in 477 participants. The median and range of the mean hospital stay reported for each treatment are as follows.
-
Control: 11.3 d and 12.6 d (two trials only).
-
Cyanoacrylate: 8.8 d (one trial only).
-
Fibrin sealant: 10.8 d (range 7.5 to 18.5).
-
Fibrin sealant plus collagen: 13.3 d (one trial only).
-
Oxidised cellulose: 8.1 d, 15.2 d (two trials only).
Based on the DIC, we chose the fixed‐effect model when there were two or more trials. There was no evidence of differences in hospital stay for any of the comparisons.
ITU stay
One trial (50 participants) reported ITU stay (Ollinger 2013). The median ITU stay reported for each treatment are as follows.
-
Fibrin sealant: 2.2 d (one trial only).
-
Oxidised cellulose: 2.8 d (one trial only).
There was no evidence of differences in ITU stay for any of the comparisons.
Operating time
Five trials reported operating time (Kohno 1992; Liu 1993; Noun 1996; Figueras 2007; Ollinger 2013). They used five interventions in 534 participants. The median and range of the mean operating time reported for each treatment are as follows.
-
Control: 263 min (range 258 to 343).
-
Collagen: 169 min (one trial only).
-
Fibrin sealant: 245 min (range 165 to 295).
-
Fibrin sealant plus collagen: 282 min (one trial only).
-
Oxidised cellulose: 253 min (one trial only).
Based on the DIC, we chose the fixed‐effect model when there were two or more trials. The operating time was higher in the group receiving fibrin sealant and collagen than in the control group (MD 19.72 min, 95% CrI 2.93 to 36.57; 300 participants; 1 study). There was no evidence of differences in other comparisons.
Time needed to return to work
None of the trials reported this outcome.
Difference between Bayesian and frequentist meta‐analysis
The interpretation of information and conclusions did not alter by using the frequentist meta‐analysis.
Overall summary
There was no evidence of differences between different methods of dealing with cut surface in any of the reported outcomes of interest for this review other than the following.
-
The serious adverse events (number) was higher in the fibrin sealant group than in the argon beam group (rate ratio 4.81, 95% CrI 1.73 to 17.5; 121 participants; 1 study).
-
The blood transfusion quantity (red blood cells) was lower in the fibrin sealant group than in the control (MD −0.53 units, 95% CrI −1.00 to −0.07; 122 participants; 2 studies). The blood transfusion quantity (red blood cells) was higher in fibrin sealant than cyanoacrylate (MD 2.20 units; 95% CrI 1.59 to 2.81; 30 participants; 1 study).
-
The blood transfusion quantity (fresh frozen plasma) was lower with fibrin sealant than with cyanoacrylate (MD −0.81 units, 95% CrI −1.04 to −0.62; 30 participants; 1 study). The blood transfusion quantity (fresh frozen plasma) was higher with oxidised cellulose than with fibrin sealant (MD 0.53 units, 95% CrI 0.36 to 0.71; 80 participants; 2 studies).
-
The operating time was higher with fibrin sealant and collagen than with control (MD 19.72 min, 95% CrI 2.93 to 36.57; 300 participants; 1 study).
Methods of vascular occlusion
Eighteen trials compared different methods of vascular occlusion (Belghiti 1996; Clavien 1996; Man 1997; Belghiti 1999; Wu 2002; Capussotti 2003; Man 2003; Chouker 2004; Figueras 2005; Capussotti 2006; Chen 2006; Liang 2009; Dayangac 2010; Pietsch 2010; Lee 2012; Park 2012; Ni 2013; Si‐Yuan 2014). We performed network meta‐analysis only for serious adverse events (proportion), adverse events (proportion), blood transfusion (proportion), and blood transfusion quantity (red blood cells) since direct comparison and indirect comparison effect estimates (which would enable assessment of inconsistency) were not available for the other outcomes. We present only direct comparison results for other outcomes.
Quality of evidence
The quality of evidence was very low for all the outcomes and comparisons unless specifically indicated within the results. This was because of unclear or high risk of bias in the trials (downgraded by one point), imprecision due to small sample size (downgraded by one point), and wide credible intervals (downgraded by one point) for all outcomes with very low quality of evidence. In addition, we downgraded the evidence for blood transfusion quantity (red blood cells), blood loss, and operating time by two points because of the presence of substantial or considerable heterogeneity in the pair‐wise comparison or in the network.
Mortality
Mortality (perioperative)
Fourteen trials reported perioperative mortality (Belghiti 1996; Clavien 1996; Man 1997; Belghiti 1999; Wu 2002; Capussotti 2003; Man 2003; Figueras 2005; Capussotti 2006; Chen 2006; Liang 2009; Lee 2012; Ni 2013; Si‐Yuan 2014). They used seven treatments in 1196 participants. The unadjusted proportions of perioperative mortality are as follows.
-
Control: 5/203 (2.5%).
-
Continuous hepatic vascular exclusion: 0/88 (0.0%).
-
Continuous portal triad clamping: 6/290 (2.1%).
-
Continuous selective hepatic vascular exclusion: 0/80 (0.0%).
-
Continuous selective portal triad clamping: 0/100 (0.0%).
-
Intermittent portal triad clamping: 3/364 (0.8%).
-
Intermittent selective portal triad clamping: 1/71 (1.4%).
Based on the DIC, we chose the fixed‐effect model for all comparisons with two or more trials. There was no evidence of differences in perioperative mortality for any of the comparisons.
Mortality (longest follow‐up)
None of the trials reported this outcome.
Adverse events
Serious adverse events (proportion)
Eight trials reported the proportion of participants experiencing serious adverse events (Capussotti 2003; Capussotti 2006; Chen 2006; Liang 2009; Lee 2012; Park 2012; Ni 2013; Si‐Yuan 2014). They used six treatments in 815 participants. The unadjusted proportions of participants experiencing serious adverse events are as follows.
-
Control: 15/151 (9.9%).
-
Continuous hepatic vascular exclusion: 3/60 (5.0%).
-
Continuous portal triad clamping: 30/216 (13.9%).
-
Continuous selective hepatic vascular exclusion: 0/80 (0.0%).
-
Continuous selective portal triad clamping: 13/100 (13.0%).
-
Intermittent portal triad clamping: 23/208 (11.1%).
Direct comparison
Based on the DIC, we chose the fixed‐effect model for all comparisons with two or more trials. The serious adverse events (proportion) was lower in the group receiving continuous selective portal triad clamping than in the continuous portal triad clamping group (OR 0.42, 95% CrI 0.18 to 0.96; 120 participants; 1 study). There was no evidence of differences in other comparisons.
Network meta‐analysis
The network plots are shown in Figure 18. Based on the DIC, we chose the fixed‐effect model. There was no evidence of differences in adverse events (proportion) for any of the comparisons. Figure 19 shows the probability of each treatment being best, second best, third best, and so on. Figure 20 shows the cumulative probability of a treatment being best.
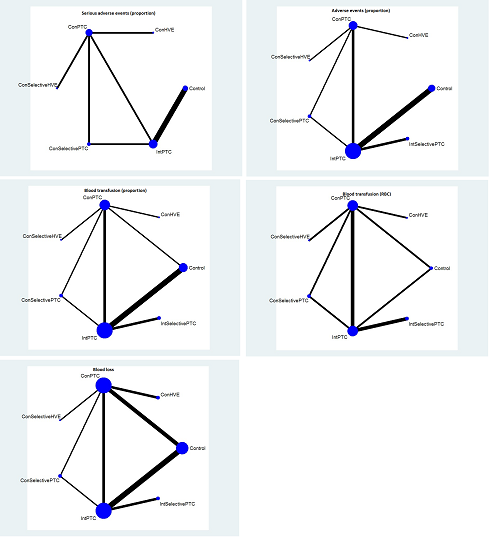
The network plot showing the comparisons in the trials included in the comparison of methods for vascular occlusion in which network meta‐analysis was performed. The size of the node (circle) provides a measure of the number of trials in which the particular treatment was included as one of the arms. The thickness of the line provides a measure of the number of direct comparisons between two nodes (treatments).
Con: continuous; Int: intermittent; HVE: hepatic vascular exclusion; PTC: portal triad clamping; RBC: red blood cells.
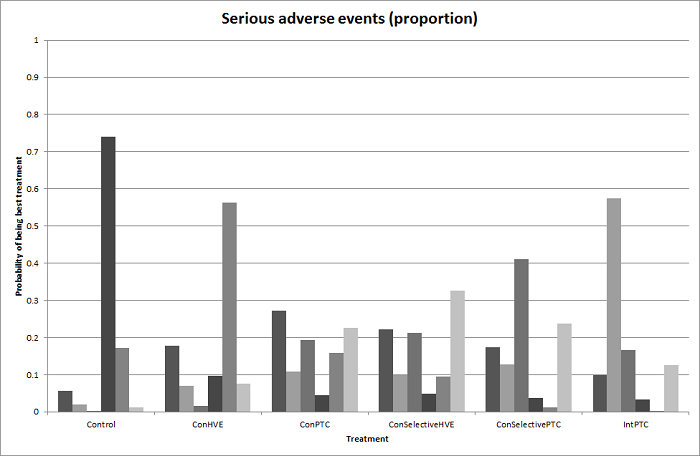
Probability of best treatment: probability of being best, second best, third best, etc. for each treatment for serious adverse events (proportion) (vascular occlusion methods). A probability of more than 90% is a reliable indicator that a treatment is best with regards to the specific outcome. A probability of less than 90% is less reliable. None of the treatments have a 90% probability of being best treatment.
Con: continuous; Int: intermittent; HVE: hepatic vascular exclusion; PTC: portal triad clamping.

Cumulative probability of being best treatment: cumulative probability of being best for each treatment for vascular occlusion methods. Rank 1 indicates the probability that a treatment is best, rank 2 indicates the probability that a treatment is in the two best treatments, rank 3 indicates the probability that a treatment is in the three best treatments, and so on.
Con: continuous; Int: intermittent; HVE:hepatic vascular exclusion; PTC: portal triad clamping.
Direct evidence compared to network meta‐analysis
Figure 21 shows the information on direct evidence compared to network meta‐analysis. Although there is overlap of credible intervals, the mean indirect estimate seems to be quite different from the direct estimate (sometimes suggesting an opposite effect), thus suggesting that there may be discrepancies between direct and indirect estimates. There was little apparent difference in the quality of evidence between direct, indirect estimates, and network meta‐analysis; so, we could not choose one estimate over the others based on the quality of evidence.
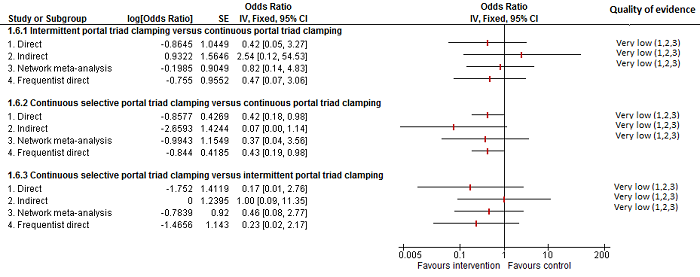
Methods of vascular occlusion: serious adverse events (proportion)
Forest plot of the comparisons in which direct and indirect estimates were available. Although there is overlap of confidence intervals, the mean indirect estimate seems to be quite different from the direct estimate (sometimes, suggesting an opposite effect), thus suggesting that there may be discrepancies between direct and indirect estimates.
There was little apparent difference in the quality of evidence between direct, indirect estimates, and network meta‐analysis; so, we could not choose one estimate over the others based on the quality of evidence.
1Risk of bias was unclear or high in the trial(s) (downgraded by 1 point).
2Sample size was low (downgraded by 1 point).
3Confidence intervals spanned no effect and clinically significant effect (downgraded by 1 point).
Serious adverse events (number)
Five trials reported the number of serious adverse events (Belghiti 1996; Man 1997; Belghiti 1999; Wu 2002; Figueras 2005). They used five treatments in 376 participants. The unadjusted rates of serious adverse events (number) are as follows.
-
Control: 4/50 (8.0 per 100 participants).
-
Continuous hepatic vascular exclusion: 5/28 (17.9 per 100 participants).
-
Continuous portal triad clamping: 9/66 (13.6 per 100 participants).
-
Intermittent portal triad clamping: 16/161 (9.9 per 100 participants).
-
Intermittent selective portal triad clamping: 12/71 (16.9 per 100 participants).
Based on the DIC, we chose the fixed‐effect model for all comparisons with two or more trials. The number of serious adverse events was lower in the intermittent portal triad clamping group than in the continuous portal triad clamping group (rate ratio 0.09, 95% CrI 0.00 to 0.56; 86 participants; 1 study; low‐quality evidence: downgraded one point for unclear or high risk of bias in trial and one more point for small sample size). There was no evidence of differences in other comparisons.
Adverse events (proportion)
Twelve trials reported the proportion of participants experiencing adverse events (Man 1997; Belghiti 1999; Wu 2002; Capussotti 2003; Man 2003; Figueras 2005; Capussotti 2006; Chen 2006; Liang 2009; Lee 2012; Ni 2013; Si‐Yuan 2014). They used seven treatments in 1129 participants. The unadjusted proportions of adverse events (proportion) are as follows.
-
Control: 55/196 (28.1%).
-
Continuous hepatic vascular exclusion: 19/60 (31.7%).
-
Continuous portal triad clamping: 75/258 (29.1%).
-
Continuous selective hepatic vascular exclusion: 9/80 (11.3%).
-
Continuous selective portal triad clamping: 22/100 (22.0%).
-
Intermittent portal triad clamping: 109/364 (29.9%).
-
Intermittent selective portal triad clamping: 22/71 (31.0%).
Direct comparison
Based on the DIC, we chose the fixed‐effect model for comparisons with two or more studies. The proportion of participants experiencing adverse events was lower in the continuous selective portal triad clamping group than in the continuous portal triad clamping group (OR 0.41, 95% CrI 0.18 to 0.90; 120 participants; 1 study). There was no evidence of differences in other comparisons.
Network meta‐analysis
Figure 18 shows the network plots. Based on the DIC, we chose the fixed‐effect model. There was no evidence of differences in the proportion of participants experiencing adverse events for any of the comparisons. Figure 22 shows the probability of each treatment being best, second best, third best, and so on. Figure 20 shows the cumulative probability of a treatment being best.

Probability of best treatment: probability of being best, second best, third best, etc. for each treatment for adverse events (proportion) (vascular occlusion methods). A probability of more than 90% is a reliable indicator that a treatment is best with regards to the specific outcome. A probability of less than 90% is less reliable. None of the treatments have a 90% probability of being best treatment.
Con: continuous; Int: intermittent; HVE: hepatic vascular exclusion; PTC: portal triad clamping.
Direct evidence compared to network meta‐analysis
Figure 23 shows the information on direct evidence compared to network meta‐analysis. There do not appear to be any discrepancies between direct and indirect estimates. Direct evidence appears to be preferable over indirect evidence and network meta‐analysis based on the quality of evidence.

Methods of vascular occlusion: adverse events (proportion)
Forest plot of the comparisons in which direct and indirect estimates were available. There does not appear to be any discrepancies between direct and indirect estimates. Direct evidence appears to be preferable over indirect evidence and network meta‐analysis based on the quality of evidence.
1Risk of bias was unclear or high in the trial(s) (downgraded by 1 point).
2Sample size was low (downgraded by 1 point).
3Confidence intervals spanned no effect and clinically significant effect (downgraded by 1 point).
Adverse events (number)
Six trials reported the number of adverse events (Belghiti 1996; Man 1997; Belghiti 1999; Wu 2002; Figueras 2005; Lee 2012). They used five in 502 participants. The unadjusted rates of adverse events (number) are as follows.
-
Control: 47/113 (41.6 per 100 participants).
-
Continuous hepatic vascular exclusion: 19/28 (67.9 per 100 participants).
-
Continuous portal triad clamping: 28/66 (42.4 per 100 participants).
-
Intermittent portal triad clamping: 97/224 (43.3 per 100 participants).
-
Intermittent selective portal triad clamping: 36/71 (50.7 per 100 participants).
Based on the DIC, we chose the fixed‐effect model for comparisons with two or more studies. There was no evidence of differences in adverse events (number) for any of the comparisons.
Health‐related quality of life
None of the trials reported this outcome at any time point.
Blood transfusion requirements
Blood transfusion (proportion)
Thirteen trials reported the proportion of participants requiring a blood transfusion (Man 1997; Belghiti 1999; Wu 2002; Capussotti 2003; Man 2003; Chouker 2004; Figueras 2005; Capussotti 2006; Chen 2006; Liang 2009; Lee 2012; Ni 2013; Si‐Yuan 2014). They used seven treatments in 1163 participants. The unadjusted proportions of participants requiring a blood transfusion are as follows.
-
Control: 64/211 (30.3%).
-
Continuous hepatic vascular exclusion: 8/60 (13.3%).
-
Continuous portal triad clamping: 71/277 (25.6%).
-
Continuous selective hepatic vascular exclusion: 13/80 (16.3%).
-
Continuous selective portal triad clamping: 21/100 (21.0%).
-
Intermittent portal triad clamping: 101/364 (27.7%).
-
Intermittent selective portal triad clamping: 11/71 (15.5%).
Direct comparison
Based on the DIC, we used the random‐effects model for comparisons with two or more studies for intermittent portal triad clamping versus continuous portal triad clamping and the fixed‐effect model for the remaining comparisons with two or more studies. The proportion of participants requiring a blood transfusion was lower in the continuous portal triad clamping group than in the control (OR 0.06, 95% CrI 0.00 to 0.49; 34 participants; 1 study; low‐quality evidence: downgraded one point for unclear or high risk of bias in trial and one more point for small sample size). The blood transfusion (proportion) was higher in continuous portal triad clamping than continuous hepatic vascular exclusion (OR 5.90, 95% CrI 2.45 to 15.58; 118 participants; 1 study; low‐quality evidence: downgraded one point for unclear or high risk of bias in trial and one more point for small sample size). There was no evidence of differences in other comparisons.
Network meta‐analysis
Figure 18 shows the network plots. Based on the DIC, we chose the random‐effects model. There was no evidence of differences in the proportion of participants requiring a blood transfusion for any of the comparisons. Figure 24 shows the probability of each treatment being best, second best, third best, and so on. Figure 20 shows the cumulative probability of a treatment being the best.
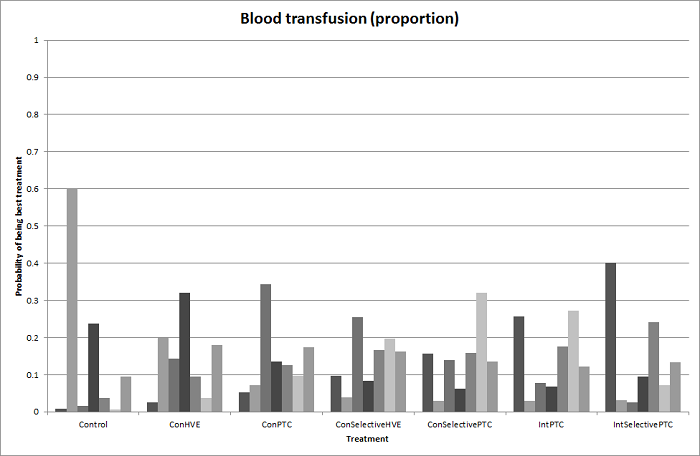
Probability of best treatment: probability of being best, second best, third best, etc. for each treatment for blood transfusion (proportion) (vascular occlusion methods). A probability of more than 90% is a reliable indicator that a treatment is best with regards to the specific outcome. A probability of less than 90% is less reliable. None of the treatments have a 90% probability of being best treatment.
Con: continuous; Int: intermittent; HVE: hepatic vascular exclusion; PTC: portal triad clamping.
Direct evidence compared to network meta‐analysis
Figure 25 shows the information on direct evidence compared to network meta‐analysis. Although the credible intervals overlap, there appears to be some discrepancies between direct and indirect estimates for continuous portal triad clamping versus control, intermittent portal triad clamping versus control, and intermittent portal triad clamping versus continuous portal triad clamping. Direct evidence appears to be preferable over indirect evidence and network meta‐analysis based on the quality of evidence.
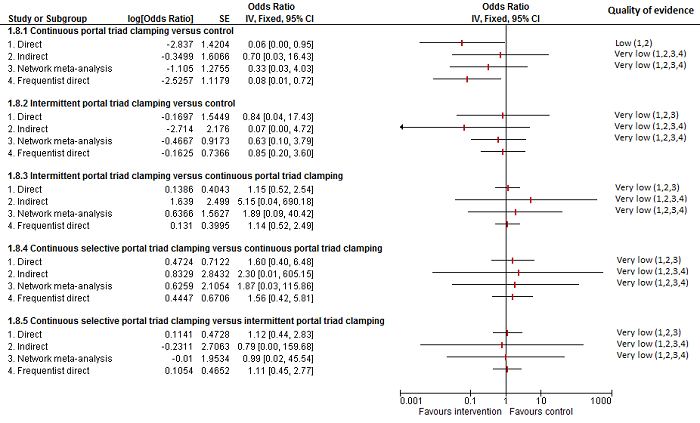
Methods of vascular occlusion: blood transfusion (proportion)
Forest plot of the comparisons in which direct and indirect estimates were available. Although the confidence intervals overlap, there appear to be some discrepancies between direct and indirect estimates for continuous portal triad clamping versus control, intermittent portal triad clamping versus control, and intermittent portal triad clamping versus continuous portal triad clamping. Direct evidence appears to be preferable over indirect evidence and network meta‐analysis based on the quality of evidence.
1Risk of bias was unclear or high in the trial(s) (downgraded by 1 point).
2Sample size was low (downgraded by 1 point).
3Confidence intervals spanned no effect and clinically significant effect (downgraded by 1 point).
4There was substantial or considerable heterogeneity (downgraded by 2 points).
Blood transfusion (red blood cells)
Ten trials reported blood transfusion quantity (red blood cells) (Belghiti 1996; Clavien 1996; Man 1997; Belghiti 1999; Wu 2002; Capussotti 2003; Figueras 2005; Liang 2009; Ni 2013; Si‐Yuan 2014). They usedseven treatments in 786 participants. The median and range of the mean blood transfusion quantity (red blood cells) reported for each treatment are as follows.
-
Control: 1.50 units and 1.90 units (two trials only).
-
Continuous hepatic vascular exclusion: 2.50 units (one trial only).
-
Continuous portal triad clamping: 1.80 units (range 0.50 to 30).
-
Continuous selective hepatic vascular exclusion: 1.00 unit (one trial only).
-
Continuous selective portal triad clamping: 1.20 units and 1.37 units (two trials only).
-
Intermittent portal triad clamping: 0.99125 units (range 0.00 to 2.54).
-
Intermittent selective portal triad clamping: 0.34 units, 2.24 units (two trials only).
Direct comparison
Based on the DIC, we chose the fixed‐effect model for comparisons with two or more studies. The blood transfusion quantity (red blood cells) was lower in the group receiving intermittent portal triad clamping than in the control (−1.50, 95% CrI −2.75 to −0.26; 100 participants; 1 study). The blood transfusion quantity (red blood cells) was lower in the group receiving continuous selective hepatic vascular exclusion than in the continuous portal triad clamping group (MD −1.20 units, 95% CrI −2.37 to −0.04; 160 participants; 1 study). The blood transfusion quantity (red blood cells) was lower in the continuous selective portal triad clamping group than in the continuous portal triad clamping group (MD −0.20 units, 95% CrI −0.31 to −0.09; 120 participants; 1 study). There was no evidence of differences in other comparisons. Exclusion of four trials in which we calculated the mean, standard deviation, or both did not change the conclusions (Man 1997; Belghiti 1999; Wu 2002; Si‐Yuan 2014).
Network meta‐analysis
Figure 18 shows the network plots. Based on the DIC, we chose the fixed‐effect model. Compared with the control group, there was evidence for a lower blood transfusion quantity (red blood cells) with continuous portal triad clamping (MD −1.25 units, 95% CrI −2.39 to −0.10), continuous selective hepatic vascular exclusion (MD −2.45 units, 95% CrI −4.08 to −0.82), continuous selective portal triad clamping (MD −1.45 units, 95% CrI −2.59 to −0.31), intermittent portal triad clamping (MD −1.36 units, 95% CrI −2.48 to −0.23), and intermittent selective portal triad clamping (MD −1.43 units, 95% CrI −2.61 to −0.24). There was no evidence of differences in other comparisons. On excluding the trials in which either mean or standard deviation was not available, there was no evidence of differences in any of the comparisons. Figure 26 shows the probability of each treatment being best, second best, third best, and so on. Figure 20 shows the cumulative probability of a treatment being best.

Probability of best treatment: probability of being best, second best, third best, etc. for each treatment for blood transfusion (red blood cells) (vascular occlusion methods). A probability of more than 90% is a reliable indicator that a treatment is best with regards to the specific outcome. A probability of less than 90% is less reliable. Intermittent selective portal triad clamping has about 90% probability of being best treatment. However, other random and systematic errors make this finding unreliable.
Con: continuous; Int: intermittent; HVE: hepatic vascular exclusion; PTC: portal triad clamping.
Direct evidence compared to network meta‐analysis
Figure 27 shows the information on direct evidence compared to network meta‐analysis. There do not appear to be any discrepancies between direct and indirect estimates, although the credible intervals are different (the direct evidence had narrower credible intervals in four of the five comparisons above) resulting in the differences in the comparisons in which there was evidence for difference. Direct evidence appears to be preferable over indirect evidence and network meta‐analysis based on the quality of evidence for the comparison 'continuous selective portal triad clamping versus continuous portal triad clamping'. Indirect evidence and network meta‐analysis appear to be preferable over direct evidence for the comparison 'continuous portal triad clamping versus control'. Direct evidence and network meta‐analysis appear to be preferable over indirect evidence for the comparison 'intermittent portal triad clamping versus control'. There was little apparent difference in the quality of evidence between direct, indirect estimates, and network meta‐analysis; so, we could not choose one estimate over the others based on the quality of evidence.

Methods of vascular occlusion:blood transfusion (red blood cells)
Forest plot of the comparisons in which direct and indirect estimates were available. There do not appear to be any discrepancies between direct and indirect estimates, although the credible intervals are different (the direct evidence had narrower credible intervals in four of the five comparisons above) resulting in the differences in the comparisons in which there was evidence for difference. Direct evidence appears to be preferable over indirect evidence and network meta‐analysis based on the quality of evidence for the comparison 'continuous selective portal triad clamping versus continuous portal triad clamping'. Indirect evidence and network meta‐analysis appear to be preferable over direct evidence for the comparison 'continuous portal triad clamping versus control'. Direct evidence and network meta‐analysis appear to be preferable over indirect evidence for the comparison 'intermittent portal triad clamping versus control'. There was little apparent difference in the quality of evidence between direct, indirect estimates, and network meta‐analysis; so, we could not choose one estimate over the others based on the quality of evidence.
1Risk of bias was unclear or high in the trial(s) (downgraded by 1 point).
2Sample size was low (downgraded by 1 point).
3Confidence intervals spanned no effect and clinically significant effect (downgraded by 1 point).
Blood transfusion (platelets)
None of the trials reported this outcome.
Blood transfusion (fresh frozen plasma)
None of the trials reported this outcome.
Blood transfusion (cryoprecipitate)
None of the trials reported this outcome.
Blood loss
Sixteen trials reported blood loss (Belghiti 1996; Man 1997; Belghiti 1999; Wu 2002; Capussotti 2003; Chouker 2004; Figueras 2005; Capussotti 2006; Chen 2006; Liang 2009; Dayangac 2010; Pietsch 2010; Lee 2012; Park 2012; Ni 2013; Si‐Yuan 2014). They used seven interventions in 1322 participants. The median and range of the mean blood loss reported for each treatment are as follows.
-
Control: 0.489 L (range 0.204 to 2.17).
-
Continuous hepatic vascular exclusion: 0.42 L and 1.195 L (two trials only).
-
Continuous portal triad clamping: 0.77 L (range 0.2 to 1.38).
-
Continuous selective hepatic vascular exclusion: 0.529 L (one trial only).
-
Continuous selective portal triad clamping: 0.3 L and 0.649 L (two trials only).
-
Intermittent portal triad clamping: 0.671 L (range 0.184 to 1.685).
-
Intermittent selective portal triad clamping: 0.735 L and 1.159 L (two trials only)..
Direct comparison
Based on the DIC, we chose the fixed‐effect model for intermittent portal triad clamping versus continuous portal triad clamping and the random‐effects model for the remaining comparisons with two or more studies. There was no evidence of differences in blood loss for any of the comparisons. Either the mean, the standard deviation, or both were not available in six trials (Man 1997; Wu 2002; Capussotti 2006; Pietsch 2010; Ni 2013; Si‐Yuan 2014). Excluding these trials did not alter the conclusions.
Network meta‐analysis
Figure 18 shows the network plots. Based on the DIC, we chose the random‐effects model. There was no evidence of differences in blood loss for any of the comparisons. Excluding the six trials in which either the mean, the standard deviation, or both were not available did not alter the results (Man 1997; Wu 2002; Capussotti 2006; Pietsch 2010; Ni 2013; Si‐Yuan 2014). Figure 28 shows the probability of each treatment being best, second best, third best, and so on. Figure 20 shows the cumulative probability of a treatment being best.

Probability of best treatment: probability of being best, second best, third best, etc. for each treatment for blood loss (vascular occlusion methods). A probability of more than 90% is a reliable indicator that a treatment is best with regards to the specific outcome. A probability of less than 90% is less reliable. None of the treatments have a 90% probability of being best treatment.
Con: continuous; Int: intermittent; HVE: hepatic vascular exclusion; PTC: portal triad clamping.
Direct evidence compared to network meta‐analysis
Figure 29 shows the information on direct evidence compared to network meta‐analysis. There do not appear to be any discrepancies between direct and indirect estimates, although the credible intervals are different (the direct evidence had narrower credible intervals in three of the five comparisons above). Direct evidence appears to be preferable over indirect evidence and network meta‐analysis based on the quality of evidence.

Methods of vascular occlusion:blood loss
Forest plot of the comparisons in which direct and indirect estimates were available. There does not appear to be any discrepancies between direct and indirect estimates, although the credible intervals are different (the direct evidence had narrower credible intervals in three of the five comparisons above). Direct evidence appears to be preferable over indirect evidence and network meta‐analysis based on the quality of evidence.
1Risk of bias was unclear or high in the trial(s) (downgraded by 1 point).
2 Sample size was low (downgraded by 1 point).
3Confidence intervals spanned no effect and clinically significant effect (downgraded by 1 point).Ç
4There was substantial or considerable heterogeneity (downgraded by 2 points).
Major blood loss (proportion)
Three trials reported the proportion of participants experiencing major blood loss (Lee 2012; Ni 2013; Si‐Yuan 2014), defined as more than one litre in Lee 2012 and Ni 2013 and as more than two litres in Si‐Yuan 2014. The trials used five interventions in 406 participants. The unadjusted proportions of participants experiencing major blood loss are as follows.
-
Control: 4/63 (6.3%).
-
Continuous portal triad clamping: 8/140 (5.7%).
-
Continuous selective hepatic vascular exclusion: 2/80 (2.5%).
-
Continuous selective portal triad clamping: 0/60 (0.0%).
-
Intermittent portal triad clamping: 5/63 (7.9%).
There was only one trial for each comparison. There was no evidence of differences in major blood loss (proportion) for any of the comparisons.
Hospital stay
Total hospital stay
Ten trials reported total hospital stay (Belghiti 1996; Man 1997; Belghiti 1999; Wu 2002; Figueras 2005; Capussotti 2006; Liang 2009; Lee 2012; Park 2012; Si‐Yuan 2014). They used seven treatments in 918 participants. The medians and ranges of the mean hospital stay reported for each treatment are as follows.
-
Control: 9 d (range 7 to 19).
-
Continuous hepatic vascular exclusion: 22 d (one trial only).
-
Continuous portal triad clamping: 14 d (range 13 to 14).
-
Continuous selective hepatic vascular exclusion: 10 d (one trial only).
-
Continuous selective portal triad clamping: 10 d (one trial only).
-
Intermittent portal triad clamping: 10 d (range 8 to 16).
-
Intermittent selective portal triad clamping: 8 d and 16 d (two trials only)..
Based on the DIC, we chose the fixed‐effect model for comparisons with two or more studies. The total hospital stay was lower in the continuous portal triad clamping group than in the continuous hepatic vascular exclusion group (MD −8.00 d, 95% CrI −13.03 to −2.95; 52 participants; 1 study; low‐quality evidence: downgraded one point for unclear or high risk of bias in trial and one more point for small sample size). The total hospital stay was lower in the continuous selective hepatic vascular exclusion group than in the continuous portal triad clamping group (MD −2.80 d, 95% CrI −4.13 to −1.47; 160 participants; 1 study; low‐quality evidence: downgraded 1 point for unclear or high risk of bias in trial and one more point for small sample size). There was no evidence of differences in other comparisons. Either the mean, the standard deviation, or both were not available in four trials (Man 1997; Wu 2002; Capussotti 2006; Lee 2012). Excluding these trials did not alter the conclusions except for intermittent portal triad clamping versus control. We excluded three of the four trials under this comparison because of the lack of availability of either the mean, the standard deviation, or both (Man 1997; Capussotti 2006; Lee 2012). Excluding these trials, the hospital stay was shorter in the intermittent portal triad clamping group than in the control (MD −3.51 d, 95% CrI −6.85 to −0.16; 50 participants; 1 study).
ITU stay
One trial reported ITU stay (Si‐Yuan 2014); the mean ITU stays reported for each treatment are as follows.
-
Continuous portal triad clamping: 1.5 d.
-
Continuous selective hepatic vascular exclusion: 1.2 d.
The ITU stay was lower in the continuous selective hepatic vascular exclusion group than in the continuous portal triad clamping group (MD −0.30 d, 95% CrI −0.55 to −0.06; 160 participants; 1 study).
Operating time
Twelve trials reported operating time (Belghiti 1996; Clavien 1996; Wu 2002; Capussotti 2003; Figueras 2005; Chen 2006; Liang 2009; Pietsch 2010; Lee 2012; Park 2012; Ni 2013; Si‐Yuan 2014). They used seven treatments in 919 participants. The medians and ranges of the mean operating times reported for each treatment are as follows.
-
Control: 292 min (range 239 to 339).
-
Continuous hepatic vascular exclusion: 133 min and 366 min (two trials only).
-
Continuous portal triad clamping: 200 min (range 116 to 301).
-
Continuous selective hepatic vascular exclusion: 131 min (one trial only).
-
Continuous selective portal triad clamping: 136 min and 236 min (two trials only).
-
Intermittent portal triad clamping: 241 min (range 204 to 409).
-
Intermittent selective portal triad clamping: 219 min and 399 min (two trials only).
Based on the DIC, we chose the fixed‐effect model for continuous portal triad clamping versus control and intermittent selective portal triad clamping versus intermittent portal triad clamping, and we used the random‐effects model for the remaining comparisons with two or more studies. The operating time was lower in the intermittent portal triad clamping group than in the continuous selective portal triad clamping group (MD −30.53 min, 95% CrI −49.68 to −11.29; 80 participants; 1 study). There was no evidence of differences in other comparisons. Either the mean, the standard deviation, or both were not available in four trials (Wu 2002; Pietsch 2010; Lee 2012; Si‐Yuan 2014). Excluding these trials did not alter the conclusions except for intermittent portal triad clamping versus control. We excluded Lee 2012 from this two‐trial comparison because no mean or standard deviation were available (Lee 2012; Park 2012). Excluding this trial, the operating time was longer in the intermittent portal triad clamping group than in the control (MD 49.63 min, 95% CrI 26.72 to 72.55; 50 participants; 1 study; low‐quality evidence: downgraded one point for unclear or high risk of bias in trial and one more point for small sample size).
Time needed to return to work
None of the trials reported this outcome.
Difference between Bayesian and frequentist meta‐analysis
The interpretation of information and conclusions did not alter by using the frequentist meta‐analysis.
Overall summary
There was no evidence of differences between the tested methods of vascular occlusion in any of the reported outcomes of interest for this review other than the following − and they all ought to be considered of low or very low quality .
-
The proportion of participants experiencing serious adverse events was lower in the continuous selective portal triad clamping group than in the continuous portal triad clamping group (OR 0.42, 95% CrI 0.18 to 0.96; 120 participants; 1 study).
-
The number of serious adverse events was lower in the intermittent portal triad clamping group than in the continuous portal triad clamping group (rate ratio 0.09, 95% CrI 0.00 to 0.56; 86 participants; 1 study).
-
The proportion of participants experiencing adverse events was lower in the continuous selective portal triad clamping group than in the continuous portal triad clamping group (OR 0.41, 95% CrI 0.18 to 0.90; 120 participants; 1 study).
-
The proportion of participants requiring a blood transfusion was lower in the continuous portal triad clamping group than in the control (OR 0.06, 95% CrI 0.00 to 0.49; 34 participants; 1 study). The proportion of participants requiring a blood transfusion was higher in the continuous portal triad clamping group than in the continuous hepatic vascular exclusion group (OR 5.90, 95% CrI 2.45 to 15.58; 118 participants; 1 study).
-
The blood transfusion quantity (red blood cells) was lower with continuous portal triad clamping than in the control (MD −1.25 units, 95% CrI −2.39 to −0.10; network meta‐analysis: 786 participants; 10 studies). The blood transfusion quantity (red blood cells) was lower in the intermittent portal triad clamping group than in the control (−1.50, 95% CrI −2.75 to −0.26; 100 participants; 1 study). The blood transfusion quantity (red blood cells) was lower in the continuous selective hepatic vascular exclusion group than in the continuous portal triad clamping group(MD −1.20 units, 95% CrI −2.37 to −0.04; 160 participants; 1 study). The blood transfusion quantity (red blood cells) was lower in the continuous selective portal triad clamping group than in the continuous portal triad clamping group (MD −0.20, 95% CrI −0.31 to −0.09; 120 participants; 1 study).
-
The hospital stay was lower in the continuous portal triad clamping group than in the continuous hepatic vascular exclusion group (MD −8.00 d, 95% CrI −13.03 to −2.95; 52 participants; 1 study). The hospital stay was lower in the continuous selective hepatic vascular exclusion group than in the continuous portal triad clamping group (MD −2.80 d, 95% CrI −4.13 to −1.47; 160 participants; 1 study).
-
The ITU stay was lower in the continuous selective hepatic vascular exclusion group than in the continuous portal triad clamping group (MD −0.30 d, 95% CrI −0.55 to −0.06; 160 participants; 1 study).
-
The operating time was lower in the intermittent portal triad clamping group than in the continuous selective portal triad clamping group (MD −30.53 min, 95% CrI −49.68 to −11.29; 80 participants; 1 study).
Pharmacological interventions
Six trials compared different pharmacological interventions (Shimada 1994; Lentschener 1997; Wong 2003; Lodge 2005; Shao 2006; Wu 2006). We did not perform network meta‐analysis since direct comparison and indirect comparison effect estimates (which would enable assessment of inconsistency) were not available for any of the outcomes.
Quality of evidence
The quality of evidence was very low for all the outcomes and comparisons unless specifically indicated within the results. This was because of unclear or high risk of bias in the trials (downgraded by one point), imprecision due to small sample size (downgraded by one point), and wide credible intervals (downgraded by one point) for all outcomes with very low quality of evidence. In addition, we downgraded the quality for blood transfusion (as a proportion of participants requiring one) by two points because of the presence of substantial or considerable heterogeneity in the pair‐wise comparison or in the network.
Mortality
Mortality (perioperative)
Two trials reported perioperative mortality (Lodge 2005; Wu 2006). They used three treatments in 399 participants. The unadjusted proportions of perioperative mortality are as follows.
-
Control: 3/165 (1.8%).
-
Recombinant factor VIIa: 4/126 (3.2%).
-
Tranexamic acid: 0/108 (0.0%).
There was no evidence of differences in perioperative mortality for any of the comparisons.
Mortality (longest follow‐up)
None of the trials reported this outcome.
Adverse events
Serious adverse events (proportion)
Three trials reported the proportion of participants experiencing serious adverse events (Shimada 1994; Lodge 2005; Shao 2006). They used three treatments in 456 participants. The unadjusted proportions of participants experiencing serious adverse events are as follows.
-
Control: 59/160 (36.9%).
-
Anti‐thrombin III: 4/13 (30.8%).
-
Recombinant factor VIIa: 111/283 (39.2%).
There was no evidence of differences in the proportion of participants experiencing serious adverse events for any of the comparisons.
Serious adverse events (number)
Three trials reported the number of serious adverse events (Lodge 2005; Shao 2006; Wu 2006). They used three treatments in 646 participants. The unadjusted rates of serious adverse events (number) are as follows.
-
Control: 20/255 (7.8 per 100 participants).
-
Recombinant factor VIIa: 35/283 (12.4 per 100 participants).
-
Tranexamic acid: 7/108 (6.5 per 100 participants).
There was no evidence of differences in the number of serious adverse events for any of the comparisons.
Adverse events (proportion)
Three trials reported the proportion of participants experiencing adverse events (Shimada 1994; Shao 2006; Wu 2006). A total of four treatments were used in a total of 470 participants in these studies. The unadjusted proportions of adverse events (proportion) are as follows.
-
Control: 98/198 (49.5%)
-
Anti‐thrombin III: 4/13 (30.8%)
-
Recombinant factor VIIa: 142/151 (94.0%)
-
Tranexamic acid: 14/108 (13.0%).
There was no evidence of differences in the proportion of participants experiencing adverse events for any of the comparisons.
Adverse events (number)
Three trials reported the number of adverse events (number) (Lodge 2005; Shao 2006; Wu 2006). They used three treatments in 646 participants. The unadjusted rates of adverse events (number) are as follows.
-
Control: 467/255 (183.1 per 100 participants).
-
Recombinant factor VIIa: 824/283 (291.2 per 100 participants).
-
Tranexamic acid: 19/108 (17.6 per 100 participants).
There was no evidence of differences in the number of adverse events reported for any of the comparisons.
Health‐related quality of life
None of the trials reported this outcome at any time point.
Blood transfusion requirements
Blood transfusion (proportion)
Five trials reported the proportion of participants requiring a blood transfusion (Lentschener 1997; Wong 2003; Lodge 2005; Shao 2006; Wu 2006). They used five treatments in 787 participants. The unadjusted proportions of participants requiring a blood transfusion (proportion) are as follows.
-
Control: 93/320 (29.1%).
-
Aprotinin: 8/48 (16.7%).
-
Desmopressin: 3/30 (10.0%).
-
Recombinant factor VIIa: 104/281 (37.0%).
-
Tranexamic acid: 0/108 (0.0%).
The the proportion of participants requiring a blood transfusion was lower in the aprotinin group (OR 0.31, 95% CrI 0.11 to 0.78; 97 participants; 1 study; low‐quality evidence: downgraded one point for unclear or high risk of bias in trial and one more point for small sample size) and in the tranexamic acid group than in the control (OR 0.01, 95% CrI 0.00 to 0.13; 214 participants; 1 study; low‐quality evidence: downgraded one point for unclear or high risk of bias in trial and one more point for small sample size). There was no evidence of differences in other comparisons.
Blood transfusion (red blood cells)
Four trials reported blood transfusion quantity (red blood cells) (Shimada 1994; Lentschener 1997; Lodge 2005; Shao 2006). They used four interventions in 537 participants. The median and range of the mean blood transfusion quantity (red blood cells) reported for each treatment are as follows.
-
Control: 2.07 units (range 0.00 to 4.40).
-
Anti‐thrombin III: 4.80 units (one trial only).
-
Aprotinin: 0.63 units (one trial only).
-
Recombinant factor VIIa: 0.40 and 3.00 units (two trials only).
We did not perform meta‐analysis since none of the studies provided both the mean and the standard deviation. The blood transfusion quantity (red blood cells) was lower in the aprotinin group than in the control (MD −0.94 units; P = 0.015; 97 participants; 1 study). There was no evidence of differences in other comparisons.
Blood transfusion (platelets)
Two trials reported blood transfusion quantity (platelets) (Lentschener 1997; Shao 2006). They used three treatments in 328 participants. No participants received a platelets transfusion in Lentschener 1997 (aprotinin versus control). The median platelets transfused was 0 in both groups in the other trial (Shao 2006; recombinant factor VIIa versus control).
Blood transfusion (fresh frozen plasma)
Three trials reported blood transfusion quantity (fresh frozen plasma) (Lentschener 1997; Wong 2003; Shao 2006). They used four treatments in 388 participants. The median and range of the mean or median blood transfusion quantity (fresh frozen plasma) reported for each treatment are as follows.
-
Control: 0.45 units (range 0.00 to 0.80).
-
Aprotinin: 0.04 units (one trial only).
-
Desmopressin: 0.20 units (one trial only).
-
Recombinant factor VIIa: 0.00 units (one trial only).
We did not perform meta‐analysis since either mean or standard deviation was not available in two trials (Lentschener 1997; Shao 2006). There was no evidence of differences in blood transfusion quantity (fresh frozen plasma) for any of the comparisons.
Blood transfusion (cryoprecipitate)
None of the trials reported this outcome.
Blood loss
Six trials reported blood loss (Shimada 1994; Lentschener 1997; Wong 2003; Lodge 2005; Shao 2006; Wu 2006). They used six treatments in 810 participants. The median and range of the mean blood loss reported for each treatment are as follows.
-
Control: 1.10 L (range 0.50 to 1.65).
-
Anti‐thrombin III: 1.86 L (one trial only).
-
Aprotinin: 1.22 L (one trial only).
-
Desmopressin: 0.83 L (one trial only).
-
Recombinant factor VIIa: 0.65 L and 1.23 L (two trials only).
-
Tranexamic acid: 0.30 L (one trial only).
We did not perform meta‐analysis since we imputed the mean, standard deviation, or both in five trials (Shimada 1994; Wong 2003; Lodge 2005; Shao 2006; Wu 2006). The blood loss was lower in the tranexamic acid group than in the control (difference in median: −0.30 L, P < 0.001; 214 participants; 1 study). There was no evidence of any difference in other comparisons.
Major blood loss (proportion)
None of the trials reported this outcome.
Total hospital stay
Hospital stay
One trial (214 participants) reported hospital stay (Wu 2006). The median hospital stays reported for each treatment are as follows.
-
Control: 9 d (one trial only).
-
Tranexamic acid: 8 d (one trial only).
There was no evidence of difference in median hospital stay between the groups.
ITU stay
None of the trials reported this outcome.
Operating time
Five trials reported operating time (Shimada 1994; Lentschener 1997; Wong 2003; Lodge 2005; Wu 2006). They used six treatments in 580 participants. The medians and ranges of the mean operating times reported for each treatment are as follows.
-
Control: 261 min (range 233 to 435).
-
Anti‐thrombin III: 233 min (one trial only).
-
Aprotinin: 232 min (one trial only).
-
Desmopressin: 405 min (one trial only).
-
Recombinant factor VIIa: 230 min (one trial only).
-
Tranexamic acid: 254min (one trial only).
The mean, standard deviation or both were not available from four studies (Shimada 1994; Wong 2003; Lodge 2005; Wu 2006). The operating time was lower in the tranexamic acid group than in the control group (difference in medians −52.20 min; P = 0.003; 214 participants; 1 study; low‐quality evidence: downgraded one point for unclear or high risk of bias in trial and one more point for small sample size). There was no evidence of differences in other comparisons.
Time needed to return to work
None of the trials reported this outcome.
Difference between Bayesian and frequentist meta‐analysis
The interpretation of information and conclusions did not alter by using the frequentist meta‐analysis.
Overall summary
There was no evidence of differences between different pharmacological interventions in any of the reported outcomes of interest for this review other than the following.
-
The proportion of participants requiring a blood transfusion was lower in the aprotinin group (OR 0.31, 95% CrI 0.11 to 0.78; 97 participants; 1 study) and in the tranexamic acid group (OR 0.01, 95% CrI 0.00 to 0.13; 214 participants; 1 study) than in the control.
-
The blood transfusion quantity (red blood cells) was lower in the aprotinin group than in the control (MD −0.94 units; P = 0.015; 97 participants; 1 study).
-
The blood loss was lower in the tranexamic acid group than in the control (difference in median: −0.3 L, P < 0.001; 214 participants; 1 study).
-
The operating time was lower in the tranexamic acid group than in the control (difference in medians −52.20 min; P = 0.003; 214 participants; 1 study).
Overall summary across all interventions
Mortality (perioperative)
There was no evidence of differences in perioperative mortality for any of the comparisons for which this information was available.
Mortality at longest follow‐up
There was no evidence of differences in mortality at longest follow‐up for any of the comparisons for which this information was available.
Serious adverse events (proportion)
-
The proportion of participants experiencing serious adverse events was lower in the continuous selective portal triad clamping group than in the continuous portal triad clamping group (OR 0.42, 95% CrI 0.18 to 0.96; 120 participants; 1 study).
-
There was no evidence of differences in other comparisons for which this information was available.
Serious adverse events (number)
-
The number of serious adverse events was higher in the fibrin sealant group than in the argon beam group (rate ratio 4.81, 95% CrI 1.73 to 17.5; 121 participants; 1 study).
-
The number of serious adverse events was lower in the intermittent portal triad clamping group than in the continuous portal triad clamping group (rate ratio 0.09, 95% CrI 0.00 to 0.56; 86 participants; 1 study).
-
There was no evidence of differences in other comparisons for which this information was available.
Adverse events (proportion)
-
The proportion of participants experiencing adverse events was lower in the continuous selective portal triad clamping group than in the continuous portal triad clamping group (OR 0.41, 95% CrI 0.18 to 0.90; 120 participants; 1 study).
-
There was no evidence of differences in other comparisons for which this information was available.
Adverse events (number)
-
The number of adverse events was higher with radiofrequency dissecting sealer than with the clamp‐crush method (rate ratio 1.85, 95% CrI 1.07 to 3.26; 250 participants; 3 studies) (Bayesian analysis only: both direct and network meta‐analysis).
-
There was no evidence of differences in other comparisons for which this information was available.
Health‐related quality of life
None of the trials reported this outcome.
Blood transfusion (proportion)
-
The proportion of participants requiring a blood transfusion was lower in the group receiving an autologous blood donation than in the control (OR 0.18, 95% CrI 0.04 to 0.66; 42 participants; 1 study).
-
The proportion of participants requiring a blood transfusion was higher in the low central venous pressure group than in the acute normovolemic haemodilution plus low central venous pressure group (OR 3.19, 95% CrI 1.56 to 6.95; 208 participants; 2 studies).
-
The proportion of participants requiring a blood transfusion was lower in the continuous portal triad clamping group than in the control (OR 0.06, 95% CrI 0.00 to 0.49; 34 participants; 1 study). The proportion of participants requiring a blood transfusion was higher in the continuous portal triad clamping group than in the continuous hepatic vascular exclusion group (OR 5.90, 95% CrI 2.45 to 15.58; 118 participants; 1 study).
-
The proportion of participants requiring a blood transfusion was lower in the aprotinin group (OR 0.31, 95% CrI 0.11 to 0.78; 97 participants; 1 study) and in the tranexamic acid group than in the control (OR 0.01, 95% CrI 0.00 to 0.13; 214 participants; 1 study).
-
There was no evidence of differences in other comparisons for which this information was available.
Blood transfusion (red blood cells)
-
Compared to control, the blood transfusion quantity (red blood cells) was lower in the acute normovolemic haemodilution group (MD −1.25 units, 95% CrI −1.75 to −0.74; 20 participants; 1 study) and in the acute normovolemic haemodilution plus hypotension group (MD −1.67 units, 95% CrI −2.06 to −1.32; 20 participants; 1 study). The blood transfusion quantity (red blood cells) was higher in the acute normovolemic haemodilution plus low central venous pressure group than in the control (MD 0.27 units, 95% CrI 0.01 to 0.52; 30 participants; 1 study).
-
The blood transfusion quantity (red blood cells) was lower in the hydrojet group than in the cavitron ultrasonic surgical aspirator group (MD −0.98 units, 95% CrI −1.90 to −0.06; 61 participants; 1 study).
-
The blood transfusion quantity (red blood cells) was lower in the fibrin sealant group than in the control (MD −0.53 units, 95% CrI −1.00 to −0.07; 122 participants; 2 studies). The blood transfusion quantity (red blood cells) was higher in the fibrin sealant group than in the cyanoacrylate group (MD 2.20 units; 95% CrI 1.59 to 2.81; 30 participants; 1 study).
-
The blood transfusion quantity (red blood cells) was lower with continuous portal triad clamping than control (MD −1.25 units, 95% CrI −2.39 to −0.10; network meta‐analysis: 786 participants; 10 studies). The blood transfusion quantity (red blood cells) was lower in the intermittent portal triad clamping group than in the control (−1.50, 95% CrI −2.75 to −0.26; 100 participants; 1 study). The blood transfusion quantity (red blood cells) was lower in the continuous selective hepatic vascular exclusion group than in the continuous portal triad clamping group (MD −1.20 units, 95% CrI −2.37 to −0.04; 160 participants; 1 study). The blood transfusion quantity (red blood cells) was lower in the continuous selective portal triad clamping group than in the continuous portal triad clamping group (MD −0.20, 95% CrI −0.31 to −0.09; 120 participants; 1 study).
-
The blood transfusion quantity (red blood cells) was lower in the aprotinin group than in the control (MD −0.94; P = 0.015; 97 participants; 1 study).
-
There was no evidence of differences in other comparisons for which this information was available.
Blood transfusion (platelets)
There was no evidence of differences in blood transfusion quantity (platelets) in any of the comparisons for which this information was available.
Blood transfusion (fresh frozen plasma)
-
The blood transfusion quantity (fresh frozen plasma) was lower in the low central venous pressure group than in the control (MD −2.48 units, 95% CrI −3.58 to −1.37; 50 participants; 1 study).
-
The blood transfusion quantity (fresh frozen plasma) was lower in the fibrin sealant group than in the cyanoacrylate group (MD −0.81 units, 95% CrI −1.04 to −0.62; 30 participants; 1 study). The blood transfusion quantity (fresh frozen plasma) was higher in the oxidised cellulose group than in the fibrin sealant group (MD 0.53 units, 95% CrI 0.36 to 0.71; 80 participants; 2 studies).
-
There was no evidence of differences in other comparisons for which this information was available.
Blood transfusion (cryoprecipitate)
There was no evidence of differences in blood transfusion quantity (cryoprecipitate) in any of the comparisons for which this information was available.
Blood loss
-
The blood loss was lower in the acute normovolemic haemodilution plus hypotension group (MD −0.25 L; 95% CrI −0.37 to −0.13; 20 participants; 1 study) and in the low central venous pressure group than in the control (MD −0.34 L, 95% CrI −0.46 to −0.22; 237 participants; 4 studies). The blood loss was lower in the acute normovolemic haemodilution plus hypotension group than in the acute normovolemic haemodilution group (MD −0.25; 95% CrI −0.40 to −0.10; 20 participants; 1 study).
-
The blood loss was lower in the tranexamic acid group than in the control (difference in median: −0.3 L, P < 0.001; 214 participants; 1 study).
-
There was no evidence of differences in other comparisons for which this information was available.
Major blood loss (proportion)
There was no evidence of differences in the proportion of participants experiencing major blood loss in any of the comparisons for which this information was available.
Hospital stay
-
The total hospital stay was lower in the low central venous pressure group than in the control (MD −2.42 d, 95% CrI −3.91 to −0.94; 197 participants; 3 studies).
-
The total hospital stay was lower in the continuous portal triad clamping group than in the continuous hepatic vascular exclusion group (MD −8.00 d, 95% CrI −13.03 to −2.95; 52 participants; 1 study). The total hospital stay was lower in the continuous selective hepatic vascular exclusion group than in the continuous portal triad clamping group (MD −2.80 d, 95% CrI −4.13 to −1.47; 160 participants; 1 study).
-
There was no evidence of differences in other comparisons for which this information was available.
ITU stay
-
The ITU stay was lower in the continuous selective hepatic vascular exclusion group than in the continuous portal triad clamping group (MD −0.30 d, 95% CrI −0.55 to −0.06; 160 participants; 1 study).
-
There was no evidence of differences in other comparisons for which this information was available.
Operating time
-
The operating time was lower in the low central venous pressure group than in the control (MD −15.32 min, 95% CrI −29.03 to −1.69; 192 participants; 4 studies).
-
The operating time was lower in the stapler resection group than in the clamp‐crush method group with frequentist meta‐analysis (MD −31.00 min, 95% CI −60.40 to −1.60; 130 participants; 1 study) (frequentist analysis only).
-
The operating time was higher in the fibrin sealant and collagen group than in the control (MD 19.72 min, 95% CrI 2.93 to 36.57; 300 participants; 1 study).
-
The operating time was lower in the intermittent portal triad clamping group than in the continuous selective portal triad clamping group (MD −30.53 min, 95% CrI −49.68 to −11.29; 80 participants; 1 study).
-
The operating time was lower in the tranexamic acid group than in the control (difference in medians −52.20 min; P = 0.003; 214 participants; 1 study).
-
There was no evidence of differences in other comparisons for which this information was available.
Time needed to return to work
None of the trials reported this outcome.
Subgroup analysis
We did not perform subgroup analyses because of the paucity of data.
Reporting bias
For outcomes with 10 or more trials, we explored reporting bias using funnel plots. There were nine comparisons with at least 10 trials. Of these, there was no evidence of funnel plot asymmetry on visualisation for perioperative mortality for methods of parenchymal transection, methods of dealing with cut surface, or methods of vascular occlusion. There was funnel plot asymmetry in the remaining six comparisons, all of which fall under the comparison of different methods of vascular occlusion: adverse events (proportion), blood transfusion (proportion), blood transfusion (red blood cells), blood loss, hospital stay, and operating time. The funnels plots of blood transfusion (proportion), blood transfusion (red blood cells), and blood loss are shown in Figure 30, Figure 31, and Figure 32.

Funnel plot of blood transfusion (proportion): The funnel plot shows funnel plot asymmetry (i.e. some trials with large variance with large effects favouring one treatment were not matched by other trials with similarly large variance with large effects favouring the other treatment). This may be evidence of reporting bias or could be because of heterogeneity between the studies.

Funnel plot of blood transfusion (red blood cells): The funnel plot shows funnel plot asymmetry (i.e. some trials with large variance with large effects favouring one treatment were not matched by other trials with similarly large variance with large effects favouring the other treatment). This may be evidence of reporting bias or could be because of heterogeneity between the studies.

Funnel plot of blood loss: The funnel plot shows funnel plot asymmetry (i.e. some trials with large variance with large effects favouring one treatment were not matched by other trials with similarly large variance with large effects favouring the other treatment). This may be evidence of reporting bias or could be because of heterogeneity between the studies.
Since none of the comparisons had 10 or more trials, we did not perform Egger's test to assess the funnel plot asymmetry.
Discussion
Summary of main results
In this updated network meta‐analysis, we compared all the interventions aimed at decreasing blood loss and blood transfusion requirements in people undergoing liver resection. We included 67 randomised clinical trials involving 6197 participants in this review. A total of 5771 participants from 64 trials provided data for one or more outcomes assessed.
In order to perform a network meta‐analysis, it is necessary to satisfy the transitivity assumption, that is, the participants had to be sufficiently similar across the pair‐wise comparisons. While some trials restricted their participant recruitment to those with cirrhotic livers or those who were undergoing major liver resections, others did not. Although there is no clear evidence for an interaction between the presence of cirrhosis or extent of liver resection and the treatment effect, lack of evidence supporting an interaction does not mean that one does not exist. For example, experimental research has shown that cirrhotic livers are more susceptible to ischaemia than normal livers (Figueras 1997; Jang 2008). So vascular occlusion may be beneficial in limiting blood loss in people without cirrhosis while the same treatment may be harmful in people with cirrhotic liver. When different trials use different types of participants (with regards to the presence of cirrhosis), this may lead to problems with clinical heterogeneity in pair‐wise comparisons and undermine the transivitiy assumption in network meta‐analysis. Similarly, a method of treating the cut surface may be more beneficial in people undergoing major liver resections with larger cut surfaces than in those undergoing minor liver resections with smaller cut surfaces that bleed. In the presence of sufficient data, we could have assessed the interaction between the treatment effects and the presence of cirrhosis and the extent of liver resection; however, this was not possible because of paucity of data. So we are unable to comment on the transitivity assumption. We performed network meta‐analyses only when direct and indirect effect estimates for one of more comparisons in a network. This allowed us to evaluate inconsistency in the network. Although we did not find any inconsistency in the networks, lack of evidence of inconsistency did not indicate that the results were consistent. With the paucity of data due to few trials and few participants under each comparison, we were unable to make any firm conclusions about inconsistency. Likewise, the paucity of data decreases the confidence in the results of the network meta‐analysis. As a result of these limitations, readers should interpret our network meta‐analysis with caution. Nevertheless, these results provide relative estimates between treatments that have not been compared in head‐to‐head comparisons.
We present the summary of findings in the summary of findings Table for the main comparison, Appendix 9, and Appendix 10, as well as in the Results section. There was no evidence of differences in most of the comparisons, and where such differences existed, they were in single trials, mostly of small sample size. Without confirmation of the findings in additional trials, combined with lack of reporting in some (possibly because of selective outcome reporting), the evidence from these single trials is not reliable. So we discuss only the evidence that was available in more than one trial below. Of the primary outcomes, the only comparison showing evidence of a difference was in the number of adverse events, which was higher with radiofrequency dissecting sealer than with the clamp‐crush method (rate ratio 1.85, 95% CrI 1.07 to 3.26; 250 participants; 3 studies). However, even for this comparison, the credible intervals overlap a clinically non‐significant difference (i.e. < 20% difference). So, there is significant uncertainty in the difference in the number of adverse events between those operated on with the radiofrequency dissecting sealer compared to the clamp‐crush method due to imprecision in addition to the uncertainty caused by the risk of bias in the trials.
There was no evidence of a reduction in mortality for any of the interventions. Major blood loss may cause multiorgan failure leading to sepsis and death. Mortality was generally low in all the groups compared to that reported in previous studies (Finch 2007). This may be because of the careful selection of participants included in randomised clinical trials compared to a consecutive patient series, which report the results of all liver resections. We have provided the sample size calculations based on the mortality observed in the control groups of 1.8%. To demonstrate a significant 20% relative reduction in mortality (20% relative risk reduction) from 1.8% to 1.4%, approximately 38,000 participants are required for a single direct comparison with one intervention. As shown in the Appendix 7, the effective sample size in an indirect comparison involving just three treatments is only a fraction of the number of participants included in the trials. For example, 10,000 participants included in the indirect comparisons is equivalent to fewer than 2000 'direct' participants in the absence of heterogeneity and fewer than 1000 'direct' participants in the presence of moderate heterogeneity. Even without these complicated calculations, one can easily observe that the credible intervals were very wide, meaning that we cannot rule out a significant benefit or harm for different treatments in terms of mortality. Approximately 16.7% of people in the control group (as defined above) developed serious adverse events. To demonstrate a significant 20% relative reduction in serious adverse events (20% relative risk reduction) from 16.7% to 13.4%, approximately 3592 participants are required for a single direct comparison with a specific intervention. This critical mass of information has not been reached, and there is a significant risk of both type I (alpha) and type II (beta) random errors, that is, there is a significant risk of making false positive and false negative conclusions. Given the number of participants required to show a significant benefit of treatment with relation to mortality and serious adverse events, it is unlikely that trials of the adequate magnitude will be funded.
Of the secondary outcomes, the main outcome measure of the included trials was blood loss and transfusion requirement. The only comparisons with more than one trial where there was evidence of difference were the following: the proportion of participants requiring a blood transfusion was higher in the low central venous pressure group than in the acute normovolemic haemodilution plus low central venous pressure group; blood transfusion (red blood cells) was lower in the fibrin sealant group than in the control; blood transfusion (fresh frozen plasma) was higher in the oxidised cellulose group than in the fibrin sealant group; and blood loss, total hospital stay, and operating time were lower with low central venous pressure than in the control. Trials measured blood loss in different ways. Most reports did not specify whether they measured the amount of blood obtained in the suction, weighed the swabs, or measured the decrease in haemoglobin. In any case, this is only important if the intervention decreases the blood transfusion requirements, operating time, or serious adverse events. Except for low central venous pressure, which decreases blood loss, operating time, and hospital stay, none of the interventions consistently lowered the blood transfusion requirements or improved other clinical outcomes.
Approximately 21.8% of people in the control group required a blood transfusion. Decreasing this need can reduce transfusion‐related anaphylactic reactions and transmission of transfusion‐related diseases. In addition, there are significant costs associated with blood transfusion, so this is an important outcome. To demonstrate a (significant) 20% relative reduction in serious adverse events (20% relative risk reduction) from 21.8% to 17.4%, approximately 2600 participants are required for a single direct comparisonwith a specific intervention. This critical mass of information has not been reached, and there is significant risk of both alpha and beta random errors in secondary outcomes also.
None of the trials reported quality of life, which is an important outcome used to assess the cost‐effectiveness of a treatment in a state‐funded healthcare system. Given that the quality of life would depend upon various factors including perioperative complications, length of hospital stay, and time to return to work, it is likely to be easier to demonstrate a significant difference in quality of life if the treatment is effective than to demonstrate a difference in mortality or serious adverse events. Future randomised clinical trials should use a validated quality of life measure as one of the outcomes. Serious adverse events are likely to result in decreased quality of life for patients and increased costs to the healthcare provider and are, therefore, more important endpoints than a modest decrease in blood transfusion. Length of total hospital stay and intensive therapy unit stay are important to the patients, their carers, and the healthcare funders. These should be reported in future trials assessing interventions to decrease blood loss or blood transfusion requirements. None of the trials reported time taken to return to work, which is an important outcome for the patient and their carers in the absence of significant sickness benefit and is an important outcome for the healthcare provider in a state‐funded healthcare system with significant sickness benefits.
The major purpose of using different methods of liver resection is to limit blood loss and blood transfusion requirements. Some methods do not require any additional equipment (e.g. vascular occlusion), while other methods do (e.g. cavitron ultrasonic surgical aspirator or radiofrequency dissecting sealer). None of the interventions that require special equipment were better than the clamp‐crush method in terms of blood transfusion requirements or other important patient‐oriented outcomes and hence cannot be recommended over the standard. However, as mentioned previously, there is a significant risk of random errors because of the small sample sizes and possibly important benefits or harms.
Overall completeness and applicability of evidence
The participants included in this trial underwent elective open liver resection and were generally anaesthetically fit. The findings of this review are applicable only to such patients.
Quality of the evidence
The overall quality of evidence was low or very low as shown in summary of findings Table for the main comparison, Appendix 9, and Appendix 10. The risk of bias was high in many of the domains in the trials. Using appropriate methods of randomisation and reporting the method of randomisation adequately will decrease selection bias. While surgeons who perform the surgery cannot be blinded to the treatments, it is possible to blind the surgeons who are involved in the day‐to‐day postoperative management of the patient. While it may be difficult to blind the anaesthetist to the treatment groups, using objective criteria for transfusion may overcome the problem of bias due to lack of blinding with regards to intraoperative blood transfusion (NHS Blood and Transplant 2007). The intensivist involved in the postoperative care of the patient can be easily blinded. Objective criteria for detection of complications along with the postoperative management of the patient by a healthcare team not involved in the operation can decrease detection and performance bias. Even if blinding of participants and healthcare providers was excluded as a criterion to classify a trial as being at low risk of bias (i.e. even if we considered that trials were at low risk of bias if they were classified as low risk of bias in all domains other than blinding of participants and healthcare providers), we would not have classified any of the trials as being at low risk of bias. With regards to dropouts, randomising the participants after confirming that the tumour can be removed can avoid postrandomisation dropouts due to metastatic spread identified at the time of laparotomy. This can decrease attrition bias. Reporting all the important clinical outcomes can decrease selective reporting bias.
There was heterogeneity in some of the comparisons, which resulted in downgrading the level of evidence, but we did not observe heterogeneity in most of the comparisons in which there were two or more trials. However, it was not possible to assess the consistency of evidence in many comparisons because of the presence of single trials.
The effect estimates were wide with the credible intervals spanning either 0.80 (a 20% reduction) or 1.20 (a 20% increase), which both can be considered clinically significant effects. The total number of participants included in the analysis was only a small fraction of the required sample size even without adjustment for heterogeneity. These findings indicate that there is significant risk of imprecision in all the comparisons. Future trials should be adequately powered to decrease the risk of random errors. There was no indirectness of evidence for any of the outcomes. Although we did not find any reporting bias since the paucity of trials precluded the creation of funnel plots, many of the trials did not adequately report a number of important outcomes. Only 25 trials (37.3%) reported mortality and serious adverse events, although these outcomes ought to be routinely measured in trials comparing interventions aimed at limiting blood loss. This suggests indirect evidence of reporting bias.
Potential biases in the review process
We selected a range of databases without any language restrictions and conducted the meta‐analysis according to the NICE TSU (Dias 2012a; Dias 2012b; Dias 2012c; Dias 2013a; Dias 2013b; Dias 2013c; Dias 2013d; Dias 2013e). We performed network meta‐analysis only when the treatments were connected to each other and only when it was possible to obtain the direct and indirect estimates for a comparison. This allowed us to evaluate the quality of evidence of direct estimates, indirect estimates, and network meta‐analysis estimates, choosing the estimates with the best quality of evidence. These are the strengths of the review process.
The major potential source of bias was that we considered each of these interventions (different methods of cardiopulmonary interventions, parenchymal transection methods, methods of dealing with raw surface, vascular occlusion methods, and pharmacological interventions) as separate networks. This was due to the lack of sufficient information in the trials (which resulted in very few trials in the previous version) and the design of the trials. In many of the trials, the surgeons involved in the trial were allowed to choose their method of liver resection apart from the factor being randomised. This design is based on the assumption that the other factors are independent of each other, that is, there is no interaction between the factors, or the choice of one factor is not dependent upon the choice of another factor. There is no evidence to support or refute this assumption. However, if we planned to include only trials in which all the factors were included, we would not even have been able to include as many trials as we did in the previous version, as we have now included all the interventions aimed at limiting blood loss and blood transfusion requirements during liver resection. Each of the factors are independent of other, i.e. the method of parenchymal transection does not affect the method of vascular occlusion that the surgeons use. However, it is quite possible that there were interactions between the different methods. For example, when a parenchymal transection method with high blood loss was chosen, additional interventions such as fibrin glue may have been used to deal with the cut surface (although there is currently no evidence that fibrin glue is effective). Such use may not necessarily mean that there was an interaction unless there was a systematic difference in the use of the other methods for limiting blood loss between the intervention and control. However, it is only possible to assess this if there are details about all the methods to decrease blood loss from the trial report. Future trials should describe the methods used for reducing blood loss even if it was not the factor being randomised. It is only possible to assess the presence of interaction (i.e. the intervention is more effective or less effective depending upon the presence or absence of a second factor) in well‐designed factorial trials. However, the sample size required to detect interaction is much higher than the usual primary analysis of the 'margins'. It is highly unlikely that trials powered to measure interactions can be conducted because of this very large sample size.
We excluded studies that compared variations in the methods listed in Table 1, Table 2, Table 3, and Table 4 and treated variations in the method as single treatment. For example, we included intermittent portal triad clamping of differing durations as a single treatment and did not include comparisons of different methods of intermittent portal triad clamping, unless trials compared them with a different method of vascular occlusion. Hence, this review does not provide information on whether one variation is better than another. We imputed the standard deviations when they were not available from the trials. We performed a sensitivity analysis in all these situations, and there were no changes in results.
Another major limitation of the review was the paucity of data. Many of the networks had few closed loops (i.e. where direct and indirect evidence was available for a particular comparison). Along with this, there were few trials included under each comparison. This also makes the assessment of inconsistency underpowered. Lack of evidence of inconsistency should not be considered the same as lack of inconsistency. This paucity of data decreases the confidence in the results of the network meta‐analysis.
Different interventions may have different effects based on on the extent of liver resection and whether the underlying liver was diseased. However, we were unable to assess this because of paucity of data.
We included only randomised clinical trials in this review. While this is the best way to prevent arriving at biased false conclusions on the benefits of a treatment, the harms of treatment may not be fully captured. This is because of the highly selected group of people who enter into randomised clinical trials compared to clinical practice. In addition, randomised clinical trials may not report rare or late serious adverse events, simply due to their generally small sample size and short duration of follow‐up.
Agreements and disagreements with other studies or reviews
This is an update of ourfirst network meta‐analysis on methods to reduce blood loss during liver resection from 2014 (Simillis 2014). In that review, we concluded that liver resection using a radiofrequency dissecting sealer without vascular occlusion or fibrin sealant may increase serious adverse events. In that review as well, we highlighted the paucity of data. Previously, we also compared individual components included in this review and concluded that intermittent vascular occlusion and the clamp‐crush method may decrease blood loss (Gurusamy 2009a; Gurusamy 2009b). In this review, we concluded that there is no evidence for any significant advantage of different methods of liver resection with regards to blood loss. The differences in conclusion may be because of the decreased importance that we have given to single trials of small sample size and inclusion of trials in which the methods were not reported or when the other aspects of liver resection other than the component being compared were chosen in a non‐random manner.

Study flow diagram.

Risk of bias graph: review authors' judgements about each risk of bias item presented as percentages across all included studies.

Risk of bias summary: review authors' judgements about each risk of bias item for each included study.

The network plot showing the comparisons in the trials included in the comparison of cardiopulmonary interventions in which network meta‐analysis was performed. The size of the node (circle) provides a measure of the number of trials in which the particular treatment was included as one of the arms. The thickness of the line provides a measure of the number of direct comparisons between two nodes (treatments).
ANH: acute normovolemic haemodilution; CVP: central venous pressure; RBC: red blood cells.
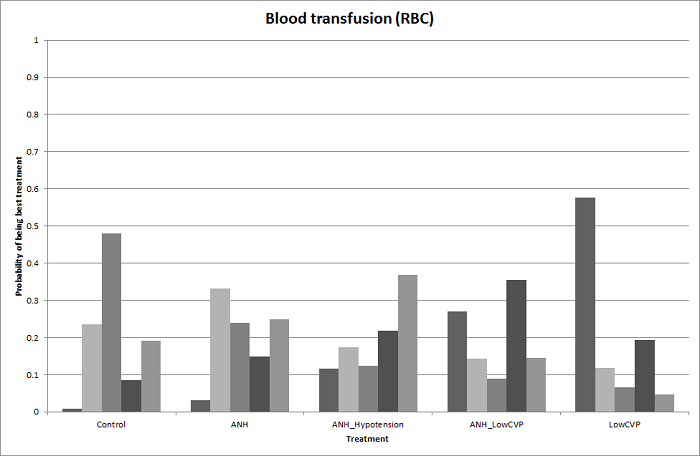
Probability of best treatment: probability of being best, second best, third best, etc. for each treatment for blood transfusion (red blood cells) (cardiopulmonary interventions). A probability of more than 90% is a reliable indicator that a treatment is best with regards to the specific outcome. A probability of less than 90% is less reliable. None of the treatments have a 90% probability of being best treatment.
ANH: acute normovolemic haemodilution; CVP: central venous pressure; RBC: red blood cells.

Cumulative probability of being best treatment: cumulative probability of being best for each treatment for cardiopulmonary interventions. Rank 1 indicates the probability that a treatment is best, rank 2 indicates the probability that a treatment is in the two best treatments, rank 3 indicates the probability that a treatment is in the three best treatments, and so on.
ANH: acute normovolemic haemodilution; CVP: central venous pressure; RBC: red blood cells.
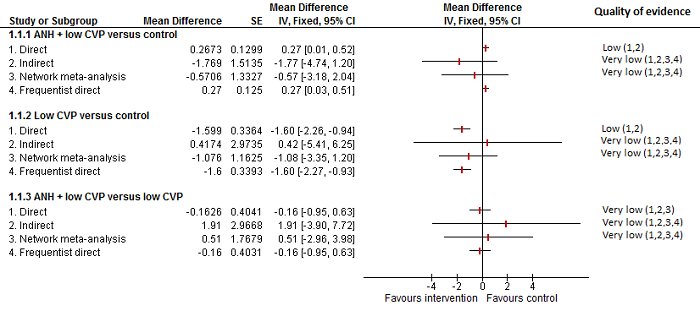
Cardiopulmonary intervention: blood transfusion (red blood cells)
Forest plot of the comparisons in which direct and indirect estimates were available. The mean effect is in opposite directions in the indirect estimate and the direct estimates, thus suggesting that there may be discrepancies between direct and indirect estimates. Direct evidence appears to be preferable over indirect evidence and network meta‐analysis based on the quality of evidence.
1 Risk of bias was unclear or high in the trial(s) (downgraded by 1 point).
2 Sample size was low (downgraded by 1 point).
3Confidence intervals spanned no effect and clinically significant effect (downgraded by 1 point).
4There was substantial or considerable heterogeneity (downgraded by 2 points).

Probability of best treatment: probability of being best, second best, third best, etc. for each treatment for blood loss (cardiopulmonary interventions). A probability of more than 90% is a reliable indicator that a treatment is best with regards to the specific outcome. A probability of less than 90% is less reliable. None of the treatments have a 90% probability of being best treatment.
ANH: acute normovolemic haemodilution; CVP: central venous pressure.
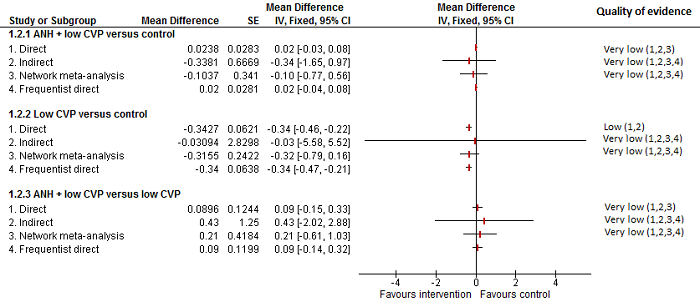
Cardiopulmonary intervention: blood loss
Forest plot of the comparisons in which direct and indirect estimates were available. There does not appear to be any discrepancy between the direct and indirect estimates, although the indirect estimates have wide credible intervals.
Direct evidence appears to be preferable over indirect evidence and network meta‐analysis based on the quality of evidence.
ANH: acute normovolemic haemodilution; CVP: central venous pressure.
1Risk of bias was unclear or high in the trial(s) (downgraded by 1 point).
2Sample size was low (downgraded by 1 point).
3Confidence intervals spanned no effect and clinically significant effect (downgraded by 1 point).
4There was substantial or considerable heterogeneity (downgraded by 2 points).

The network plot showing the comparisons in the trials included in the comparison of methods for parenchymal transection in which network meta‐analysis was performed. The size of the node (circle) provides a measure of the number of trials in which the particular treatment was included as one of the arms. The thickness of the line provides a measure of the number of direct comparisons between two nodes (treatments).
CUSA: cavitron ultrsonic surgical aspirator; RFDS: radiofrequency dissecting sealer.
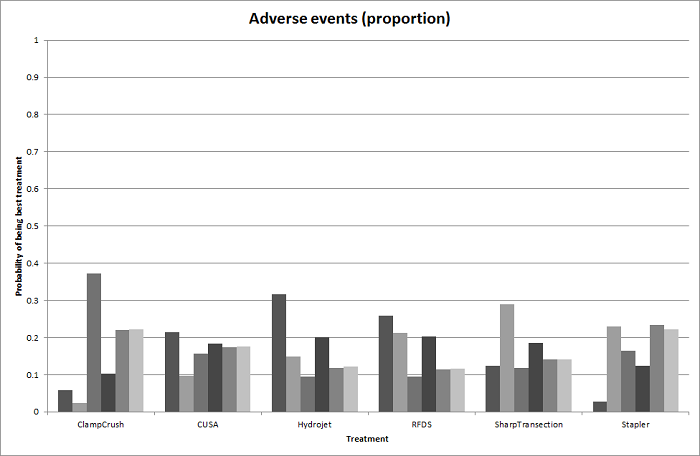
Probability of best treatment: probability of being best, second best, third best, etc. for each treatment for adverse events (proportion) (parenchymal transection methods). A probability of more than 90% is a reliable indicator that a treatment is best with regards to the specific outcome. A probability of less than 90% is less reliable. None of the treatments have a 90% probability of being best treatment.
CUSA: cavitron ultrsonic surgical aspirator; RFDS: radiofrequency dissecting sealer.
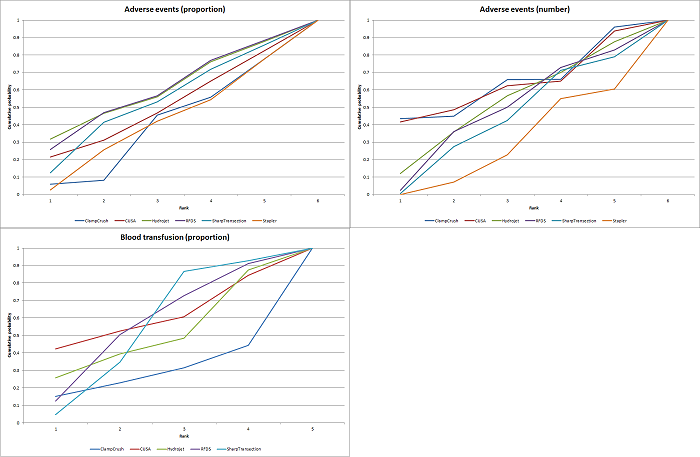
Cumulative probability of being best treatment: cumulative probability of being best for each treatment for parenchymal transection methods. Rank 1 indicates the probability that a treatment is best, rank 2 indicates the probability that a treatment is in the two best treatments, rank 3 indicates the probability that a treatment is in the three best treatments, and so on.
CUSA: cavitron ultrsonic surgical aspirator; RFDS: radiofrequency dissecting sealer.

Parenchymal transection: adverse events (proportion)
Forest plot of the comparisons in which direct and indirect estimates were available. There does not appear to be any discrepancy between the direct and indirect estimates, although the indirect estimates have wide credible intervals.
Direct evidence appears to be preferable over indirect evidence and network meta‐analysis based on the quality of evidence.
CUSA: cavitron ultrsonic surgical aspirator; RFDS: radiofrequency dissecting sealer.
1Risk of bias was unclear or high in the trial(s) (downgraded by 1 point).
2Sample size was low (downgraded by 1 point).
3Confidence intervals spanned no effect and clinically significant effect (downgraded by 1 point).
4There was substantial or considerable heterogeneity (downgraded by 2 points).

Probability of best treatment: probability of being best, second best, third best, etc. for each treatment for adverse events (number) (parenchymal transection methods). A probability of more than 90% is a reliable indicator that a treatment is best with regards to the specific outcome. A probability of less than 90% is less reliable. None of the treatments have a 90% probability of being best treatment.
CUSA: cavitron ultrsonic surgical aspirator; RFDS: radiofrequency dissecting sealer.

Parenchymal transection: adverse events (number)
Forest plot of the comparisons in which direct and indirect estimates were available. There does not appear to be any discrepancy between the direct and indirect estimates.
Direct evidence appears to be preferable over indirect evidence and network meta‐analysis based on the quality of evidence.
CUSA: cavitron ultrsonic surgical aspirator; RFDS: radiofrequency dissecting sealer.
1Risk of bias was unclear or high in the trial(s) (downgraded by 1 point).
2Sample size was low (downgraded by 1 point).
3Confidence intervals spanned no effect and clinically significant effect (downgraded by 1 point).

Probability of best treatment: probability of being best, second best, third best, etc. for each treatment for blood transfusion (proportion) (parenchymal transection methods). A probability of more than 90% is a reliable indicator that a treatment is best with regards to the specific outcome. A probability of less than 90% is less reliable. None of the treatments have a 90% probability of being best treatment.
CUSA: cavitron ultrsonic surgical aspirator; RFDS: radiofrequency dissecting sealer.

Parenchymal transection:blood transfusion (proportion)
Forest plot of the comparisons in which direct and indirect estimates were available. There does not appear to be any discrepancy between the direct and indirect estimates, although the indirect estimates have wide credible intervals for some comparisons. There was little apparent difference in the quality of evidence between direct, indirect estimates, and network meta‐analysis; so, we could not choose one estimate over the others based on the quality of evidence.
CUSA: cavitron ultrsonic surgical aspirator; RFDS: radiofrequency dissecting sealer.
1Risk of bias was unclear or high in the trial(s) (downgraded by 1 point).
2Sample size was low (downgraded by 1 point).
3Confidence intervals spanned no effect and clinically significant effect (downgraded by 1 point).

The network plot showing the comparisons in the trials included in the comparison of methods for vascular occlusion in which network meta‐analysis was performed. The size of the node (circle) provides a measure of the number of trials in which the particular treatment was included as one of the arms. The thickness of the line provides a measure of the number of direct comparisons between two nodes (treatments).
Con: continuous; Int: intermittent; HVE: hepatic vascular exclusion; PTC: portal triad clamping; RBC: red blood cells.

Probability of best treatment: probability of being best, second best, third best, etc. for each treatment for serious adverse events (proportion) (vascular occlusion methods). A probability of more than 90% is a reliable indicator that a treatment is best with regards to the specific outcome. A probability of less than 90% is less reliable. None of the treatments have a 90% probability of being best treatment.
Con: continuous; Int: intermittent; HVE: hepatic vascular exclusion; PTC: portal triad clamping.

Cumulative probability of being best treatment: cumulative probability of being best for each treatment for vascular occlusion methods. Rank 1 indicates the probability that a treatment is best, rank 2 indicates the probability that a treatment is in the two best treatments, rank 3 indicates the probability that a treatment is in the three best treatments, and so on.
Con: continuous; Int: intermittent; HVE:hepatic vascular exclusion; PTC: portal triad clamping.

Methods of vascular occlusion: serious adverse events (proportion)
Forest plot of the comparisons in which direct and indirect estimates were available. Although there is overlap of confidence intervals, the mean indirect estimate seems to be quite different from the direct estimate (sometimes, suggesting an opposite effect), thus suggesting that there may be discrepancies between direct and indirect estimates.
There was little apparent difference in the quality of evidence between direct, indirect estimates, and network meta‐analysis; so, we could not choose one estimate over the others based on the quality of evidence.
1Risk of bias was unclear or high in the trial(s) (downgraded by 1 point).
2Sample size was low (downgraded by 1 point).
3Confidence intervals spanned no effect and clinically significant effect (downgraded by 1 point).
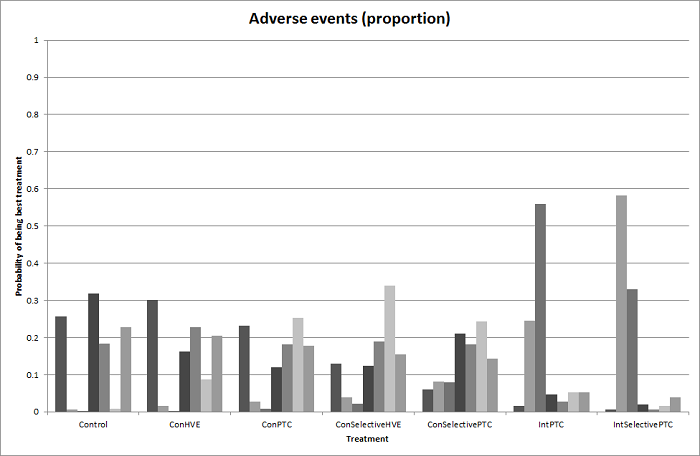
Probability of best treatment: probability of being best, second best, third best, etc. for each treatment for adverse events (proportion) (vascular occlusion methods). A probability of more than 90% is a reliable indicator that a treatment is best with regards to the specific outcome. A probability of less than 90% is less reliable. None of the treatments have a 90% probability of being best treatment.
Con: continuous; Int: intermittent; HVE: hepatic vascular exclusion; PTC: portal triad clamping.

Methods of vascular occlusion: adverse events (proportion)
Forest plot of the comparisons in which direct and indirect estimates were available. There does not appear to be any discrepancies between direct and indirect estimates. Direct evidence appears to be preferable over indirect evidence and network meta‐analysis based on the quality of evidence.
1Risk of bias was unclear or high in the trial(s) (downgraded by 1 point).
2Sample size was low (downgraded by 1 point).
3Confidence intervals spanned no effect and clinically significant effect (downgraded by 1 point).

Probability of best treatment: probability of being best, second best, third best, etc. for each treatment for blood transfusion (proportion) (vascular occlusion methods). A probability of more than 90% is a reliable indicator that a treatment is best with regards to the specific outcome. A probability of less than 90% is less reliable. None of the treatments have a 90% probability of being best treatment.
Con: continuous; Int: intermittent; HVE: hepatic vascular exclusion; PTC: portal triad clamping.

Methods of vascular occlusion: blood transfusion (proportion)
Forest plot of the comparisons in which direct and indirect estimates were available. Although the confidence intervals overlap, there appear to be some discrepancies between direct and indirect estimates for continuous portal triad clamping versus control, intermittent portal triad clamping versus control, and intermittent portal triad clamping versus continuous portal triad clamping. Direct evidence appears to be preferable over indirect evidence and network meta‐analysis based on the quality of evidence.
1Risk of bias was unclear or high in the trial(s) (downgraded by 1 point).
2Sample size was low (downgraded by 1 point).
3Confidence intervals spanned no effect and clinically significant effect (downgraded by 1 point).
4There was substantial or considerable heterogeneity (downgraded by 2 points).

Probability of best treatment: probability of being best, second best, third best, etc. for each treatment for blood transfusion (red blood cells) (vascular occlusion methods). A probability of more than 90% is a reliable indicator that a treatment is best with regards to the specific outcome. A probability of less than 90% is less reliable. Intermittent selective portal triad clamping has about 90% probability of being best treatment. However, other random and systematic errors make this finding unreliable.
Con: continuous; Int: intermittent; HVE: hepatic vascular exclusion; PTC: portal triad clamping.

Methods of vascular occlusion:blood transfusion (red blood cells)
Forest plot of the comparisons in which direct and indirect estimates were available. There do not appear to be any discrepancies between direct and indirect estimates, although the credible intervals are different (the direct evidence had narrower credible intervals in four of the five comparisons above) resulting in the differences in the comparisons in which there was evidence for difference. Direct evidence appears to be preferable over indirect evidence and network meta‐analysis based on the quality of evidence for the comparison 'continuous selective portal triad clamping versus continuous portal triad clamping'. Indirect evidence and network meta‐analysis appear to be preferable over direct evidence for the comparison 'continuous portal triad clamping versus control'. Direct evidence and network meta‐analysis appear to be preferable over indirect evidence for the comparison 'intermittent portal triad clamping versus control'. There was little apparent difference in the quality of evidence between direct, indirect estimates, and network meta‐analysis; so, we could not choose one estimate over the others based on the quality of evidence.
1Risk of bias was unclear or high in the trial(s) (downgraded by 1 point).
2Sample size was low (downgraded by 1 point).
3Confidence intervals spanned no effect and clinically significant effect (downgraded by 1 point).

Probability of best treatment: probability of being best, second best, third best, etc. for each treatment for blood loss (vascular occlusion methods). A probability of more than 90% is a reliable indicator that a treatment is best with regards to the specific outcome. A probability of less than 90% is less reliable. None of the treatments have a 90% probability of being best treatment.
Con: continuous; Int: intermittent; HVE: hepatic vascular exclusion; PTC: portal triad clamping.

Methods of vascular occlusion:blood loss
Forest plot of the comparisons in which direct and indirect estimates were available. There does not appear to be any discrepancies between direct and indirect estimates, although the credible intervals are different (the direct evidence had narrower credible intervals in three of the five comparisons above). Direct evidence appears to be preferable over indirect evidence and network meta‐analysis based on the quality of evidence.
1Risk of bias was unclear or high in the trial(s) (downgraded by 1 point).
2 Sample size was low (downgraded by 1 point).
3Confidence intervals spanned no effect and clinically significant effect (downgraded by 1 point).Ç
4There was substantial or considerable heterogeneity (downgraded by 2 points).

Funnel plot of blood transfusion (proportion): The funnel plot shows funnel plot asymmetry (i.e. some trials with large variance with large effects favouring one treatment were not matched by other trials with similarly large variance with large effects favouring the other treatment). This may be evidence of reporting bias or could be because of heterogeneity between the studies.

Funnel plot of blood transfusion (red blood cells): The funnel plot shows funnel plot asymmetry (i.e. some trials with large variance with large effects favouring one treatment were not matched by other trials with similarly large variance with large effects favouring the other treatment). This may be evidence of reporting bias or could be because of heterogeneity between the studies.

Funnel plot of blood loss: The funnel plot shows funnel plot asymmetry (i.e. some trials with large variance with large effects favouring one treatment were not matched by other trials with similarly large variance with large effects favouring the other treatment). This may be evidence of reporting bias or could be because of heterogeneity between the studies.

Comparison 1 Anterior approach vs conventional approach, Outcome 1 Mortality (perioperative).

Comparison 1 Anterior approach vs conventional approach, Outcome 2 Serious adverse events (proportion).

Comparison 1 Anterior approach vs conventional approach, Outcome 3 Adverse events (proportion).
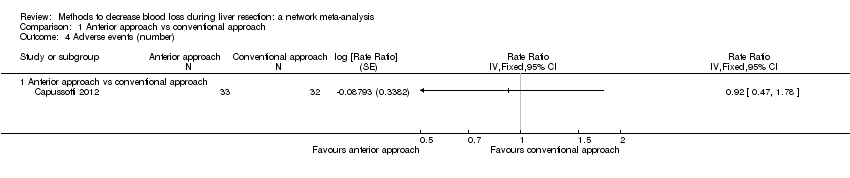
Comparison 1 Anterior approach vs conventional approach, Outcome 4 Adverse events (number).
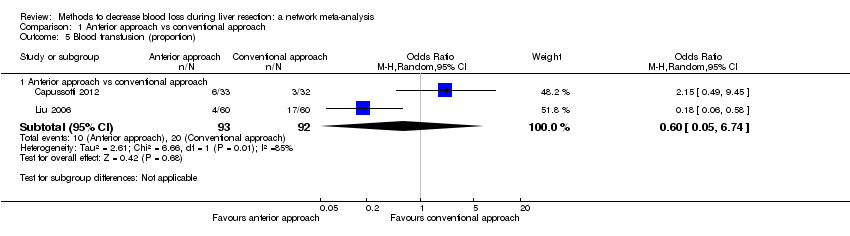
Comparison 1 Anterior approach vs conventional approach, Outcome 5 Blood transfusion (proportion).
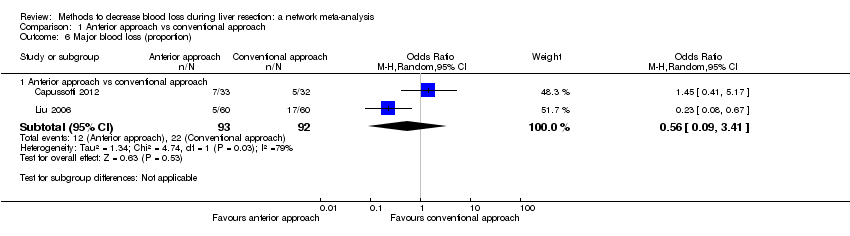
Comparison 1 Anterior approach vs conventional approach, Outcome 6 Major blood loss (proportion).

Comparison 2 Autologous blood donation vs control, Outcome 1 Adverse events (proportion).

Comparison 2 Autologous blood donation vs control, Outcome 2 Blood transfusion (proportion).
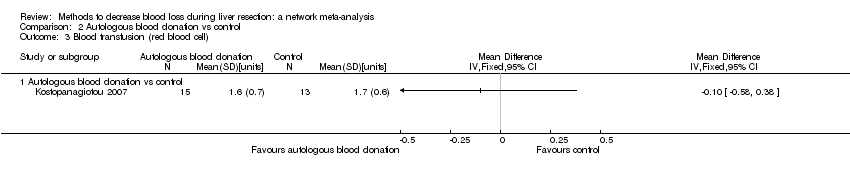
Comparison 2 Autologous blood donation vs control, Outcome 3 Blood transfusion (red blood cell).

Comparison 2 Autologous blood donation vs control, Outcome 4 Blood loss.

Comparison 2 Autologous blood donation vs control, Outcome 5 Major blood loss (proportion).

Comparison 2 Autologous blood donation vs control, Outcome 6 Total hospital stay.

Comparison 2 Autologous blood donation vs control, Outcome 7 Operating time.

Comparison 3 Cardiopulmonary interventions, Outcome 1 Mortality (perioperative).

Comparison 3 Cardiopulmonary interventions, Outcome 2 Serious adverse events (proportion).

Comparison 3 Cardiopulmonary interventions, Outcome 3 Serious adverse events (number).
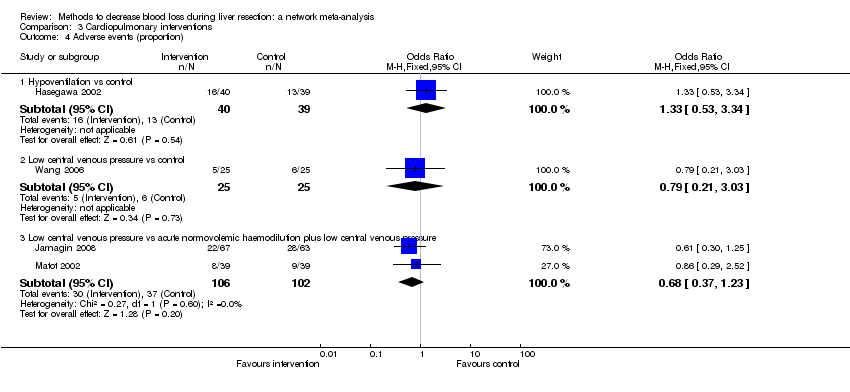
Comparison 3 Cardiopulmonary interventions, Outcome 4 Adverse events (proportion).

Comparison 3 Cardiopulmonary interventions, Outcome 5 Adverse events (number).

Comparison 3 Cardiopulmonary interventions, Outcome 6 Blood transfusion (proportion).

Comparison 3 Cardiopulmonary interventions, Outcome 7 Blood transfusion (red blood cell).
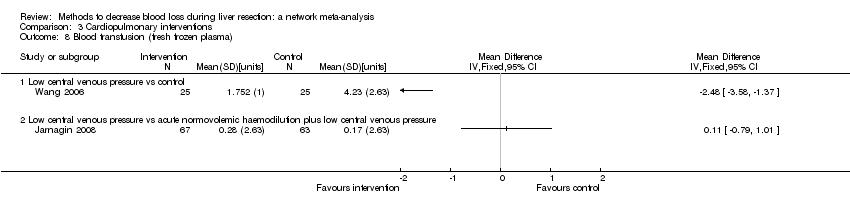
Comparison 3 Cardiopulmonary interventions, Outcome 8 Blood transfusion (fresh frozen plasma).
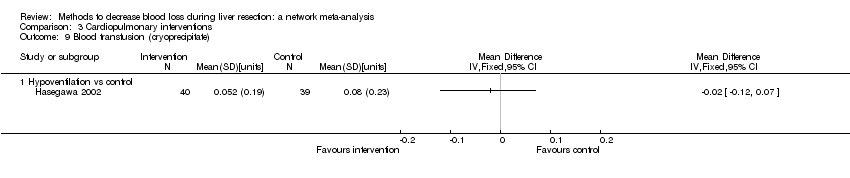
Comparison 3 Cardiopulmonary interventions, Outcome 9 Blood transfusion (cryoprecipitate).
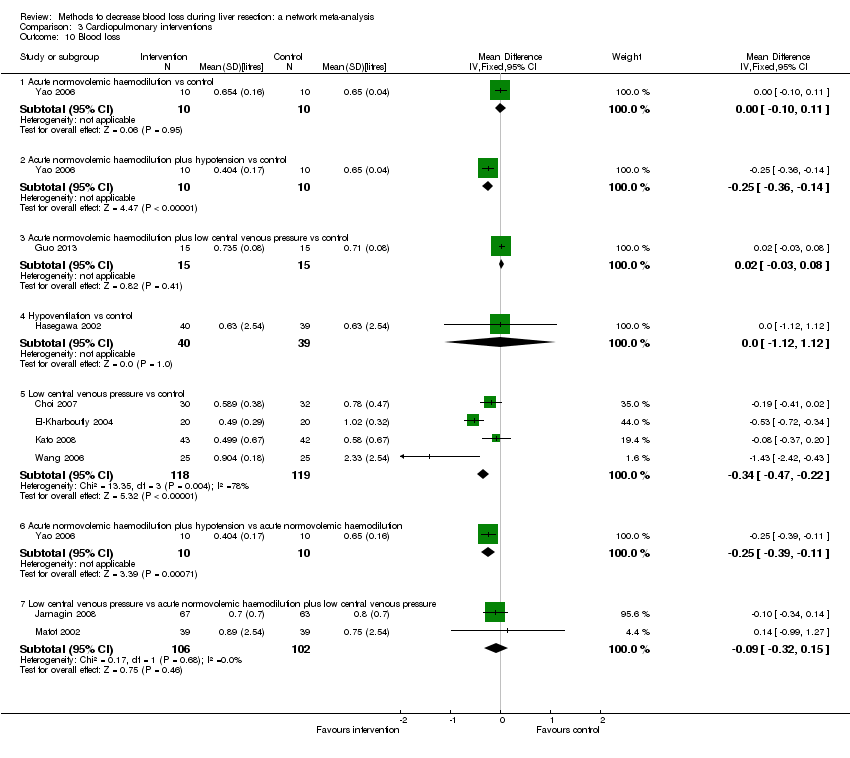
Comparison 3 Cardiopulmonary interventions, Outcome 10 Blood loss.
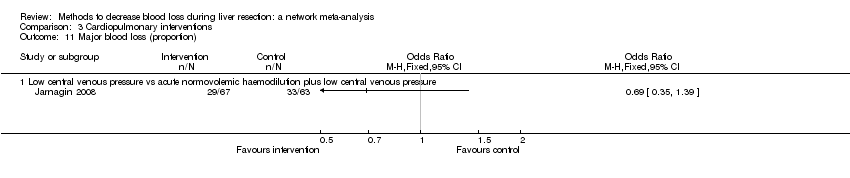
Comparison 3 Cardiopulmonary interventions, Outcome 11 Major blood loss (proportion).

Comparison 3 Cardiopulmonary interventions, Outcome 12 Hospital stay.
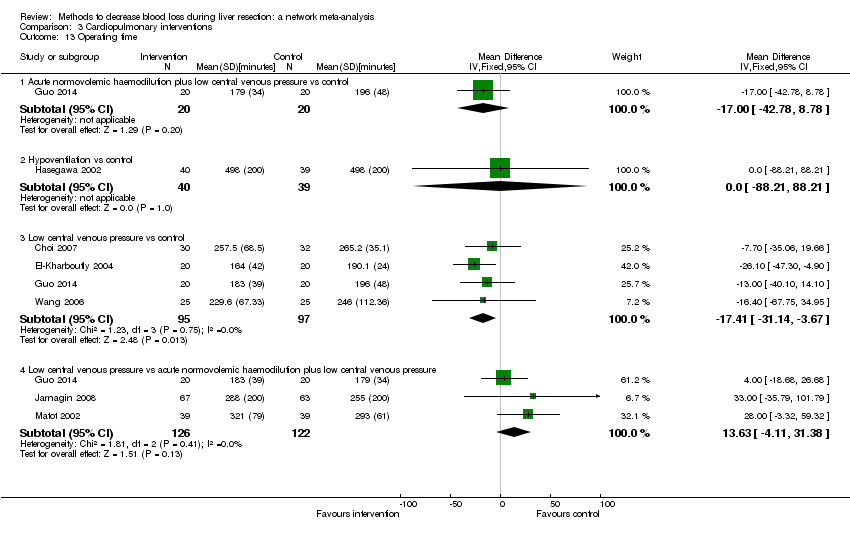
Comparison 3 Cardiopulmonary interventions, Outcome 13 Operating time.

Comparison 4 Methods of parenchymal transection, Outcome 1 Mortality (perioperative).
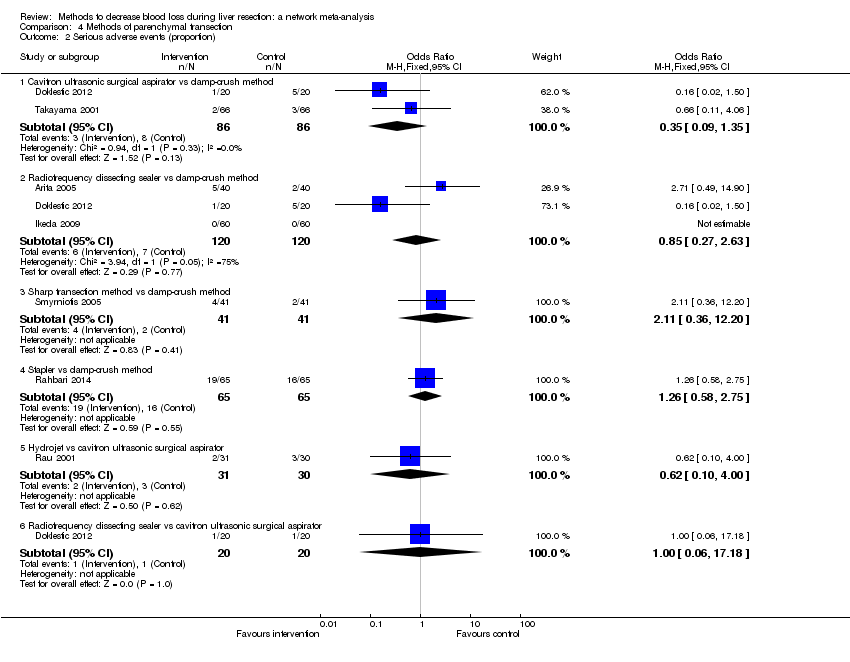
Comparison 4 Methods of parenchymal transection, Outcome 2 Serious adverse events (proportion).

Comparison 4 Methods of parenchymal transection, Outcome 3 Serious adverse events (number).

Comparison 4 Methods of parenchymal transection, Outcome 4 Adverse events (proportion).

Comparison 4 Methods of parenchymal transection, Outcome 5 Adverse events (number).

Comparison 4 Methods of parenchymal transection, Outcome 6 Blood transfusion (proportion).

Comparison 4 Methods of parenchymal transection, Outcome 7 Blood transfusion (red blood cell).

Comparison 4 Methods of parenchymal transection, Outcome 8 Blood transfusion (fresh frozen plasma).
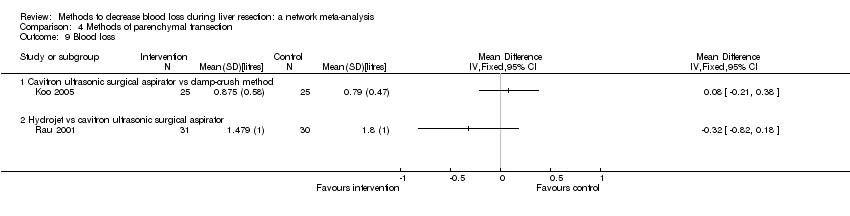
Comparison 4 Methods of parenchymal transection, Outcome 9 Blood loss.

Comparison 4 Methods of parenchymal transection, Outcome 10 Operating time.
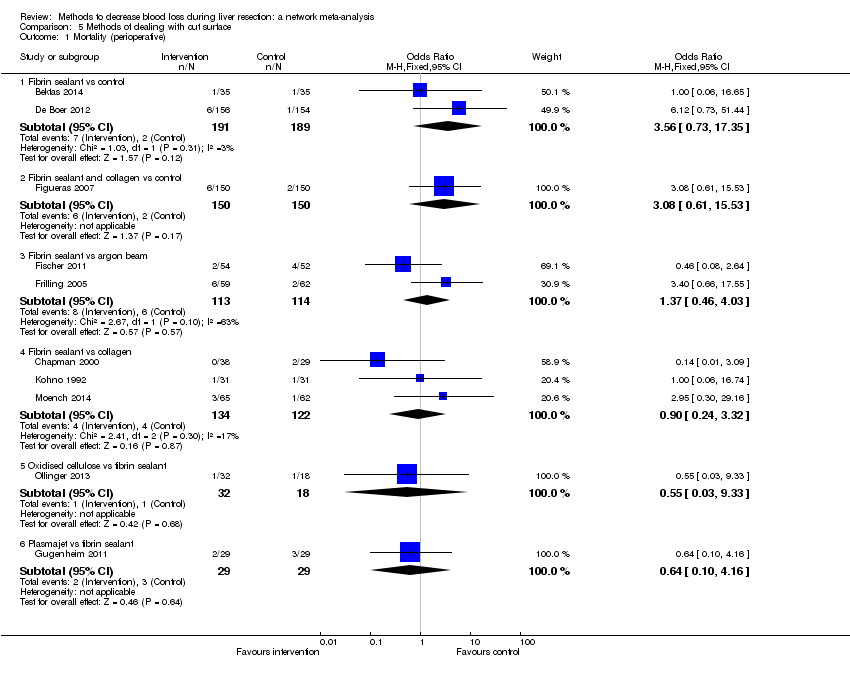
Comparison 5 Methods of dealing with cut surface, Outcome 1 Mortality (perioperative).

Comparison 5 Methods of dealing with cut surface, Outcome 2 Serious adverse events (proportion).

Comparison 5 Methods of dealing with cut surface, Outcome 3 Serious adverse events (number).

Comparison 5 Methods of dealing with cut surface, Outcome 4 Adverse events (proportion).

Comparison 5 Methods of dealing with cut surface, Outcome 5 Adverse events (number).
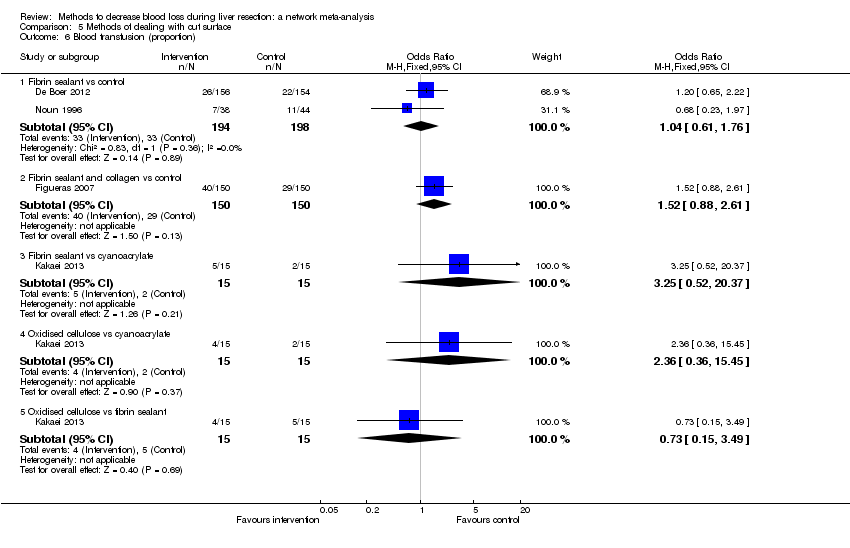
Comparison 5 Methods of dealing with cut surface, Outcome 6 Blood transfusion (proportion).
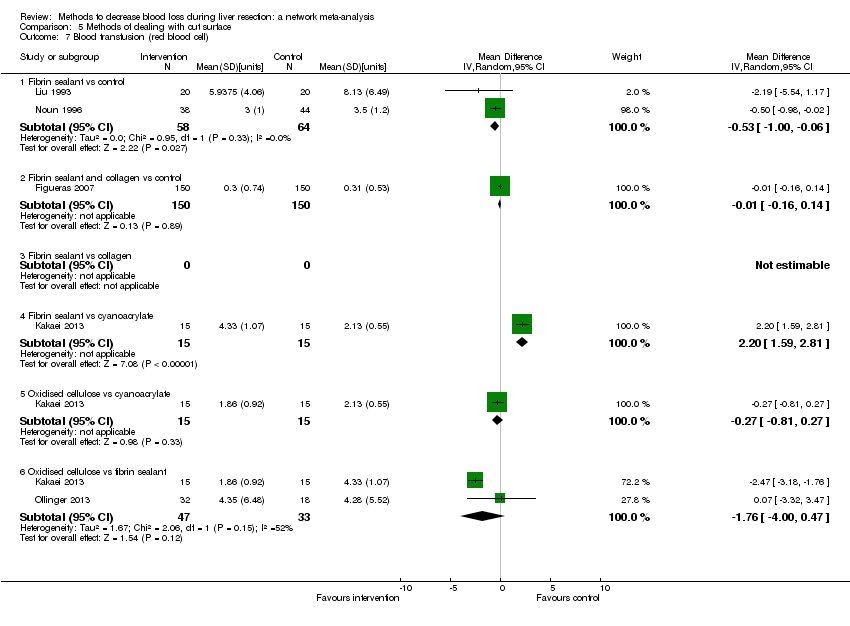
Comparison 5 Methods of dealing with cut surface, Outcome 7 Blood transfusion (red blood cell).

Comparison 5 Methods of dealing with cut surface, Outcome 8 Blood transfusion (fresh frozen plasma).

Comparison 5 Methods of dealing with cut surface, Outcome 9 Blood loss.

Comparison 5 Methods of dealing with cut surface, Outcome 10 Total hospital stay.
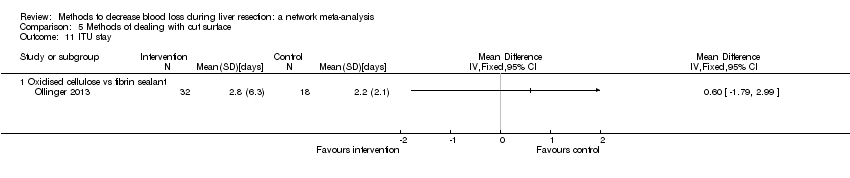
Comparison 5 Methods of dealing with cut surface, Outcome 11 ITU stay.

Comparison 5 Methods of dealing with cut surface, Outcome 12 Operating time.

Comparison 6 Methods of vascular occlusion, Outcome 1 Mortality (perioperative).

Comparison 6 Methods of vascular occlusion, Outcome 2 Serious adverse events (proportion).
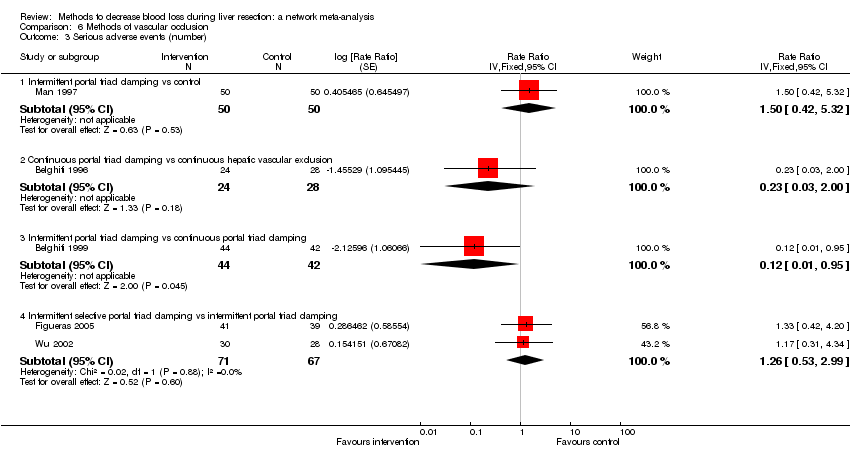
Comparison 6 Methods of vascular occlusion, Outcome 3 Serious adverse events (number).
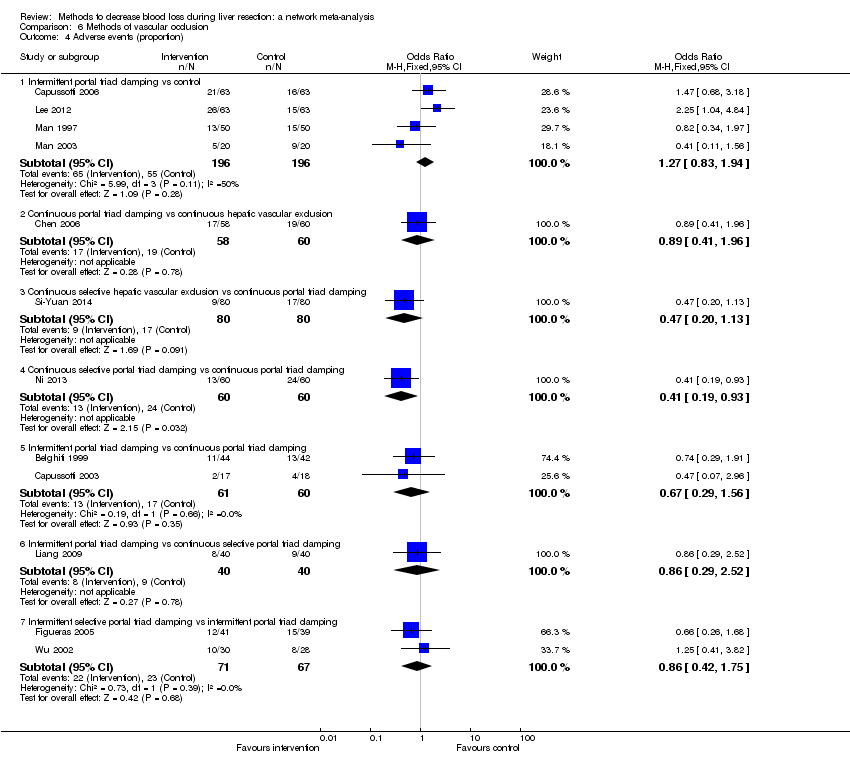
Comparison 6 Methods of vascular occlusion, Outcome 4 Adverse events (proportion).

Comparison 6 Methods of vascular occlusion, Outcome 5 Adverse events (number).

Comparison 6 Methods of vascular occlusion, Outcome 6 Blood transfusion (proportion).
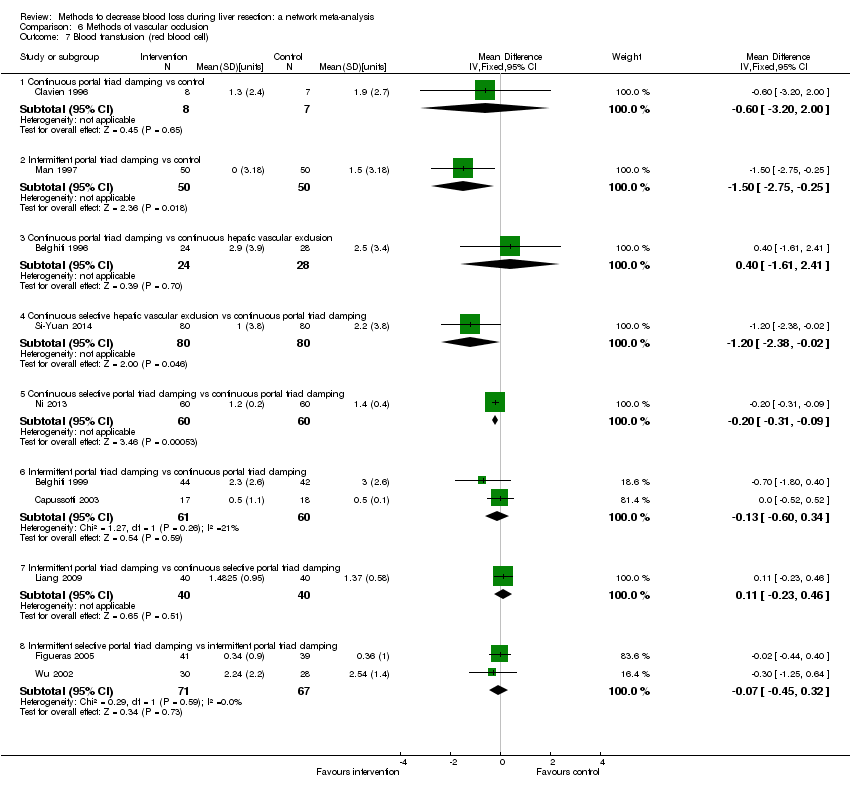
Comparison 6 Methods of vascular occlusion, Outcome 7 Blood transfusion (red blood cell).
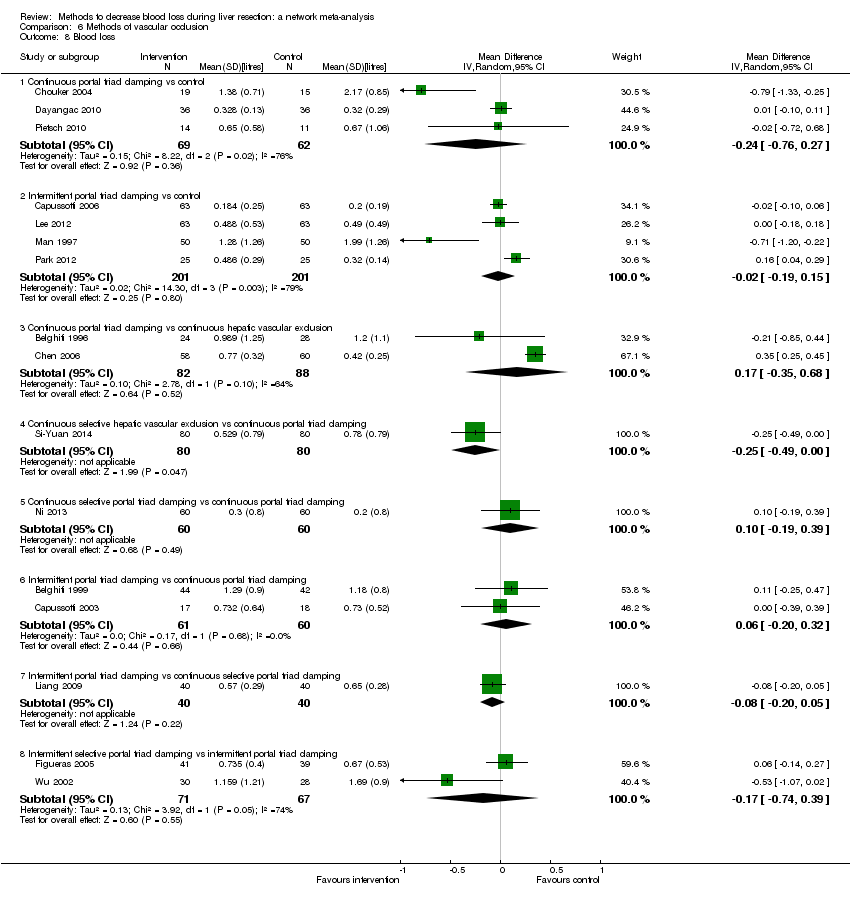
Comparison 6 Methods of vascular occlusion, Outcome 8 Blood loss.

Comparison 6 Methods of vascular occlusion, Outcome 9 Major blood loss (proportion).

Comparison 6 Methods of vascular occlusion, Outcome 10 Total hospital stay.

Comparison 6 Methods of vascular occlusion, Outcome 11 ITU stay.

Comparison 6 Methods of vascular occlusion, Outcome 12 Operating time.

Comparison 7 Pharmacological interventions, Outcome 1 Mortality (perioperative).

Comparison 7 Pharmacological interventions, Outcome 2 Serious adverse events (proportion).
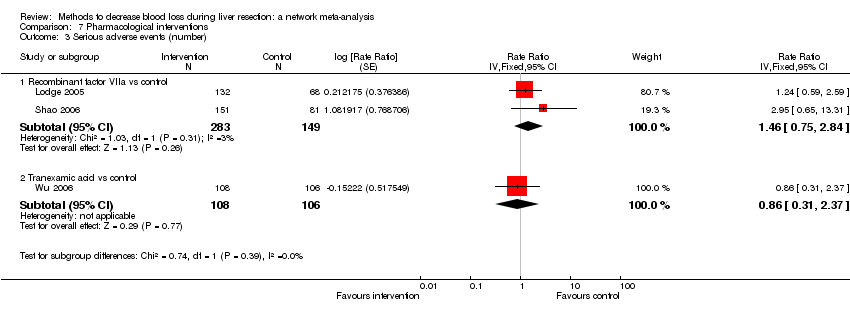
Comparison 7 Pharmacological interventions, Outcome 3 Serious adverse events (number).

Comparison 7 Pharmacological interventions, Outcome 4 Adverse events (proportion).
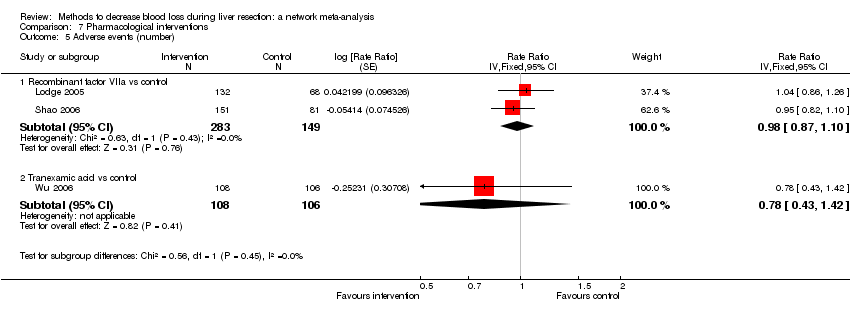
Comparison 7 Pharmacological interventions, Outcome 5 Adverse events (number).
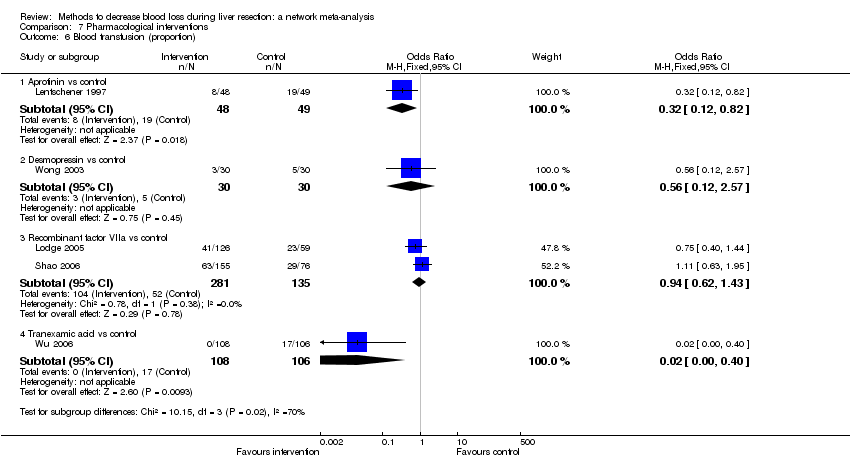
Comparison 7 Pharmacological interventions, Outcome 6 Blood transfusion (proportion).

Comparison 7 Pharmacological interventions, Outcome 7 Blood transfusion (fresh frozen plasma).

Comparison 7 Pharmacological interventions, Outcome 8 Blood loss.

Comparison 7 Pharmacological interventions, Outcome 9 Hospital stay.

Comparison 7 Pharmacological interventions, Outcome 10 Operating time.
| Methods to decrease blood loss during liver resection: a network meta‐analysis. Primary outcomes | |||||||
| Patient or population: people undergoing liver resection Settings: secondary or tertiary setting Intervention and control: various treatments Follow‐up: until discharge or 1 month (except for mortality (long‐term follow‐up) which was reported at 1 year | |||||||
| Outcomes | Anterior approach versus conventional approach | Autologous blood donation versus control | Cardiopulmonary interventions | Methods of parenchymal transection | Methods of dealing with cut surface | Methods of vascular occlusion | Pharmacological interventions |
| Treatments The first treatment listed is the control. The remaining are interventions. |
|
|
|
|
|
|
|
| Link for detailed 'Summary of Findings tables' | |||||||
| Mortality (perioperative) | There was no evidence of differences in perioperative mortality between the 2 groups. Quality of evidence = very low1,2,3. | There was no evidence of differences in perioperative mortality between the two groups. Quality of evidence = very low1,2,3. | There was no evidence of differences in perioperative mortality for any of the comparisons. Quality of evidence = very low1,2,3. | There was no evidence of differences in perioperative mortality for any of the comparisons. Quality of evidence = very low1,2,3. | There was no evidence of differences in perioperative mortality for any of the comparisons Quality of evidence = very low1,2,3. | There was no evidence of differences in perioperative mortality for any of the comparisons. Quality of evidence = very low1,2,3. | There was no evidence of differences in perioperative mortality for any of the comparisons. Quality of evidence = very low1,2,3. |
| Mortality (longest follow‐up) | None of the trials reported this outcome. | There was no evidence of differences in mortality at 1 year between the 2 groups. Quality of evidence = very low)1,2,3. | None of the trials reported this outcome. | None of the trials reported this outcome. | None of the trials reported this outcome. | None of the trials reported this outcome. | None of the trials reported this outcome. |
| Serious adverse events (proportion) | There was no evidence of differences in the proportion of participants experiencing serious adverse events between the 2 groups. Quality of evidence = very low1,2,3. | None of the trials reported this outcome. | There was no evidence of differences in the proportion of participants experiencing serious adverse events (for any of the comparisons Quality of evidence = very low1,2,3. | There was no evidence of differences in the proportion of participants experiencing serious adverse events for any of the comparisons Quality of evidence = very low1,2,3. | There was no evidence of differences in the proportion of participants experiencing serious adverse events for any of the comparisons Quality of evidence = very low1,2,3. | The proportion of participants experiencing serious adverse eventsa was lower in continuous selective portal triad clamping than continuous portal triad clamping
There was no evidence of differences in other comparisons. Quality of evidence = very low1,2,3 | There was no evidence of differences in the proportion of participants experiencing serious adverse events for any of the comparisons Quality of evidence = very low1,2,3. |
| Serious adverse events (number) | None of the trials reported this outcome. | None of the trials reported this outcome. | There was no evidence of differences in the number of serious adverse events for any of the comparisons Quality of evidence = very low1,2,3. | The number of serious adverse events was higher in radiofrequency dissecting sealer than clamp‐crush method.
There was no evidence of differences in other comparisons. Quality of evidence = very low1,2,3. | The number of serious adverse events was higher in fibrin sealant than argon beam.
There was no evidence of differences in other comparisons. Quality of evidence = very low1,2,3. | The number of serious adverse events was lower in intermittent portal triad clamping than continuous portal triad clamping.
There was no evidence of differences in other comparisons Quality of evidence = very low1,2,3. | There was no evidence of differences in the number of serious adverse events for any of the comparisons Quality of evidence = very low1,2,3. |
| Health‐related quality of life | None of the trials reported this outcome. | None of the trials reported this outcome. | None of the trials reported this outcome at any time point. | None of the trials reported this outcome at any time point. | None of the trials reported this outcome at any time point. | None of the trials reported this outcome at any time point. | None of the trials reported this outcome at any time point. |
| CrI: credible intervals; OR: odds ratio. | |||||||
| GRADE Working Group grades of evidence | |||||||
| 1 Risk of bias was unclear or high in the trial(s) (downgraded by 1 point). | |||||||
| Outcomes | Illustrative comparative risks* (95% CrI) | Relative effect (95% CrI) | No of participants | Quality of the evidence | |
| Assumed risk | Corresponding risk | ||||
| Control | Intervention | ||||
| Mortality (perioperative) | 76 per 1000 | 19 per 1000 | OR 0.23 | 185 | ⊕⊝⊝⊝ |
| Mortality (longest follow‐up) | None of the trials reported this outcome. | ||||
| Serious adverse events (proportion) | 125 per 1000 | 154 per 1000 | OR 1.27 | 65 | ⊕⊝⊝⊝ |
| Serious adverse events (number) | None of the trials reported this outcome. | ||||
| Health‐related quality of life (30 days, 3 months) | None of the trials reported this outcome. | ||||
| Health‐related quality of life (maximal follow‐up) | None of the trials reported this outcome. | ||||
| *The basis for the assumed risk is the mean control group proportion. The corresponding risk (and its 95% credible interval) is based on the assumed risk in the comparison group and the relative effect of the intervention (and its 95% CrI). Network meta‐analysis was not performed for any of the outcomes since there were only two treatments. CrI: credible intervals; OR: odds ratio. | |||||
| GRADE Working Group grades of evidence | |||||
| 1 Risk of bias was unclear or high in the trial(s) (downgraded by 1 point). | |||||
| Outcomes | Illustrative comparative risks* (95% CrI) | Relative effect (95% CrI) | No of participants | Quality of the evidence | |
| Assumed risk | Corresponding risk | ||||
| Control | Intervention | ||||
| Mortality (perioperative) | There was no mortality in either group. | 28 (1 study) | ⊕⊝⊝⊝ Very low1,2,3 | ||
| Mortality (longest follow‐up): reported at 1 year | There was no mortality in either group. | 28 (1 study) | ⊕⊝⊝⊝ Very low1,2,3 | ||
| Serious adverse events (proportion) | None of the trials reported this outcome. | ||||
| Serious adverse events (number) | None of the trials reported this outcome. | ||||
| Health‐related quality of life (30 days, 3 months) | None of the trials reported this outcome. | ||||
| Health‐related quality of life (longest follow‐up) | None of the trials reported this outcome. | ||||
| *The basis for the assumed risk is the mean control group proportion. The corresponding risk (and its 95% credible interval) is based on the assumed risk in the comparison group and the relative effect of the intervention (and its 95% CrI). Network meta‐analysis was not performed for any of the outcomes since there were only two treatments. CrI: credible intervals; OR: odds ratio | |||||
| GRADE Working Group grades of evidence | |||||
| 1 Risk of bias was unclear or high in the trial(s) (downgraded by 1 point). | |||||
| Outcomes | Illustrative comparative risks* (95% CrI) | Relative effect (95% CrI) | No of participants | Quality of the evidence | |
| Assumed risk | Corresponding risk | ||||
| Control | Intervention | ||||
| Mortality (perioperative) | |||||
| Hypoventilation vs control | There was no mortality in either group. | 79 (1 study) | ⊕⊝⊝⊝ Very low1,2,3 | ||
| Low central venous pressure vs control | There was no mortality in either group. | 85 (1 study) | ⊕⊝⊝⊝ Very low1,2,3 | ||
| Mortality (longest follow‐up) | None of the trials reported this outcome. | ||||
| Serious adverse events (proportion) | |||||
| Hypoventilation vs control | 26 per 1000 | 60 per 1000 (5 to 679) | OR 2.41 (0.18 to 80.4) | 79 (1 study) | ⊕⊝⊝⊝ Very low1,2,3 |
| Low central venous pressure vs acute normovolemic haemodilution plus low CVP | 302 per 1000 | 284 per 1000 (157 to 460) | OR 0.92 (0.43 to 1.97) | 63 (1 study) | ⊕⊝⊝⊝ Very low1,2,3 |
| Serious adverse events (number) | |||||
| Low central venous pressure vs control | 100 per 1000 | 0 per 1000 (0 to 2) | Rate ratio 0.00 (0 to 0.02) | 42 (1 study) | ⊕⊝⊝⊝ Very lowa,b,c |
| Low central venous pressure vs acute normovolemic haemodilution plus low central venous pressure | 103 per 1000 | 77 per 1000 (15 to 287) | Rate ratio 0.73 (0.13 to 3.53) | 78 (1 study) | ⊕⊝⊝⊝ Very lowa,b,c |
| Health‐related quality of life (30 days, 3 months) | None of the trials reported this outcome. | ||||
| Health‐related quality of life (longest follow‐up) | None of the trials reported this outcome. | ||||
| *The basis for the assumed risk is the mean control group proportion. The corresponding risk (and its 95% credible interval) is based on the assumed risk in the comparison group and the relative effect of the intervention (and its 95% CrI). Network meta‐analysis was not performed for any of the outcomes because of the lack of availability of direct and indirect comparisons in the network. CrI: credible intervals; OR: odds ratio. | |||||
| GRADE Working Group grades of evidence | |||||
| 1aRisk of bias was unclear or high in the trial(s) (downgraded by 1 point). | |||||
| Outcomes | Illustrative comparative risks* (95% CrI) | Relative effect (95% CrI) | No of participants | Quality of the evidence | |
| Assumed risk | Corresponding risk | ||||
| Control | Intervention | ||||
| Mortality (perioperative) | |||||
| CUSA vs clamp‐crush method | 23 per 1000 | 6 per 1000 (0 to 54) | OR 0.24 (0.01 to 2.41) | 172 (2 studies) | ⊕⊝⊝⊝ Very low1,2,3 |
| Radiofrequency dissecting sealer vs clamp‐crush method | 10 per 1000 | 16 per 1000 (4 to 65) | OR 1.60 (0.43 to 6.7) | 390 (5 studies) | ⊕⊝⊝⊝ Very low1,2,3 |
| Sharp transection method vs clamp‐crush method | There was no mortality in either group. | 82 (1 study) | ⊕⊝⊝⊝ Very low1,2,3 | ||
| Stapler vs clamp‐crush method | 31 per 1000 | 67 per 1000 (12 to 375) | OR 2.26 (0.39 to 18.93) | 130 (1 study) | ⊕⊝⊝⊝ Very low1,2,3 |
| Hydrojet vs CUSA | 55 per 1000 | 54 per 1000 (9 to 258) | OR 0.98 (0.16 to 6.04) | 111 (2 studies) | ⊕⊝⊝⊝ Very low1,2,3 |
| Radiofrequency dissecting sealer vs CUSA | 44 per 1000 | 28 per 1000 (3 to 166) | OR 0.61 (0.07 to 4.28) | 90 (2 studies) | ⊕⊝⊝⊝ Very low1,2,3 |
| Stapler vs CUSA | There was no mortality in either group. | 79 (1 study) | ⊕⊝⊝⊝ Very low1,2,3 | ||
| Radiofrequency dissecting sealer vs hydrojet | 80 per 1000 | 9 per 1000 (0 to 145) | OR 0.10 (0 to 1.95) | 50 (1 study) | ⊕⊝⊝⊝ Very low1,2,3 |
| Mortality (longest follow‐up) | None of the trials reported this outcome. | ||||
| Serious adverse events (proportion) | |||||
| CUSA vs clamp‐crush method | 93 per 1000 | 31 per 1000 (6 to 110) | OR 0.31 (0.06 to 1.2) | 172 (2 studies) | ⊕⊝⊝⊝ Very low1,2,3 |
| Radiofrequency dissecting sealer vs clamp‐crush method | 58 per 1000 | 49 per 1000 (15 to 145) | OR 0.83 (0.24 to 2.74) | 240 (3 studies) | ⊕⊝⊝⊝ Very low1,2,3 |
| Sharp transection method vs clamp‐crush method | 49 per 1000 | 106 per 1000 (20 to 502) | OR 2.31 (0.39 to 19.69) | 82 (1 study) | ⊕⊝⊝⊝ Very low1,2,3 |
| Hydrojet vs CUSA | 100 per 1000 | 124 per 1000 (61 to 238) | OR 1.27 (0.58 to 2.81) | 61 (1 study) | ⊕⊝⊝⊝ Very low1,2,3 |
| Radiofrequency dissecting sealer vs CUSA | 50 per 1000 | 30 per 1000 (3 to 180) | OR 0.58 (0.06 to 4.16) | 40 (1 study) | ⊕⊝⊝⊝ Very low1,2,3 |
| Stapler vs CUSA | 246 per 1000 | 246 per 1000 (6 to 931) | OR 1.00 (0.02 to 41.22) | 130 (1 study) | ⊕⊝⊝⊝ Very low1,2,3 |
| Serious adverse events (number) | |||||
| CUSA vs clamp‐crush method | 45 per 1000 | 29 per 1000 (3 to 166) | Rate ratio 0.63 (0.07 to 4.17) | 132 (1 study) | ⊕⊝⊝⊝ Very low1,2,3 |
| Radiofrequency dissecting sealer vs clamp‐crush method | 61 per 1000 | 190 per 1000 (75 to 474) | Rate ratio 3.64 (1.25 to 13.97) | 130 (2 studies) | ⊕⊕⊝⊝ Low1,2 |
| Hydrojet vs CUSA | 80 per 1000 | 121 per 1000 (20 to 546) | Rate ratio 1.59 (0.24 to 13.83) | 50 (1 study) | ⊕⊝⊝⊝ Very low1,2,3 |
| Radiofrequency dissecting sealer vs CUSA | 80 per 1000 | 121 per 1000 (20 to 546) | Rate ratio 1.59 (0.24 to 13.83) | 50 (1 study) | ⊕⊝⊝⊝ Very low1,2,3 |
| Stapler vs CUSA | 180 per 1000 | 230 per 1000 (109 to 424) | Rate ratio 1.36 (0.56 to 3.36) | 100 (1 study) | ⊕⊝⊝⊝ Very low1,2,3 |
| Radiofrequency dissecting sealer vs hydrojet | 120 per 1000 | 120 per 1000 (23 to 445) | Rate ratio 1.00 (0.17 to 5.88) | 50 (1 study) | ⊕⊝⊝⊝ Very low1,2,3 |
| Health‐related quality of life (30 days, 3 months) | None of the trials reported this outcome. | ||||
| Health‐related quality of life (maximal follow‐up) | None of the trials reported this outcome. | ||||
| *The basis for the assumed risk is the mean control group proportion. The corresponding risk (and its 95% credible interval) is based on the assumed risk in the comparison group and the relative effect of the intervention (and its 95% CrI). Network meta‐analysis was not performed for any of the outcomes because of the lack of availability of direct and indirect comparisons in the network. CrI: credible intervals; CUSA: cavitron ultrasonic surgical aspirator; OR: odds ratio | |||||
| GRADE Working Group grades of evidence | |||||
| 1 Risk of bias was unclear or high in the trial(s) (downgraded by 1 point). | |||||
| Outcomes | Illustrative comparative risks* (95% CrI) | Relative effect (95% CrI) | No of participants | Quality of the evidence | |
| Assumed risk | Corresponding risk | ||||
| Control | Intervention | ||||
| Mortality (perioperative) | |||||
| Fibrin sealant vs control | 11 per 1000 | 41 per 1000 (10 to 253) | OR 4.03 (0.9 to 31.72) | 380 (2 studies) | ⊕⊝⊝⊝ Very low1,2,3 |
| Fibrin sealant and collagen vs control | 13 per 1000 | 45 per 1000 (10 to 268) | OR 3.48 (0.74 to 27.03) | 300 (1 study) | ⊕⊝⊝⊝ Very low1,2,3 |
| Fibrin sealant vs argon beam | 53 per 1000 | 72 per 1000 (25 to 198) | OR 1.39 (0.46 to 4.45) | 227 (2 studies) | ⊕⊝⊝⊝ Very low1,2,3 |
| Fibrin sealant vs collagen | 33 per 1000 | 30 per 1000 (7 to 123) | OR 0.91 (0.2 to 4.14) | 256 (3 studies) | ⊕⊝⊝⊝ Very low1,2,3 |
| Oxidised cellulose vs fibrin sealant | 56 per 1000 | 31 per 1000 (1 to 565) | OR 0.54 (0.01 to 22.09) | 50 (1 study) | ⊕⊝⊝⊝ Very low1,2,3 |
| Plasmajet vs fibrin sealant | 103 per 1000 | 65 per 1000 (7 to 332) | OR 0.60 (0.06 to 4.31) | 58 (1 study) | ⊕⊝⊝⊝ Very low1,2,3 |
| Mortality (longest follow‐up) | None of the trials reported this outcome. | ||||
| Serious adverse events (proportion) | |||||
| Fibrin sealant vs control | 186 per 1000 | 191 per 1000 (128 to 275) | OR 1.03 (0.64 to 1.66) | 457 (3 studies) | ⊕⊝⊝⊝ Very low1,2,3 |
| Fibrin sealant vs argon beam | 269 per 1000 | 183 per 1000 (78 to 360) | OR 0.61 (0.23 to 1.53) | 106 (1 study) | ⊕⊝⊝⊝ Very low1,2,3 |
| Fibrin sealant vs collagen | 258 per 1000 | 356 per 1000 (205 to 547) | OR 1.59 (0.74 to 3.47) | 127 (1 study) | ⊕⊝⊝⊝ Very low1,2,3 |
| Oxidised cellulose vs fibrin sealant | 444 per 1000 | 309 per 1000 (113 to 603) | OR 0.56 (0.16 to 1.9) | 50 (1 study) | ⊕⊝⊝⊝ Very low1,2,3 |
| Plasmajet vs fibrin sealant | 207 per 1000 | 25 per 1000 (0 to 165) | OR 0.10 (0 to 0.76) | 58 (1 study) | ⊕⊝⊝⊝ Very low1,2,3 |
| Serious adverse events (number) | |||||
| Fibrin sealant vs control | 486 per 1000 | 470 per 1000 (307 to 640) | Rate ratio 0.94 (0.47 to 1.88) | 70 (1 study) | ⊕⊝⊝⊝ Very low1,2,3 |
| Fibrin sealant & collagen vs control | 147 per 1000 | 186 per 1000 (116 to 286) | Rate ratio 1.33 (0.76 to 2.33) | 300 (1 study) | ⊕⊝⊝⊝ Very low1,2,3 |
| Fibrin sealant vs argon beam | 65 per 1000 | 249 per 1000 (107 to 547) | Rate ratio 4.81 (1.73 to 17.5) | 121 (1 study) | ⊕⊕⊝⊝ Low1,2 |
| Fibrin sealant vs collagen | 323 per 1000 | 369 per 1000 (266 to 488) | Rate ratio 1.23 (0.76 to 2) | 189 (2 studies) | ⊕⊝⊝⊝ Very low1,2,3 |
| Fibrin sealant vs cyanoacrylate | 67 per 1000 | 67 per 1000 (2 to 733) | Rate ratio 1.01 (0.03 to 38.36) | 30 (1 study) | ⊕⊝⊝⊝ Very low1,2,3 |
| Oxidised cellulose vs cyanoacrylate | 67 per 1000 | 277 per 1000 (46 to 921) | Rate ratio 5.37 (0.67 to 163.2) | 30 (1 study) | ⊕⊝⊝⊝ Very low1,2,3 |
| Oxidised cellulose vs fibrin sealant | 67 per 1000 | 278 per 1000 (46 to 926) | Rate ratio 5.40 (0.67 to 174.86) | 30 (1 study) | ⊕⊝⊝⊝ Very low1,2,3 |
| Health‐related quality of life (30 days, 3 months) | None of the trials reported this outcome. | ||||
| Health‐related quality of life (longest follow‐up) | None of the trials reported this outcome. | ||||
| *The basis for the assumed risk is the mean control group proportion. The corresponding risk (and its 95% credible interval) is based on the assumed risk in the comparison group and the relative effect of the intervention (and its 95% CrI). Network meta‐analysis was not performed for any of the outcomes because of the lack of availability of direct and indirect comparisons in the network. CrI: credible intervals; OR: odds ratio. | |||||
| GRADE Working Group grades of evidence | |||||
| 1 Risk of bias was unclear or high in the trial(s) (downgraded by 1 point). | |||||
| Outcomes | Illustrative comparative risks* (95% CrI) | Relative effect (95% CrI) | No of participants | Quality of the evidence | |
| Assumed risk | Corresponding risk | ||||
| Control | Intervention | ||||
| Mortality (perioperative) | |||||
| Continuous portal triad clamping vs control | There was no mortality in either group. | 15 (1 study) | ⊕⊝⊝⊝ Very low1,2,3 | ||
| Intermittent portal triad clamping vs control | 26 per 1000 | 15 per 1000 (3 to 60) | OR 0.60 (0.13 to 2.42) | 392 (4 studies) | ⊕⊝⊝⊝ Very low1,2,3 |
| Continuous portal triad clamping vs continuous hepatic vascular exclusion | 1 per 1000 | 5 per 1000 (4 to 15) | OR 4.91 (3.68 to 15.64) | 170 (2 studies) | ⊕⊝⊝⊝ Very low1,2,3 |
| Continuous selective hepatic vascular exclusion vs continuous portal triad clamping | There was no mortality in either group. | 160 (1 study) | ⊕⊝⊝⊝ Very low1,2,3 | ||
| Continuous selective portal triad clamping vs continuous portal triad clamping | There was no mortality in either group. | 120 (1 study) | ⊕⊝⊝⊝ Very low1,2,3 | ||
| Intermittent portal triad clamping vs continuous portal triad clamping | 67 per 1000 | 10 per 1000 (0 to 70) | OR 0.14 (0 to 1.05) | 121 (2 studies) | ⊕⊝⊝⊝ Very low1,2,3 |
| Intermittent portal triad clamping vs continuous selective portal triad clamping | There was no mortality in either group. | 80 (1 study) | ⊕⊝⊝⊝ Very low1,2,3 | ||
| Intermittent selective portal triad clamping vs intermittent portal triad clamping | 1 per 1000 | 2 per 1000 (0 to 69) | OR 2.27 (0.17 to 74) | 138 (2 studies) | ⊕⊝⊝⊝ Very low1,2,3 |
| Mortality (longest follow‐up) | None of the trials reported this outcome. | ||||
| Serious adverse events (proportion)* | |||||
| Continuous hepatic vascular exclusion vs control | 99 per 1000 | 200 per 1000 (19 to 785) | Rate ratio 2.27 (0.18 to 33.05) | 815 (6 studies) | ⊕⊝⊝⊝ Very low1,2,3 |
| Continuous portal triad clamping vs control | 99 per 1000 | 135 per 1000 (30 to 439) | Rate ratio 1.42 (0.28 to 7.09) | 815 (6 studies) | ⊕⊝⊝⊝ Very low1,2,3 |
| Continuous selective hepatic vascular exclusion vs control | 99 per 1000 | 15 per 1000 (0 to 325) | Rate ratio 0.14 (0 to 4.37) | 815 (6 studies) | ⊕⊝⊝⊝ Very low1,2,3 |
| Continuous selective portal triad clamping vs control | 99 per 1000 | 55 per 1000 (11 to 226) | Rate ratio 0.53 (0.1 to 2.65) | 815 (6 studies) | ⊕⊝⊝⊝ Very low1,2,3 |
| Intermittent portal triad clamping vs control | 99 per 1000 | 113 per 1000 (56 to 217) | Rate ratio 1.16 (0.54 to 2.51) | 815 (6 studies) | ⊕⊝⊝⊝ Very low1,2,3 |
| Continuous portal triad clamping vs continuous hepatic vascular exclusion | 50 per 1000 | 32 per 1000 (2 to 412) | Rate ratio 0.63 (0.03 to 13.31) | 815 (6 studies) | ⊕⊝⊝⊝ Very low1,2,3 |
| Continuous selective hepatic vascular exclusion vs continuous hepatic vascular exclusion | 50 per 1000 | 3 per 1000 (0 to 442) | Rate ratio 0.06 (0 to 15.06) | 815 (6 studies) | ⊕⊝⊝⊝ Very low1,2,3 |
| Continuous selective portal triad clamping vs continuous hepatic vascular exclusion | 50 per 1000 | 12 per 1000 (1 to 209) | Rate ratio 0.23 (0.01 to 5.02) | 815 (6 studies) | ⊕⊝⊝⊝ Very low1,2,3 |
| Intermittent portal triad clamping vs continuous hepatic vascular exclusion | 50 per 1000 | 26 per 1000 (2 to 288) | Rate ratio 0.51 (0.03 to 7.68) | 815 (6 studies) | ⊕⊝⊝⊝ Very low1,2,3 |
| Continuous selective hepatic vascular exclusion vs continuous portal triad clamping | 139 per 1000 | 16 per 1000 (0 to 724) | Rate ratio 0.10 (0 to 16.28) | 815 (6 studies) | ⊕⊝⊝⊝ Very low1,2,3 |
| Continuous selective portal triad clamping vs continuous portal triad clamping | 139 per 1000 | 56 per 1000 (6 to 374) | Rate ratio 0.37 (0.04 to 3.7) | 815 (6 studies) | ⊕⊝⊝⊝ Very low1,2,3 |
| Intermittent portal triad clamping vs continuous portal triad clamping | 139 per 1000 | 117 per 1000 (22 to 439) | Rate ratio 0.82 (0.14 to 4.86) | 815 (6 studies) | ⊕⊝⊝⊝ Very low1,2,3 |
| Continuous selective portal triad clamping vs continuous selective hepatic vascular exclusion | As there were no serious adverse events in either group, the credible intervals were extremely wide. This is equivalent to not estimable in direct comparisons. | 815 (6 studies) | ⊕⊝⊝⊝ Very low1,2,3 | ||
| Intermittent portal triad clamping vs continuous selective hepatic vascular exclusion | As there were no serious adverse events in either group, the credible intervals were extremely wide. This is equivalent to not estimable in direct comparisons. | 815 (6 studies) | ⊕⊝⊝⊝ Very low1,2,3 | ||
| Intermittent portal triad clamping vs continuous selective portal triad clamping | 130 per 1000 | 247 per 1000 (51 to 665) | Rate ratio 2.19 (0.36 to 13.26) | 815 (6 studies) | ⊕⊝⊝⊝ Very low1,2,3 |
| Serious adverse events (number) | |||||
| Intermittent portal triad clamping vs control | 80 per 1000 | 119 per 1000 (36 to 358) | Rate ratio 1.55 (0.43 to 6.4) | 100 (1 study) | ⊕⊝⊝⊝ Very lowa,b,c |
| Continuous portal triad clamping vs continuous hepatic vascular exclusion | 179 per 1000 | 36 per 1000 (2 to 218) | Rate ratio 0.17 (0.01 to 1.28) | 52 (1 study) | ⊕⊝⊝⊝ Very lowa,b,c |
| Intermittent portal triad clamping vs continuous portal triad clamping | 190 per 1000 | 21 per 1000 (0 to 116) | Rate ratio 0.09 (0 to 0.56) | 86 (1 study) | ⊕⊕⊝⊝ Lowa,b |
| Intermittent selective portal triad clamping vs intermittent portal triad clamping | 134 per 1000 | 165 per 1000 (76 to 328) | Rate ratio 1.27 (0.53 to 3.15) | 138 (2 studies) | ⊕⊝⊝⊝ Very lowa,b,c |
| Health‐related quality of life (30 days, 3 months) | None of the trials reported this outcome. | ||||
| Health‐related quality of life (longest follow‐up) | None of the trials reported this outcome. | ||||
| *The basis for the assumed risk is the mean control group proportion. The corresponding risk (and its 95% credible interval) is based on the assumed risk in the comparison group and the relative effect of the intervention (and its 95% CrI). Network meta‐analysis was not performed for any of the outcomes other than serious adverse events (proportion) because of the lack of availability of direct and indirect comparisons in the network. CrI: credible intervals; OR: odds ratio. | |||||
| GRADE Working Group grades of evidence | |||||
| 1 Risk of bias was unclear or high in the trial(s) (downgraded by 1 point). | |||||
| Outcomes | Illustrative comparative risks* (95% CrI) | Relative effect (95% CrI) | No of participants | Quality of the evidence | |
| Assumed risk | Corresponding risk | ||||
| Control | Intervention | ||||
| Mortality (perioperative) | |||||
| Recombinant factor VIIa vs control | 51 per 1000 | 33 per 1000 (7 to 158) | OR 0.63 (0.13 to 3.51) | 185 (1 study) | ⊕⊝⊝⊝ Very low1,2,3 |
| Tranexamic acid vs control | There was no mortality in either group. | 214 (1 study) | ⊕⊝⊝⊝ Very low1,2,3 | ||
| Mortality (longest follow‐up) | None of the trials reported this outcome. | ||||
| Serious adverse events (proportion) | |||||
| Anti‐thrombin III vs control | 273 per 1000 | 312 per 1000 (67 to 761) | OR 1.21 (0.19 to 8.49) | 24 (1 study) | ⊕⊝⊝⊝ Very low1,2,3 |
| Recombinant Factor VIIa vs control | 376 per 1000 | 396 per 1000 (256 to 555) | OR 1.09 (0.57 to 2.07) | 432 (2 studies) | ⊕⊝⊝⊝ Very low1,2,3 |
| Serious adverse events (number) | |||||
| Recombinant Factor VIIa vs control | 81 per 1000 | 120 per 1000 (68 to 217) | Rate ratio 1.55 (0.83 to 3.16) | 432 (2 studies) | ⊕⊝⊝⊝ Very low1,2,3 |
| Tranexamic acid vs control | 75 per 1000 | 65 per 1000 (23 to 164) | Rate ratio 0.85 (0.29 to 2.41) | 214 (1 study) | ⊕⊝⊝⊝ Very low1,2,3 |
| Health‐related quality of life (30 days, 3 months) | None of the trials reported this outcome. | ||||
| Health‐related quality of life (maximal follow‐up) | None of the trials reported this outcome. | ||||
| *The basis for the assumed risk is the mean control group proportion. The corresponding risk (and its 95% credible interval) is based on the assumed risk in the comparison group and the relative effect of the intervention (and its 95% CrI). Network meta‐analysis was not performed for any of the outcomes because of the lack of availability of direct and indirect comparisons in the network. CrI: credible intervals; OR: odds ratio | |||||
| GRADE Working Group grades of evidence | |||||
| 1 Risk of bias was unclear or high in the trial(s) (downgraded by 1 point). | |||||
| Acute normovolemic haemodilution (ANH) |
| Low central venous pressure (central venous pressure) |
| Hypoventilation |
| Combination of ANH with central venous pressure or hypotension |
| Finger‐fracture method |
| Clamp‐crush method |
| Cavitron ultrasonic surgical aspirator |
| Sharp dissection |
| Radiofrequency dissecting sealer |
| Ultrasonic shears |
| Stapler |
| Waterjet (Hydrojet) |
| Suturing for large and medium vessels and ducts and performing electrocauterisation of small vessels and ducts |
| Suturing for large vessels and performing ultrasonic shears for medium‐sized and small vessels and ducts |
| Suturing and argon beam coagulator |
| Suturing and fibrin sealant |
| Suturing and collagen |
| Suturing and oxidised cellulose |
| Suturing and cyanoacrylate |
| Suturing and combination of fibrin sealant with collagen or oxidised cellulose |
| No vascular occlusion |
| Portal triad clamping (continuous) (occlusion of inflow alone) |
| Portal triad clamping (intermittent) (occlusion of inflow alone) |
| Hepatic vascular exclusion (occlusion of inflow and outflow) (continuous or intermittent) |
| Selective portal trial clamping (occlusion of inflow to the hemi‐liver that is being resected) (continuous or intermittent) |
| Selective hepatic vascular exclusion (occlusion of inflow to the hemi‐liver and outflow from the hemi‐liver that is being resected) (continuous or intermittent) |
| Grades | Definitions | Examples |
| I | Any deviation from the normal postoperative course without the need for pharmacological treatment or surgical, endoscopic, or radiological interventions | Drugs such as antiemetics, antipyretics, analgesics, diuretics, and electrolytes; physiotherapy; wound infections opened at the bedside |
| II | Requiring pharmacological treatment with drugs other than those allowed for grade I complications | Blood transfusions, total parenteral nutrition |
| III | Requiring surgical, endoscopic, or radiological intervention | Bile leak requiring endoscopic stent; re‐operation for any cause; drainage of infected intra‐abdominal collection |
| IV | Life‐threatening complication requiring high dependency or intensive care management | Dialysis |
| V | Death of patient | — |
| Suffix d | If the patient suffers from a complication at the time of discharge and needs further follow‐up to evaluate the complication fully | — |
| Adapted from Dindo 2004; Clavien 2009. | ||
| Blood transfusion (red blood cell) (units) | |||
| Treatment number | Treatment name | ||
| 1 | Control | ||
| 2 | Acute normovolemic haemodilution | ||
| 3 | Acute normovolemic haemodilution plus hypotension | ||
| 4 | Acute normovolemic haemodilution plus low central venous pressure | ||
| 5 | Low central venous pressure | ||
| Fixed‐effect model | Random‐effects model | Inconsistency model | |
| Dbara | 2.68 | −8.90 | −9.80 |
| pDb | 10.05 | 12.67 | 11.96 |
| DICc | 12.73 | 3.77 | 2.17 |
| d[2]d | −1.23 (95% CrI −1.74 to −0.73) | −1.26 (95% CrI −4.92 to 2.39) | — |
| d[3]e | −1.65 (95% CrI −2.06 to −1.25) | −1.68 (95% CrI −5.33 to 1.98) | — |
| d[4]f | 0.15 (95% CrI −0.10 to 0.40) | −0.57 (95% CrI −3.35 to 1.88) | — |
| d[5]g | −0.81 (95% CrI −1.33 to −0.30) | −1.08 (95% CrI −3.43 to 1.13) | — |
| Between‐study standard deviation | — | 1.446 | |
| Model used | Random‐effects model | ||
| Evidence of inconsistency | There is no evidence of inconsistency since the difference in DIC between consistency and inconsistency models was not significant. | ||
| Blood loss (litres) | |||
| Treatment number | Treatment name | ||
| 1 | Control | ||
| 2 | Acute normovolemic haemodilution | ||
| 3 | Acute normovolemic haemodilution plus hypotension | ||
| 4 | Acute normovolemic haemodilution plus low central venous pressure | ||
| 5 | Hypoventilation | ||
| 6 | Low central venous pressure | ||
| Fixed‐effect model | Random‐effects model | Inconsistency model | |
| Dbara | −24.73 | −36.06 | −36.65 |
| pDb | 14.00 | 17.77 | 18.26 |
| DICc | −10.73 | −18.29 | −18.39 |
| d[2]d | 0.00 (95% CrI −0.10 to 0.10) | 0.00 (95% CrI −0.95 to 0.96) | — |
| d[3]e | −0.25 (95% CrI −0.37 to −0.13) | −0.25 (95% CrI −1.20 to 0.71) | — |
| d[4]f | 0.01 (95% CrI −0.04 to 0.07) | −0.10 (95% CrI −0.88 to 0.46) | — |
| d[5]g | 0.00 (95% CrI −1.12 to 1.12) | −0.01 (95% CrI −1.44 to 1.43) | — |
| d[6]h | −0.29 (95% CrI −0.40 to −0.18) | −0.32 (95% CrI −0.86 to 0.09) | — |
| Between‐study standard deviation | — | 0.3734 | — |
| Model used | Random‐effects model | ||
| Evidence of inconsistency | There is no evidence of inconsistency since the difference in DIC between consistency and inconsistency models was not significant. | ||
| aDbar = posterior mean of deviance. | |||
| Adverse events (proportion) | |||
| Treatment number | Treatment name | ||
| 1 | Clamp‐crush method | ||
| 2 | Cavitron ultrasonic surgical aspirator | ||
| 3 | Hydrojet | ||
| 4 | Radiofrequency dissecting sealer | ||
| 5 | Sharp transection method | ||
| 6 | Stapler | ||
| Fixed‐effect model | Random‐effects model | Inconsistency model* | |
| Dbara | 95.62 | 80.26 | 81.67 |
| pDb | 13.05 | 17.04 | 16.71 |
| DICc | 108.67 | 97.30 | 98.37 |
| d[2]d | 0.32 (95% CrI −0.28 to 0.92) | 0.76 (95% CrI −2.18 to 4.69) | — |
| d[3]e | −0.99 (95% CrI −2.76 to 0.54) | −0.56 (95% CrI −6.84 to 6.60) | — |
| d[4]f | 0.11 (95% CrI −0.46 to 0.68) | 0.19 (95% CrI −2.95 to 3.50) | — |
| d[5]g | 0.10 (95% CrI −0.79 to 1.00) | 0.1 (95% CrI −5.59 to 5.80) | — |
| d[6]h | 0.06 (95% CrI −0.63 to 0.76) | 0.06 (95% CrI −5.59 to 5.76) | — |
| Between‐study standard deviation | — | 2.436 | — |
| Model used | Random‐effects model | ||
| Evidence of inconsistency | There is no evidence of inconsistency since the difference in DIC between consistency and inconsistency models was not significant. | ||
| Adverse events (number) | |||
| Treatment number | Treatment name | ||
| 1 | Clamp‐crush method | ||
| 2 | Cavitron ultrasonic surgical aspirator | ||
| 3 | Hydrojet | ||
| 4 | Radiofrequency dissecting sealer | ||
| 5 | Sharp transection method | ||
| 6 | Stapler | ||
| Fixed‐effect model | Random‐effects model | Inconsistency model* | |
| Dbara | 80.99 | 80.94 | 79.59 |
| pDb | 11.93 | 11.88 | 14.76 |
| DICc | 92.92 | 92.83 | 94.35 |
| d[2]d | 0.47 (95% CrI −0.08 to 1.03) | 0.47 (95% CrI −0.08 to 1.03) | — |
| d[3]e | 0.34 (95% CrI −0.71 to 1.29) | 0.33 (95% CrI −0.71 to 1.28) | — |
| d[4]f | 0.61 (95% CrI 0.12 to 1.12) | 0.61 (95% CrI 0.12 to 1.11) | — |
| d[5]g | 0.12 (95% CrI −0.56 to 0.81) | 0.12 (95% CrI −0.56 to 0.81) | — |
| d[6]h | 0.62 (95% CrI −0.21 to 1.48) | 0.62 (95% CrI −0.20 to 1.45) | — |
| Between‐study standard deviation | — | 2.499 | — |
| Model used | Fixed‐effect model | — | |
| Evidence of inconsistency | There is no evidence of inconsistency since the difference in DIC between consistency and inconsistency models was not significant. | ||
| Blood transfusion (proportion) | |||
| Treatment number | Treatment name | ||
| 1 | Clamp‐crush method | ||
| 2 | Cavitron ultrasonic surgical aspirator | ||
| 3 | Hydrojet | ||
| 4 | Radiofrequency dissecting sealer | ||
| 5 | Sharp transection method | ||
| Fixed‐effect model | Random‐effects model | Inconsistency model* | |
| Dbara | 72.41 | 71.86 | 72.23 |
| pDb | 11.91 | 13.99 | 14.98 |
| DICc | 84.33 | 85.85 | 87.21 |
| d[2]d | 0.39 (95% CrI −0.62 to 1.42) | 0.42 (95% CrI −1.09 to 1.96) | — |
| d[3]e | 0.55 (95% CrI −0.75 to 1.83) | 0.60 (95% CrI −1.47 to 2.83) | — |
| d[4]f | 0.09 (95% CrI −0.50 to 0.68) | 0.14 (95% CrI −0.77 to 1.32) | — |
| d[5]g | −0.22 (95% CrI −1.16 to 0.71) | −0.22 (95% CrI −2.21 to 1.75) | — |
| Between‐study standard deviation | — | 0.6464 | — |
| Model used | Fixed‐effect model | — | |
| Evidence of inconsistency | There is no evidence of inconsistency since the difference in DIC between consistency and inconsistency models was not significant. | ||
| aDBar = posterior mean of deviance. | |||
| Serious adverse events (proportion) | |||
| Treatment number | Treatment name | ||
| 1 | Control | ||
| 2 | ConHVE | ||
| 3 | ConPTC | ||
| 4 | ConSelectiveHVE | ||
| 5 | ConSelectivePTC | ||
| 6 | IntPTC | ||
| Fixed‐effect model | Random‐effects model | Inconsistency model | |
| Dbara | 64.25 | 63.57 | 64.03 |
| pDb | 12.54 | 14.37 | 14.83 |
| DICc | 76.79 | 77.95 | 78.86 |
| d[2]d | 0.82 (95% CrI −1.70 to 3.50) | 0.62 (95% CrI −5.00 to 5.89) | — |
| d[3]e | 0.35 (95% CrI −1.26 to 1.96) | 0.16 (95% CrI −3.87 to 3.71) | — |
| d[4]f | −1.98 (95% CrI −8.24 to 1.48) | −2.25 (95% CrI −9.99 to 3.38) | — |
| d[5]g | −0.63 (95% CrI −2.29 to 0.97) | −1.01 (95% CrI −5.35 to 2.36) | — |
| d[6]h | 0.15 (95% CrI −0.61 to 0.92) | −0.07 (95% CrI −2.53 to 1.85) | — |
| Between‐study standard deviation | — | 1.216 | — |
| Model used | Fixed‐effect model | ||
| Evidence of inconsistency | There is no evidence of inconsistency since the difference in DIC between consistency and inconsistency models was not significant. | ||
| Adverse events (proportion) | |||
| Treatment number | Treatment name | ||
| 1 | Control | ||
| 2 | ConHVE | ||
| 3 | ConPTC | ||
| 4 | ConSelectiveHVE | ||
| 5 | ConSelectivePTC | ||
| 6 | IntPTC | ||
| 7 | IntSelectivePTC | ||
| Fixed‐effect model | Random‐effects model | Inconsistency model | |
| Dbara | 120.82 | 118.76 | 119.07 |
| pDb | 18.10 | 21.01 | 21.93 |
| DICc | 138.92 | 139.77 | 141.00 |
| d[2]d | 0.95 (95% CrI −0.21 to 2.12) | 0.90 (95% CrI −1.12 to 2.84) | — |
| d[3]e | 0.83 (95% CrI 0.00 to 1.69) | 0.78 (95% CrI −0.58 to 2.09) | — |
| d[4]f | 0.05 (95% CrI −1.19 to 1.27) | 0.00 (95% CrI −2.05 to 1.96) | — |
| d[5]g | 0.10 (95% CrI −0.81 to 1.01) | 0.07 (95% CrI −1.42 to 1.50) | — |
| d[6]h | 0.24 (95% CrI −0.19 to 0.68) | 0.18 (95% CrI −0.66 to 0.88) | — |
| d[7]i | 0.09 (95% CrI −0.75 to 0.93) | 0.04 (95% CrI −1.37 to 1.35) | — |
| Between‐study standard deviation | — | 0.4825 | — |
| Model used | Fixed‐effect model | ||
| Evidence of inconsistency | There is no evidence of inconsistency since the difference in DIC between consistency and inconsistency models was not significant. | ||
| Blood transfusion (proportion) | |||
| Treatment number | Treatment name | ||
| 1 | Control | ||
| 2 | ConHVE | ||
| 3 | ConPTC | ||
| 4 | ConSelectiveHVE | ||
| 5 | ConSelectivePTC | ||
| 6 | IntPTC | ||
| 7 | IntSelectivePTC | ||
| Fixed‐effect model | Random‐effects model | Inconsistency model | |
| Dbara | 139.87 | 120.00 | 120.10 |
| pDb | 19.04 | 25.25 | 25.72 |
| DICc | 158.91 | 145.25 | 145.82 |
| d[2]d | −2.55 (95% CrI −3.80 to −1.36) | −2.88 (95% CrI −7.47 to 1.47) | — |
| d[3]e | −0.77 (95% CrI −1.56 to 0.01) | −1.11 (95% CrI −3.72 to 1.28) | — |
| d[4]f | −1.46 (95% CrI −2.58 to −0.36) | −1.79 (95% CrI −6.38 to 2.53) | — |
| d[5]g | −0.26 (95% CrI −1.18 to 0.67) | −0.48 (95% CrI −3.83 to 2.72) | — |
| d[6]h | −0.34 (95% CrI −0.84 to 0.16) | −0.47 (95% CrI −2.32 to 1.28) | — |
| d[7]i | −0.92 (95% CrI −1.96 to 0.08) | −0.97 (95% CrI −4.24 to 2.24) | — |
| Between study standard deviation | — | 1.613 | — |
| Model used | Random‐effects model | ||
| Evidence of inconsistency | There is no evidence of inconsistency since the difference in DIC between consistency and inconsistency models was not significant. | ||
| Blood transfusion (red blood cell) (units) | |||
| Treatment number | Treatment name | ||
| 1 | Control | ||
| 2 | ConHVE | ||
| 3 | ConPTC | ||
| 4 | ConSelectiveHVE | ||
| 5 | ConSelectivePTC | ||
| 6 | IntPTC | ||
| 7 | IntSelectivePTC | ||
| Fixed‐effect model | Random‐effects model | Inconsistency model | |
| Dbara | −1.55 | −1.05 | 0.24 |
| pDb | 15.99 | 17.36 | 19.34 |
| DICc | 14.44 | 16.32 | 19.58 |
| d[2]d | −1.65 (95% CrI −3.96 to 0.67) | −1.56 (95% CrI −4.18 to 1.14) | — |
| d[3]e | −1.25 (95% CrI −2.39 to −0.10) | −1.18 (95% CrI −2.54 to 0.31) | — |
| d[4]f | −2.45 (95% CrI −4.08 to −0.82) | −2.37 (95% CrI −4.33 to −0.30) | — |
| d[5]g | −1.45 (95% CrI −2.59 to −0.31) | −1.41 (95% CrI −2.86 to 0.12) | — |
| d[6]h | −1.36 (95% CrI −2.48 to −0.23) | −1.35 (95% CrI −2.69 to 0.01) | — |
| d[7]i | −1.43 (95% CrI −2.61 to −0.24) | −1.43 (95% CrI −3.01 to 0.08) | — |
| Between‐study standard deviation | — | 0.3149 | — |
| Model used | Fixed‐effect model | ||
| Evidence of inconsistency | There is no evidence of inconsistency since the difference in DIC between consistency and inconsistency models was not significant. | ||
| Blood loss (litres) | |||
| Treatment number | Treatment name | ||
| 1 | Control | ||
| 2 | ConHVE | ||
| 3 | ConPTC | ||
| 4 | ConSelectiveHVE | ||
| 5 | ConSelectivePTC | ||
| 6 | IntPTC | ||
| 7 | IntSelectivePTC | ||
| Fixed‐effect model | Random‐effects model | Inconsistency model | |
| Dbara | −45.73 | −61.66 | −63.13 |
| pDb | 22.01 | 29.37 | 30.58 |
| DICc | −23.72 | −32.29 | −32.55 |
| d[2]d | −0.36 (95% CrI −0.50 to −0.23) | −0.37 (95% CrI −0.94 to 0.22) | — |
| d[3]e | −0.02 (95% CrI −0.12 to 0.07) | −0.14 (95% CrI −0.52 to 0.14) | — |
| d[4]f | −0.27 (95% CrI −0.54 to −0.01) | −0.39 (95% CrI −1.16 to 0.27) | — |
| d[5]g | 0.09 (95% CrI −0.04 to 0.21) | 0.00 (95% CrI −0.57 to 0.45) | — |
| d[6]h | 0.01 (95% CrI −0.05 to 0.07) | −0.06 (95% CrI −0.39 to 0.17) | — |
| d[7]i | 0.00 (95% CrI −0.21 to 0.2) | −0.18 (95% CrI −0.84 to 0.30) | — |
| Between‐study standard deviation | — | 0.2539 | — |
| Model used | Random‐effects model | ||
| Evidence of inconsistency | There is no evidence of inconsistency since the difference in DIC between consistency and inconsistency models was not significant. | ||
| Con: continuous; Int: intermittent; HVE: hepatic vascular exclusion; PTC: portal triad clamping. | |||
| aDBar = posterior mean of deviance. | |||
| Blood transfusion (red blood cell) (units) | ||||
| Acute normovolemic haemodilution | Acute normovolemic haemodilution plus hypotension | Acute normovolemic haemodilution plus low central venous pressure | Low central venous pressure | |
| Control | MD −1.26; 95% CrI −4.92 to 2.39 | MD −1.68; 95% CrI −5.33 to 1.98 | MD −0.57; 95% CrI −3.35 to 1.88 | MD −1.08; 95% CrI −3.43 to 1.13 |
| Acute normovolemic haemodilution | — | MD −0.42; 95% CrI −5.59 to 4.75 | MD 0.69; 95% CrI −3.80 to 5.18 | MD 0.18; 95% CrI −4.12 to 4.49 |
| Acute normovolemic haemodilution plus hypotension | — | — | MD 1.11; 95% CrI −3.39 to 5.60 | MD 0.60; 95% CrI −3.71 to 4.91 |
| Acute normovolemic haemodilution plus low central venous pressure | — | — | — | MD −0.51; 95% CrI −3.97 to 2.96 |
| Blood loss (litres) | ||||
| Acute normovolemic haemodilution | Acute normovolemic haemodilution plus hypotension | Acute normovolemic haemodilution plus low central venous pressure | Hypoventilation | |
| Control | MD 0.00; 95% CrI −0.95 to 0.96 | MD −0.25; 95% CrI −1.20 to 0.71 | MD −0.10; 95% CrI −0.88 to 0.46 | MD −0.01; 95% CrI −1.44 to 1.43 |
| Acute normovolemic haemodilution | — | MD −0.25; 95% CrI −1.60 to 1.10 | MD −0.11; 95% CrI −1.27 to 1.06 | MD −0.01; 95% CrI −1.73 to 1.71 |
| Acute normovolemic haemodilution plus hypotension | — | — | MD 0.14; 95% CrI −1.02 to 1.31 | MD 0.24; 95% CrI −1.48 to 1.96 |
| Acute normovolemic haemodilution plus low central venous pressure | — | — | — | MD 0.10; 95% CrI −1.49 to 1.68 |
| Hypoventilation | — | — | — | — |
| aThe table provides the effect estimate of each pair‐wise comparison. To identify the effect estimate of a comparison (e.g. A versus B), look at the cell that occupies the column corresponding to treatment A and the row corresponding to treatment B. This gives the information directly. If that cell is empty (indicated by a '—', you have to look at column corresponding to treatment B and row corresponding to treatment A. You will have to take the inverse of this number (i.e. 1/number) to get the treatment effect. | ||||
| Adverse events (proportion) | ||||
| Cavitron ultrasonic surgical aspirator | Hydrojet | Radiofrequency dissecting sealer | Sharp transection method | |
| Clamp‐crush method | OR 2.15; 95% CrI 0.11 to 108.74 | OR 0.57; 95% CrI 0.00 to 732.89 | OR 1.20; 95% CrI 0.05 to 33.05 | OR 1.11; 95% CrI 0.00 to 331.29 |
| Cavitron ultrasonic surgical aspirator | — | OR 0.27; 95% CrI 0.00 to 501.34 | OR 0.56; 95% CrI 0.01 to 62.38 | OR 0.52; 95% CrI 0.00 to 398.54 |
| Hydrojet | — | — | OR 2.12; 95% CrI 0.00 to 3638.36 | OR 1.94; 95% CrI 0.00 to 12959.09 |
| Radiofrequency dissecting sealer | — | — | — | OR 0.92; 95% CrI 0.00 to 638.06 |
| Sharp transection method | — | — | — | ‐ |
| Adverse events (number) | ||||
| Cavitron ultrasonic surgical aspirator | Hydrojet | Radiofrequency dissecting sealer | Sharp transection method | |
| Clamp‐crush method | rate ratio 1.60; 95% CrI 0.92 to 2.79 | rate ratio 1.40; 95% CrI 0.49 to 3.63 | rate ratio 1.84; 95% CrI 1.13 to 3.06 | rate ratio 1.13; 95% CrI 0.57 to 2.24 |
| Cavitron ultrasonic surgical aspirator | — | rate ratio 0.88; 95% CrI 0.28 to 2.75 | rate ratio 1.15; 95% CrI 0.54 to 2.42 | rate ratio 0.71; 95% CrI 0.29 to 1.71 |
| Hydrojet | — | — | rate ratio 1.31; 95% CrI 0.43 to 4.01 | rate ratio 0.81; 95% CrI 0.24 to 2.71 |
| Radiofrequency dissecting sealer | — | — | — | rate ratio 0.62; 95% CrI 0.26 to 1.44 |
| Sharp transection method | — | — | — | — |
| Blood transfusion (proportion) | ||||
| Cavitron ultrasonic surgical aspirator | Hydrojet | Radiofrequency dissecting sealer | Sharp transection method | |
| Clamp‐crush method | OR 1.48; 95% CrI 0.54 to 4.13 | OR 1.73; 95% CrI 0.47 to 6.25 | OR 1.09; 95% CrI 0.61 to 1.97 | OR 0.80; 95% CrI 0.31 to 2.03 |
| Cavitron ultrasonic surgical aspirator | — | OR 1.17; 95% CrI 0.23 to 6.05 | OR 0.74; 95% CrI 0.23 to 2.39 | OR 0.54; 95% CrI 0.14 to 2.15 |
| Hydrojet | — | — | OR 0.63; 95% CrI 0.15 to 2.61 | OR 0.46; 95% CrI 0.09 to 2.27 |
| Radiofrequency dissecting sealer | — | — | — | OR 0.73; 95% CrI 0.24 to 2.21 |
| aThe table provides the effect estimate of each pair‐wise comparison. To identify the effect estimate of a comparison (e.g. A versus B), look at the cell that occupies the column corresponding to treatment A and the row corresponding to treatment B. This gives the information directly. If that cell is empty (indicated by a '—', you have to look at column corresponding to treatment B and row corresponding to treatment A. You will have to take the inverse of this number (i.e. 1/number) to get the treatment effect. | ||||
| Serious adverse events (proportion) | |||||
| ConHVE | ConPTC | ConSelectiveHVE | ConSelectivePTC | IntPTC | |
| Control | OR 2.27; 95% CrI 0.18 to 33.05 | OR 1.42; 95% CrI 0.28 to 7.09 | OR 0.14; 95% CrI 0.00 to 4.37 | OR 0.53; 95% CrI 0.10 to 2.65 | OR 1.16; 95% CrI 0.54 to 2.51 |
| ConHVE | — | OR 0.63; 95% CrI 0.03 to 13.31 | OR 0.06; 95% CrI 0.00 to 15.06 | OR 0.23; 95% CrI 0.01 to 5.02 | OR 0.51; 95% CrI 0.03 to 7.68 |
| ConPTC | — | — | OR 0.10; 95% CrI 0.00 to 16.28 | OR 0.37; 95% CrI 0.04 to 3.70 | OR 0.82; 95% CrI 0.14 to 4.86 |
| ConSelectiveHVE | — | — | — | Not estimable | Not estimable |
| ConSelectivePTC | — | — | — | — | OR 2.19; 95% CrI 0.36 to 13.26 |
| Adverse events (proportion) | |||||
| ConHVE | ConPTC | ConSelectiveHVE | ConSelectivePTC | IntPTC | |
| Control | OR 2.58; 95% CrI 0.81 to 8.30 | OR 2.30; 95% CrI 1.00 to 5.41 | OR 1.06; 95% CrI 0.31 to 3.58 | OR 1.11; 95% CrI 0.45 to 2.75 | OR 1.28; 95% CrI 0.83 to 1.97 |
| ConHVE | — | OR 0.89; 95% CrI 0.21 to 3.75 | OR 0.41; 95% CrI 0.08 to 2.22 | OR 0.43; 95% CrI 0.10 to 1.88 | OR 0.49; 95% CrI 0.14 to 1.71 |
| ConPTC | — | — | OR 0.46; 95% CrI 0.10 to 2.04 | OR 0.48; 95% CrI 0.14 to 1.67 | OR 0.55; 95% CrI 0.21 to 1.43 |
| ConSelectiveHVE | — | — | — | OR 1.05; 95% CrI 0.23 to 4.84 | OR 1.21; 95% CrI 0.33 to 4.45 |
| ConSelectivePTC | — | — | — | — | OR 1.15; 95% CrI 0.42 to 3.16 |
| IntPTC | — | — | — | — | — |
| Blood transfusion (proportion) | |||||
| ConHVE | ConPTC | ConSelectiveHVE | ConSelectivePTC | IntPTC | |
| Control | OR 0.06; 95% CrI 0.00 to 4.33 | OR 0.33; 95% CrI 0.02 to 3.59 | OR 0.17; 95% CrI 0.00 to 12.59 | OR 0.62; 95% CrI 0.02 to 15.18 | OR 0.63; 95% CrI 0.10 to 3.59 |
| ConHVE | — | Not estimable | Not estimable | Not estimable | Not estimable |
| ConPTC | — | — | OR 0.51; 95% CrI 0.00 to 83.52 | Not estimable | OR 1.89; 95% CrI 0.09 to 41.17 |
| ConSelectiveHVE | — | — | — | Not estimable | Not estimable |
| ConSelectivePTC | — | — | — | — | OR 1.01; 95% CrI 0.02 to 42.32 |
| IntPTC | — | — | — | — | — |
| Blood transfusion (red blood cell) | |||||
| ConHVE | ConPTC | ConSelectiveHVE | ConSelectivePTC | IntPTC | |
| Control | MD −1.65; 95% CrI −3.96 to 0.67 | MD −1.25; 95% CrI −2.39 to −0.10 | MD −2.45; 95% CrI −4.08 to −0.82 | MD −1.45; 95% CrI −2.59 to −0.31 | MD −1.36; 95% CrI −2.48 to −0.23 |
| ConHVE | — | MD 0.40; 95% CrI −2.18 to 2.98 | MD −0.80; 95% CrI −3.64 to 2.03 | MD 0.20; 95% CrI −2.39 to 2.78 | MD 0.29; 95% CrI −2.29 to 2.86 |
| ConPTC | — | — | MD −1.20; 95% CrI −3.20 to 0.79 | MD −0.20; 95% CrI −1.82 to 1.42 | MD −0.11; 95% CrI −1.72 to 1.50 |
| ConSelectiveHVE | — | — | — | MD 1.00; 95% CrI −0.99 to 2.99 | MD 1.09; 95% CrI −0.89 to 3.07 |
| ConSelectivePTC | — | — | — | — | MD 0.09; 95% CrI −1.51 to 1.70 |
| IntPTC | — | — | — | — | — |
| Blood loss | |||||
| ‐ | ConHVE | ConPTC | ConSelectiveHVE | ConSelectivePTC | IntPTC |
| Control | MD −0.37; 95% CrI −0.94 to 0.22 | MD −0.14; 95% CrI −0.52 to 0.14 | MD −0.39; 95% CrI −1.16 to 0.27 | MD 0.00; 95% CrI −0.57 to 0.45 | MD −0.06; 95% CrI −0.39 to 0.17 |
| ConHVE | — | MD 0.23; 95% CrI −0.44 to 0.90 | MD −0.02; 95% CrI −0.94 to 0.90 | MD 0.37; 95% CrI −0.41 to 1.14 | MD 0.31; 95% CrI −0.34 to 0.95 |
| ConPTC | — | — | MD −0.25; 95% CrI −1.04 to 0.54 | MD 0.14; 95% CrI −0.47 to 0.74 | MD 0.08; 95% CrI −0.35 to 0.52 |
| ConSelectiveHVE | — | — | — | MD 0.39; 95% CrI −0.49 to 1.26 | MD 0.33; 95% CrI −0.44 to 1.10 |
| ConSelectivePTC | — | — | — | — | MD −0.06; 95% CrI −0.64 to 0.52 |
| IntPTC | — | — | — | — | — |
| Con: continuous; Int: intermittent; HVE: hepatic vascular exclusion; PTC: portal triad clamping. | |||||
| aThe table provides the effect estimate of each pair‐wise comparison. To identify the effect estimate of a comparison (e.g. A versus B), look at the cell that occupies the column corresponding to treatment A and the row corresponding to treatment B. This gives the information directly. If that cell is empty (indicated by a ' —', you have to look at column corresponding to treatment B and row corresponding to treatment A. You will have to take the inverse of this number (i.e. 1/number) to get the treatment effect. | |||||
| Study | Intervention | Co‐interventions | ||||||||
| Intervention | Control | Other information | Type of intervention | Vascular occlusion | Parenchymal transection method | Raw surface | Pharmacological methods | Cardiopulmonary methods | Autologous transfusion | |
| Anterior approach | Control | — | Anterior approach | Not stated | Clamp‐crush, bipolar dissecting sealer | Not stated | Not stated | Not stated | Not stated | |
| Anterior approach | Control | — | Anterior approach | Not stated | Cavitron ultrasonic surgical aspirator | Not stated | Not stated | Not stated | Not stated | |
| Autologous blood donation | Control | Note: autologous blood donation group was further randomised to recombinant erythropoietin and no erythropoietin | Autologous transfusion | Not stated | Not stated | Not stated | Not stated | Not stated | Factor being randomised | |
| Autologous blood donation | Control | Autologous blood donation: 2 units of blood were withdrawn before surgery | Autologous transfusion | Hepatic vascular exclusion | Not stated | Not stated | Not stated | Not stated | Factor being randomised | |
| Acute normovolemic haemodilution plus low central venous pressure | Control | Acute normovolemic dilution plus low central venous pressure: blood withdrawn to a target of 28% haematocrit and replaced with fluid. Target for central venous pressure was not reported | Cardiopulmonary methods | Not stated | Not stated | Not stated | Not stated | Factor being randomised | Not stated | |
| Acute normovolemic haemodilution plus low central venous pressure | Low central venous pressure | Acute normovolemic haemodilution: blood was withdrawn and replaced by colloids and crystalloids to reach a haematocrit target of 8 gm/dL. | Cardiopulmonary methods | Intermittent portal triad clamping | Not stated | Not stated | Not stated | Factor being randomised | Not stated | |
| Acute normovolemic haemodilution plus low central venous pressure | Low central venous pressure | Acute normovolemic haemodilution: blood was withdrawn and replaced by colloids to reach a haematocrit target of 24%. | Cardiopulmonary methods | Not stated | Not stated | Not stated | Not stated | Factor being randomised | Not stated | |
| Acute normovolemic haemodilution | Acute normovolemic haemodilution with hypotension | Acute normovolemic haemodilution: withdrawal of blood and replacement with fluids to maintain a target haematocrit of 30%. | Cardiopulmonary methods | Not stated | Not stated | Not stated | Not stated | Factor being randomised | Not stated | |
| Hypoventilation | Control | — | Cardiopulmonary methods | Intermittent portal triad clamping or selective occlusion | Clamp crush or cavitron ultrasonic surgical aspirator | Not stated | Not stated | Factor being randomised | None | |
| Low central venous pressure | Control | Low central venous pressure: by restricting flow from legs | Cardiopulmonary methods | Not stated | Not stated | Not stated | Not stated | Factor being randomised | Not stated | |
| Low central venous pressure | Control | Low central venous pressure: nitroglycerine | Cardiopulmonary intervention | Intermittent portal triad clamping | Not stated | Not stated | Not stated | Factor being randomised | Not stated | |
| Low central venous pressure | Control | Low central venous pressure: by inferior IVC clamping | Cardiopulmonary methods | Intermittent portal triad clamping | Cavitron ultrasonic surgical aspirator | Fibrin glue used | Not stated | Factor being randomised | Not stated | |
| Low central venous pressure | Control | Low central venous pressure: by limiting fluid, nitroglycerine, and furosemide | Cardiopulmonary methods | Varied | Clamp‐crush | Not stated | Not stated | Factor being randomised | Not stated | |
| Low central venous pressure | Low central venous pressure + acute normovolemic haemodilution. | Low central venous pressure: fluid restriction and nitroglycerine. | Cardiopulmonary methods | Not stated | Not stated | Not stated | Not stated | Factor being randomised | Not stated | |
| Stapler | Clamp‐crush method | Stapler: Autosuture EndoGIA stapler (Covidien) | Parenchumal transection | Variable | Factor being randomised | Variable | Not stated | Low central venous pressure | Not stated | |
| Cavitron ultrasonic surgical aspirator | Clamp‐crush method | — | Parenchymal transection | No vascular occlusion | Factor being randomised | Not stated | Not stated | Not stated | Not stated | |
| Cavitron ultrasonic surgical aspirator | Clamp‐crush method | — | Parenchymal transection | Intermittent total or selective portal triad clamping | Factor being randomised | Fibrin glue used | Not stated | Not stated | Not stated | |
| Cavitron ultrasonic surgical aspirator | Clamp‐crush method | Ultrasonic dissector: cavitron ultrasonic surgical aspirator. | Parenchymal transection | Intermittent portal triad clamping | Factor being randomised | Not stated | Not stated | Low central venous pressure | Not stated | |
| Cavitron ultrasonic surgical aspirator | Hydrojet | Hydrojet: Jet Cutter | Parenchymal transection | Portal triad clamping | Factor being randomised | Variable | Not stated | Not stated | Not stated | |
| Cavitron ultrasonic surgical aspirator | Stapler | Stapler: Endostapler (Covidien) | Parenchymal transection | Variable | Factor being randomised | Not stated | Not stated | Not stated | Not stated | |
| Cavitron ultrasonic surgical aspirator | Radiofrequency dissecting sealer. | Radiofrequency dissecting sealer: Tissue Link | Parenchymal transection | No vascular occlusion | Factor being randomised | Not stated | Not stated | Not stated | Not stated | |
| Radiofrequency dissecting sealer | Clamp‐crush method | Radiofrequency dissecting sealer: Ligasure | Parenchymal transection | Intermittent portal triad clamping or hemihepatic occlusion | Factor being randomised | Not stated | Not stated | Not stated | No | |
| Radiofrequency dissecting sealer | Clamp‐crush method | Radiofrequency dissecting sealer: Radionics needles | Parenchymal transection | No vascular occlusion | Factor being randomised | Not stated | Not stated | Not stated | Not stated | |
| Radiofrequency dissecting sealer | Clamp‐crush method | Radiofrequency dissecting sealer: Ligasure (Covidien) | Parenchymal transection | Not stated | Factor being randomised | No fibrin glue used | Not stated | Low central venous pressure | Not stated | |
| Radio‐frequency dissecting sealer | Clamp‐crush method | Radio‐frequency dissecting sealer: Tissue Link (Valley Lab) | Parenchymal transection | Variable | Factor being randomised | Not stated | Not stated | Not stated | Not stated | |
| Sharp transection | Clamp‐crush method | Sharp transection: using scalpel | Parenchymal transection | Selective hepatic vascular exclusion | Factor being randomised | Not stated | Not stated | Low central venous pressure | Not stated | |
| Anti‐thrombin III concentrate | Control | Anti‐thrombin concentrate: 1500 IU IV over 30 min: immediately before the operation, just before hepatic division, and immediately after operation | Pharmacological methods | Not stated | Not stated | Not stated | Factor being randomised | Not stated | Not stated | |
| Aprotinin | Control | Aprotinin: | Pharmacological methods | Intermittent portal triad clamping | Kelly clamp | Fibrin glue used | Factor being randomised | None | Not stated | |
| Desmopressin | Control | Desmopressin: 30 mcg/kg shortly after induction | Pharmacological methods | Varied | Cavitron ultrasonic surgical aspirator | Not stated | Factor being randomised | Not stated | Not stated | |
| Recombinant factor VIIa | Control | Recombinant factor VIIa: | Pharmacological methods | Mixture of methods | Not stated | No fibrin glue used | Factor being randomised | Not stated | No | |
| Recombinant factor VIIa | Control | Recombinant factor VIIa: brand not stated | Pharmacological methods | Not stated | Not stated | Not stated | Factor being randomised | Not stated | Not stated | |
| Tranexamic acid | Control | Tranexamic acid: 500 mg just before the surgery followed by 250 mg 4x/day for 3 days | Pharmacological methods | Varied | Clamp‐crush method | Not stated | Factor being randomised | Not stated | Not stated | |
| Collagen | Fibrin sealant | Collagen: Instat (Johnson & Johnson) | Raw surface | Not stated | Not stated | Factor being randomised | Not stated | Not stated | Not stated | |
| Collagen | Fibrin sealant | Collagen: Instat (Ethicon) | Raw surface | Not stated | Not stated | Factor being randomised | Not stated | Not stated | Not stated | |
| Collagen | Fibrin sealant | Collagen: Avitene (Alcon Inc). | Raw surface | Not stated | Not stated | Factor being randomised | Not stated | Not stated | Not stated | |
| Collagen | Fibrin sealant | Collagen: Sangustop fleece (Aesculap AG). | Raw surface | Not stated | A number of parenchymal transection techniques | Factor being randomised | None | Not stated | Not stated | |
| Fibrin sealant | Argon beam coagulator | Fibrin sealant: Tacchosil (Nycomed) | Raw surface | A mixture of approaches | A mixture of approaches | Factor being randomised | Not stated | Not stated | Not stated | |
| Fibrin sealant | Argon beam coagulator | Fibrin sealant: Tacchosil | Raw surface | Not stated | A mixture of approaches | Factor being randomised | Not stated | Not stated | Not stated | |
| Fibrin sealant | Control | Fibrin sealant: TISSEEL (Baxter Health Corporation) Spray; 5 mL of fibrinogen with synthetic aprotinin and 5 mL of thrombin (500 IU/mL) | Raw surface | Intermittent portal triad clamping | Different types of liver resection | Factor being randomised | Not stated | Not stated | Not stated | |
| Fibrin sealant | Control | Fibrin sealant: Quixil (Johnson & Johnson Medical) spray; 5 mL of fibrinogen and tranexamic acid and 5 mL of thrombin | Raw surface | With and without inflow occlusion | Clamp‐crush, cavitron ultrasonic surgical aspirator, electric coagulation based, combined | Factor being randomised | Not stated | Not stated | Not stated | |
| Fibrin sealant | Control | Fibrin sealant: name not available | Raw surface | Not stated | Not stated | Factor being randomised | Not stated | Not stated | Not stated | |
| Fibrin sealant | Control | Fibrin sealant: Biocol | Raw surface | Varied | Clamp‐crush method or cavitron ultrasonic surgical aspirator | Factor being randomised | Not stated | Not stated | Not stated | |
| Fibrin sealant | Gelatin | Fibrin sealant: Fibrocaps (ProFibrix) | Raw surface | Not stated | Not stated | Factor being randomised | Not stated | Not stated | Not stated | |
| Fibrin sealant | Oxidised cellulose | Fibrin sealant: Tacchosil | Raw surface | Not stated | Not stated | Factor being randomised | Not stated | Not stated | Not stated | |
| Fibrin sealant | Oxidised cellulose | Fibrin sealant: Fibrin Pad | Raw surface | Not stated | Not stated | Factor being randomised | Not stated | Not stated | Not stated | |
| Fibrin sealant | Oxidised cellulose | Fibrin sealant: Tachosil (Nycomed) | Raw surface | Varied | Not stated | Factor being randomised | Not stated | Not stated | Not stated | |
| Fibrin sealant | Oxidised cellulose | Oxidised cellulose: Surgicel (Ethicon Inc) | Raw surface | Not stated | Clamp‐crush method | Factor being randomised | Not stated | Not stated | Not stated | |
| Fibrin sealant | PlasmaJet coagulator | Fibrin sealant: fibrin glue (no further details) | Raw surface | Not stated | Cavitron ultrasonic surgical aspirator | Factor being randomised | Not stated | Not stated | Not stated | |
| Fibrin sealant plus collagen | Control | Fibrin sealant spray: Tissucol | Raw surface | Intermittent portal triad or selective clamping | Cavitron ultrasonic surgical aspirator | Factor being randomised | Not stated | Not stated | Not stated | |
| Continuous portal triad clamping | Continuous hepatic vascular exclusion | Hepatic vascular exclusion by encircling the entire retrohepatic inferior vena cava | Vascular occlusion | Factor being randomised | Clamp‐crush or cavitron ultrasonic surgical aspirator | Fibrin glue used | Not stated | Not stated | Not stated | |
| Continuous portal triad clamping | Continuous hepatic vascular exclusion | Hepatic vascular exclusion by encircling the entire infrahepatic inferior vena cava | Vascular occlusion | Factor being randomised | Clamp‐crush method | Not stated | Not stated | Not stated | Not stated | |
| Continuous portal triad clamping | Continuous selective hepatic vascular exclusion | — | Vascular occlusion | Factor being randomised | Not stated | Not stated | Not stated | Low central venous pressure | Not stated | |
| Continuous portal triad clamping | Continuous selective portal triad clamping | — | Vascular occlusion | Factor being randomised | Clamp‐crush method | Not stated | Not stated | Low central venous pressure | Not stated | |
| Continuous portal triad clamping | Control | — | Vascular occlusion | Factor being randomised | Not stated | Not stated | Not stated | Not stated | Not stated | |
| Continuous portal triad clamping | Control | Note: After every 1 hour of continuous portal triad clamping (or 30 minutes for cirrhotic patients), the clamp was released for 10 minutes before reclamping | Vascular occlusion | Factor being randomised | Not stated | Not stated | Not stated | Not stated | Not stated | |
| Continuous portal triad clamping | Control | — | Vascular occlusion | Factor being randomised | Not stated | Not stated | Not stated | Not stated | Not stated | |
| Continuous portal triad clamping | Control | — | Vascular occlusion | Factor being randomised | Not stated | Not stated | Not stated | Not stated | Not stated | |
| Continuous portal triad clamping | Intermittent portal triad clamping | Continuous portal triad clamping: until end of transection | Vascular occlusion | Factor being randomised | Cavitron ultrasonic surgical aspirator | Not stated | Not stated | Low central venous pressure | Not stated | |
| Continuous portal triad clamping | Intermittent portal triad clamping | Intermittent portal triad clamping: 15 minutes on and 5 minutes off | Vascular occlusion | Factor being randomised | Clamp‐crush | Fibrin glue used | Not stated | Not stated | Not stated | |
| Continuous selective portal triad clamping | Intermittent portal triad clamping | Intermittent portal triad clamping: 20 minutes on and 5 minutes off | Vascular occlusion | Factor being randomised | Clamp crush | Not stated | None | Not stated | Not stated | |
| Intermittent portal triad clamping | Control | Intermittent portal triad clamping: 15 minutes on and 5 minutes off | Vascular occlusion | Factor being randomised | Clamp‐crush or bipolar dissecting sealer | Not stated | Not stated | Low central venous pressure | Not stated | |
| Intermittent portal triad clamping | Control | Intermittent portal triad clamping: 15 minutes on and 5 minutes off | Vascular occlusion | Factor being randomised | Cavitron ultrasonic surgical aspirator | Fibrin glue used | Not stated | Low central venous pressure | Not stated | |
| Intermittent portal triad clamping | Control | Intermittent portal triad clamping: 20 minutes on and 5 minutes off | Vascular occlusion | Factor being randomised | Cavitron ultrasonic surgical aspirator | Not stated | Not stated | Not stated | Not stated | |
| Intermittent portal triad clamping | Control | Intermittent portal triad clamping: 20 minutes on and 5 minutes off (until resection is completed or a maximum of 6 cycles) | Vascular occlusion | Factor being randomised | Not stated | Not stated | Not stated | Not stated | Not stated | |
| Intermittent portal triad clamping | Control | Intermittent portal triad clamping: 15 minutes on and 5 minutes off | Vascular occlusion | Factor being randomised | Not stated | Not stated | Not stated | Not stated | Not stated | |
| Intermittent portal triad clamping | Intermittent selective portal triad clamping | Intermittent clamping: 15 minutes on and 5 minutes off | Vascular occlusion | Factor being randomised | Not stated | Not stated | Not stated | Not stated | Not stated | |
| Intermittent portal triad clamping | Intermittent selective portal triad clamping | Intermittent portal triad clamping: 15 minutes on and 5 minutes off | Vascular occlusion | Factor being randomised | Clamp‐crush method | Not stated | Not stated | Not stated | Not stated | |
| Study | Intervention | Control | Sequence generation | Allocation concealment | Blinding of participants and healthcare providers | Blinding of outcome assessors | Missing outcome bias | Selective reporting bias | Source of funding bias | Other bias | Overall risk of bias |
| Anterior approach | Control | Low | Unclear | Unclear | Unclear | High | Low | Low | Low | Unclear or high | |
| Anterior approach | Control | Unclear | Unclear | High | High | High | High | Low | Low | Unclear or high | |
| Autologous blood donation | Control | Unclear | Unclear | Unclear | Unclear | Unclear | High | Unclear | Low | Unclear or high | |
| Autologous blood donation | Control | Unclear | Unclear | Unclear | Unclear | High | High | Unclear | Low | Unclear or high | |
| Acute normovolemic haemodilution plus low central venous pressure | Control | Unclear | Unclear | Unclear | Unclear | Unclear | High | Low | Low | Unclear or high | |
| Acute normovolemic haemodilution plus low central venous pressure | Low central venous pressure | Unclear | Unclear | Unclear | Unclear | High | Low | Unclear | Low | Unclear or high | |
| Acute normovolemic haemodilution plus low central venous pressure | Low central venous pressure | Low | Unclear | High | Unclear | Low | High | Low | Low | Unclear or high | |
| Acute normovolemic haemodilution | Acute normovolemic haemodilution with hypotension | Unclear | Unclear | Unclear | Unclear | Unclear | High | Unclear | Low | Unclear or high | |
| Hypoventilation | Control | Low | Low | Low | High | Low | High | Low | Low | Unclear or high | |
| Low central venous pressure | Control | Unclear | Unclear | Unclear | Unclear | Unclear | High | Unclear | Low | Unclear or high | |
| Low central venous pressure | Control | Unclear | Unclear | Unclear | Unclear | Unclear | High | Unclear | Low | Unclear or high | |
| Low central venous pressure | Control | Low | Low | Unclear | Unclear | Low | High | Unclear | Low | Unclear or high | |
| Low central venous pressure | Control | Unclear | Unclear | Unclear | Unclear | High | High | Unclear | Low | Unclear or high | |
| Low central venous pressure | Low central venous pressure + acute normovolemic haemodilution. | Unclear | Unclear | Unclear | Unclear | Unclear | High | Low | Low | Unclear or high | |
| Stapler | Clamp‐crush method | Low | Low | High | Low | Low | Low | High | Low | Unclear or high | |
| Cavitron ultrasonic surgical aspirator | Clamp‐crush method | Unclear | Unclear | Unclear | Unclear | Unclear | High | Unclear | Low | Unclear or high | |
| Cavitron ultrasonic surgical aspirator | Clamp‐crush method | Unclear | Unclear | Unclear | Unclear | Low | Low | Unclear | Low | Unclear or high | |
| Cavitron ultrasonic surgical aspirator | Clamp‐crush method. | Unclear | Unclear | Unclear | Unclear | Unclear | Low | Low | Low | Unclear or high | |
| Cavitron ultrasonic surgical aspirator | Hydrojet | Unclear | Unclear | Unclear | Unclear | Unclear | High | Unclear | Low | Unclear or high | |
| Cavitron ultrasonic surgical aspirator | Stapler | Low | Low | Unclear | Unclear | Low | Low | High | Low | Unclear or high | |
| Cavitron ultrasonic surgical aspirator | Radiofrequency dissecting sealer. | Unclear | Unclear | Unclear | Unclear | Low | Low | High | Low | Unclear or high | |
| Radiofrequency dissecting sealer | Clamp‐crush method | Low | Unclear | High | High | Low | Low | Low | Low | Unclear or high | |
| Radiofrequency dissecting sealer | Clamp‐crush method | Low | Unclear | Unclear | Unclear | Low | High | Low | Low | Unclear or high | |
| Radiofrequency dissecting sealer | Clamp‐crush method | Low | Low | Unclear | High | Low | Low | Low | Low | Unclear or high | |
| Radio‐frequency dissecting sealer | Clamp‐crush method | Low | Low | High | High | Low | Low | Low | Low | Unclear or high | |
| Sharp transection | Clamp‐crush method | Unclear | Unclear | Unclear | Unclear | Low | High | Unclear | Low | Unclear or high | |
| Anti‐thrombin III concentrate | Control | Unclear | Unclear | Unclear | Unclear | Unclear | High | Unclear | Low | Unclear or high | |
| Aprotinin | Control | Low | Unclear | Unclear | Low | High | High | High | Low | Unclear or high | |
| Desmopressin | Control | Unclear | Unclear | Low | Low | High | High | Low | Low | Unclear or high | |
| Recombinant factor VIIa | Control | Low | Low | Low | Low | High | Low | High | Low | Unclear or high | |
| Recombinant factor VIIa | Control | Unclear | Unclear | Unclear | Unclear | High | High | High | Low | Unclear or high | |
| Tranexamic acid | Control | Unclear | Unclear | Low | Low | Low | High | Unclear | Low | Unclear or high | |
| Collagen | Fibrin sealant | Low | Unclear | Unclear | Unclear | High | High | High | Low | Unclear or high | |
| Collagen | Fibrin sealant | Unclear | Unclear | Unclear | Unclear | Unclear | High | Unclear | Low | Unclear or high | |
| Collagen | Fibrin sealant | Unclear | Unclear | Unclear | Unclear | Low | Low | Unclear | Low | Unclear or high | |
| Collagen | Fibrin sealant | Low | Low | High | High | High | Low | High | Low | Unclear or high | |
| Fibrin sealant | Argon beam coagulator | Unclear | Low | High | High | High | Low | High | Low | Unclear or high | |
| Fibrin sealant | Argon beam coagulator | Unclear | Unclear | High | High | Low | Low | Unclear | Low | Unclear or high | |
| Fibrin sealant | Control | Low | Low | High | High | Low | Low | High | Low | Unclear or high | |
| Fibrin sealant | Control | Low | Low | High | High | Low | Low | High | Low | Unclear or high | |
| Fibrin sealant | Control | Unclear | Unclear | Unclear | Unclear | Low | High | Unclear | Low | Unclear or high | |
| Fibrin sealant | Control | Unclear | Unclear | Unclear | Unclear | High | High | Unclear | Low | Unclear or high | |
| Fibrin sealant | Gelatin | Unclear | Unclear | Unclear | Unclear | Unclear | High | Unclear | Low | Unclear or high | |
| Fibrin sealant | Oxidised cellulose | Unclear | Unclear | Unclear | Unclear | Unclear | High | Unclear | Low | Unclear or high | |
| Fibrin sealant | Oxidised cellulose | Low | Low | High | High | High | High | High | Low | Unclear or high | |
| Fibrin sealant | Oxidised cellulose | Unclear | Unclear | High | High | Low | Low | High | Low | Unclear or high | |
| Fibrin sealant | Oxidised cellulose | Low | Unclear | High | Unclear | Unclear | High | Low | Low | Unclear or high | |
| Fibrin sealant | PlasmaJet coagulator | Unclear | Unclear | Unclear | Unclear | Low | High | Unclear | Low | Unclear or high | |
| Fibrin sealant plus collagen | Control | Low | Low | Unclear | Unclear | Low | Low | Low | Low | Unclear or high | |
| Continuous portal triad clamping | Continuous hepatic vascular exclusion | Unclear | Unclear | Unclear | Unclear | High | High | Unclear | Low | Unclear or high | |
| Continuous portal triad clamping | Continuous hepatic vascular exclusion | Unclear | Unclear | Unclear | Unclear | Unclear | Low | Low | Low | Unclear or high | |
| Continuous portal triad clamping | Continuous selective hepatic vascular exclusion | Unclear | Low | Unclear | Unclear | Low | High | Unclear | Low | Unclear or high | |
| Continuous portal triad clamping | Continuous selective portal triad clamping | Unclear | Low | Unclear | Unclear | Low | Low | Low | Low | Unclear or high | |
| Continuous portal triad clamping | Control | Unclear | Unclear | High | Unclear | High | High | Unclear | Low | Unclear or high | |
| Continuous portal triad clamping | Control | Unclear | Unclear | Unclear | Unclear | High | High | Low | Low | Unclear or high | |
| Continuous portal triad clamping | Control | Low | Low | High | Low | Low | High | Low | Low | Unclear or high | |
| Continuous portal triad clamping | Control | Unclear | Unclear | Unclear | Unclear | Unclear | High | Unclear | Low | Unclear or high | |
| Continuous portal triad clamping | Intermittent portal triad clamping | Unclear | Unclear | Unclear | Unclear | Low | High | Unclear | Low | Unclear or high | |
| Continuous portal triad clamping | Intermittent portal triad clamping | Low | Unclear | Unclear | Unclear | Low | Low | Unclear | Low | Unclear or high | |
| Continuous selective portal triad clamping | Intermittent portal triad clamping | Unclear | Unclear | Unclear | Unclear | Low | Low | Low | Low | Unclear or high | |
| Intermittent portal triad clamping | Control | Low | Unclear | Unclear | Unclear | Low | High | Unclear | Low | Unclear or high | |
| Intermittent portal triad clamping | Control | Low | Low | High | High | Low | Low | Low | Low | Unclear or high | |
| Intermittent portal triad clamping | Control | Unclear | Unclear | Unclear | Unclear | Low | High | Low | Low | Unclear or high | |
| Intermittent portal triad clamping | Control | Unclear | Unclear | Unclear | Unclear | Low | High | Unclear | Low | Unclear or high | |
| Intermittent portal triad clamping | Control | Low | Low | Unclear | Unclear | High | High | Low | Low | Unclear or high | |
| Intermittent portal triad clamping | Intermittent selective portal triad clamping | Unclear | Unclear | Unclear | Unclear | Low | High | Low | Low | Unclear or high | |
| Intermittent portal triad clamping | Intermittent selective portal triad clamping | Unclear | Unclear | Unclear | Unclear | Low | Low | Low | Low | Unclear or high |
| Outcome or subgroup title | No. of studies | No. of participants | Statistical method | Effect size |
| 1 Mortality (perioperative) Show forest plot | 2 | Odds Ratio (M‐H, Fixed, 95% CI) | Subtotals only | |
| 1.1 Anterior approach vs conventional approach | 2 | 185 | Odds Ratio (M‐H, Fixed, 95% CI) | 0.27 [0.05, 1.32] |
| 2 Serious adverse events (proportion) Show forest plot | 1 | Odds Ratio (M‐H, Fixed, 95% CI) | Totals not selected | |
| 2.1 Anterior approach vs conventional approach | 1 | Odds Ratio (M‐H, Fixed, 95% CI) | 0.0 [0.0, 0.0] | |
| 3 Adverse events (proportion) Show forest plot | 2 | Odds Ratio (M‐H, Fixed, 95% CI) | Subtotals only | |
| 3.1 Anterior approach vs conventional approach | 2 | 185 | Odds Ratio (M‐H, Fixed, 95% CI) | 0.89 [0.48, 1.64] |
| 4 Adverse events (number) Show forest plot | 1 | Rate Ratio (Fixed, 95% CI) | Totals not selected | |
| 4.1 Anterior approach vs conventional approach | 1 | Rate Ratio (Fixed, 95% CI) | 0.0 [0.0, 0.0] | |
| 5 Blood transfusion (proportion) Show forest plot | 2 | Odds Ratio (M‐H, Random, 95% CI) | Subtotals only | |
| 5.1 Anterior approach vs conventional approach | 2 | 185 | Odds Ratio (M‐H, Random, 95% CI) | 0.60 [0.05, 6.74] |
| 6 Major blood loss (proportion) Show forest plot | 2 | Odds Ratio (M‐H, Random, 95% CI) | Subtotals only | |
| 6.1 Anterior approach vs conventional approach | 2 | 185 | Odds Ratio (M‐H, Random, 95% CI) | 0.56 [0.09, 3.41] |
| Outcome or subgroup title | No. of studies | No. of participants | Statistical method | Effect size |
| 1 Adverse events (proportion) Show forest plot | 1 | Odds Ratio (M‐H, Fixed, 95% CI) | Totals not selected | |
| 1.1 Autologous blood donation vs control | 1 | Odds Ratio (M‐H, Fixed, 95% CI) | 0.0 [0.0, 0.0] | |
| 2 Blood transfusion (proportion) Show forest plot | 1 | Odds Ratio (M‐H, Fixed, 95% CI) | Totals not selected | |
| 2.1 Autologous blood donation vs control | 1 | Odds Ratio (M‐H, Fixed, 95% CI) | 0.0 [0.0, 0.0] | |
| 3 Blood transfusion (red blood cell) Show forest plot | 1 | Mean Difference (IV, Fixed, 95% CI) | Totals not selected | |
| 3.1 Autologous blood donation vs control | 1 | Mean Difference (IV, Fixed, 95% CI) | 0.0 [0.0, 0.0] | |
| 4 Blood loss Show forest plot | 2 | Mean Difference (IV, Fixed, 95% CI) | Subtotals only | |
| 4.1 Autologous blood donation vs control | 2 | 70 | Mean Difference (IV, Fixed, 95% CI) | ‐0.02 [‐0.37, 0.34] |
| 5 Major blood loss (proportion) Show forest plot | 1 | Odds Ratio (M‐H, Fixed, 95% CI) | Totals not selected | |
| 5.1 Autologous blood donation vs control | 1 | Odds Ratio (M‐H, Fixed, 95% CI) | 0.0 [0.0, 0.0] | |
| 6 Total hospital stay Show forest plot | 1 | Mean Difference (IV, Fixed, 95% CI) | Totals not selected | |
| 6.1 Autologous blood donation vs control | 1 | Mean Difference (IV, Fixed, 95% CI) | 0.0 [0.0, 0.0] | |
| 7 Operating time Show forest plot | 2 | Mean Difference (IV, Fixed, 95% CI) | Subtotals only | |
| 7.1 Autologous blood donation vs control | 2 | 70 | Mean Difference (IV, Fixed, 95% CI) | ‐3.79 [‐34.28, 26.70] |
| Outcome or subgroup title | No. of studies | No. of participants | Statistical method | Effect size |
| 1 Mortality (perioperative) Show forest plot | 4 | Odds Ratio (M‐H, Fixed, 95% CI) | Subtotals only | |
| 1.1 Hypoventilation vs control | 1 | 79 | Odds Ratio (M‐H, Fixed, 95% CI) | 0.0 [0.0, 0.0] |
| 1.2 Low central venous pressure vs control | 1 | 85 | Odds Ratio (M‐H, Fixed, 95% CI) | 0.0 [0.0, 0.0] |
| 1.3 Low central venous pressure vs acute normovolemic haemodilution plus low central venous pressure | 2 | 208 | Odds Ratio (M‐H, Fixed, 95% CI) | 2.91 [0.29, 28.70] |
| 2 Serious adverse events (proportion) Show forest plot | 2 | Odds Ratio (M‐H, Fixed, 95% CI) | Totals not selected | |
| 2.1 Hypoventilation vs control | 1 | Odds Ratio (M‐H, Fixed, 95% CI) | 0.0 [0.0, 0.0] | |
| 2.2 Low central venous pressure vs acute normovolemic haemodilution plus low central venous pressure | 1 | Odds Ratio (M‐H, Fixed, 95% CI) | 0.0 [0.0, 0.0] | |
| 3 Serious adverse events (number) Show forest plot | 2 | Rate Ratio (Fixed, 95% CI) | Totals not selected | |
| 3.1 Low central venous pressure vs control | 1 | Rate Ratio (Fixed, 95% CI) | 0.0 [0.0, 0.0] | |
| 3.2 Low central venous pressure vs acute normovolemic haemodilution plus low central venous pressure | 1 | Rate Ratio (Fixed, 95% CI) | 0.0 [0.0, 0.0] | |
| 4 Adverse events (proportion) Show forest plot | 4 | Odds Ratio (M‐H, Fixed, 95% CI) | Subtotals only | |
| 4.1 Hypoventilation vs control | 1 | 79 | Odds Ratio (M‐H, Fixed, 95% CI) | 1.33 [0.53, 3.34] |
| 4.2 Low central venous pressure vs control | 1 | 50 | Odds Ratio (M‐H, Fixed, 95% CI) | 0.79 [0.21, 3.03] |
| 4.3 Low central venous pressure vs acute normovolemic haemodilution plus low central venous pressure | 2 | 208 | Odds Ratio (M‐H, Fixed, 95% CI) | 0.68 [0.37, 1.23] |
| 5 Adverse events (number) Show forest plot | 2 | Rate Ratio (Fixed, 95% CI) | Totals not selected | |
| 5.1 Low central venous pressure vs control | 1 | Rate Ratio (Fixed, 95% CI) | 0.0 [0.0, 0.0] | |
| 5.2 Low central venous pressure vs acute normovolemic haemodilution plus low central venous pressure | 1 | Rate Ratio (Fixed, 95% CI) | 0.0 [0.0, 0.0] | |
| 6 Blood transfusion (proportion) Show forest plot | 6 | Odds Ratio (M‐H, Fixed, 95% CI) | Subtotals only | |
| 6.1 Hypoventilation vs control | 1 | 79 | Odds Ratio (M‐H, Fixed, 95% CI) | 0.71 [0.15, 3.40] |
| 6.2 Low central venous pressure vs control | 3 | 175 | Odds Ratio (M‐H, Fixed, 95% CI) | 0.49 [0.21, 1.13] |
| 6.3 Low central venous pressure vs acute normovolemic haemodilution plus low central venous pressure | 2 | 208 | Odds Ratio (M‐H, Fixed, 95% CI) | 3.09 [1.49, 6.42] |
| 7 Blood transfusion (red blood cell) Show forest plot | 6 | Mean Difference (IV, Fixed, 95% CI) | Subtotals only | |
| 7.1 Acute normovolemic haemodilution vs control | 1 | 20 | Mean Difference (IV, Fixed, 95% CI) | ‐1.25 [‐1.74, ‐0.75] |
| 7.2 Acute normovolemic haemodilution plus hypotension vs control | 1 | 20 | Mean Difference (IV, Fixed, 95% CI) | ‐1.66 [‐2.05, ‐1.28] |
| 7.3 Acute normovolemic haemodilution plus low central venous pressure vs control | 1 | 30 | Mean Difference (IV, Fixed, 95% CI) | 0.27 [0.02, 0.51] |
| 7.4 Low central venous pressure vs control | 2 | 90 | Mean Difference (IV, Fixed, 95% CI) | ‐1.60 [‐2.26, ‐0.93] |
| 7.5 Acute normovolemic haemodilution plus hypotension vs acute normovolemic haemodilution | 1 | 20 | Mean Difference (IV, Fixed, 95% CI) | ‐0.42 [‐0.74, ‐0.10] |
| 7.6 Low central venous pressure vs acute normovolemic haemodilution plus low central venous pressure | 2 | 208 | Mean Difference (IV, Fixed, 95% CI) | 0.16 [‐0.63, 0.95] |
| 8 Blood transfusion (fresh frozen plasma) Show forest plot | 2 | Mean Difference (IV, Fixed, 95% CI) | Totals not selected | |
| 8.1 Low central venous pressure vs control | 1 | Mean Difference (IV, Fixed, 95% CI) | 0.0 [0.0, 0.0] | |
| 8.2 Low central venous pressure vs acute normovolemic haemodilution plus low central venous pressure | 1 | Mean Difference (IV, Fixed, 95% CI) | 0.0 [0.0, 0.0] | |
| 9 Blood transfusion (cryoprecipitate) Show forest plot | 1 | Mean Difference (IV, Fixed, 95% CI) | Totals not selected | |
| 9.1 Hypoventilation vs control | 1 | Mean Difference (IV, Fixed, 95% CI) | 0.0 [0.0, 0.0] | |
| 10 Blood loss Show forest plot | 9 | Mean Difference (IV, Fixed, 95% CI) | Subtotals only | |
| 10.1 Acute normovolemic haemodilution vs control | 1 | 20 | Mean Difference (IV, Fixed, 95% CI) | 0.00 [‐0.10, 0.11] |
| 10.2 Acute normovolemic haemodilution plus hypotension vs control | 1 | 20 | Mean Difference (IV, Fixed, 95% CI) | ‐0.25 [‐0.36, ‐0.14] |
| 10.3 Acute normovolemic haemodilution plus low central venous pressure vs control | 1 | 30 | Mean Difference (IV, Fixed, 95% CI) | 0.02 [‐0.03, 0.08] |
| 10.4 Hypoventilation vs control | 1 | 79 | Mean Difference (IV, Fixed, 95% CI) | 0.0 [‐1.12, 1.12] |
| 10.5 Low central venous pressure vs control | 4 | 237 | Mean Difference (IV, Fixed, 95% CI) | ‐0.34 [‐0.47, ‐0.22] |
| 10.6 Acute normovolemic haemodilution plus hypotension vs acute normovolemic haemodilution | 1 | 20 | Mean Difference (IV, Fixed, 95% CI) | ‐0.25 [‐0.39, ‐0.11] |
| 10.7 Low central venous pressure vs acute normovolemic haemodilution plus low central venous pressure | 2 | 208 | Mean Difference (IV, Fixed, 95% CI) | ‐0.09 [‐0.32, 0.15] |
| 11 Major blood loss (proportion) Show forest plot | 1 | Odds Ratio (M‐H, Fixed, 95% CI) | Totals not selected | |
| 11.1 Low central venous pressure vs acute normovolemic haemodilution plus low central venous pressure | 1 | Odds Ratio (M‐H, Fixed, 95% CI) | 0.0 [0.0, 0.0] | |
| 12 Hospital stay Show forest plot | 5 | Mean Difference (IV, Fixed, 95% CI) | Subtotals only | |
| 12.1 Hypoventilation vs control | 1 | 79 | Mean Difference (IV, Fixed, 95% CI) | 0.0 [‐3.79, 3.79] |
| 12.2 Low central venous pressure vs control | 3 | 197 | Mean Difference (IV, Fixed, 95% CI) | ‐2.43 [‐3.93, ‐0.94] |
| 12.3 Low central venous pressure vs acute normovolemic haemodilution plus low central venous pressure | 1 | 130 | Mean Difference (IV, Fixed, 95% CI) | 0.0 [‐2.96, 2.96] |
| 13 Operating time Show forest plot | 7 | Mean Difference (IV, Fixed, 95% CI) | Subtotals only | |
| 13.1 Acute normovolemic haemodilution plus low central venous pressure vs control | 1 | 40 | Mean Difference (IV, Fixed, 95% CI) | ‐17.0 [‐42.78, 8.78] |
| 13.2 Hypoventilation vs control | 1 | 79 | Mean Difference (IV, Fixed, 95% CI) | 0.0 [‐88.21, 88.21] |
| 13.3 Low central venous pressure vs control | 4 | 192 | Mean Difference (IV, Fixed, 95% CI) | ‐17.41 [‐31.14, ‐3.67] |
| 13.4 Low central venous pressure vs acute normovolemic haemodilution plus low central venous pressure | 3 | 248 | Mean Difference (IV, Fixed, 95% CI) | 13.63 [‐4.11, 31.38] |
| Outcome or subgroup title | No. of studies | No. of participants | Statistical method | Effect size |
| 1 Mortality (perioperative) Show forest plot | 11 | Odds Ratio (M‐H, Fixed, 95% CI) | Subtotals only | |
| 1.1 Cavitron ultrasonic surgical aspirator vs clamp‐crush method | 2 | 172 | Odds Ratio (M‐H, Fixed, 95% CI) | 0.18 [0.01, 4.01] |
| 1.2 Radiofrequency dissecting sealer vs clamp‐crush method | 5 | 390 | Odds Ratio (M‐H, Fixed, 95% CI) | 1.85 [0.38, 8.97] |
| 1.3 Sharp transection method vs clamp‐crush method | 1 | 82 | Odds Ratio (M‐H, Fixed, 95% CI) | 0.0 [0.0, 0.0] |
| 1.4 Stapler vs clamp‐crush method | 1 | 130 | Odds Ratio (M‐H, Fixed, 95% CI) | 2.07 [0.36, 11.69] |
| 1.5 Hydrojet vs cavitron ultrasonic surgical aspirator | 2 | 111 | Odds Ratio (M‐H, Fixed, 95% CI) | 0.99 [0.19, 5.17] |
| 1.6 Radiofrequency dissecting sealer vs cavitron ultrasonic surgical aspirator | 2 | 90 | Odds Ratio (M‐H, Fixed, 95% CI) | 0.66 [0.11, 4.05] |
| 1.7 Stapler vs cavitron ultrasonic surgical aspirator | 1 | 100 | Odds Ratio (M‐H, Fixed, 95% CI) | 0.0 [0.0, 0.0] |
| 1.8 Radiofrequency dissecting sealer vs hydrojet | 1 | 50 | Odds Ratio (M‐H, Fixed, 95% CI) | 0.18 [0.01, 4.04] |
| 2 Serious adverse events (proportion) Show forest plot | 7 | Odds Ratio (M‐H, Fixed, 95% CI) | Subtotals only | |
| 2.1 Cavitron ultrasonic surgical aspirator vs clamp‐crush method | 2 | 172 | Odds Ratio (M‐H, Fixed, 95% CI) | 0.35 [0.09, 1.35] |
| 2.2 Radiofrequency dissecting sealer vs clamp‐crush method | 3 | 240 | Odds Ratio (M‐H, Fixed, 95% CI) | 0.85 [0.27, 2.63] |
| 2.3 Sharp transection method vs clamp‐crush method | 1 | 82 | Odds Ratio (M‐H, Fixed, 95% CI) | 2.11 [0.36, 12.20] |
| 2.4 Stapler vs clamp‐crush method | 1 | 130 | Odds Ratio (M‐H, Fixed, 95% CI) | 1.26 [0.58, 2.75] |
| 2.5 Hydrojet vs cavitron ultrasonic surgical aspirator | 1 | 61 | Odds Ratio (M‐H, Fixed, 95% CI) | 0.62 [0.10, 4.00] |
| 2.6 Radiofrequency dissecting sealer vs cavitron ultrasonic surgical aspirator | 1 | 40 | Odds Ratio (M‐H, Fixed, 95% CI) | 1.0 [0.06, 17.18] |
| 3 Serious adverse events (number) Show forest plot | 5 | Rate Ratio (Fixed, 95% CI) | Subtotals only | |
| 3.1 Cavitron ultrasonic surgical aspirator vs clamp‐crush method | 1 | 132 | Rate Ratio (Fixed, 95% CI) | 0.67 [0.11, 3.99] |
| 3.2 Radiofrequency dissecting sealer vs clamp‐crush method | 2 | 130 | Rate Ratio (Fixed, 95% CI) | 3.34 [1.08, 10.31] |
| 3.3 Hydrojet vs cavitron ultrasonic surgical aspirator | 1 | 50 | Rate Ratio (Fixed, 95% CI) | 1.50 [0.25, 8.98] |
| 3.4 Radiofrequency dissecting sealer vs cavitron ultrasonic surgical aspirator | 1 | 50 | Rate Ratio (Fixed, 95% CI) | 1.50 [0.25, 8.98] |
| 3.5 Stapler vs cavitron ultrasonic surgical aspirator | 1 | 100 | Rate Ratio (Fixed, 95% CI) | 1.33 [0.56, 3.16] |
| 3.6 Radiofrequency dissecting sealer vs hydrojet | 1 | 50 | Rate Ratio (Fixed, 95% CI) | 1.0 [0.20, 4.95] |
| 4 Adverse events (proportion) Show forest plot | 8 | Odds Ratio (M‐H, Fixed, 95% CI) | Subtotals only | |
| 4.1 Cavitron ultrasonic surgical aspirator vs clamp‐crush method | 3 | 222 | Odds Ratio (M‐H, Fixed, 95% CI) | 1.30 [0.73, 2.34] |
| 4.2 Radiofrequency dissecting sealer vs clamp‐crush method | 3 | 220 | Odds Ratio (M‐H, Fixed, 95% CI) | 0.92 [0.51, 1.64] |
| 4.3 Sharp transection method vs clamp‐crush method | 1 | 82 | Odds Ratio (M‐H, Fixed, 95% CI) | 1.11 [0.46, 2.68] |
| 4.4 Stapler vs clamp‐crush method | 1 | 130 | Odds Ratio (M‐H, Fixed, 95% CI) | 1.06 [0.53, 2.12] |
| 4.5 Hydrojet vs cavitron ultrasonic surgical aspirator | 1 | 61 | Odds Ratio (M‐H, Fixed, 95% CI) | 0.29 [0.07, 1.24] |
| 4.6 Radiofrequency dissecting sealer vs cavitron ultrasonic surgical aspirator | 1 | 40 | Odds Ratio (M‐H, Fixed, 95% CI) | 1.86 [0.52, 6.61] |
| 5 Adverse events (number) Show forest plot | 7 | Rate Ratio (Fixed, 95% CI) | Subtotals only | |
| 5.1 Cavitron ultrasonic surgical aspirator vs clamp‐crush method | 1 | 132 | Rate Ratio (Fixed, 95% CI) | 1.56 [0.83, 2.93] |
| 5.2 Radiofrequency dissecting sealer vs clamp‐crush method | 3 | 250 | Rate Ratio (Fixed, 95% CI) | 1.67 [0.95, 2.94] |
| 5.3 Sharp transection method vs clamp‐crush method | 1 | 82 | Rate Ratio (Fixed, 95% CI) | 1.12 [0.57, 2.21] |
| 5.4 Hydrojet vs cavitron ultrasonic surgical aspirator | 1 | 50 | Rate Ratio (Fixed, 95% CI) | 0.88 [0.32, 2.41] |
| 5.5 Radiofrequency dissecting sealer vs cavitron ultrasonic surgical aspirator | 1 | 50 | Rate Ratio (Fixed, 95% CI) | 1.12 [0.43, 2.92] |
| 5.6 Stapler vs cavitron ultrasonic surgical aspirator | 1 | 100 | Rate Ratio (Fixed, 95% CI) | 1.16 [0.63, 2.14] |
| 5.7 Radiofrequency dissecting sealer vs hydrojet | 1 | 50 | Rate Ratio (Fixed, 95% CI) | 1.29 [0.48, 3.45] |
| 6 Blood transfusion (proportion) Show forest plot | 8 | Odds Ratio (M‐H, Fixed, 95% CI) | Subtotals only | |
| 6.1 Cavitron ultrasonic surgical aspirator vs clamp‐crush method | 2 | 172 | Odds Ratio (M‐H, Fixed, 95% CI) | 1.37 [0.29, 6.59] |
| 6.2 Radiofrequency dissecting sealer vs clamp‐crush method | 5 | 390 | Odds Ratio (M‐H, Fixed, 95% CI) | 1.13 [0.63, 2.03] |
| 6.3 Sharp transection method vs clamp‐crush method | 1 | 82 | Odds Ratio (M‐H, Fixed, 95% CI) | 0.80 [0.32, 2.01] |
| 6.4 Hydrojet vs cavitron ultrasonic surgical aspirator | 1 | 50 | Odds Ratio (M‐H, Fixed, 95% CI) | 1.0 [0.30, 3.28] |
| 6.5 Radiofrequency dissecting sealer vs cavitron ultrasonic surgical aspirator | 2 | 90 | Odds Ratio (M‐H, Fixed, 95% CI) | 0.77 [0.29, 2.09] |
| 6.6 Radiofrequency dissecting sealer vs hydrojet | 1 | 50 | Odds Ratio (M‐H, Fixed, 95% CI) | 0.53 [0.15, 1.93] |
| 7 Blood transfusion (red blood cell) Show forest plot | 4 | Mean Difference (IV, Fixed, 95% CI) | Totals not selected | |
| 7.1 Sharp transection method vs clamp‐crush method | 1 | Mean Difference (IV, Fixed, 95% CI) | 0.0 [0.0, 0.0] | |
| 7.2 Stapler vs clamp‐crush method | 1 | Mean Difference (IV, Fixed, 95% CI) | 0.0 [0.0, 0.0] | |
| 7.3 Hydrojet vs cavitron ultrasonic surgical aspirator | 1 | Mean Difference (IV, Fixed, 95% CI) | 0.0 [0.0, 0.0] | |
| 7.4 Stapler vs cavitron ultrasonic surgical aspirator | 1 | Mean Difference (IV, Fixed, 95% CI) | 0.0 [0.0, 0.0] | |
| 8 Blood transfusion (fresh frozen plasma) Show forest plot | 1 | Mean Difference (IV, Fixed, 95% CI) | Totals not selected | |
| 8.1 Stapler vs clamp‐crush method | 1 | Mean Difference (IV, Fixed, 95% CI) | 0.0 [0.0, 0.0] | |
| 9 Blood loss Show forest plot | 2 | Mean Difference (IV, Fixed, 95% CI) | Totals not selected | |
| 9.1 Cavitron ultrasonic surgical aspirator vs clamp‐crush method | 1 | Mean Difference (IV, Fixed, 95% CI) | 0.0 [0.0, 0.0] | |
| 9.2 Hydrojet vs cavitron ultrasonic surgical aspirator | 1 | Mean Difference (IV, Fixed, 95% CI) | 0.0 [0.0, 0.0] | |
| 10 Operating time Show forest plot | 6 | Mean Difference (IV, Fixed, 95% CI) | Subtotals only | |
| 10.1 Cavitron ultrasonic surgical aspirator vs clamp‐crush method | 2 | 90 | Mean Difference (IV, Fixed, 95% CI) | 27.47 [‐2.87, 57.81] |
| 10.2 Radiofrequency dissecting sealer vs clamp‐crush method | 2 | 90 | Mean Difference (IV, Fixed, 95% CI) | 16.11 [‐11.45, 43.67] |
| 10.3 Sharp transection method vs clamp‐crush method | 1 | 82 | Mean Difference (IV, Fixed, 95% CI) | ‐6.0 [‐90.85, 78.85] |
| 10.4 Stapler vs clamp‐crush method | 1 | 130 | Mean Difference (IV, Fixed, 95% CI) | ‐31.0 [‐60.40, ‐1.60] |
| 10.5 Radiofrequency dissecting sealer vs cavitron ultrasonic surgical aspirator | 1 | 40 | Mean Difference (IV, Fixed, 95% CI) | 25.0 [‐96.48, 146.48] |
| 10.6 Stapler vs cavitron ultrasonic surgical aspirator | 1 | 100 | Mean Difference (IV, Fixed, 95% CI) | ‐26.0 [‐87.12, 35.12] |
| Outcome or subgroup title | No. of studies | No. of participants | Statistical method | Effect size |
| 1 Mortality (perioperative) Show forest plot | 10 | Odds Ratio (M‐H, Fixed, 95% CI) | Subtotals only | |
| 1.1 Fibrin sealant vs control | 2 | 380 | Odds Ratio (M‐H, Fixed, 95% CI) | 3.56 [0.73, 17.35] |
| 1.2 Fibrin sealant and collagen vs control | 1 | 300 | Odds Ratio (M‐H, Fixed, 95% CI) | 3.08 [0.61, 15.53] |
| 1.3 Fibrin sealant vs argon beam | 2 | 227 | Odds Ratio (M‐H, Fixed, 95% CI) | 1.37 [0.46, 4.03] |
| 1.4 Fibrin sealant vs collagen | 3 | 256 | Odds Ratio (M‐H, Fixed, 95% CI) | 0.90 [0.24, 3.32] |
| 1.5 Oxidised cellulose vs fibrin sealant | 1 | 50 | Odds Ratio (M‐H, Fixed, 95% CI) | 0.55 [0.03, 9.33] |
| 1.6 Plasmajet vs fibrin sealant | 1 | 58 | Odds Ratio (M‐H, Fixed, 95% CI) | 0.64 [0.10, 4.16] |
| 2 Serious adverse events (proportion) Show forest plot | 7 | Odds Ratio (M‐H, Fixed, 95% CI) | Subtotals only | |
| 2.1 Fibrin sealant vs control | 3 | 457 | Odds Ratio (M‐H, Fixed, 95% CI) | 1.03 [0.64, 1.65] |
| 2.2 Fibrin sealant vs argon beam | 1 | 106 | Odds Ratio (M‐H, Fixed, 95% CI) | 0.62 [0.25, 1.55] |
| 2.3 Fibrin sealant vs collagen | 1 | 127 | Odds Ratio (M‐H, Fixed, 95% CI) | 1.57 [0.73, 3.38] |
| 2.4 Oxidised cellulose vs fibrin sealant | 1 | 50 | Odds Ratio (M‐H, Fixed, 95% CI) | 0.57 [0.17, 1.87] |
| 2.5 Plasmajet vs fibrin sealant | 1 | 58 | Odds Ratio (M‐H, Fixed, 95% CI) | 0.14 [0.02, 1.22] |
| 3 Serious adverse events (number) Show forest plot | 6 | Rate Ratio (Fixed, 95% CI) | Subtotals only | |
| 3.1 Fibrin sealant vs control | 1 | 70 | Rate Ratio (Fixed, 95% CI) | 0.94 [0.48, 1.86] |
| 3.2 Fibrin sealant and collagen vs control | 1 | 300 | Rate Ratio (Fixed, 95% CI) | 1.32 [0.76, 2.29] |
| 3.3 Fibrin sealant vs argon beam | 1 | 121 | Rate Ratio (Fixed, 95% CI) | 4.47 [1.50, 13.27] |
| 3.4 Fibrin sealant vs collagen | 2 | 189 | Rate Ratio (Fixed, 95% CI) | 1.22 [0.76, 1.98] |
| 3.5 Fibrin sealant vs cyanoacrylate | 1 | 30 | Rate Ratio (Fixed, 95% CI) | 1.0 [0.06, 15.99] |
| 3.6 Oxidised cellulose vs cyanoacrylate | 1 | 30 | Rate Ratio (Fixed, 95% CI) | 4.00 [0.45, 35.79] |
| 3.7 Oxidised cellulose vs fibrin sealant | 1 | 30 | Rate Ratio (Fixed, 95% CI) | 4.00 [0.45, 35.79] |
| 4 Adverse events (proportion) Show forest plot | 9 | Odds Ratio (M‐H, Fixed, 95% CI) | Subtotals only | |
| 4.1 Fibrin sealant versus control | 3 | 457 | Odds Ratio (M‐H, Fixed, 95% CI) | 0.80 [0.55, 1.17] |
| 4.2 Fibrin sealant and collagen vs control | 1 | 300 | Odds Ratio (M‐H, Fixed, 95% CI) | 1.0 [0.59, 1.71] |
| 4.3 Fibrin sealant vs argon beam | 2 | 227 | Odds Ratio (M‐H, Fixed, 95% CI) | 0.97 [0.58, 1.64] |
| 4.4 Fibrin sealant vs collagen | 1 | 127 | Odds Ratio (M‐H, Fixed, 95% CI) | 0.95 [0.46, 1.93] |
| 4.5 Oxidised cellulose vs fibrin sealant | 2 | 274 | Odds Ratio (M‐H, Fixed, 95% CI) | 0.77 [0.30, 2.01] |
| 5 Adverse events (number) Show forest plot | 5 | Rate Ratio (Fixed, 95% CI) | Subtotals only | |
| 5.1 Fibrin sealant vs control | 1 | 70 | Rate Ratio (Fixed, 95% CI) | 1.01 [0.75, 1.36] |
| 5.2 Fibrin sealant vs argon beam | 1 | 121 | Rate Ratio (Fixed, 95% CI) | 1.12 [0.75, 1.66] |
| 5.3 Fibrin sealant vs collagen | 2 | 189 | Rate Ratio (Fixed, 95% CI) | 1.13 [0.90, 1.42] |
| 5.4 Fibrin sealant vs cyanoacrylate | 1 | 30 | Rate Ratio (Fixed, 95% CI) | 1.50 [0.25, 8.98] |
| 5.5 Oxidised cellulose vs cyanoacrylate | 1 | 30 | Rate Ratio (Fixed, 95% CI) | 3.50 [0.73, 16.85] |
| 5.6 Oxidised cellulose vs fibrin sealant | 1 | 30 | Rate Ratio (Fixed, 95% CI) | 2.33 [0.60, 9.02] |
| 6 Blood transfusion (proportion) Show forest plot | 4 | Odds Ratio (M‐H, Fixed, 95% CI) | Subtotals only | |
| 6.1 Fibrin sealant vs control | 2 | 392 | Odds Ratio (M‐H, Fixed, 95% CI) | 1.04 [0.61, 1.76] |
| 6.2 Fibrin sealant and collagen vs control | 1 | 300 | Odds Ratio (M‐H, Fixed, 95% CI) | 1.52 [0.88, 2.61] |
| 6.3 Fibrin sealant vs cyanoacrylate | 1 | 30 | Odds Ratio (M‐H, Fixed, 95% CI) | 3.25 [0.52, 20.37] |
| 6.4 Oxidised cellulose vs cyanoacrylate | 1 | 30 | Odds Ratio (M‐H, Fixed, 95% CI) | 2.36 [0.36, 15.45] |
| 6.5 Oxidised cellulose vs fibrin sealant | 1 | 30 | Odds Ratio (M‐H, Fixed, 95% CI) | 0.73 [0.15, 3.49] |
| 7 Blood transfusion (red blood cell) Show forest plot | 5 | Mean Difference (IV, Random, 95% CI) | Subtotals only | |
| 7.1 Fibrin sealant vs control | 2 | 122 | Mean Difference (IV, Random, 95% CI) | ‐0.53 [‐1.00, ‐0.06] |
| 7.2 Fibrin sealant and collagen vs control | 1 | 300 | Mean Difference (IV, Random, 95% CI) | ‐0.01 [‐0.16, 0.14] |
| 7.3 Fibrin sealant vs collagen | 0 | 0 | Mean Difference (IV, Random, 95% CI) | 0.0 [0.0, 0.0] |
| 7.4 Fibrin sealant vs cyanoacrylate | 1 | 30 | Mean Difference (IV, Random, 95% CI) | 2.2 [1.59, 2.81] |
| 7.5 Oxidised cellulose vs cyanoacrylate | 1 | 30 | Mean Difference (IV, Random, 95% CI) | ‐0.27 [‐0.81, 0.27] |
| 7.6 Oxidised cellulose vs fibrin sealant | 2 | 80 | Mean Difference (IV, Random, 95% CI) | ‐1.76 [‐2.00, 0.47] |
| 8 Blood transfusion (fresh frozen plasma) Show forest plot | 2 | Mean Difference (IV, Fixed, 95% CI) | Subtotals only | |
| 8.1 Fibrin sealant vs cyanoacrylate | 1 | 30 | Mean Difference (IV, Fixed, 95% CI) | ‐0.8 [‐1.01, ‐0.59] |
| 8.2 Oxidised cellulose vs cyanoacrylate | 1 | 30 | Mean Difference (IV, Fixed, 95% CI) | ‐0.27 [‐0.55, 0.01] |
| 8.3 Oxidised cellulose vs fibrin sealant | 2 | 80 | Mean Difference (IV, Fixed, 95% CI) | 0.53 [0.35, 0.71] |
| 9 Blood loss Show forest plot | 5 | Mean Difference (IV, Fixed, 95% CI) | Subtotals only | |
| 9.1 Fibrin sealant vs control | 2 | 350 | Mean Difference (IV, Fixed, 95% CI) | 0.10 [‐0.13, 0.33] |
| 9.2 Fibrin sealant and collagen vs control | 1 | 300 | Mean Difference (IV, Fixed, 95% CI) | 0.06 [‐0.06, 0.19] |
| 9.3 Fibrin sealant vs collagen | 1 | 62 | Mean Difference (IV, Fixed, 95% CI) | 0.07 [‐0.54, 0.68] |
| 9.4 Fibrin sealant vs cyanoacrylate | 1 | 30 | Mean Difference (IV, Fixed, 95% CI) | 0.11 [‐0.20, 0.43] |
| 9.5 Oxidised cellulose vs cyanoacrylate | 1 | 30 | Mean Difference (IV, Fixed, 95% CI) | ‐0.08 [‐0.35, 0.19] |
| 9.6 Oxidised cellulose vs fibrin sealant | 1 | 30 | Mean Difference (IV, Fixed, 95% CI) | ‐0.19 [‐0.45, 0.06] |
| 10 Total hospital stay Show forest plot | 4 | Mean Difference (IV, Fixed, 95% CI) | Subtotals only | |
| 10.1 Fibrin sealant vs control | 1 | 82 | Mean Difference (IV, Fixed, 95% CI) | ‐0.5 [‐2.45, 1.45] |
| 10.2 Fibrin sealant and collagen vs control | 1 | 300 | Mean Difference (IV, Fixed, 95% CI) | 0.70 [‐1.83, 3.23] |
| 10.3 Fibrin sealant vs cyanoacrylate | 1 | 30 | Mean Difference (IV, Fixed, 95% CI) | ‐1.34 [‐3.61, 0.93] |
| 10.4 Oxidised cellulose vs cyanoacrylate | 1 | 30 | Mean Difference (IV, Fixed, 95% CI) | ‐0.67 [‐3.12, 1.78] |
| 10.5 Oxidised cellulose vs fibrin sealant | 2 | 80 | Mean Difference (IV, Fixed, 95% CI) | 0.25 [‐1.84, 2.33] |
| 11 ITU stay Show forest plot | 1 | Mean Difference (IV, Fixed, 95% CI) | Totals not selected | |
| 11.1 Oxidised cellulose vs fibrin sealant | 1 | Mean Difference (IV, Fixed, 95% CI) | 0.0 [0.0, 0.0] | |
| 12 Operating time Show forest plot | 5 | Mean Difference (IV, Fixed, 95% CI) | Subtotals only | |
| 12.1 Fibrin sealant vs control | 2 | 122 | Mean Difference (IV, Fixed, 95% CI) | ‐14.55 [‐52.86, 23.76] |
| 12.2 Fibrin sealant and collagen vs control | 1 | 300 | Mean Difference (IV, Fixed, 95% CI) | 19.0 [2.09, 35.91] |
| 12.3 Fibrin sealant vs collagen | 1 | 62 | Mean Difference (IV, Fixed, 95% CI) | ‐4.0 [‐44.33, 36.33] |
| 12.4 Oxidised cellulose vs fibrin sealant | 1 | 50 | Mean Difference (IV, Fixed, 95% CI) | 5.40 [‐70.13, 80.93] |
| Outcome or subgroup title | No. of studies | No. of participants | Statistical method | Effect size |
| 1 Mortality (perioperative) Show forest plot | 14 | Odds Ratio (M‐H, Fixed, 95% CI) | Subtotals only | |
| 1.1 Continuous portal triad clamping vs control | 1 | 15 | Odds Ratio (M‐H, Fixed, 95% CI) | 0.0 [0.0, 0.0] |
| 1.2 Intermittent portal triad clamping vs control | 4 | 392 | Odds Ratio (M‐H, Fixed, 95% CI) | 0.63 [0.16, 2.44] |
| 1.3 Continuous portal triad clamping vs continuous hepatic vascular exclusion | 2 | 170 | Odds Ratio (M‐H, Fixed, 95% CI) | 3.39 [0.34, 33.33] |
| 1.4 Continuous selective hepatic vascular exclusion vs continuous portal triad clamping | 1 | 160 | Odds Ratio (M‐H, Fixed, 95% CI) | 0.0 [0.0, 0.0] |
| 1.5 Continuous selective portal triad clamping vs continuous portal triad clamping | 1 | 120 | Odds Ratio (M‐H, Fixed, 95% CI) | 0.0 [0.0, 0.0] |
| 1.6 Intermittent portal triad clamping vs continuous portal triad clamping | 2 | 121 | Odds Ratio (M‐H, Fixed, 95% CI) | 0.19 [0.02, 1.64] |
| 1.7 Intermittent portal triad clamping vs continuous selective portal triad clamping | 1 | 80 | Odds Ratio (M‐H, Fixed, 95% CI) | 0.0 [0.0, 0.0] |
| 1.8 Intermittent selective portal triad clamping vs intermittent portal triad clamping | 2 | 138 | Odds Ratio (M‐H, Fixed, 95% CI) | 2.93 [0.12, 74.00] |
| 2 Serious adverse events (proportion) Show forest plot | 8 | Odds Ratio (M‐H, Fixed, 95% CI) | Subtotals only | |
| 2.1 Intermittent portal triad clamping vs control | 3 | 302 | Odds Ratio (M‐H, Fixed, 95% CI) | 1.16 [0.55, 2.44] |
| 2.2 Continuous portal triad clamping vs continuous hepatic vascular exclusion | 1 | 118 | Odds Ratio (M‐H, Fixed, 95% CI) | 0.68 [0.11, 4.22] |
| 2.3 Continuous selective hepatic vascular exclusion vs continuous portal triad clamping | 1 | 160 | Odds Ratio (M‐H, Fixed, 95% CI) | 0.20 [0.01, 4.13] |
| 2.4 Continuous selective portal triad clamping vs continuous portal triad clamping | 1 | 120 | Odds Ratio (M‐H, Fixed, 95% CI) | 0.43 [0.19, 0.98] |
| 2.5 Intermittent portal triad clamping vs continuous portal triad clamping | 1 | 35 | Odds Ratio (M‐H, Fixed, 95% CI) | 0.47 [0.07, 2.96] |
| 2.6 Intermittent portal triad clamping vs continuous selective portal triad clamping | 1 | 80 | Odds Ratio (M‐H, Fixed, 95% CI) | 4.33 [0.46, 40.61] |
| 3 Serious adverse events (number) Show forest plot | 5 | Rate Ratio (Fixed, 95% CI) | Subtotals only | |
| 3.1 Intermittent portal triad clamping vs control | 1 | 100 | Rate Ratio (Fixed, 95% CI) | 1.50 [0.42, 5.32] |
| 3.2 Continuous portal triad clamping vs continuous hepatic vascular exclusion | 1 | 52 | Rate Ratio (Fixed, 95% CI) | 0.23 [0.03, 2.00] |
| 3.3 Intermittent portal triad clamping vs continuous portal triad clamping | 1 | 86 | Rate Ratio (Fixed, 95% CI) | 0.12 [0.01, 0.95] |
| 3.4 Intermittent selective portal triad clamping vs intermittent portal triad clamping | 2 | 138 | Rate Ratio (Fixed, 95% CI) | 1.26 [0.53, 2.99] |
| 4 Adverse events (proportion) Show forest plot | 12 | Odds Ratio (M‐H, Fixed, 95% CI) | Subtotals only | |
| 4.1 Intermittent portal triad clamping vs control | 4 | 392 | Odds Ratio (M‐H, Fixed, 95% CI) | 1.27 [0.83, 1.94] |
| 4.2 Continuous portal triad clamping vs continuous hepatic vascular exclusion | 1 | 118 | Odds Ratio (M‐H, Fixed, 95% CI) | 0.89 [0.41, 1.96] |
| 4.3 Continuous selective hepatic vascular exclusion vs continuous portal triad clamping | 1 | 160 | Odds Ratio (M‐H, Fixed, 95% CI) | 0.47 [0.20, 1.13] |
| 4.4 Continuous selective portal triad clamping vs continuous portal triad clamping | 1 | 120 | Odds Ratio (M‐H, Fixed, 95% CI) | 0.41 [0.19, 0.93] |
| 4.5 Intermittent portal triad clamping vs continuous portal triad clamping | 2 | 121 | Odds Ratio (M‐H, Fixed, 95% CI) | 0.67 [0.29, 1.56] |
| 4.6 Intermittent portal triad clamping vs continuous selective portal triad clamping | 1 | 80 | Odds Ratio (M‐H, Fixed, 95% CI) | 0.86 [0.29, 2.52] |
| 4.7 Intermittent selective portal triad clamping vs intermittent portal triad clamping | 2 | 138 | Odds Ratio (M‐H, Fixed, 95% CI) | 0.86 [0.42, 1.75] |
| 5 Adverse events (number) Show forest plot | 6 | Rate Ratio (Fixed, 95% CI) | Subtotals only | |
| 5.1 Intermittent portal triad clamping vs control | 2 | 226 | Rate Ratio (Fixed, 95% CI) | 1.19 [0.80, 1.76] |
| 5.2 Continuous portal triad clamping vs continuous hepatic vascular exclusion | 1 | 52 | Rate Ratio (Fixed, 95% CI) | 0.61 [0.29, 1.32] |
| 5.3 Intermittent portal triad clamping vs continuous portal triad clamping | 1 | 86 | Rate Ratio (Fixed, 95% CI) | 0.64 [0.31, 1.32] |
| 5.4 Intermittent selective portal triad clamping vs intermittent portal triad clamping | 2 | 138 | Rate Ratio (Fixed, 95% CI) | 1.17 [0.72, 1.91] |
| 6 Blood transfusion (proportion) Show forest plot | 13 | Odds Ratio (M‐H, Fixed, 95% CI) | Subtotals only | |
| 6.1 Continuous portal triad clamping vs control | 1 | 34 | Odds Ratio (M‐H, Fixed, 95% CI) | 0.08 [0.01, 0.80] |
| 6.2 Intermittent portal triad clamping vs control | 4 | 392 | Odds Ratio (M‐H, Fixed, 95% CI) | 0.82 [0.50, 1.35] |
| 6.3 Continuous portal triad clamping vs continuous hepatic vascular exclusion | 1 | 118 | Odds Ratio (M‐H, Fixed, 95% CI) | 5.66 [2.29, 14.00] |
| 6.4 Continuous selective hepatic vascular exclusion vs continuous portal triad clamping | 1 | 160 | Odds Ratio (M‐H, Fixed, 95% CI) | 0.51 [0.24, 1.11] |
| 6.5 Continuous selective portal triad clamping vs continuous portal triad clamping | 1 | 120 | Odds Ratio (M‐H, Fixed, 95% CI) | 1.56 [0.42, 5.82] |
| 6.6 Intermittent portal triad clamping vs continuous portal triad clamping | 2 | 121 | Odds Ratio (M‐H, Fixed, 95% CI) | 1.14 [0.52, 2.49] |
| 6.7 Intermittent portal triad clamping vs continuous selective portal triad clamping | 1 | 80 | Odds Ratio (M‐H, Fixed, 95% CI) | 0.90 [0.36, 2.23] |
| 6.8 Intermittent selective portal triad clamping vs intermittent portal triad clamping | 2 | 138 | Odds Ratio (M‐H, Fixed, 95% CI) | 0.58 [0.25, 1.36] |
| 7 Blood transfusion (red blood cell) Show forest plot | 10 | Mean Difference (IV, Fixed, 95% CI) | Subtotals only | |
| 7.1 Continuous portal triad clamping vs control | 1 | 15 | Mean Difference (IV, Fixed, 95% CI) | ‐0.60 [‐3.20, 2.00] |
| 7.2 Intermittent portal triad clamping vs control | 1 | 100 | Mean Difference (IV, Fixed, 95% CI) | ‐1.5 [‐2.75, ‐0.25] |
| 7.3 Continuous portal triad clamping vs continuous hepatic vascular exclusion | 1 | 52 | Mean Difference (IV, Fixed, 95% CI) | 0.40 [‐1.61, 2.41] |
| 7.4 Continuous selective hepatic vascular exclusion vs continuous portal triad clamping | 1 | 160 | Mean Difference (IV, Fixed, 95% CI) | ‐1.20 [‐2.38, ‐0.02] |
| 7.5 Continuous selective portal triad clamping vs continuous portal triad clamping | 1 | 120 | Mean Difference (IV, Fixed, 95% CI) | ‐0.20 [‐0.31, ‐0.09] |
| 7.6 Intermittent portal triad clamping vs continuous portal triad clamping | 2 | 121 | Mean Difference (IV, Fixed, 95% CI) | ‐0.13 [‐0.60, 0.34] |
| 7.7 Intermittent portal triad clamping vs continuous selective portal triad clamping | 1 | 80 | Mean Difference (IV, Fixed, 95% CI) | 0.11 [‐0.23, 0.46] |
| 7.8 Intermittent selective portal triad clamping vs intermittent portal triad clamping | 2 | 138 | Mean Difference (IV, Fixed, 95% CI) | ‐0.07 [‐0.45, 0.32] |
| 8 Blood loss Show forest plot | 16 | Mean Difference (IV, Random, 95% CI) | Subtotals only | |
| 8.1 Continuous portal triad clamping vs control | 3 | 131 | Mean Difference (IV, Random, 95% CI) | ‐0.24 [‐0.76, 0.27] |
| 8.2 Intermittent portal triad clamping vs control | 4 | 402 | Mean Difference (IV, Random, 95% CI) | ‐0.02 [‐0.19, 0.15] |
| 8.3 Continuous portal triad clamping vs continuous hepatic vascular exclusion | 2 | 170 | Mean Difference (IV, Random, 95% CI) | 0.17 [‐0.35, 0.68] |
| 8.4 Continuous selective hepatic vascular exclusion vs continuous portal triad clamping | 1 | 160 | Mean Difference (IV, Random, 95% CI) | ‐0.25 [‐0.49, ‐0.00] |
| 8.5 Continuous selective portal triad clamping vs continuous portal triad clamping | 1 | 120 | Mean Difference (IV, Random, 95% CI) | 0.10 [‐0.19, 0.39] |
| 8.6 Intermittent portal triad clamping vs continuous portal triad clamping | 2 | 121 | Mean Difference (IV, Random, 95% CI) | 0.06 [‐0.20, 0.32] |
| 8.7 Intermittent portal triad clamping vs continuous selective portal triad clamping | 1 | 80 | Mean Difference (IV, Random, 95% CI) | ‐0.08 [‐0.20, 0.05] |
| 8.8 Intermittent selective portal triad clamping vs intermittent portal triad clamping | 2 | 138 | Mean Difference (IV, Random, 95% CI) | ‐0.17 [‐0.74, 0.39] |
| 9 Major blood loss (proportion) Show forest plot | 3 | Odds Ratio (M‐H, Fixed, 95% CI) | Totals not selected | |
| 9.1 Intermittent portal triad clamping vs control | 1 | Odds Ratio (M‐H, Fixed, 95% CI) | 0.0 [0.0, 0.0] | |
| 9.2 Continuous selective hepatic vascular exclusion vs continuous portal triad clamping | 1 | Odds Ratio (M‐H, Fixed, 95% CI) | 0.0 [0.0, 0.0] | |
| 9.3 Continuous selective portal triad clamping vs continuous portal triad clamping | 1 | Odds Ratio (M‐H, Fixed, 95% CI) | 0.0 [0.0, 0.0] | |
| 10 Total hospital stay Show forest plot | 10 | Mean Difference (IV, Fixed, 95% CI) | Subtotals only | |
| 10.1 Intermittent portal triad clamping vs control | 4 | 402 | Mean Difference (IV, Fixed, 95% CI) | 0.32 [‐0.64, 1.28] |
| 10.2 Continuous portal triad clamping vs continuous hepatic vascular exclusion | 1 | 52 | Mean Difference (IV, Fixed, 95% CI) | ‐8.0 [‐13.05, ‐2.95] |
| 10.3 Continuous selective hepatic vascular exclusion vs continuous portal triad clamping | 1 | 160 | Mean Difference (IV, Fixed, 95% CI) | ‐2.80 [‐4.13, ‐1.47] |
| 10.4 Intermittent portal triad clamping vs continuous portal triad clamping | 1 | 86 | Mean Difference (IV, Fixed, 95% CI) | 1.0 [‐2.82, 4.82] |
| 10.5 Intermittent portal triad clamping vs continuous selective portal triad clamping | 1 | 80 | Mean Difference (IV, Fixed, 95% CI) | ‐0.27 [‐1.60, 1.06] |
| 10.6 Intermittent selective portal triad clamping vs intermittent portal triad clamping | 2 | 138 | Mean Difference (IV, Fixed, 95% CI) | ‐0.67 [‐2.40, 1.06] |
| 11 ITU stay Show forest plot | 1 | Mean Difference (IV, Fixed, 95% CI) | Totals not selected | |
| 11.1 Continuous selective hepatic vascular exclusion vs continuous portal triad clamping | 1 | Mean Difference (IV, Fixed, 95% CI) | 0.0 [0.0, 0.0] | |
| 12 Operating time Show forest plot | 12 | Mean Difference (IV, Random, 95% CI) | Subtotals only | |
| 12.1 Continuous portal triad clamping vs control | 2 | 40 | Mean Difference (IV, Random, 95% CI) | ‐45.87 [‐95.61, 3.87] |
| 12.2 Intermittent portal triad clamping vs control | 2 | 176 | Mean Difference (IV, Random, 95% CI) | 25.66 [‐31.57, 82.89] |
| 12.3 Continuous portal triad clamping vs continuous hepatic vascular exclusion | 2 | 170 | Mean Difference (IV, Random, 95% CI) | ‐29.32 [‐82.75, 24.10] |
| 12.4 Continuous selective hepatic vascular exclusion vs continuous portal triad clamping | 1 | 160 | Mean Difference (IV, Random, 95% CI) | ‐7.20 [‐63.42, 49.02] |
| 12.5 Continuous selective portal triad clamping vs continuous portal triad clamping | 1 | 120 | Mean Difference (IV, Random, 95% CI) | 20.0 [‐0.00, 40.00] |
| 12.6 Intermittent portal triad clamping vs continuous portal triad clamping | 1 | 35 | Mean Difference (IV, Random, 95% CI) | 13.40 [‐41.28, 68.08] |
| 12.7 Intermittent portal triad clamping vs continuous selective portal triad clamping | 1 | 80 | Mean Difference (IV, Random, 95% CI) | ‐32.17 [‐51.50, ‐12.84] |
| 12.8 Intermittent selective portal triad clamping vs intermittent portal triad clamping | 2 | 138 | Mean Difference (IV, Random, 95% CI) | 8.64 [‐10.16, 27.45] |
| Outcome or subgroup title | No. of studies | No. of participants | Statistical method | Effect size |
| 1 Mortality (perioperative) Show forest plot | 2 | Odds Ratio (M‐H, Fixed, 95% CI) | Subtotals only | |
| 1.1 Recombinant factor VIIa vs control | 1 | 185 | Odds Ratio (M‐H, Fixed, 95% CI) | 0.61 [0.13, 2.83] |
| 1.2 Tranexamic acid vs control | 1 | 214 | Odds Ratio (M‐H, Fixed, 95% CI) | 0.0 [0.0, 0.0] |
| 2 Serious adverse events (proportion) Show forest plot | 3 | Odds Ratio (M‐H, Fixed, 95% CI) | Subtotals only | |
| 2.1 Anti‐thrombin III vs control | 1 | 24 | Odds Ratio (M‐H, Fixed, 95% CI) | 1.19 [0.20, 6.99] |
| 2.2 Recombinant factor VIIa vs control | 2 | 432 | Odds Ratio (M‐H, Fixed, 95% CI) | 1.10 [0.58, 2.09] |
| 3 Serious adverse events (number) Show forest plot | 3 | Rate Ratio (Fixed, 95% CI) | Subtotals only | |
| 3.1 Recombinant factor VIIa vs control | 2 | 432 | Rate Ratio (Fixed, 95% CI) | 1.46 [0.75, 2.84] |
| 3.2 Tranexamic acid vs control | 1 | 214 | Rate Ratio (Fixed, 95% CI) | 0.86 [0.31, 2.37] |
| 4 Adverse events (proportion) Show forest plot | 3 | Odds Ratio (M‐H, Fixed, 95% CI) | Subtotals only | |
| 4.1 Anti‐thrombin III vs control | 1 | 24 | Odds Ratio (M‐H, Fixed, 95% CI) | 0.53 [0.10, 2.84] |
| 4.2 Recombinant factor VIIa vs control | 1 | 232 | Odds Ratio (M‐H, Fixed, 95% CI) | 1.04 [0.34, 3.21] |
| 4.3 Tranexamic acid vs control | 1 | 214 | Odds Ratio (M‐H, Fixed, 95% CI) | 0.78 [0.36, 1.67] |
| 5 Adverse events (number) Show forest plot | 3 | Rate Ratio (Fixed, 95% CI) | Subtotals only | |
| 5.1 Recombinant factor VIIa vs control | 2 | 432 | Rate Ratio (Fixed, 95% CI) | 0.98 [0.87, 1.10] |
| 5.2 Tranexamic acid vs control | 1 | 214 | Rate Ratio (Fixed, 95% CI) | 0.78 [0.43, 1.42] |
| 6 Blood transfusion (proportion) Show forest plot | 5 | Odds Ratio (M‐H, Fixed, 95% CI) | Subtotals only | |
| 6.1 Aprotinin vs control | 1 | 97 | Odds Ratio (M‐H, Fixed, 95% CI) | 0.32 [0.12, 0.82] |
| 6.2 Desmopressin vs control | 1 | 60 | Odds Ratio (M‐H, Fixed, 95% CI) | 0.56 [0.12, 2.57] |
| 6.3 Recombinant factor VIIa vs control | 2 | 416 | Odds Ratio (M‐H, Fixed, 95% CI) | 0.94 [0.62, 1.43] |
| 6.4 Tranexamic acid vs control | 1 | 214 | Odds Ratio (M‐H, Fixed, 95% CI) | 0.02 [0.00, 0.40] |
| 7 Blood transfusion (fresh frozen plasma) Show forest plot | 1 | Mean Difference (IV, Fixed, 95% CI) | Subtotals only | |
| 7.1 Desmopressin vs control | 1 | 60 | Mean Difference (IV, Fixed, 95% CI) | ‐0.60 [‐1.39, 0.19] |
| 8 Blood loss Show forest plot | 1 | Mean Difference (IV, Fixed, 95% CI) | Subtotals only | |
| 8.1 Aprotinin vs control | 1 | 97 | Mean Difference (IV, Fixed, 95% CI) | ‐0.44 [‐0.87, 0.00] |
| 9 Hospital stay Show forest plot | 1 | Mean Difference (IV, Fixed, 95% CI) | Subtotals only | |
| 9.1 Tranexamic acid vs control | 1 | 214 | Mean Difference (IV, Fixed, 95% CI) | ‐1.0 [‐3.06, 1.06] |
| 10 Operating time Show forest plot | 1 | Mean Difference (IV, Fixed, 95% CI) | Subtotals only | |
| 10.1 Aprotinin vs control | 1 | 97 | Mean Difference (IV, Fixed, 95% CI) | ‐1.0 [‐30.08, 28.08] |