Antidepresivos para pacientes con epilepsia y depresión
Referencias
References to studies included in this review
References to studies excluded from this review
References to studies awaiting assessment
Additional references
Characteristics of studies
Characteristics of included studies [ordered by study ID]
| Methods | A single‐centre, non‐randomised, uncontrolled, prospective before and after study (Prague) | |
| Participants | 43 people with focal epilepsy exceeding 15 points on the HAMD‐21 scale for depression | |
| Interventions | Citalopram at a flexible dose; the average dose was 19.3 mg +/‐ 2.6 mg at the end of the first month, 22.62 mg +/‐ 8.3 mg at the end of the second month | |
| Outcomes | 1) Seizure frequency 2) Depressive symptoms measured by the HAMD‐21 3) Adverse effects | |
| Notes | No drop‐outs and no exclusions from the analysis | |
| Risk of bias | ||
| Bias | Authors' judgement | Support for judgement |
| Random sequence generation (selection bias) | High risk | No randomisation methods used |
| Allocation concealment (selection bias) | High risk | No methods for concealing allocation used |
| Blinding of participants and personnel (performance bias) | High risk | No methods of blinding used. Rated 5 on scale for risk of bias |
| Blinding of outcome assessment (detection bias) | High risk | Outcome assessor not blinded. Rated 5 on scale for risk of bias |
| Incomplete outcome data (attrition bias) | Low risk | No missing data. Rated 1 on scale for risk of bias |
| Selective reporting (reporting bias) | Low risk | Outcomes stated in methods section of report are present in the results. No protocol available. Rated 2 on scale for risk of bias |
| Other bias | Low risk | No other risk of bias detected. Rated 1 on scale for risk of bias |
| Confounding variables | High risk | No confounding variables considered or adjusted for. Rated 5 on scale for risk of bias |
| Methods | A single‐centre, non‐randomised, uncontrolled, prospective before and after study (US) Baseline period: Not reported Treatment period: Mean 10.3 months (0.2‐38 months) | |
| Participants | 100 people with focal epilepsy, with depressive or obsessive compulsive disorder | |
| Interventions | Sertraline, mean dose of 108 mg +/‐ 56.9 mg per day | |
| Outcomes | 1) Improvement in depressive symptoms 2) Seizure frequency 3) Adverse effects | |
| Notes | 18 people withdrew due to adverse effects; all included in analysis | |
| Risk of bias | ||
| Bias | Authors' judgement | Support for judgement |
| Random sequence generation (selection bias) | High risk | No randomisation methods used |
| Allocation concealment (selection bias) | High risk | No methods for concealing allocation used |
| Blinding of participants and personnel (performance bias) | High risk | No methods of blinding used. Rated 5 on scale for risk of bias |
| Blinding of outcome assessment (detection bias) | High risk | Outcome assessor not blinded. Rated 5 on scale for risk of bias |
| Incomplete outcome data (attrition bias) | Low risk | No missing data and intention‐to‐treat analysis carried out. Rated 1 on scale for risk of bias |
| Selective reporting (reporting bias) | Low risk | Outcomes stated in methods section of report are present in the results. No protocol available. Rated 2 on scale for risk of bias |
| Other bias | High risk | Measure of depression not an accurate or reliable measure. Rated 4 on scale of risk of bias |
| Confounding variables | High risk | No confounding variables considered or adjusted for. Rated 5 on scale for risk of bias |
| Methods | A single‐centre, non‐randomised, prospective study (Germany) | |
| Participants | 75 people with temporal lobe epilepsy exceeding 15 points on the HAMD‐21 scale for depression | |
| Interventions | Citalopram (n = 33), dose at endpoint: 24.2 mg Mirtazapine (n = 27), dose at endpoint: 32.2 mg Reboxetine (n = 15), dose at endpoint: 6.9 mg | |
| Outcomes | 1) Improvement in depressive symptoms 2) Seizure frequency and severity 3) Adverse effects | |
| Notes | Large amount of withdrawals from week 4 to weeks 20 to 30. Last observation carried forward approach used | |
| Risk of bias | ||
| Bias | Authors' judgement | Support for judgement |
| Random sequence generation (selection bias) | High risk | No randomisation methods used |
| Allocation concealment (selection bias) | High risk | No methods for concealing allocation used |
| Blinding of participants and personnel (performance bias) | Unclear risk | Some study personnel blinded; participants not blinded. Rated 3 on scale for risk of bias |
| Blinding of outcome assessment (detection bias) | Unclear risk | Unclear whether outcome assessor blinded. Rated 3 on scale for risk of bias |
| Incomplete outcome data (attrition bias) | Unclear risk | Missing data detected; last observation carried forward approach employed. Rated 3 on scale for risk of bias |
| Selective reporting (reporting bias) | Low risk | Outcomes stated in methods section of report are present in the results. No protocol available. Rated 2 on scale for risk of bias |
| Other bias | Low risk | No other risk of bias detected. Rated 1 on scale for risk of bias |
| Confounding variables | High risk | No confounding variables considered or adjusted for. Rated 5 on scale for risk of bias |
| Methods | A single‐centre, randomised controlled trial (China) | |
| Participants | 67 patients with epilepsy and depression (meeting CCMD‐3 criteria for depression and HAMD‐21 score >18) | |
| Interventions | Paroxetine (n = 33): 17 males, 16 females aged 14 to 62 years 10 mg to 40 mg/day Doxepin (n = 34): 15 males, 19 females, aged 16 to 59 years, dose 25 mg/day titrated up according to response (mean dose 100 mg) | |
| Outcomes | 1) Change in depression scores (HAMD‐21) from baseline 2) Adverse events | |
| Notes | 3 patients discontinued study in doxepin arm because of adverse events, with 31 patients analysed for this treatment arm | |
| Risk of bias | ||
| Bias | Authors' judgement | Support for judgement |
| Random sequence generation (selection bias) | Low risk | Randomisation carried out by flipping of a coin |
| Allocation concealment (selection bias) | Unclear risk | No details available regarding methods of allocation concealment |
| Blinding of participants and personnel (performance bias) | Low risk | Patients blinded |
| Blinding of outcome assessment (detection bias) | Low risk | Outcome assessor blinded |
| Incomplete outcome data (attrition bias) | Unclear risk | Missing data reported, ITT not employed |
| Selective reporting (reporting bias) | High risk | Adverse events not reported in results. Rated as letter E in ORBIT tool. |
| Other bias | Unclear risk | Insufficient details in report to judge the influence of other bias |
| Confounding variables | Low risk | NA |
| Methods | A single‐centre, randomised, double‐blind, controlled trial (UK) | |
| Participants | 42 people with epilepsy exceeding 15 points on the HAMD‐21 scale for depression | |
| Interventions | Amitriptyline (n = 14) 25mg TDS Nomifensine (n = 14) 25mg TDS Placebo (n = 14) | |
| Outcomes | 1) Improvement in depressive symptoms 2) Seizure frequency 3) Adverse effects | |
| Notes | 39 people included in the analysis. At 6 weeks non‐responders in the active drug arms had dose doubled and those in the placebo arm were withdrawn from the study | |
| Risk of bias | ||
| Bias | Authors' judgement | Support for judgement |
| Random sequence generation (selection bias) | Low risk | Random number codes employed, however generation of this randomisation sequence is unclear |
| Allocation concealment (selection bias) | Low risk | Pharmacy‐controlled allocation |
| Blinding of participants and personnel (performance bias) | Low risk | Study personnel and participants blinded |
| Blinding of outcome assessment (detection bias) | Low risk | Outcome assessor blinded |
| Incomplete outcome data (attrition bias) | Unclear risk | Missing data detected and attrition reported |
| Selective reporting (reporting bias) | Low risk | Outcomes stated in methods section of report are present in the results. No protocol available |
| Other bias | Unclear risk | After 6 weeks, placebo group removed from trial; only active antidepressant treatment groups continued in the trial |
| Confounding variables | Low risk | NA |
| Methods | A multi‐centre, non‐randomised, uncontrolled, prospective before and after study (Italy) Treatment period: 4 months | |
| Participants | 45 people with focal epilepsy and exceeding or equal to 20 on the MADRS | |
| Interventions | Citalopram 20 mg per day | |
| Outcomes | 1) Seizure frequency 2) Improvement in depression measured by MADRS and Zung‐SDS 3) Adverse effects | |
| Notes | 39 people received intended treatment and analysed | |
| Risk of bias | ||
| Bias | Authors' judgement | Support for judgement |
| Random sequence generation (selection bias) | High risk | No randomisation methods used |
| Allocation concealment (selection bias) | High risk | No methods for concealing allocation used |
| Blinding of participants and personnel (performance bias) | Unclear risk | No details given regarding methods of blinding. Rated 3 on scale for risk of bias |
| Blinding of outcome assessment (detection bias) | Unclear risk | No details given regarding methods of blinding. Rated 3 on scale for risk of bias |
| Incomplete outcome data (attrition bias) | Low risk | Small amount of missing data reported. Intention‐to treat‐analysis not employed. Rated 2 on scale for risk of bias |
| Selective reporting (reporting bias) | Low risk | Outcomes stated in methods section of report are present in the results. No protocol available. Rated 2 on scale for risk of bias |
| Other bias | Low risk | No other risk of bias detected. Rated 1 on scale for risk of bias |
| Confounding variables | High risk | No confounding variables considered or adjusted for. Rated 5 on scale for risk of bias |
| Methods | A single‐centre, non‐randomised, uncontrolled, prospective before and after study (Brazil) Baseline period: Not reported Treatment period: Mean 25.8 months (range 12‐78) | |
| Participants | 36 children and adolescents with focal epilepsy and diagnosis of depression | |
| Interventions | Sertraline up to 200 mg per day, mean dose 111.5 mg per day (50 to 200 mg) Fluoxetine up to 80 mg per day, mean dose 45.7 mg per day (20 to 80 mg) | |
| Outcomes | 1) Seizure severity 2) Improvement in depressive symptoms 3) Adverse effects | |
| Notes | No drop‐outs | |
| Risk of bias | ||
| Bias | Authors' judgement | Support for judgement |
| Random sequence generation (selection bias) | High risk | No randomisation methods used |
| Allocation concealment (selection bias) | High risk | No methods for concealing allocation used |
| Blinding of participants and personnel (performance bias) | High risk | Participants not blinded; unclear about other study personnel. Rated 4 on scale for risk of bias |
| Blinding of outcome assessment (detection bias) | Unclear risk | Unclear whether outcome assessors blinded |
| Incomplete outcome data (attrition bias) | Low risk | No missing data |
| Selective reporting (reporting bias) | Low risk | Outcomes stated in methods section of report are present in the results. No protocol available. Rated 2 on scale for risk of bias |
| Other bias | Low risk | No other risk of bias detected. Rated 1 on scale for risk of bias |
| Confounding variables | High risk | Some confounding variables considered but not adjusted for in the analysis. Rated 4 on scale for risk of bias |
| Methods | Single‐centre, randomised trial of venlafaxine versus no treatment (China) Treatment period: 8 weeks | |
| Participants | 64 people with epilepsy (presumed genetic or cause unknown) and depression | |
| Interventions | Venlafaxine 25 mg to 75 mg/day (n = 32) No treatment (n = 32) | |
| Outcomes | 1) Change in HAMD‐21 scores 2) Adverse events | |
| Notes | No drop‐outs | |
| Risk of bias | ||
| Bias | Authors' judgement | Support for judgement |
| Random sequence generation (selection bias) | Unclear risk | Methods for generation of random sequence are not detailed in the report |
| Allocation concealment (selection bias) | Unclear risk | Methods for allocation are not detailed in the report |
| Blinding of participants and personnel (performance bias) | Unclear risk | No details of blinding methods in the report |
| Blinding of outcome assessment (detection bias) | Unclear risk | Unclear whether outcome assessor blinded |
| Incomplete outcome data (attrition bias) | Low risk | No missing data |
| Selective reporting (reporting bias) | Low risk | Outcomes stated in methods section of report are present in the results. No protocol available |
| Other bias | Unclear risk | Insufficient details in report to judge the influence of other bias |
| Confounding variables | Low risk | NA |
CCMD‐3: Chinese Classification of Mental Disorders
HAMD: Hamilton Rating Scale for Depression
ITT: Intention‐To‐Treat
MADRS: Montgomery–Åsberg Depression Rating Scale
NA: Not Applicable
Characteristics of excluded studies [ordered by study ID]
| Study | Reason for exclusion |
| Case series study not meeting the inclusion criteria | |
| Trial listed on www.clinicaltrials.gov and recorded as terminated | |
| Trial listed on www.clinicaltrials.gov and recorded as terminated |
Characteristics of studies awaiting assessment [ordered by study ID]
| Methods | A double‐blind, placebo‐controlled, randomised trial |
| Participants | Adults with temporal lobe epilepsy and meeting DSM‐IV criteria for depression with a MADRS score greater than or equal to 15 |
| Interventions | Escitalopram versus placebo |
| Outcomes | 1) Change in depressive and anxiety symptoms 2) Seizure frequency 3) Quality of life |
| Notes | Trial listed on www.clinicaltrials.gov and recorded as complete. We attempted to contact the lead trialist but received no response |
| Methods | Prospective cohort study |
| Participants | 35 patients with epilepsy and depression |
| Interventions | Fluvoxamine 50 to 200 mg (mean 125 mg) |
| Outcomes | Seizure frequency |
| Notes | No available contact details for study authors |
| Methods | Prospective cohort study |
| Participants | 42 patients with epilepsy and depression |
| Interventions | Sertraline 50 to 100 mg/day |
| Outcomes | Cholesterol levels in responders versus non‐responders |
| Notes | Authors contacted for further data on depression scores and seizure frequency. No response |
DSM‐IV: Diagnostic and Statistical Manual of Mental Disorders IV
MADRS: Montgomery–Åsberg Depression Rating Scale
Data and analyses
| Outcome or subgroup title | No. of studies | No. of participants | Statistical method | Effect size |
| 1 > 50% reduction in depressive symptoms Show forest plot | 1 | 67 | Risk Ratio (M‐H, Fixed, 95% CI) | 1.16 [0.88, 1.52] |
| Analysis 1.1  Comparison 1 Paroxetine versus doxepin, Outcome 1 > 50% reduction in depressive symptoms. | ||||
| 2 Mean depression scores Show forest plot | 1 | Mean Difference (IV, Fixed, 95% CI) | Subtotals only | |
| Analysis 1.2  Comparison 1 Paroxetine versus doxepin, Outcome 2 Mean depression scores. | ||||
| 2.1 HAMD scores | 1 | 67 | Mean Difference (IV, Fixed, 95% CI) | 0.65 [‐2.15, 3.45] |
| 3 Withdrawals (any reason) Show forest plot | 1 | 67 | Risk Ratio (M‐H, Fixed, 95% CI) | 0.15 [0.01, 2.74] |
| Analysis 1.3  Comparison 1 Paroxetine versus doxepin, Outcome 3 Withdrawals (any reason). | ||||
| 4 Adverse effects Show forest plot | 1 | Risk Ratio (M‐H, Fixed, 99% CI) | Subtotals only | |
| Analysis 1.4  Comparison 1 Paroxetine versus doxepin, Outcome 4 Adverse effects. | ||||
| 4.1 Blurred vision | 1 | 67 | Risk Ratio (M‐H, Fixed, 99% CI) | 0.34 [0.09, 1.32] |
| 4.2 Dizziness | 1 | 67 | Risk Ratio (M‐H, Fixed, 99% CI) | 0.21 [0.03, 1.37] |
| 4.3 Dry mouth | 1 | 67 | Risk Ratio (M‐H, Fixed, 99% CI) | 0.26 [0.06, 1.20] |
| 4.4 Sleep disorders | 1 | 67 | Risk Ratio (M‐H, Fixed, 99% CI) | 0.32 [0.08, 1.20] |
| 4.5 Urinary retention | 1 | 67 | Risk Ratio (M‐H, Fixed, 99% CI) | 0.34 [0.01, 21.99] |
| Outcome or subgroup title | No. of studies | No. of participants | Statistical method | Effect size |
| 1 > 50% reduction in depressive symptoms Show forest plot | 1 | 28 | Risk Ratio (M‐H, Fixed, 95% CI) | 0.55 [0.28, 1.06] |
| Analysis 2.1  Comparison 2 Amitriptyline versus nomifensine, Outcome 1 > 50% reduction in depressive symptoms. | ||||
| Outcome or subgroup title | No. of studies | No. of participants | Statistical method | Effect size |
| 1 > 50% reduction in depressive symptoms Show forest plot | 1 | 64 | Risk Ratio (M‐H, Fixed, 95% CI) | 3.25 [1.19, 8.90] |
| Analysis 3.1  Comparison 3 Venlafaxine versus no treatment controls, Outcome 1 > 50% reduction in depressive symptoms. | ||||
| 2 Mean depression scores ‐ HAMD Show forest plot | 1 | 64 | Mean Difference (IV, Fixed, 95% CI) | ‐7.59 [‐11.52, ‐3.66] |
| Analysis 3.2  Comparison 3 Venlafaxine versus no treatment controls, Outcome 2 Mean depression scores ‐ HAMD. | ||||
| Outcome or subgroup title | No. of studies | No. of participants | Statistical method | Effect size |
| 1 Mean depression scores HAMD‐21 Show forest plot | 2 | 176 | Std. Mean Difference (Fixed, 95% CI) | 1.17 [0.96, 1.38] |
| Analysis 4.1  Comparison 4 Citalopram (before and after), Outcome 1 Mean depression scores HAMD‐21. | ||||
| 2 Mean monthly seizure frequency Show forest plot | 2 | Std. Mean Difference (Fixed, 95% CI) | Totals not selected | |
| Analysis 4.2  Comparison 4 Citalopram (before and after), Outcome 2 Mean monthly seizure frequency. | ||||

Study flow diagram.

'Risk of bias' summary: review authors' judgements about each risk of bias item for each included study.
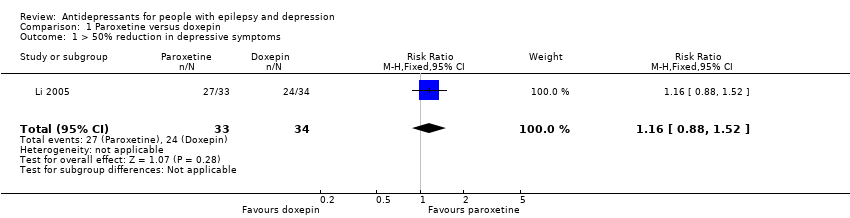
Comparison 1 Paroxetine versus doxepin, Outcome 1 > 50% reduction in depressive symptoms.
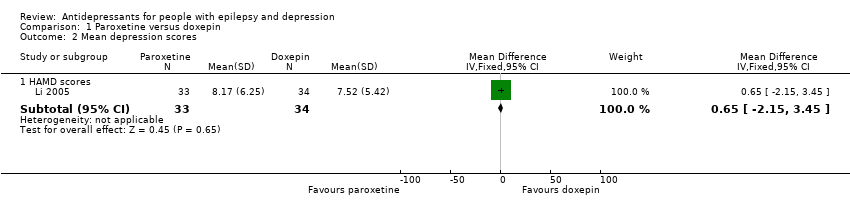
Comparison 1 Paroxetine versus doxepin, Outcome 2 Mean depression scores.
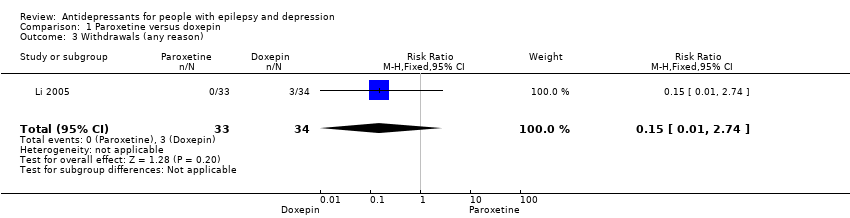
Comparison 1 Paroxetine versus doxepin, Outcome 3 Withdrawals (any reason).

Comparison 1 Paroxetine versus doxepin, Outcome 4 Adverse effects.
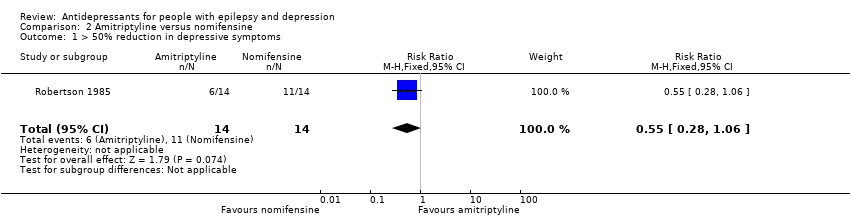
Comparison 2 Amitriptyline versus nomifensine, Outcome 1 > 50% reduction in depressive symptoms.
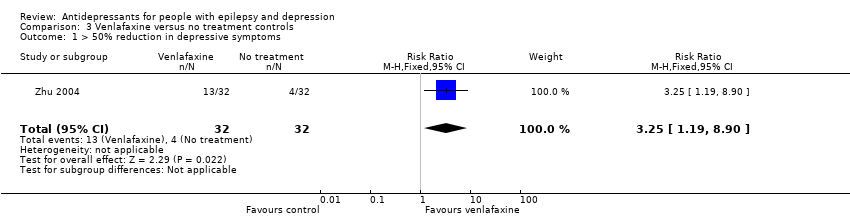
Comparison 3 Venlafaxine versus no treatment controls, Outcome 1 > 50% reduction in depressive symptoms.
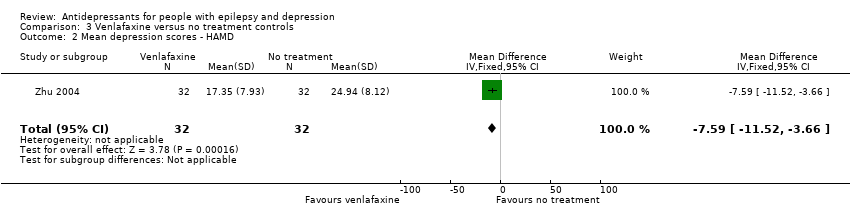
Comparison 3 Venlafaxine versus no treatment controls, Outcome 2 Mean depression scores ‐ HAMD.

Comparison 4 Citalopram (before and after), Outcome 1 Mean depression scores HAMD‐21.
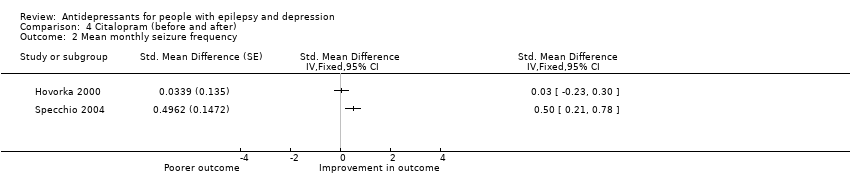
Comparison 4 Citalopram (before and after), Outcome 2 Mean monthly seizure frequency.
| Paroxetine compared to doxepin for people with epilepsy and depression | ||||||
| Patient or population: people with epilepsy and depression | ||||||
| Outcomes | Illustrative comparative risks* (95% CI) | Relative effect | No of participants | Quality of the evidence | Comments | |
| Assumed risk | Corresponding risk | |||||
| Doxepin | Paroxetine | |||||
| > 50% reduction in depressive symptoms | 706 per 1000 | 819 per 1000 | RR 1.16 | 67 | ⊕⊕⊕⊝1 | Only 1 study examined the influence of paroxetine versus doxepin on reduction in depression and it found no significant difference between the 2 drugs |
| Mean depression scores ‐ HAMD scores | The mean HAMD depression score in the intervention groups was | 67 | ⊕⊕⊕⊝1 | In the same study no differences were found between mean depression scores in patients taking paroxetine compared to those taking doxepin | ||
| Seizure frequency | ‐ | ‐ | ‐ | 0 (0 studies) | ‐ | No data contributed to this outcome |
| Withdrawals (specific reasons) | 88 per 1000 | 13 per 1000 | RR 0.15 | 67 | ⊕⊕⊕⊝1 | In this study 0 patients withdrew from the paroxetine group and 3 withdrew from the doxepin group. No significant difference was found between the 2 groups |
| Cognitive functioning | ‐ | ‐ | ‐ | 0 (0 studies) | ‐ | No data contributed to this outcome |
| Quality of life | ‐ | ‐ | ‐ | 0 (0 studies) | ‐ | No data contributed to this outcome |
| Adverse effects | ‐ | ‐ | ‐ | 0 (0 studies) | ‐ | No data contributed to this outcome |
| *The basis for the assumed risk (e.g. the median control group risk across studies) is provided in footnotes. The corresponding risk (and its 95% confidence interval) is based on the assumed risk in the comparison group and the relative effect of the intervention (and its 95% CI). | ||||||
| GRADE Working Group grades of evidence | ||||||
| 1Quality downgraded for imprecision due to only one study contributing to the outcomes and it was a small study. | ||||||
| Amitriptyline compared to nomifensine for people with epilepsy and depression | ||||||
| Patient or population: people with epilepsy and depression | ||||||
| Outcomes | Illustrative comparative risks* (95% CI) | Relative effect | No of participants | Quality of the evidence | Comments | |
| Assumed risk | Corresponding risk | |||||
| Nomifensine | Amitriptyline | |||||
| > 50% reduction in depressive symptoms | 786 per 1000 | 432 per 1000 | RR 0.55 | 28 | ⊕⊕⊕⊝1 | 1 study compared amitriptyline and nomifensine in reducing seizures and there was no significant difference found between the 2 groups |
| Seizure frequency | ‐ | ‐ | ‐ | 0 (0 studies) | ‐ | No data contributed to this outcome |
| Withdrawals | ‐ | ‐ | ‐ | 0 | ‐ | No data contributed to this outcome |
| Cognitive functioning | ‐ | ‐ | ‐ | 0 (0 studies) | ‐ | No data contributed to this outcome |
| Quality of life | ‐ | ‐ | ‐ | 0 (0 studies) | ‐ | No data contributed to this outcome |
| Adverse effects | ‐ | ‐ | ‐ | 0 (0 studies) | ‐ | No data contributed to this outcome |
| *The basis for the assumed risk (e.g. the median control group risk across studies) is provided in footnotes. The corresponding risk (and its 95% confidence interval) is based on the assumed risk in the comparison group and the relative effect of the intervention (and its 95% CI). | ||||||
| GRADE Working Group grades of evidence | ||||||
| 1Quality downgraded for imprecision due to only one study contributing to the outcomes and it was a small study. | ||||||
| Venlafaxine compared to no treatment for people with epilepsy and depression | ||||||
| Patient or population: people with epilepsy and depression | ||||||
| Outcomes | Illustrative comparative risks* (95% CI) | Relative effect | No of participants | Quality of the evidence | Comments | |
| Assumed risk | Corresponding risk | |||||
| No treatment | Venlafaxine | |||||
| > 50% reduction in depressive symptoms | 125 per 1000 | 406 per 1000 | RR 3.25 | 64 | ⊕⊕⊕⊝1 moderate | 1 study compared venlafaxine to a no treatment control group and found that venlafaxine was more than 3 times more effective in reducing seizures compared to controls |
| Mean depression scores ‐ HAMD | The mean HAMD depression score in the intervention groups was | 64 | ⊕⊕⊕⊝1 | The same study found mean depression scores to be significantly lower in the venlafaxine group compared to the control group | ||
| Seizure frequency | ‐ | ‐ | ‐ | 0 (0 studies) | ‐ | No data contributed to this outcome |
| Withdrawals | ‐ | ‐ | ‐ | 0 | ‐ | No data contributed to this outcome |
| Cognitive functioning | ‐ | ‐ | ‐ | 0 (0 studies) | ‐ | No data contributed to this outcome |
| Quality of life | ‐ | ‐ | ‐ | 0 (0 studies) | ‐ | No data contributed to this outcome |
| Adverse effects | ‐ | ‐ | ‐ | 0 (0 studies) | ‐ | No data contributed to this outcome |
| *The basis for the assumed risk (e.g. the median control group risk across studies) is provided in footnotes. The corresponding risk (and its 95% confidence interval) is based on the assumed risk in the comparison group and the relative effect of the intervention (and its 95% CI). | ||||||
| GRADE Working Group grades of evidence | ||||||
| 1Quality downgraded for imprecision due to only one study contributing to the outcomes and it was a small study. | ||||||
| Citalopram (before and after) for people with epilepsy and depression | ||||
| Patient or population: people with epilepsy and depression | ||||
| Outcomes | Illustrative comparative risks* (95% CI) | No of participants | Quality of the evidence | Comments |
| Corresponding risk | ||||
| Citalopram (before and after) | ||||
| Mean depression scores ‐ HAMD | The mean HAMD depression score in the intervention groups was | 88 | ⊕⊕⊝⊝ | 2 before and after studies investigated citalopram and found that depression scores were significantly lower after treatment |
| Mean monthly seizure frequency | 88 | ⊕⊝⊝⊝ | 2 studies found mixed evidence for the effect of citalopram on seizure frequency. Due to high heterogeneity the overall effect estimate is not presented | |
| *The basis for the assumed risk (e.g. the median control group risk across studies) is provided in footnotes. The corresponding risk (and its 95% confidence interval) is based on the assumed risk in the comparison group and the relative effect of the intervention (and its 95% CI). | ||||
| GRADE Working Group grades of evidence | ||||
| 1Across the studies there were concerns about bias with regards to the methods of blinding and methods to deal with confounding variables. | ||||
| 1 Low risk | 2 | 3 | 4 | 5 High risk | |
| Confounding | All important1 confounders considered2 and suitable method of adjustment3 employed. Outcome unlikely to be affected | Most important4 confounders considered and suitable method of adjustment employed. Outcome unlikely to be affected | Some confounders5 considered and full or partial adjustment employed6. Possible implication for outcome | Some confounders considered and no adjustment employed. Likely to affect outcome | No important confounders considered and no adjustment employed. Likely to affect outcome |
| Blinding | Assessors blinded to participant's drug regime and participants blinded to drug regime. Outcome unlikely to be affected | Assessors blinded to participant's drug regime. Outcome unlikely to be affected | Partial blinding7 involved in study. Possible implication for outcome | Partial or no blinding involved in study. Outcome likely to be affected | No blinding involved in study. Outcome likely to be affected |
| Incomplete outcome data | No missing data and/or appropriate analysis8 used to deal with missing data. Unlikely to affect outcome | Smaller amount (< 25%) of missing data with reasons given, balanced across groups. Unlikely to affect outcome | Larger amount of missing data (> 25%) with or without reasons given, balanced across groups. Possible implication for outcome | Larger amount (> 25%) of missing data, imbalance across groups. Outcome likely to be affected | No information provided regarding missing data. Likely to affect outcome |
| Selective outcome reporting | A priori outcomes measured, analysed and reported in main report. Protocol available. Unlikely to affect outcome | A priori outcomes measured, analysed and reported in main report9. Protocol not available. Unlikely to affect outcomes | Limited information regarding a priori outcomes and measures. Possible implication for outcome | Outcomes measured but not analysed or reported | Outcomes measured but not analysed or reported and clinical judgement infers the presence of an unreported measured outcome10 |
| Other bias | No bias identified | Bias identified. Unlikely to affect outcome | Bias identified. Possible implication for outcome | Bias identified. Likely to affect outcome | Bias identified. Extremely likely to affect outcome |
| 1Important confounders include:
2Reported demographic information and other confounders. 3Matching scores, multiple regression, analysis of co‐variance, stratification. 4At least four out of six of important confounders including: mean baseline depression score and mean baseline seizure frequency. 5At least two out of six of the important confounders. 6Full adjustment of confounding variables, e.g. see footnote 2, or partial adjustment, e.g. researchers select limited number of variables to adjust for. 7Assessors of outcome are only blinded to certain groups, e.g. blinded to intervention group but not controls. 8Intention‐to‐treat analysis. 9An a priori statement is made in the methods section of the main report regarding measurement and analysis of outcome. 10For example, failure to report full‐scale depression score when all other indices are reported. | |||||
| Outcome or subgroup title | No. of studies | No. of participants | Statistical method | Effect size |
| 1 > 50% reduction in depressive symptoms Show forest plot | 1 | 67 | Risk Ratio (M‐H, Fixed, 95% CI) | 1.16 [0.88, 1.52] |
| 2 Mean depression scores Show forest plot | 1 | Mean Difference (IV, Fixed, 95% CI) | Subtotals only | |
| 2.1 HAMD scores | 1 | 67 | Mean Difference (IV, Fixed, 95% CI) | 0.65 [‐2.15, 3.45] |
| 3 Withdrawals (any reason) Show forest plot | 1 | 67 | Risk Ratio (M‐H, Fixed, 95% CI) | 0.15 [0.01, 2.74] |
| 4 Adverse effects Show forest plot | 1 | Risk Ratio (M‐H, Fixed, 99% CI) | Subtotals only | |
| 4.1 Blurred vision | 1 | 67 | Risk Ratio (M‐H, Fixed, 99% CI) | 0.34 [0.09, 1.32] |
| 4.2 Dizziness | 1 | 67 | Risk Ratio (M‐H, Fixed, 99% CI) | 0.21 [0.03, 1.37] |
| 4.3 Dry mouth | 1 | 67 | Risk Ratio (M‐H, Fixed, 99% CI) | 0.26 [0.06, 1.20] |
| 4.4 Sleep disorders | 1 | 67 | Risk Ratio (M‐H, Fixed, 99% CI) | 0.32 [0.08, 1.20] |
| 4.5 Urinary retention | 1 | 67 | Risk Ratio (M‐H, Fixed, 99% CI) | 0.34 [0.01, 21.99] |
| Outcome or subgroup title | No. of studies | No. of participants | Statistical method | Effect size |
| 1 > 50% reduction in depressive symptoms Show forest plot | 1 | 28 | Risk Ratio (M‐H, Fixed, 95% CI) | 0.55 [0.28, 1.06] |
| Outcome or subgroup title | No. of studies | No. of participants | Statistical method | Effect size |
| 1 > 50% reduction in depressive symptoms Show forest plot | 1 | 64 | Risk Ratio (M‐H, Fixed, 95% CI) | 3.25 [1.19, 8.90] |
| 2 Mean depression scores ‐ HAMD Show forest plot | 1 | 64 | Mean Difference (IV, Fixed, 95% CI) | ‐7.59 [‐11.52, ‐3.66] |
| Outcome or subgroup title | No. of studies | No. of participants | Statistical method | Effect size |
| 1 Mean depression scores HAMD‐21 Show forest plot | 2 | 176 | Std. Mean Difference (Fixed, 95% CI) | 1.17 [0.96, 1.38] |
| 2 Mean monthly seizure frequency Show forest plot | 2 | Std. Mean Difference (Fixed, 95% CI) | Totals not selected | |