Arteméter para el paludismo grave
Resumen
Antecedentes
En 2011, la Organización Mundial de la Salud (OMS) recomendó el artesunato parenteral en preferencia a la quinina como tratamiento de primera línea para los pacientes con paludismo grave. Antes de esta recomendación, muchos países, en particular en África, habían empezado a utilizar el arteméter, un derivado alternativo de la artemisinina. Esta revisión evalúa el arteméter intramuscular comparado con la quinina y con el artesunato.
Objetivos
Evaluar la eficacia y la seguridad del arteméter intramuscular versus cualquier otra medicación parenteral para tratar el paludismo grave en adultos y niños.
Métodos de búsqueda
Se hicieron búsquedas en el registro especializado del Grupo Cochrane de Enfermedades Infecciosas (Cochrane Infectious Diseases Group), CENTRAL (The Cochrane Library), MEDLINE, EMBASE y en LILACS, ISI Web of Science, actas de congresos y en listas de referencias de artículos. También se hicieron búsquedas de ensayos en curso en la WHO clinical trial registry platform, ClinicalTrials.gov y en el metaRegister of Controlled Trials (mRCT) hasta el 9 de abril de 2014.
Criterios de selección
Ensayos controlados aleatorios (ECA) que compararan arteméter intramuscular con un antipalúdico intravenoso o intramuscular para tratar el paludismo grave.
Obtención y análisis de los datos
El resultado primario fue la mortalidad por todas las causas. Dos autores de forma independiente evaluaron la elegibilidad de los ensayos, el riesgo de sesgo y extrajeron los datos. Los resultados dicotómicos se resumieron mediante los cocientes de riesgos (CR) y los resultados continuos mediante las diferencias de medias (DM), ambos con intervalos de confianza (IC) del 95%. Cuando fue apropiado, los datos se combinaron en metanálisis y la calidad de las pruebas se evaluó mediante el enfoque GRADE.
Resultados principales
Se incluyeron 18 ECA que reclutaron a 2662 adultos y niños con paludismo grave, realizados en África (11) y en Asia (siete).
Arteméter versus quinina
Para los niños en África, hay probablemente poca o ninguna diferencia en el riesgo de muerte entre el arteméter intramuscular y la quinina (CR 0,96; IC del 95%: 0,76 a 1,20; 12 ensayos, 1447 participantes, pruebas de calidad moderada). La recuperación del coma puede ser cerca de cinco horas más corta con arteméter (DM ‐5,45; IC del 95%: ‐7,90 a ‐3,00; seis ensayos, 358 participantes, pruebas de baja calidad) y el arteméter puede dar lugar a menos secuelas neurológicas, pero se necesitarían ensayos más grandes para confirmar este hallazgo (CR 0,84; IC del 95%: 0,66 a 1,07; siete ensayos, 968 participantes, pruebas de baja calidad). El arteméter probablemente acorta el tiempo de eliminación del parásito en cerca de nueve horas (DM ‐9,03; IC del 95%: ‐11,43 a ‐6,63; siete ensayos, 420 participantes, pruebas de calidad moderada) y puede acortar el tiempo de eliminación de la fiebre en cerca de tres horas (DM ‐3,73; IC del 95%: ‐6,55 a ‐0,92; ocho ensayos, 457 participantes, pruebas de baja calidad).
Para los adultos en Asia, el tratamiento con arteméter intramuscular probablemente da lugar a menos muertes que el tratamiento con quinina (CR 0,59; IC del 95%: 0,42 a 0,83; cuatro ensayos, 716 participantes, pruebas de calidad moderada).
Arteméter versus artesunato
El arteméter y el artesunato no se han comparado directamente en ensayos aleatorios en niños africanos.
Para los adultos en Asia, la mortalidad es probablemente mayor con arteméter intramuscular (CR 1,80; IC del 95%: 1,09 a 2,97; dos ensayos, 494 participantes, pruebas de calidad moderada).
Conclusiones de los autores
Aunque hay una falta de pruebas directas que comparen el arteméter con el artesunato, el arteméter es probablemente menos eficaz que el artesunato para evitar las muertes asociadas con el paludismo grave. En circunstancias en las que el artesunato no esté disponible, el arteméter es una alternativa a la quinina.
PICO
Resumen en términos sencillos
Inyección de arteméter para el tratamiento de los pacientes con paludismo grave
En esta revisión, los investigadores de la Colaboración Cochrane examinaron los efectos de tratar a los pacientes que tienen paludismo grave con arteméter inyectado intramuscularmente y lo compararon con el tratamiento con otros fármacos antipalúdicos administrados intramuscularmente o por vía intravenosa. Después de buscar ensayos relevantes hasta el 9 de abril de 2014, se incluyeron 18 ensayos controlados aleatorios que reclutaron a 2662 adultos y niños y se realizaron principalmente en África y Asia.
Qué es el paludismo grave y cómo podría la inyección de arteméter reducir las muertes
El paludismo grave es causado por la infección con el parásito Plasmodium, que se transmite a los pacientes a través de la picadura de un mosquito Anopheles hembra infectado. Es un trastorno médico grave y puede causar vómitos, anemia, convulsiones y muerte. Los pacientes deben ser tratados lo más rápido posible.
La Organización Mundial de la Salud (OMS) recomienda la inyección de artesunato para tratar a los adultos y niños que tienen paludismo grave, ya que los ensayos han mostrado que da lugar a menos muertes comparado con el tratamiento con quinina. El arteméter es un derivado alternativo de la artemisinina, pero solamente está disponible como una solución premezclada en base de aceite para la inyección intramuscular. Actualmente, el arteméter está ampliamente disponible y se utiliza en muchos países africanos, aunque no está recomendado específicamente por la OMS.
Lo que dice la investigación
Arteméter versus quinina:
Para los niños en África, el arteméter intramuscular es probablemente tan bueno como la quinina para evitar las muertes por paludismo grave (pruebas de calidad moderada). El arteméter puede acortar el tiempo de recuperación del coma en cerca de cinco horas (pruebas de baja calidad) y puede reducir el número de niños con signos de daño cerebral en el momento del alta hospitalaria (pruebas de baja calidad).
En los niños mayores (> 15 años) y los adultos en Asia, el tratamiento con arteméter probablemente da lugar a menos muertes que la quinina (pruebas de calidad moderada).
Arteméter versus artesunato:
En adultos en Asia, el artesunato probablemente evita más muertes que el arteméter (pruebas de calidad moderada), pero no se han realizado ensayos en niños pequeños de África.
Conclusiones de los autores
Aunque hay una falta de pruebas directas que comparen el arteméter con el artesunato, el arteméter es probablemente menos eficaz que el artesunato para evitar las muertes asociadas con el paludismo grave. En circunstancias en las que el artesunato no esté disponible, el arteméter es una alternativa a la quinina.
Authors' conclusions
Summary of findings
| Artemether compared with quinine for treating children with severe malaria | |||||
| Patient or population: Children with severe malaria | |||||
| Outcomes | Illustrative comparative risks* (95% CI) | Relative effect | No of participants | Quality of the evidence | |
| Assumed risk | Corresponding risk | ||||
| Quinine | Artemether | ||||
| Death | 170 per 1000 | 164 per 1000 | RR 0.96 | 1447 | ⊕⊕⊕⊝ |
| Coma resolution time | The mean coma resolution time ranged across control groups from | The mean coma resolution time in the intervention groups was | ‐ | 358 | ⊕⊕⊝⊝ |
| Neurological sequelae at discharge | 220 per 1000 | 185 per 1000 | RR 0.84 | 968 | ⊕⊕⊝⊝ |
| Parasite clearance time | The mean parasite clearance time ranged across control groups from | The mean parasite clearance time in the intervention groups was | ‐ | 420 | ⊕⊕⊕⊝ |
| Fever clearance time | The mean fever clearance time ranged across control groups from | The mean fever clearance time in the intervention groups was | ‐ | 457 | ⊕⊕⊝⊝ |
| *The assumed risk is the median control group risk across studies. The corresponding risk (and its 95% CI) is based on the assumed risk in the comparison group and the relative effect of the intervention (and its 95% CI). | |||||
| GRADE Working Group grades of evidence | |||||
| 1 No serious risk of bias: Trials were variable in their risk of bias, but exclusion of the trials at high or unclear risk of selection bias did not change this result. | |||||
| Artemether compared with quinine for treating adults with severe malaria | |||||
| Patient or population: Adults with severe malaria | |||||
| Outcomes | Illustrative comparative risks* (95% CI) | Relative effect | No of participants | Quality of the evidence | |
| Assumed risk | Corresponding risk | ||||
| Quinine | Artemether | ||||
| Death | 208 per 1000 | 123 per 1000 | RR 0.59 | 716 | ⊕⊕⊕⊝ |
| Coma resolution time | ‐ | ‐ | Not pooled. Little difference. | 657 | ⊕⊕⊝⊝ |
| Neurological sequelae at discharge | 4 per 1000 | 12 per 1000 (1 to 111) | RR 2.92 | 560 | ⊕⊕⊝⊝ |
| Parasite clearance time | ‐ | ‐ | Not pooled. Little difference apparent. | 716 | ⊕⊕⊕⊝ |
| Fever clearance time | ‐ | ‐ | Not pooled. Little difference apparent. | 716 | ⊕⊕⊝⊝ |
| *The assumed risk is the median control group risk across studies. The corresponding risk (and its 95% CI) is based on the assumed risk in the comparison group and the relative effect of the intervention (and its 95% CI). | |||||
| GRADE Working Group grades of evidence | |||||
| 1 No serious risk of bias: Trials are generally well conducted and at low risk of bias. 7 No serious risk of bias: This single trial was at low risk of bias. 8 Downgraded by 1 for serious imprecision: Neurological sequelae in adults were uncommon. This trial is underpowered to detect or exclude clinically important differences. | |||||
| Artemether compared with artesunate for treating adults with severe malaria | |||||
| Patient or population: Adults with severe malaria | |||||
| Outcomes | Illustrative comparative risks* (95% CI) | Relative effect | No of participants | Quality of the evidence | |
| Assumed risk | Corresponding risk | ||||
| Artesunate | Artemether | ||||
| Death | 87 per 1000 | 156 per 1000 | RR 1.80 | 494 | ⊕⊕⊕⊝ |
| Coma resolution time | ‐ | ‐ | Not pooled. No significant difference | 494 | ⊕⊕⊕⊝ |
| Neurological sequelae at discharge | ‐ | ‐ | ‐ | 0 | ‐ |
| Parasite clearance time | ‐ | ‐ | Not pooled. No significant difference | 494 | ⊕⊕⊕⊝ |
| Fever clearance time | ‐ | ‐ | Not pooled. No significant difference | 494 | ⊕⊕⊝⊝ |
| *The assumed risk is the median control group risk across studies. The corresponding risk (and its 95% CI) is based on the assumed risk in the comparison group and the relative effect of the intervention (and its 95% CI). | |||||
| GRADE Working Group grades of evidence | |||||
| 1 No serious risk of bias: Trials were generally well conducted and at low risk of bias. | |||||
Background
Description of the condition
Malaria is a febrile illness caused by Plasmodium parasites, which are transmitted to humans through the bite of infected female anopheline mosquitoes. Five species of Plasmodium cause this disease in humans, of which P. falciparum is the most common worldwide, and is responsible for almost all of the severe disease and deaths (WHO 2000; WHO 2008).
Severe malaria is diagnosed on the basis of a positive blood slide or antigen test for malaria, plus the presence of clinical or laboratory features of vital organ dysfunction. These include impaired consciousness, coma, convulsions, respiratory distress, shock (systolic blood pressure < 70 mmHg in adults, < 50 mmHg in children), jaundice, haemoglobinuria, hypoglycaemia, severe metabolic acidosis or anaemia (WHO 2010). Cerebral malaria is one form of severe malaria, where the patient has some impairment of consciousness and cognition. This can vary from slight disorientation through to deep coma where the patient is unconscious and unrousable. Even with correct treatment cerebral malaria can cause a mortality rate of up to 20%, and a small proportion of people that survive infection can have persistent neurological sequelae (Jaffar 1997).
People living in malaria‐endemic regions can develop a naturally acquired immunity to malaria through repeated exposure to the parasite over five to 10 years (Doolan 2009). This partial immunity is protective against the most severe forms of the disease, and as a consequence, in high transmission settings mortality from severe malaria is highest in young children and decreases with increasing age (WHO 2010).
The World Health Organization (WHO) currently recommends parenteral artesunate as the first‐line treatment for severe malaria, followed by a complete course of an effective artemisinin‐based combination therapy (ACT) as soon as the patient can take oral medications (WHO 2010). The WHO based their recommendation on evidence from two large multi‐centre clinical trials that demonstrated the superiority of intravenous artesunate over the standard treatment quinine (Dondorp 2005; Dondorp 2010). A Cochrane Review of available data concluded that treating people that have severe malaria with artesunate instead of quinine would reduce the risk of death by 39% in adults and 24% in children (Sinclair 2011).
Description of the intervention
Artesunate is only one of a number of antimalarials derived from artemisinin, which is extracted from the herb Artemesia annua and is the active ingredient in a Chinese herbal remedy for fever. Once ingested or injected, artemisinin derivatives undergo conversion to dihydroartemisinin, the active metabolite, which has a broad spectrum of activity against the blood stage asexual Plasmodium parasites (Navaratnam 2000; ter Kuile 1993). Artemisinin derivatives clear parasites from the peripheral blood quicker than other antimalarials, but only artesunate has been shown to impact mortality.
Unlike artesunate, artemether is poorly soluble in water and the parenteral formulation is only available as a pre‐mixed oil‐based solution for intramuscular injection (80 mg/mL for use in adults and 40 mg/mL for children). The standard dose is 3.2 mg/kg on admission followed by 1.6 mg/kg once daily until oral therapy is tolerated (WHO 2010). Peak plasma concentrations typically occur around six hours after intramuscular injection, but in severely ill children with poor peripheral perfusion, absorption can be highly erratic (Karbwang 1997; Mithwani 2004; Murphy 1997).
Conversely, artesunate is supplied as a dry powder for mixing with sodium bicarbonate prior to either intravenous or intramuscular injection (WHO 2010). Compared with artemether, the absorption of artesunate is more reliable with peak plasma concentrations following intramuscular injection occurring at around one hour (Hien 2004; Illet 2002; Nealon 2002). These more favourable pharmacokinetic properties of artesunate moved research attention away from artemether and artesunate now has a stronger evidence‐base and is the preferred therapy (Sinclair 2011; WHO 2010).
Why it is important to do this review
A number of African countries incorporated intramuscular artemether into their national guidelines prior to the WHO recommendation for artesunate. Systematic reviews concluded that intramuscular artemisinin derivatives (including both artesunate and artemether) were not inferior to quinine in preventing deaths from malaria, but were safer and easier to administer (AQMSG 2001; Kyu 2009; McIntosh 2000).
Following the WHO recommendation for artesunate as the preferred treatment for severe malaria, there is a need to re‐evaluate the role of intramuscular artemether in the management of severe malaria in adults and children.
Objectives
To assess the efficacy and safety of intramuscular artemether versus any other parenteral medication in the treatment of severe malaria in adults and children.
Methods
Criteria for considering studies for this review
Types of studies
Randomized controlled trials (RCTs).
Types of participants
Adults and children (under 15 years of age) with severe malaria.
Types of interventions
Intervention
-
Intramuscular artemether
Control
-
Any other parenteral medication for the treatment of severe malaria
Types of outcome measures
Primary outcomes
-
Death from any cause
Secondary outcomes
-
Coma resolution time
-
Neurological sequelae (such as blindness, deafness, hemiplegia and others)
-
Time to hospital discharge
-
Parasite clearance time
-
Fever clearance time
-
Need for blood transfusion
-
Severe anaemia
-
Adverse events (including hypoglycaemia, tinnitus, nausea, vomiting, haematological and cardiac‐related adverse events)
Search methods for identification of studies
We attempted to identify all relevant trials regardless of language or publication status (published, unpublished, in press and in progress).
Electronic searches
Databases
We searched the following databases on 09 April 2014 using the search terms detailed in Table 1: Cochrane Infectious Diseases Group Specialized Register; Cochrane Central Register of Controlled Trials (CENTRAL) (2014, Issue 4), published in The Cochrane Library; MEDLINE (1966 to April 2014); EMBASE (1974 to April 2014), LILACS (1982 to April 2014) and ISI Web of Science (1900 to April 2014). We also searched the WHO clinical trial registry platform, ClinicalTrials.gov and the metaRegister of Controlled Trials (mRCT) up to 09 April 2014 for ongoing trials using 'artemether', 'severe malaria', 'complicated malaria', 'artesunate', 'arteether', and 'child*' as search terms.
| Search set | CIDG SR1 | CENTRAL | MEDLINE2 | Embase2 | LILACS2 | ISI Web of Science |
| 1 | malaria | Malaria ti, ab, MeSH | Malaria ti, ab, MeSH | Malaria ti, ab, Emtree | malaria | malaria |
| 2 | artemether | Artemether ti, ab | Artemether ti, ab | Artemether ti, ab, Emtree | artemether | artemether |
| 3 | Artemisinin* | Artemisinin* ti, ab | Artemisinin* ti, ab | Artemisinin* ti, ab | Artemisinin* | Artemisinin* |
| 4 | intramuscular | Intramuscular ti, ab | Intramuscular ti, ab | Intramuscular ti, ab | intramuscular | intramuscular |
| 5 | parenteral | Injections, Intramuscular [MeSH] | Injections, Intramuscular [MeSH] | Intramuscular drug administration [Emtree] | parenteral | parenteral |
| 6 | 2 or 3 | Parenteral ti, ab | Parenteral ti, ab | Parenteral drug administration [Emtree] | 2 or 3 | 2 or 3 |
| 7 | 4 or 5 | 2 or 3 | 2 or 3 | 2 or 3 | 4 or 5 | 4 or 5 |
| 8 | 1 and 5 and 7 | 4 or 5 or 6 | 4 or 5 or 6 | 4 or 5 or 6 | 1 and 5 and 7 | 1 and 5 and 7 |
| 9 | ‐ | 1 and 7 and 8 | 1 and 7 and 8 | 1 and 7 and 8 | ‐ | Randomised clinical trial* |
| 10 | ‐ | ‐ | ‐ | ‐ | ‐ | 8 and 9 |
1Cochrane Infectious Diseases Group Specialized Register.
2Search terms used in combination with the search strategy for retrieving trials developed by The Cochrane Collaboration (Lefebvre 2011).
Searching other resources
Conference proceedings
We searched relevant proceedings of the following meetings for trial information; Multilateral Initiative on Malaria (MIM) Pan‐African Malaria Conference, European Congress of Tropical Medicine and American Society of Tropical Medicine and Hygiene (09 April 2014).
Researchers
We contacted researchers working in the field and the WHO for unpublished and ongoing trials.
Reference lists
We checked the reference lists of existing reviews and of all trials identified by the above methods.
Data collection and analysis
Selection of studies
Two authors (EE and EEE) independently screened the literature search results and obtained the full reports of such potentially relevant trials. EE and EEE independently applied the inclusion criteria to the full reports using an eligibility form and scrutinized publications to ensure each trial was included only once. We resolved any disagreements through discussion with a third author and, when necessary, by consulting a member of the Cochrane Infectious Diseases Group (CIDG) editorial team. Also, we listed the excluded studies and the reasons for their exclusion.
Data extraction and management
EE and EEE independently extracted data using a specifically developed piloted data extraction form. We resolved any disagreements through discussion with all of the review authors and, when necessary, by consulting a member of the CIDG editorial team. We contacted the corresponding publication author in the case of unclear information or missing data. For each outcome we aimed to extract the number of participants randomized and the number analysed in each treatment group. For dichotomous outcomes, we recorded the number of participants experiencing the event and the number assessed in each treatment group. For continuous outcomes, we extracted arithmetic means and standard deviations for each treatment group, together with the numbers assessed in each group.
Where baseline proportions of participants in the intervention and control arms in whom antipyretics were administered varied, we only included trials that reported fever clearance time and provided additional information about antipyretics use at baseline for participants in both intervention and control arm to avoid confounding in the summary estimate for fever clearance. Where there was significant difference between antipyretic use at baseline in intervention and control arms, we only reported fever clearance time in a table. We defined cure rates in this review as time from first dose to first negative parasite reading for two consecutive readings.
Assessment of risk of bias in included studies
EE and EEE independently assessed the risk of bias of each trial using a risk of bias form. We attempted to contact the trial authors if this information was not specified or if it was unclear. We resolved any disagreements by discussion between review authors. Six components were assessed: generation of the randomization sequence, allocation concealment, blinding, incomplete outcome data, selective outcome reporting and other biases (such as the trial stopped early). We categorized our judgements as either 'low', 'high', or 'unclear' risk of bias, and described our reasons for doing so.
Measures of treatment effect
We calculated results using risk ratios for dichotomous data, and mean difference values for continuous data, and presented these effect estimates with 95% confidence intervals (CI). We treated time‐to‐event outcomes as continuous data and accordingly mean difference calculated from mean time in intervention versus control groups.
Unit of analysis issues
For multiple arm trials, we combined all relevant experimental intervention groups of the trial into a single group, and also combined all relevant control intervention groups into a single control group. For dichotomous outcomes, both the sample sizes and the numbers of people with events were added across groups. For continuous outcomes, we combined means and standard deviations using methods described in the Cochrane Handbook for Systematic Reviews of Interventions.
Dealing with missing data
We analysed data according to the intention‐to treat principle (all randomized participants should be analysed in the groups to which they were originally assigned). If there were discrepancies between the number randomized and the number analysed, we calculated the percentage loss to follow‐up for each treatment group and reported this information.
However, if for some trials it was unclear whether there was loss to follow‐up, we entered the number analysed into Review Manager (RevMan) whenever these figures were available. By attempting to carry out a complete case analysis, we avoided making assumptions about the outcomes of participants lost to follow‐up. Where possible, we contacted authors for missing data.
Assessment of heterogeneity
We looked for statistical heterogeneity by inspecting the forest plots for overlapping CIs, applying the Chi2 test (P < 0.10 considered statistically significant) and the I2 statistic (I2 value < 50% used to denote moderate levels of heterogeneity).
Assessment of reporting biases
We planned to construct funnel plots to look for evidence of publication bias provided we included a sufficient number of trials to make this informative.
Data synthesis
We analysed the data using Review Manager (RevMan). In the first instance, we applied a fixed‐effect meta‐analysis. However, if we detected moderate heterogeneity but still considered it appropriate to combine the trials, we then used a random‐effects approach. Where heterogeneity was very high such that meta‐analysis was not appropriate, we displayed the results in forest plots or tables but did not combine the results. Where data were only presented as medians and ranges, we presented the results in tables.
We presented the main results of the review alongside a GRADE appraisal of the quality of evidence in the 'Summary of Findings' tables.
Subgroup analysis and investigation of heterogeneity
We grouped the analysis and results by children and adults. We reported results by whether the studies were carried out in Africa or in Asia. We examined whether loading dose or quinine influenced outcomes.
Sensitivity analysis
We conducted a sensitivity analysis to investigate the robustness of the results to the risk of bias components by including only trials that concealed the allocation and had low incomplete outcome data (< 10%).
Assessment of the quality of evidence
We assessed the quality of the evidence following the GRADE approach and defined 'quality' as an assessment of our confidence in the estimates of effect (Guyatt 2008).
Results
Description of studies
See the Characteristics of included studies section for details of the included trials.
Results of the search
We conducted the literature search up to 09 April 2014 and identified 77 references (see Figure 1).
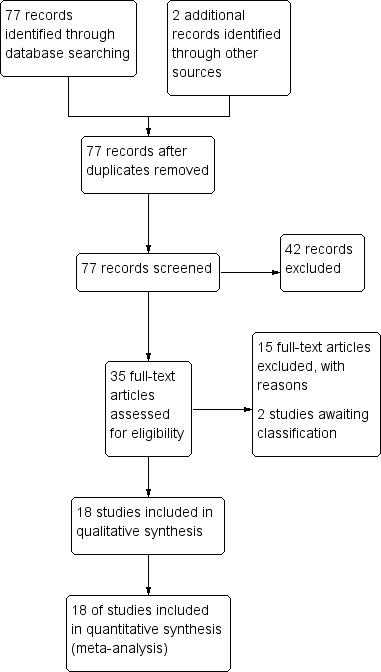
Study flow diagram.
Included studies
We included 18 RCTs, enrolling 2662 participants, in this review. Twelve trials enrolled children only (1447 participants aged between six months and 15 years), and six trials enrolled older children and adults (1215 participants aged between 13 and 79 years).
Location
The trials in children were primarily conducted in Africa: Nigeria (five trials), Sudan (two trials), the Gambia (one trial), Kenya (one trial), Malawi (one trial), and Mali (one trial); with only one trial from Asia (India).
Five adult trials were conducted in Asia: Vietnam (three trials), and Thailand (two trials); and one in Oceania; Papua New Guinea (one trial). We have attached a three letter country code to each trial ID to aid forest plot interpretation.
Interventions
All 12 trials in children compared artemether with quinine. Artemether was given by intramuscular injection, with a loading dose of 3.2 mg/kg body weight followed by maintenance doses of 1.6 mg/kg for three to six days (see Table 2 for details). Only three trials followed this with oral therapy once tolerated (Murphy 1996 KEN; Taylor 1998 MWI; van Hensbroek 1996 GMB). For quinine, nine trials administered the WHO recommended loading dose of 20 mg/kg of intravenous or intramuscular quinine followed by a maintenance dose of 10 mg/kg. However, van Hensbroek 1996 GMB administered the maintenance dose at 12‐hourly intervals instead of eight‐hour intervals (see Table 2).
| Trial ID | Year of study | Age limits | Quinine dosing schedule | Artemether dosing schedule | ||||
| Loading dose | Maintainance | Follow‐on therapy | Loading dose | Maintainance | Follow‐on therapy | |||
| 2002 | 'Children' | 20 mg/kg IV | 10 mg/kg IV every eight hours for 72 hours | Oral quinine for 7 days | 3.2 mg/kg IM | 1.6 mg/kg IM once daily for 4 days | None | |
| 2007 | 6 months to 12 yrs | 20 mg/kg IV or IM | 10 mg/kg IV/IM every eight hours | None | 3.2 mg/kg IM | 1.6 mg/kg IM once daily for 2 days | None | |
| 2001 | < 14 yrs | 20 mg/kg IV | 10 mg/kg IV every eight hours | Quinine to complete 7 days | 1.6 mg/kg IM twice daily | 1.6 mg/kg IM once daily for 5 days | None | |
| 2004 | 3 months to 15 yrs | 20 mg/kg IV | 10 mg/kg IV every eight hours | Quinine 10 mg/kg every eight hours | 3.2mg/kg IM twice daily | 1.6 mg/kg IM once daily for 4 days | None | |
| 1996 | 5 months to 12 yrs | 20 mg/kg IV | 10 mg/kg IV every eight hours | SP once | 3.2 mg/kg IM | 1.6 mg/kg IM once daily for 4 days | SP once | |
| 1998 | Mean age about 4 yrs | 10 mg/kg IV | 10 mg/kg IV every eight hours | Quinine to complete 7 days | 3.2 mg/kg IM | 1.6 mg/kg IM 12 hrs later, then once daily for 2 days | None | |
| 1999 | 11 months to 5 yrs | 20mg/kg IV | 10mg/kg IV every eight hours | Quinine to complete 7 days | 3.2 mg/kg IM | 1.6 mg/kg IM once daily for 4 days | None | |
| 2009 | 1 to 12yrs | 10 mg/kg IV | 10 mg/kg IV every eight hours | Quinine to complete 7 days | 1.6 mg/kg IM twice daily | 1.6 mg/kg IM once daily for 4 days | None | |
| 1996 | 3 months to 15yrs | 10 mg/kg IV | 10 mg/kg IV every eight hours | Quinine to complete 7 days | 1.6 mg/kg IM twice daily | 1.6 mg/kg IM once daily for 4 days | None | |
| 1994 | Mean age of 3 yrs | 20 mg/kg IV | 10 mg/kg IV every eight hours for at least 2 doses | SP once | 3.2 mg/kg IM | 1.6 mg/kg IM once daily for 2 days at least | SP once | |
| 1994 | 1 to 9yrs | 20 mg/kg IV | 10 mg/kg IV every twelve hours | Quinine to complete 5 days | 3.2 mg/kg IM | 1.6 mg/kg IM once daily for 3 days | SP once1 | |
| 1993 | 1 to 5yrs | 20 mg/kg IV | 10 mg/kg IV every eight hours | Quinine to complete 7 days | 3.2 mg/kg IM | 1.6 mg/kg IM once daily for 4 days | None | |
IM = intramuscular; IV = intravenous; SP = sulphadoxine‐pyrimethamine.
1Only in the second and third years of the study.
In adults, four trials compared artemether with quinine (Hien 1996 VNM; Karbwang 1992 THA; Karbwang 1995 THA; Seaton 1998 PNG) and two trials compared artemether with artesunate (Phu 2010 VNM; Vinh 1997 VNM). Artemether was given intramuscularly, over three to seven days with slight variations in dosing (see Table 3 and Table 4) and all four trials administered quinine at the WHO‐recommended loading dose.
| Trial ID | Year of study | Age limits | Quinine dosing schedule | Artemether dosing schedule | ||||
| Loading dose | Maintainance | Follow‐on therapy | Loading dose | Maintainance | Follow‐on therapy | |||
| 1996 | 15 to 79 yrs | 20 mg/kg IM | 10 mg/kg IM every eight hours | Quinine or mefloquine to complete 7 days | 4 mg/kg IM | 2 mg/kg IM once daily for 4 days | Quinine or mefloquine to complete 7 days | |
| 1991 | 15 to 45 yrs | 20 mg/kg IV | 10 mg/kg every eight hours for 7 days | Quinine to complete 7 days | 160 mg IM | 80 mg IM once daily for 6 days | None | |
| 1994 | 15 to 55 yrs | 20 mg/kg IV | 10 mg/kg every eight hours for 7 days | Quinine to complete 7 days | 160 mg IM | 80 mg IM once daily for 6 days | None | |
| 1995 | > 12 yrs | 20 mg/kg IV | 10 mg/kg IV every eight hours | Quinine to complete 7 days | 3.2 mg/kg IM | 1.6 mg/kg IM once daily for 4 days | None | |
IM = intramuscular; IV = intravenous.
| Trial ID | Year of study | Age limits | Artemether dosing schedule | Artesunate dosing schedule | ||||
| Loading dose | Maintainance | Follow‐on therapy | Loading dose | Maintainance | Follow‐on therapy | |||
| 2003 | 15 to 77 yrs | 3.2 mg/kg IM | 1.6 mg/kg IM daily | None | 2.4 mg/kg IM | 1.2 mg/kg IM once daily | 2 mg/kg of artesunate to complete 7 days | |
| 1994 | 15 to 66 yrs | 200 mg IM | 100 mg IM once daily for 3 days | Mefloquine once | 120 mg IM or IV | 60 mg IM or IV once daily for 3 days | Mefloquine once | |
IM = intramuscular; IV = intravenous.
Supportive care
All 12 trials in children reported measurement of blood glucose on admission, but only nine trials reported any subsequent active monitoring for hypoglycaemia.
Only one trial in adults reported measuring blood glucose on admission and monitored hypoglycaemia up to 24 hours after admission (Hien 1996 VNM).
Outcome measures
All 18 trials reported death, a measure of coma resolution, fever clearance and parasite clearance as outcomes. Eleven trials reported neurological sequelae at discharge. Only two trials (Aguwa 2010 NGA; Phu 2010 VNM) reported duration of hospital stay and two trials (Hien 1996 VNM; Olumese 1999 NGA) reported on the number of children requiring blood transfusions. Eleven trials (Adam 2002 SDN; Hien 1996 VNM; Huda 2003 IND; Karbwang 1992 THA; Karbwang 1995 THA; Minta 2005 MLI; Murphy 1996 KEN; Phu 2010 VNM; Seaton 1998 PNG; van Hensbroek 1996 GMB; Walker 1993 NGA) reported on adverse events including episodes of hypoglycaemia. We have listed the outcome definitions used in the included trials in Table 5.
| Trial ID | Coma resolution time | Fever clearance time | Parasite clearance time | Hypoglycaemia |
| Mean value (h) reported and defined as a Blantyre coma score of 5 recorded for at least 24 hours | Mean value (h) reported and defined as the time after which the temperature remained normal (axillary temperature < 37.5°C) | Mean value (h) reported and defined as the time passed from admission and start of treatment until two consecutive negative smears. Blood films repeated every 8 hours. | Number of episodes (n/N) reported but not defined | |
| Proportions with coma resolution on D3 reported but not defined | Proportions with fever clearance on D3 and D14 reported and defined as body temperature ≤ 37.5°C after commencement of treatment | Proportions with parasite clearance on D3 and D14. Parasite clearance was taken as adequate clinical and parasitological response (ACPR) | Not reported | |
| Median value (h) reported and defined as the time to reach a score of 15 on the Glasgow Coma Scale | Median value (h) reported but not defined. | Median value (h) reported and defined as the time to Assessed every 4 hours for the first 24 hours and every 6 hours until three consecutive negative blood smears | Number of episodes (n/N) reported but not defined | |
| Glasgow coma scale was used in grading the level of consciousness of the patients every eight hours | Mean value (h) reported and defined as time to clearance of fever | Mean value (h) reported but not defined | Not reported | |
| Unclear if values reported are means or medians (h) | Mean value (h) reported and defined as time for the temperature to fall below 37.5°C and remain that value for 72 hours | Mean value (h) reported and defined as the time for the parasite count to fall below the level of microscopic detection (thick film) | Not reported | |
| Median value (h) reported and defined as the time taken for the patients to recover completely from unconciousness | Mean value (h) reported and defined as time for the temperature to fall below 37.5°C and remain that value for 72 hours | Median value (h) reported and defined as the time taken for parasite count to fall below the level of microscopic detection (thick film) | Not reported | |
| Mean value (h) reported and defined as the time to normalization of consciousness | Mean value (h) reported but not defined | Mean value (h) reported and defined as time till negative parasitaemia result | Not reported | |
| Median value (h) reported but not described | Median value (h) reported but not described | Median value (h) reported but not described. Every four hours until clearance | Not reported | |
| Mean value (h) reported and defined as the interval between onset of therapy and the attainment of full consciousness | Mean value (h) reported and defined as the interval between the onset of therapy and the time the body temperature is ≤ 37°C and remained so | Defined as two successive thick blood films done at 12 hours interval are negative for asexual forms of plasmodium species | Not reported | |
| Mean value (h) reported and defined as time to regain full consciousness | Mean value (h) reported and defined as the time for temperature to fall below 37.5°C and remain so for at least 48 hours | Mean value (h) reported and defined as the time from start of drug administration to the first of two consecutive negative thick smears remaining negative until day 7 | Not reported | |
| Mean value (h) reported and defined as time to attainment of a Blantyre score of 5 for at least 24 hours from initiation of treatment | Mean value (h) reported but not defined | Mean value (h) reported but not defined. Thick and thin film done on D0 and repeated on Days 3, 7 and 14 | Not reported | |
| Median value (h) reported and defined as time to Glasgow coma score of 15. | Median value (h) reported and defined as the time for temperature to fall below 37.5°C and remain so | Median value (h) reported and defined as the time to clear all parasites | Number of episodes (n/N) reported but not defined | |
| Mean value (h) reported and defined as time to regaining consciousness | Mean value (h) reported and defined as the time for temperature to fall below 37.5°C | Mean value (h) reported and defined as time to clear parasites measured every six hours till clearance | Not reported | |
| Median value (h) reported but not defined | Median value (h) reported and defined as a temperature <37.5 °C on two successive readings | Median value (h) reported and defined as as the time at which the blood films were negative for P. falciparum for at least eight hours | Number of episodes (n/N) reported but not defined | |
| Median value (h) reported and defined as time required for a child to achieve a Blantyre Coma Score of 5 | Median value (h) reported and defined as the time at which the rectal or axillary temperature dropped below 37.5°C and remained < 37.5°C for 24 consecutive hours | Median value (h) reported and defined as the time at which the first of two negative (0 parasites/200 WBC) thick blood films was prepared. Every four hours till clearance | Not reported | |
| Median value (h) reported and defined as time to regain full consciousness | Median value (h) reported and defined as time needed for the rectal temperature to fall below | Median value (h) reported and defined as time needed for all parasites to clear relative to parasite density at admission and assessed every 12 hours till clearance | Number of episodes (n/N) reported and defined as a blood glucose level below 40 mg/dL (2.2 mmol/L) | |
| Median value (h) reported and defined as time to regain full consciousness | Median value (h) reported and defined as time for axillary temperature to fall to, and remain for ≥ 24 hours at 37.5°C or lower | Median value (h) reported and defined as time to clear parasites | Not reported | |
| Mean value (h) reported but not defined | Mean value (h) reported | Mean value (h) reported and defined as the time for parasitaemia to be cleared and to remain so up to Day 7. Assessed every six hours during period of coma and then every 12 hours. | Not reported |
WBC = white blood cell.
Other outcomes reported by trials which we did not include in this review were time to death (Murphy 1996 KEN; Taylor 1998 MWI; van Hensbroek 1996 GMB), survival rate (Karbwang 1992 THA; Karbwang 1995 THA), cause of death (Karbwang 1992 THA), fatality rate (Vinh 1997 VNM), time to ambulation (Olumese 1999 NGA; Phu 2010 VNM), time to sit unaided and time to drink (Phu 2010 VNM; Walker 1993 NGA), time to eating (Phu 2010 VNM), gametocyte carriage (Adam 2002 SDN), recrudescence (Adam 2002 SDN; Minta 2005 MLI; Taylor 1998 MWI; Walker 1993 NGA), 28th day cure rate (Satti 2002 SDN; van Hensbroek 1996 GMB; Walker 1993 NGA). Other outcomes included duration of parenteral treatment and time for plasma lactate levels to fall below 2.5 mmol/L (Hien 1996 VNM).
Excluded studies
We excluded 14 trials and listed the reasons for their exclusion in the 'Characteristics of excluded studies' section.
Risk of bias in included studies
See Figure 2 for a summary of the risk of bias assessments. We presented further details in the 'Characteristics of included studies' tables.

Risk of bias summary: review authors' judgements about each risk of bias item for each included trial.
Allocation
Seven trials were at low risk of bias regarding the generation of allocation sequence while one trial was at high risk of bias (Aguwa 2010 NGA). Ten trials were at unclear risk of bias because review authors did not provide enough information to permit us to make a judgement.
Eleven trials were at low risk of bias regarding allocation concealment and the remaining trials provided insufficient information to make a judgement.
Blinding
In all trials, except Hien 1996 VNM and Phu 2010 VNM, investigators and participants were aware of treatment allocation. Participants were also not blind to the intervention as two different routes (intramuscular (artemether) and intravenous (quinine) were used to administer the interventions. Blinding was unlikely to affect the assessment of outcome death in all trials. In one trial, microscopists were blinded to the intervention and clinical status of the patients (Huda 2003 IND). The other subjective outcomes were thus at high risk of bias in all open included trials or at unclear risk of bias where trial provided did not provide information.
Incomplete outcome data
Fourteen trials reported no losses to follow‐up. The remaining four trials (Aguwa 2010 NGA; Satti 2002 SDN; Seaton 1998 PNG; Taylor 1998 MWI) reported over 10 per cent attrition in either one or both trial arms. Two trials used the per protocol number of participants as a denominator in the analysis (Taylor 1998 MWI; Seaton 1998 PNG). The other two trials used the number of participants randomized as the denominator in the analysis.
Selective reporting
We did not detect any evidence of selective outcome reporting.
Other potential sources of bias
We did not identify any other sources of bias.
Effects of interventions
See: Summary of findings for the main comparison Summary of findings table 1; Summary of findings 2 Summary of findings table 2; Summary of findings 3 Summary of findings table 3
Artemether versus quinine
Children
Twelve trials were conducted in children, Eleven in Africa and one in Asia. All used loading doses of quinine.
Death: there was no overall difference in all‐cause mortality between intramuscular artemether and intravenous quinine (RR 0.96, 95% CI 0.76 to 1.20; 12 trials, 1447 participants, Analysis 1.1). However, these 12 trials were too small to detect or exclude clinically important differences, and the overall meta‐analysis remains significantly underpowered to prove equivalence (see Table 6 and Table 7). The current total sample size has adequate power to exclude effects as large as seven extra deaths per 100 patients.
| Outcome | Type of test | Proportion in control group3 | Proportion in Intervention group | Estimated RR | Total sample size1,2 |
| Death | Superiority | 0.17 | 0.136 | 0.80 | 3514 |
| Equivalence | 0.17 | 0.14 to 0.204 | ‐ | 6592 | |
| Neurological sequelae | Superiority | 0.25 | 0.20 | 0.80 | 2184 |
| Equivalence | 0.25 | 0.22 to 0.284 | ‐ | 8760 |
1 These calculation were performed using a power calculator available at: http://www.sealedenvelope.com/power/
2 All calculation were performed for a power of 80% and an α error of 0.05.
3 The proportion in the control group is taken from the median control group risk across trials.
4 A maximum 3% risk difference was chosen to represent equivalence.
| Outcome | Type of test | Mean in control group3 | Mean in Intervention group4 | SD of outcome | Total sample size1,2 |
| Coma resolution time | Superiority | 25 | 19 | 20 | 350 |
| Equivalence | 25 | 19 to 31 | 20 | 382 | |
| Parasite clearance time | Superiority | 42 | 36 | 20 | 350 |
| Equivalence | 42 | 36 to 48 | 20 | 382 | |
| Fever clearance time | Superiority | 48 | 42 | 20 | 350 |
| Equivalence | 48 | 36 to 54 | 20 | 382 |
1 These calculations were performed using a power calculator available at: http://www.sealedenvelope.com/power/
2 All calculation were performed for a power of 80% and an α error of 0.05.
3 The mean in the control group is taken from the median control group across studies.
4 A six‐hour time difference was chosen to represent a clinically important benefit.
Coma resolution time: the mean coma resolution time was about five hours shorter with artemether (26 hours) compared with quinine (30.55 hours) (MD ‐5.45 hours, 95% CI ‐7.90 to ‐3.00; six trials, 358 participants, Analysis 1.3). This effect was largest in trials without adequate allocation concealment and therefore at unclear or high risk of bias. A sensitivity analysis excluding these trials found no significant difference between groups. In addition, three trials reported median time to coma resolution (see Table 8). Two trials found no significant difference (Murphy 1996 KEN; Taylor 1998 MWI), and one trial found the median time to be longer with artemether (26 hours versus 20 hours, P = 0.046, van Hensbroek 1996 GMB). Two other trials (Minta 2005 MLI; Osonuga 2009 NGA) reported mean coma resolution time as mean (SD) but the data was not normally distributed and so we have reported this an additional table (Table 8).
| Pre‐specified outcome | Trial reported outcome | Trial | No. of participants | Artemether | Quinine | Comparative results reported in article |
| Coma resolution time (h) | Median (IQR) | 160 | 12 | 13 | Not significantly different | |
| Median (IQR) | 576 | 26 | 20 | P = 0.046 | ||
| Median (IQR) | 164 | 18 | 20 | Not significantly different | ||
| Coma recovery (%) on Day 3 | 90 | 15.9% | 21.4% | RR = 0.763 (95% CI 0.065 to 9.015) | ||
| Mean (SD) | 32 | 4.5 (13.05) | 9 (24.59) | P = 0.523 | ||
| Mean (SD) | 67 | 30.57 (29.02) | 25.15 (31.62) | P = 0.53 | ||
| Time to hospital discharge | % spending less than one week in hospital | 90 | 61.76% | 71.74% | P = 0.829 | |
| Fever clearance (h) | Median (IQR) | 160 | 32 | 32 | Not significantly different | |
| 576 | 30 | 33 | P = 0.8 | |||
| 164 | 31 | 45 | "Significant" | |||
| Fever clearance (%) on Day 3 | 90 | 90.0% | 87.7% | P = 0.753 | ||
| Parasite clearance (h) | Median (IQR) | 160 | 39.5 | 48 (37 to 56) | P < 0.001 | |
| 576 | 48 | 60 | P < 0.001 | |||
| 164 | 32 | 40 | 'significant' | |||
| Parasite clearance (%) on Day 3 | 90 | 99.0% n = 44 | 96.8% n = 46 | P = 0.422 | ||
| Needing blood transfusion | ‐ | ‐ | ‐ | ‐ | "The two groups were similar in terms of the need for blood transfusions,and the incidence of secondary bacterial infections (data not shown)." |
IQR = interquartile range.
Neurological sequelae: there was no overall difference in the risk of neurological sequelae at hospital discharge between artemether (185 per 1000) and quinine (220 per 1000) (RR 0.84, 95% CI 0.66 to 1.07; seven trials, 968 participants, Analysis 1.4). Again these trials were too small to enable us to confidently detect or exclude what may be clinically important differences between treatments (see Table 6). The overall meta‐analysis is adequately powered to exclude effects larger than eight additional sequelae per 100 patients.
Three trials continued to monitor patients with neurological sequelae after hospital discharge. Satti 2002 SDN found no difference at day seven, Taylor 1998 MWI found most sequelae had resolved and van Hensbroek 1996 GMB found no difference at day 28 (Analysis 1.5).
Parasite clearance time (PCT): the mean parasite clearance time in children was approximately nine hours shorter with artemether (MD ‐9.03 hours, 95% CI ‐11.43 to ‐6.63; seven trials, 420 participants, Analysis 1.6. The statistical significance of this result remained after we excluded trials at unclear or high risk of selection bias. The mean parasite clearance times for artemether and quinine were 36.25 and 43.18 hours respectively.
Three additional trials reported median parasite clearance time and all showed a statistically significant benefit with artemether (see Table 8). One trial (Ojuawo 1998 NGA) expressed parasite clearance as the proportion of patients with parasite clearance at 72 hours and at seven days, with no statistically significant differences between groups (see Analysis 1.7). Trials differed with respect to the frequency with which they repeated malaria blood smears (see Table 5).
Fever clearance time (FCT): eight trials reported mean fever clearance time with a statistically significant reduction of about three hours with artemether overall (MD ‐3.73 hours, 95% CI ‐6.55 to ‐0.92; eight trials, 457 participants, Analysis 1.8). The mean fever clearance times for artemether and quinine were 43.69 and 46.26 hours respectively. However, only two of the individual trials showed a statistically significant difference between the groups. Three trials in children reported median fever clearance time and two trials found no statistically significant difference between the two groups (see Table 8).
The definitions of fever varied across the included trials. Six trials used a cut off of body temperature less than 37.5°C from initiation of treatment to define fever clearance (see Table 5).
Need for blood transfusion: one trial reported on the number of patients requiring blood transfusions for severe malarial anaemia in both artemether and quinine arms (Olumese 1999 NGA) (see Analysis 1.9). No statistically significant difference was observed between both arms (RR 1.27, 95% CI 0.62 to 2.59; 103 participants, one trial).
Adverse effects: six trials reported on the frequency of adverse events (Adam 2002 SDN; Huda 2003 IND; Minta 2005 MLI; Murphy 1996 KEN; van Hensbroek 1996 GMB; Walker 1993 NGA). Two trials reported no adverse events had occurred during the trial duration (see Table 9). One trial reported the absence of adverse events in the artemether arm (Minta 2005 MLI). No trial reported discontinuation of medication.
| Study ID | Sample size | Clinical symptoms monitoring | Biochemistry | Haematological | Electrocardiogram | Additional comments on adverse events |
| 41 | Not reported | Not reported | Not reported | Not reported | "Neurological deficits were not observed in any patient during the follow‐up period" | |
| 90 | Not reported | Not reported | Not reported | Not reported | None | |
| 560 | Clinical assessment every 4 hours for the first 24 hours and 6 hourly afterwards | Blood glucose, lactate and cytokine levels measured 4, 8, 12 and 24 hours after admission | Full blood count on admission | Pre‐treatment and 12 hours after initiation of treatment on Day 0, 4 hours after last dose and at discharge | None | |
| 46 | Lumbar puncture Chest x‐ray on day 0 | Blood Glucose, Renal Function Test, Liver Function Test and Serum Electrolyte on Days 0 and 3 | Full Blood Count on Days 0 and 3 | Day 0 | "No serious side effects of either of the drugs were observed in our study...... Closer and more frequent monitoring and larger sample size would have probably revealed more subtle adverse drug effects." | |
| 26 | Clinical evaluation daily for at least 7 days Lumbar puncture Chest x‐ray on day 0 | Biochemistry on Days 0, 2, 4 and 7 | Full Blood Count on Days 0, 2, 4 and 7 | On admission for all patients; then once daily and every six hours for quinine and artemether patients respectively | "The side effects in the quinine group were dizziness and vertigo. No side effects were detected with artemether". | |
| 102 | Clinical evaluation on admission and twice daily for at least 7 days Lumbar puncture Chest x‐ray on day 0 | Biochemistry on Days 0, 2, 4 and 7 | FBC on Days 0, 2, 4 and 7 | On admission for all patients; then once daily and every six hours for quinine and artemether patients respectively | QTc prolongation and tinnitus were the major adverse events in Quinine arm. Mild transient pain at injection site for approximately 15 mins after artemether treatment. | |
| 67 | Clinical examination daily on Days 1 to7, and 14 | Blood glucose on Days 1, 2, 3, 5, 7 and 14 Urea and Serum Electrolyte, transaminases, phosphatases on Days 1, 3, 5, 7 and 14 | FBC on Days 1, 3, 5, 7 and 14 | Once daily on Days 1, 3, 5, 7 and 14 | None | |
| 160 | Clinical assessment on admission, then at six, then 12 hour intervals till discharge | Blood glucose, urea, electrolytes, blood gases and when clinically indicated | FBC on Day 0 and when clinically indicated Blood cultures on Day 0 | On admission and at 6, 24, 30, 48 and 54 hours | None | |
| 37 | Clinical assessment on Day 0 | Urea and electrolyte Blood sugar and liver function test on Day 0 | FBC on Day 0 | None | None | |
| 103 | Clinical assessments on Days 0, 3, 7, 14, 28 | Blood glucose, Urea and creatinine, electrolytes on Days 0, 3, 7, 14, 28 | WBC count on Days 0, 3, 7, 14, 28 | None | "No adverse reactions to the two drugs were recorded during the study". | |
| 32 | Clinical examination on Days 0 to 7 and 14 | None | None | None | None | |
| 370 | Clinical examination on admission Chest x‐ray on admission Lumbar puncture | Blood urea nitrogen, serum creatinine, aspartate aminotransferase, alanine transaminase, plasma lactate | Full blood count on admission | None | None | |
| 77 | Clinical evaluation on admission and every six hours on Days 0 to 4, and then once daily on Days 14, 21 and 28 | Blood glucose, serum creatinine, serum aspartate, aminotransferase on Day 0 | WBC, Haemoglobin on Days 0 and 3 | None | None | |
| 33 | Chest X‐ray on admission | Renal and Liver function tests on admission, Days 3 and 7 | Full Blood Count on Days 0, 3 and 7 | None | None | |
| 183 | CSF collected on admission | Blood glucose, Blood pH, on D0 (every four hours for the first 24 hours | Haematocrit every eight hours Full Blood Count, urea and electrolytes on Days 0, 3, 7 and 28 | On admission, 6, 48,54 and 96 hours | "Of the initial 127 patients on whom serial electrocardiographic tracings were made, more patients in the quinine group | |
| 576 | Clinical examination on Day 0 Lumbar puncture on admission | Blood glucose on admission, after 4hours and 12 hours | PCV, Haemoglobin, Blood culture on Day 0 | None | None | |
| 124 | Clinical examination on admission | Blood glucose, serum creatinine, serum bilirubin on admission | Full blood count on admission | None | None | |
| 54 | Clinical examination twice daily Spinal taps | Urea and Electrolyte, on days 3, 7, 14, 28 | PCV on days 3, 7, 14, 28 | On admission, at 4 and 6 hours | None |
Only two trials reported episodes of hypoglycaemia (Analysis 1.10). Other adverse effects reported were QT prolongation, local skin reaction at the injection site, abscess, urticarial rash, pruritus, supraventricular tachycardia and urinary tract infection.. However, these trials were insufficiently powered to detect differences in adverse events. The trials had similar definitions of adverse events (included only adverse effects that could not be attributable to malaria).
Time to hospital discharge: none of the included trials reported time to discharge. One trial reported the proportion of patients that spent less than one week in hospital and found no significant difference between groups (see Table 8).
Adults
Four trials were conducted in adults, three in Asia and one in Oceania. All used loading doses of quinine.
Death: artemether resulted in fewer deaths compared with quinine (RR 0.59, 95% CI 0.42 to 0.83; four trials, 716 participants, Analysis 1.1) from trials conducted mostly in Asia.
Coma resolution time: three trials reported a measure of coma resolution time. Hien 1996 VNM reported median coma resolution time, which was shorter in the quinine arm. Karbwang 1995 THA found both arms to be comparable in terms of coma resolution time. The third trial, Karbwang 1992 THA reported mean coma resolution time but the data were incompletely reported (see Table 10).
| Pre‐specified outcome | Trial reported outcome | Trial | No. of participants | Artemether | Quinine | Comparative results reported in article |
| Coma resolution time (h) | Median (IQR) | 560 | 66 (30 to 132) | 48 (20 to 84) | P = 0.003 | |
| Median (Range) | 97 | 48 (6 to 144) | 48 (6 to 144) | Not significantly different | ||
| Fever clearance (h) | Median (IQR) | 560 | 127 (60 to 216) | 90 (54 to 144) | < 0.001 | |
| Median (Range) | 33 | 32 (20 to 112) | 48 (28 to 88) | P = 0.034 | ||
| Median (Range) | 97 | 79 (16 to 147) | 84 (36 to 144) | Not significantly different | ||
| Parasite clearance (h) | Median (IQR) | 560 | 72 (54 to 102) | 90 (66 to 108) | < 0.001 | |
| Median (range) | 33 | 48(4 to 72) | 52 (12 to112) | P = 0.381 | ||
| Median (Range) | 97 | 54 (30 to 164) | 78 (18 to 168) | P = 0.007 |
IQR = interquartile range.
Neurological sequelae: only one trial Hien 1996 VNM reported neurological sequelae at discharge. Four neurological sequelae were reported with no difference between groups (one trial; 560 participants, Analysis 1.4).
Parasite clearance time (PCT): one trial reported mean parasite clearance time but showed no statistically significant difference between artemether and quinine (MD 1.70 hours, 95% CI ‐15.56 to 18.96; 26 participants, one trial, Analysis 1.6). Three other trials reported median parasite clearance time. Two trials reported a significantly shorter time to clearance of parasites with artemether (Hien 1996 VNM; Karbwang 1995 THA; see Table 8). Seaton 1998 PNG found no significant difference between artemether and quinine with respect to parasite clearance time.
Trials differed with respect to the frequency with which they repeated malaria blood smears (see Table 5).
Fever clearance time (FCT): four trials reported a measure of fever clearance time. Karbwang 1992 THA reported mean fever clearance time and found a statistically significant reduction of about 30 hours with artemether (MD ‐29.7 hours, 95% CI ‐54.14 to ‐5.26; 26 participants, one trial). The other three trials in adults reported median fever clearance time and two (Hien 1996 VNM; Seaton 1998 PNG) reported a statistically significant reduction in fever clearance time in favour of quinine and artemether respectively. Karbwang 1995 THA found both groups were comparable (see Table 10).
The definitions of fever varied across the included trials. Three trials used a cut off of body temperature less than 37.5°C from initiation of treatment to define fever clearance (see Table 5).
Need for blood transfusion: one trial reported on the number of patients requiring blood transfusions for severe malarial anaemia in both artemether and quinine arms (Hien 1996 VNM) (see Analysis 1.9). No statistically significant difference was observed between both arms (RR 0.97, 95% CI 0.73 to 1.29; 560 participants, one trial).
Adverse events: one trial reported episodes of hypoglycaemia (Analysis 1.10). Other adverse effects reported were abscess, induration at injection site, leg discomfort, chest infection and gastrointestinal bleeding. However, these trials were insufficiently powered to detect differences in adverse events. The trials had similar definitions of adverse events (included only adverse effects that could not be attributable to malaria).
Artemether versus artesunate
Adults
Two trials were conducted in adults; both from Asia.
Death: only two trials directly compared intramuscular artemether and intravenous artesunate. Overall, the risk of all‐cause mortality was significantly higher following treatment with artemether (RR 1.80, 95% CI 1.09 to 2.97; 494 participants, two trials, Analysis 2.1). However, both trials were too small to detect or exclude clinically important differences, and the overall meta‐analysis remains significantly underpowered to prove superiority (see Table 6 and Table 7).
Coma resolution time: two trials reported median coma resolution times. Both trials reported a shorter coma resolution time with artesunate. However, these differences were not statistically significant (Table 11).
| Pre‐specified outcome | Trial reported outcome | Trial | No. of participants | Artemether | Artesunate IM | Artesunate IV | Comparative results reported in article |
| Coma resolution time (h) | Median (range) | 370 | 72(2 to 2232) n = 184 | 60(4 to 2136) n = 186 | ‐ | P = 0.11 | |
| Median (95% CI) | 124 | 47 (31 to 63) | 30 (18 to 42) | 24 (4 to 44) | ‐ | ||
| Fever clearance (h) | Median (range) | 370 | 108 (0 to 888) n = 184 | 108 (0 to 888) n = 186 | ‐ | P = 0.27 | |
| Median (95% CI) | 124 | 48 (38 to 58) | 36 (30 to 42) | 30 (18 to 42) | ‐ | ||
| Parasite clearance (h) | Median (range) | 370 | 72 (2 to 204) | 72 (7 to 330) | ‐ | P = 0.97 | |
| Median (95% CI) | 124 | 30 (26 to 34) | 24 (15 to 33) | 24 (15 to 33) | Not statistically significant |
IM = intramuscular; IV = intravenous.
Parasite clearance time: two trials found no overall difference in median parasite clearance time (Phu 2010 VNM; Vinh 1997 VNM).
Fever clearance time:Phu 2010 VNM found no statistically significant difference in median fever clearance time between intramuscular artemether and intravenous artesunate. The additional small trial (Vinh 1997 VNM) found a benefit in favour of artesunate although this was not statistically significant.
Need for blood transfusion:Phu 2010 VNM found no difference between treatments with respect to the need for blood transfusion in adult severe malaria patients (RR 1.01, 95% CI 0.78 to 1.32; 370 participants, one trial, Analysis 2.2).
Adverse effects: only Phu 2010 VNM reported adverse events. The risk of hypoglycaemia was significantly higher in adults treated with intramuscular artemether compared with artesunate (RR 1.70. 95% CI 0.4 to 7.24; 370 participants, one trial, Analysis 2.4).
Discussion
Summary of main results
We included 18 RCTs, enrolling 2662 children and adults with severe malaria. Eleven trials were conducted in Africa and seven trials were undertaken in Asia.
Artemether versus quinine
For children (trials mostly conducted in Africa), there is probably little or no difference in the risk of death between intramuscular artemether and quinine (moderate quality evidence). Artemether may shorten the coma recovery time by about five hours (low quality evidence), and may reduce the number of children with subsequent neurological sequelae (low quality evidence). Artemether probably shortens the parasite clearance time by about nine hours (moderate quality evidence), and may shorten the fever clearance time by about three hours (low quality evidence).
For older children (> 15 years) and adults in Asia, artemether probably reduces deaths compared with quinine (moderate quality evidence), but larger trials are required to have full confidence in this finding.
Artemether versus artesunate
Artemether and artesunate have only been compared in two trials in adults from Asia, and mortality is probably higher with intramuscular artemether (moderate quality evidence) but larger trials are required to have confidence in this finding.
Overall completeness and applicability of evidence
Although 16 trials directly compared artemether versus quinine, none were adequately powered to detect clinically important differences. The total number of participants included in these trials (2163 participants) remains far short of the 7429 participants included in trials of artesunate versus quinine. The majority of data comparing artemether and quinine were from trials conducted in sub‐Saharan Africa where artemether is most widely used.
The two trials directly comparing artemether and artesunate were conducted in adults in Asia, and the results are therefore poorly applicable to children in Africa. However, in the absence of direct comparisons in children, the low quality evidence of equivalence between artemether and quinine suggests that artesunate will be as superior to artemether as it has been shown to be superior to quinine.
Artemether is prone to erratic and partial absorption and takes longer to achieve peak plasma concentrations as demonstrated in animal and human studies. These pharmacokinetic attributes make artemether that is injected intramuscularly less readily available in the human body and may explain the difference in outcomes between artesunate and intramuscular artemether we have observed in this review.
Quality of the evidence
We assessed the quality of the evidence using the GRADE approach and have presented it in three 'Summary of Findings' tables (summary of findings Table for the main comparison; summary of findings Table 2; summary of findings Table 3).
The evidence of equivalence between intramuscular artemether and intravenous quinine in children is of moderate quality due to the small sample sizes of the included trials and the overall lack of power to fully exclude clinically important differences.
Similarly, we downgraded the evidence for reductions in mortality in adults treated with artemether compared with quinine, and artesunate compared with artemether, to moderate due to imprecision. Larger trials are needed to have full confidence in these effects.

Study flow diagram.

Risk of bias summary: review authors' judgements about each risk of bias item for each included trial.
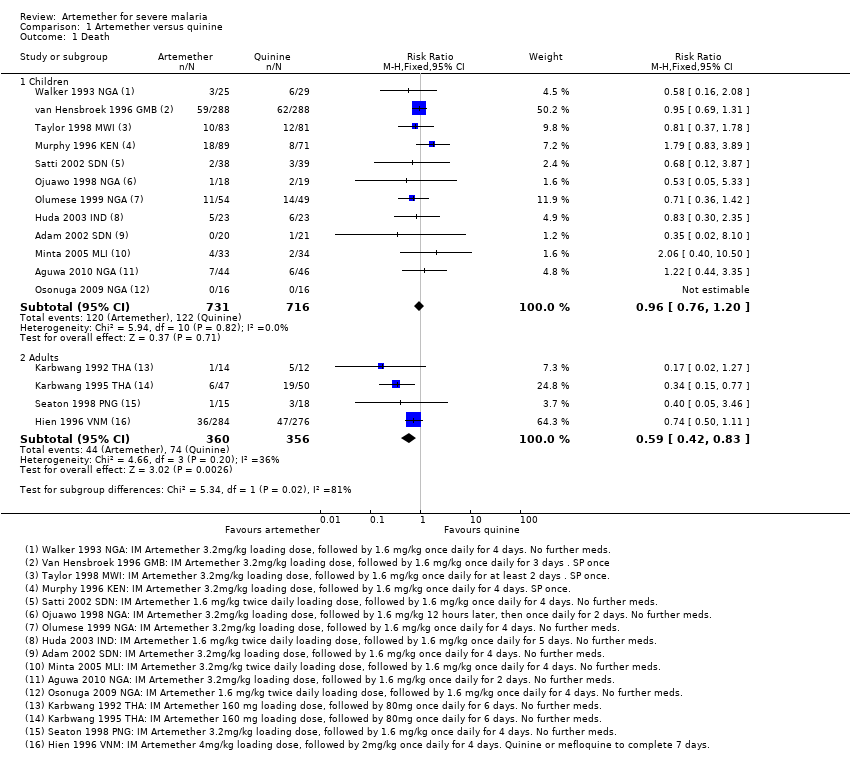
Comparison 1 Artemether versus quinine, Outcome 1 Death.
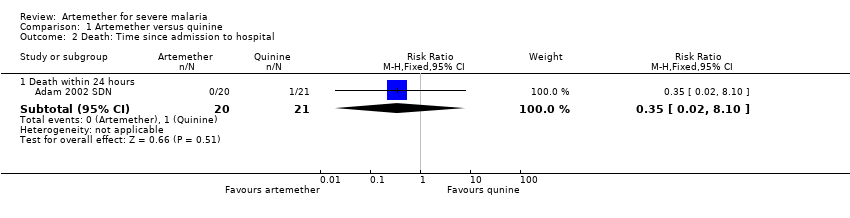
Comparison 1 Artemether versus quinine, Outcome 2 Death: Time since admission to hospital.
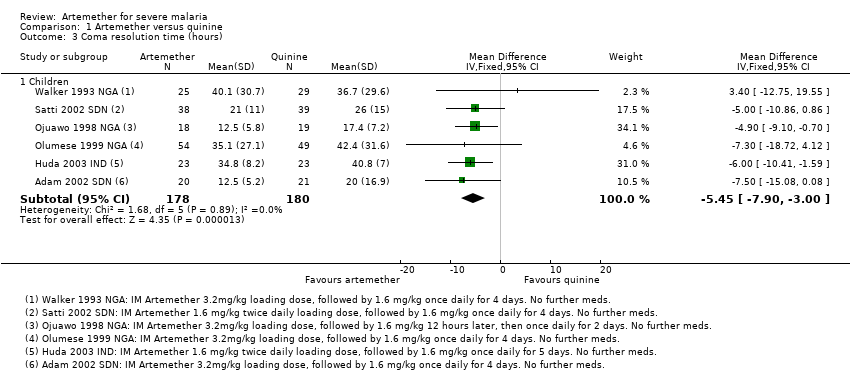
Comparison 1 Artemether versus quinine, Outcome 3 Coma resolution time (hours).

Comparison 1 Artemether versus quinine, Outcome 4 Neurological sequelae at discharge.
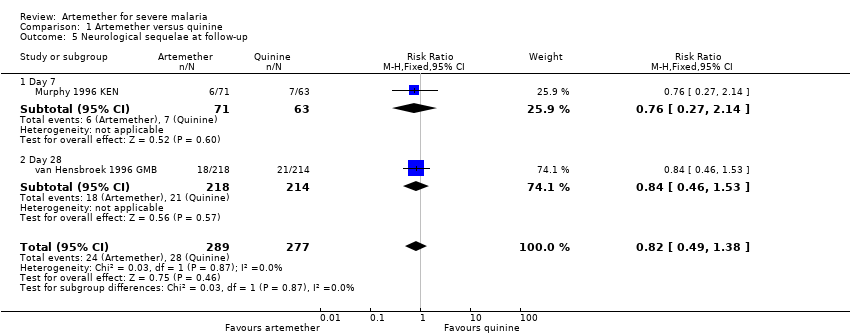
Comparison 1 Artemether versus quinine, Outcome 5 Neurological sequelae at follow‐up.

Comparison 1 Artemether versus quinine, Outcome 6 Parasite clearance time.
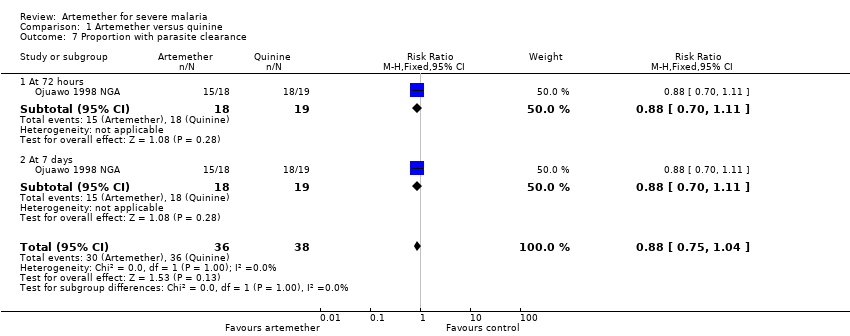
Comparison 1 Artemether versus quinine, Outcome 7 Proportion with parasite clearance.

Comparison 1 Artemether versus quinine, Outcome 8 Fever clearance time (hours).

Comparison 1 Artemether versus quinine, Outcome 9 Need for blood transfusion.

Comparison 1 Artemether versus quinine, Outcome 10 Episodes of hypoglycaemia.

Comparison 1 Artemether versus quinine, Outcome 11 Adverse events.

Comparison 2 Artemether versus artesunate, Outcome 1 Death.

Comparison 2 Artemether versus artesunate, Outcome 2 Need for blood transfusion.
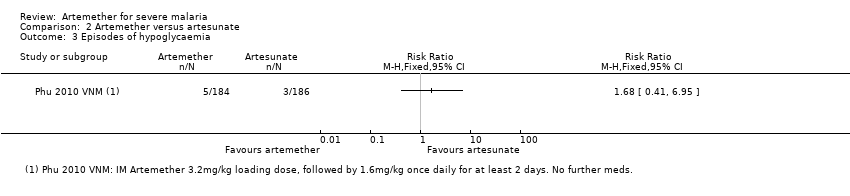
Comparison 2 Artemether versus artesunate, Outcome 3 Episodes of hypoglycaemia.

Comparison 2 Artemether versus artesunate, Outcome 4 Adverse events.
| Artemether compared with quinine for treating children with severe malaria | |||||
| Patient or population: Children with severe malaria | |||||
| Outcomes | Illustrative comparative risks* (95% CI) | Relative effect | No of participants | Quality of the evidence | |
| Assumed risk | Corresponding risk | ||||
| Quinine | Artemether | ||||
| Death | 170 per 1000 | 164 per 1000 | RR 0.96 | 1447 | ⊕⊕⊕⊝ |
| Coma resolution time | The mean coma resolution time ranged across control groups from | The mean coma resolution time in the intervention groups was | ‐ | 358 | ⊕⊕⊝⊝ |
| Neurological sequelae at discharge | 220 per 1000 | 185 per 1000 | RR 0.84 | 968 | ⊕⊕⊝⊝ |
| Parasite clearance time | The mean parasite clearance time ranged across control groups from | The mean parasite clearance time in the intervention groups was | ‐ | 420 | ⊕⊕⊕⊝ |
| Fever clearance time | The mean fever clearance time ranged across control groups from | The mean fever clearance time in the intervention groups was | ‐ | 457 | ⊕⊕⊝⊝ |
| *The assumed risk is the median control group risk across studies. The corresponding risk (and its 95% CI) is based on the assumed risk in the comparison group and the relative effect of the intervention (and its 95% CI). | |||||
| GRADE Working Group grades of evidence | |||||
| 1 No serious risk of bias: Trials were variable in their risk of bias, but exclusion of the trials at high or unclear risk of selection bias did not change this result. | |||||
| Artemether compared with quinine for treating adults with severe malaria | |||||
| Patient or population: Adults with severe malaria | |||||
| Outcomes | Illustrative comparative risks* (95% CI) | Relative effect | No of participants | Quality of the evidence | |
| Assumed risk | Corresponding risk | ||||
| Quinine | Artemether | ||||
| Death | 208 per 1000 | 123 per 1000 | RR 0.59 | 716 | ⊕⊕⊕⊝ |
| Coma resolution time | ‐ | ‐ | Not pooled. Little difference. | 657 | ⊕⊕⊝⊝ |
| Neurological sequelae at discharge | 4 per 1000 | 12 per 1000 (1 to 111) | RR 2.92 | 560 | ⊕⊕⊝⊝ |
| Parasite clearance time | ‐ | ‐ | Not pooled. Little difference apparent. | 716 | ⊕⊕⊕⊝ |
| Fever clearance time | ‐ | ‐ | Not pooled. Little difference apparent. | 716 | ⊕⊕⊝⊝ |
| *The assumed risk is the median control group risk across studies. The corresponding risk (and its 95% CI) is based on the assumed risk in the comparison group and the relative effect of the intervention (and its 95% CI). | |||||
| GRADE Working Group grades of evidence | |||||
| 1 No serious risk of bias: Trials are generally well conducted and at low risk of bias. 7 No serious risk of bias: This single trial was at low risk of bias. 8 Downgraded by 1 for serious imprecision: Neurological sequelae in adults were uncommon. This trial is underpowered to detect or exclude clinically important differences. | |||||
| Artemether compared with artesunate for treating adults with severe malaria | |||||
| Patient or population: Adults with severe malaria | |||||
| Outcomes | Illustrative comparative risks* (95% CI) | Relative effect | No of participants | Quality of the evidence | |
| Assumed risk | Corresponding risk | ||||
| Artesunate | Artemether | ||||
| Death | 87 per 1000 | 156 per 1000 | RR 1.80 | 494 | ⊕⊕⊕⊝ |
| Coma resolution time | ‐ | ‐ | Not pooled. No significant difference | 494 | ⊕⊕⊕⊝ |
| Neurological sequelae at discharge | ‐ | ‐ | ‐ | 0 | ‐ |
| Parasite clearance time | ‐ | ‐ | Not pooled. No significant difference | 494 | ⊕⊕⊕⊝ |
| Fever clearance time | ‐ | ‐ | Not pooled. No significant difference | 494 | ⊕⊕⊝⊝ |
| *The assumed risk is the median control group risk across studies. The corresponding risk (and its 95% CI) is based on the assumed risk in the comparison group and the relative effect of the intervention (and its 95% CI). | |||||
| GRADE Working Group grades of evidence | |||||
| 1 No serious risk of bias: Trials were generally well conducted and at low risk of bias. | |||||
| Search set | CIDG SR1 | CENTRAL | MEDLINE2 | Embase2 | LILACS2 | ISI Web of Science |
| 1 | malaria | Malaria ti, ab, MeSH | Malaria ti, ab, MeSH | Malaria ti, ab, Emtree | malaria | malaria |
| 2 | artemether | Artemether ti, ab | Artemether ti, ab | Artemether ti, ab, Emtree | artemether | artemether |
| 3 | Artemisinin* | Artemisinin* ti, ab | Artemisinin* ti, ab | Artemisinin* ti, ab | Artemisinin* | Artemisinin* |
| 4 | intramuscular | Intramuscular ti, ab | Intramuscular ti, ab | Intramuscular ti, ab | intramuscular | intramuscular |
| 5 | parenteral | Injections, Intramuscular [MeSH] | Injections, Intramuscular [MeSH] | Intramuscular drug administration [Emtree] | parenteral | parenteral |
| 6 | 2 or 3 | Parenteral ti, ab | Parenteral ti, ab | Parenteral drug administration [Emtree] | 2 or 3 | 2 or 3 |
| 7 | 4 or 5 | 2 or 3 | 2 or 3 | 2 or 3 | 4 or 5 | 4 or 5 |
| 8 | 1 and 5 and 7 | 4 or 5 or 6 | 4 or 5 or 6 | 4 or 5 or 6 | 1 and 5 and 7 | 1 and 5 and 7 |
| 9 | ‐ | 1 and 7 and 8 | 1 and 7 and 8 | 1 and 7 and 8 | ‐ | Randomised clinical trial* |
| 10 | ‐ | ‐ | ‐ | ‐ | ‐ | 8 and 9 |
| 1Cochrane Infectious Diseases Group Specialized Register. | ||||||
| Trial ID | Year of study | Age limits | Quinine dosing schedule | Artemether dosing schedule | ||||
| Loading dose | Maintainance | Follow‐on therapy | Loading dose | Maintainance | Follow‐on therapy | |||
| 2002 | 'Children' | 20 mg/kg IV | 10 mg/kg IV every eight hours for 72 hours | Oral quinine for 7 days | 3.2 mg/kg IM | 1.6 mg/kg IM once daily for 4 days | None | |
| 2007 | 6 months to 12 yrs | 20 mg/kg IV or IM | 10 mg/kg IV/IM every eight hours | None | 3.2 mg/kg IM | 1.6 mg/kg IM once daily for 2 days | None | |
| 2001 | < 14 yrs | 20 mg/kg IV | 10 mg/kg IV every eight hours | Quinine to complete 7 days | 1.6 mg/kg IM twice daily | 1.6 mg/kg IM once daily for 5 days | None | |
| 2004 | 3 months to 15 yrs | 20 mg/kg IV | 10 mg/kg IV every eight hours | Quinine 10 mg/kg every eight hours | 3.2mg/kg IM twice daily | 1.6 mg/kg IM once daily for 4 days | None | |
| 1996 | 5 months to 12 yrs | 20 mg/kg IV | 10 mg/kg IV every eight hours | SP once | 3.2 mg/kg IM | 1.6 mg/kg IM once daily for 4 days | SP once | |
| 1998 | Mean age about 4 yrs | 10 mg/kg IV | 10 mg/kg IV every eight hours | Quinine to complete 7 days | 3.2 mg/kg IM | 1.6 mg/kg IM 12 hrs later, then once daily for 2 days | None | |
| 1999 | 11 months to 5 yrs | 20mg/kg IV | 10mg/kg IV every eight hours | Quinine to complete 7 days | 3.2 mg/kg IM | 1.6 mg/kg IM once daily for 4 days | None | |
| 2009 | 1 to 12yrs | 10 mg/kg IV | 10 mg/kg IV every eight hours | Quinine to complete 7 days | 1.6 mg/kg IM twice daily | 1.6 mg/kg IM once daily for 4 days | None | |
| 1996 | 3 months to 15yrs | 10 mg/kg IV | 10 mg/kg IV every eight hours | Quinine to complete 7 days | 1.6 mg/kg IM twice daily | 1.6 mg/kg IM once daily for 4 days | None | |
| 1994 | Mean age of 3 yrs | 20 mg/kg IV | 10 mg/kg IV every eight hours for at least 2 doses | SP once | 3.2 mg/kg IM | 1.6 mg/kg IM once daily for 2 days at least | SP once | |
| 1994 | 1 to 9yrs | 20 mg/kg IV | 10 mg/kg IV every twelve hours | Quinine to complete 5 days | 3.2 mg/kg IM | 1.6 mg/kg IM once daily for 3 days | SP once1 | |
| 1993 | 1 to 5yrs | 20 mg/kg IV | 10 mg/kg IV every eight hours | Quinine to complete 7 days | 3.2 mg/kg IM | 1.6 mg/kg IM once daily for 4 days | None | |
| IM = intramuscular; IV = intravenous; SP = sulphadoxine‐pyrimethamine. 1Only in the second and third years of the study. | ||||||||
| Trial ID | Year of study | Age limits | Quinine dosing schedule | Artemether dosing schedule | ||||
| Loading dose | Maintainance | Follow‐on therapy | Loading dose | Maintainance | Follow‐on therapy | |||
| 1996 | 15 to 79 yrs | 20 mg/kg IM | 10 mg/kg IM every eight hours | Quinine or mefloquine to complete 7 days | 4 mg/kg IM | 2 mg/kg IM once daily for 4 days | Quinine or mefloquine to complete 7 days | |
| 1991 | 15 to 45 yrs | 20 mg/kg IV | 10 mg/kg every eight hours for 7 days | Quinine to complete 7 days | 160 mg IM | 80 mg IM once daily for 6 days | None | |
| 1994 | 15 to 55 yrs | 20 mg/kg IV | 10 mg/kg every eight hours for 7 days | Quinine to complete 7 days | 160 mg IM | 80 mg IM once daily for 6 days | None | |
| 1995 | > 12 yrs | 20 mg/kg IV | 10 mg/kg IV every eight hours | Quinine to complete 7 days | 3.2 mg/kg IM | 1.6 mg/kg IM once daily for 4 days | None | |
| IM = intramuscular; IV = intravenous. | ||||||||
| Trial ID | Year of study | Age limits | Artemether dosing schedule | Artesunate dosing schedule | ||||
| Loading dose | Maintainance | Follow‐on therapy | Loading dose | Maintainance | Follow‐on therapy | |||
| 2003 | 15 to 77 yrs | 3.2 mg/kg IM | 1.6 mg/kg IM daily | None | 2.4 mg/kg IM | 1.2 mg/kg IM once daily | 2 mg/kg of artesunate to complete 7 days | |
| 1994 | 15 to 66 yrs | 200 mg IM | 100 mg IM once daily for 3 days | Mefloquine once | 120 mg IM or IV | 60 mg IM or IV once daily for 3 days | Mefloquine once | |
| IM = intramuscular; IV = intravenous. | ||||||||
| Trial ID | Coma resolution time | Fever clearance time | Parasite clearance time | Hypoglycaemia |
| Mean value (h) reported and defined as a Blantyre coma score of 5 recorded for at least 24 hours | Mean value (h) reported and defined as the time after which the temperature remained normal (axillary temperature < 37.5°C) | Mean value (h) reported and defined as the time passed from admission and start of treatment until two consecutive negative smears. Blood films repeated every 8 hours. | Number of episodes (n/N) reported but not defined | |
| Proportions with coma resolution on D3 reported but not defined | Proportions with fever clearance on D3 and D14 reported and defined as body temperature ≤ 37.5°C after commencement of treatment | Proportions with parasite clearance on D3 and D14. Parasite clearance was taken as adequate clinical and parasitological response (ACPR) | Not reported | |
| Median value (h) reported and defined as the time to reach a score of 15 on the Glasgow Coma Scale | Median value (h) reported but not defined. | Median value (h) reported and defined as the time to Assessed every 4 hours for the first 24 hours and every 6 hours until three consecutive negative blood smears | Number of episodes (n/N) reported but not defined | |
| Glasgow coma scale was used in grading the level of consciousness of the patients every eight hours | Mean value (h) reported and defined as time to clearance of fever | Mean value (h) reported but not defined | Not reported | |
| Unclear if values reported are means or medians (h) | Mean value (h) reported and defined as time for the temperature to fall below 37.5°C and remain that value for 72 hours | Mean value (h) reported and defined as the time for the parasite count to fall below the level of microscopic detection (thick film) | Not reported | |
| Median value (h) reported and defined as the time taken for the patients to recover completely from unconciousness | Mean value (h) reported and defined as time for the temperature to fall below 37.5°C and remain that value for 72 hours | Median value (h) reported and defined as the time taken for parasite count to fall below the level of microscopic detection (thick film) | Not reported | |
| Mean value (h) reported and defined as the time to normalization of consciousness | Mean value (h) reported but not defined | Mean value (h) reported and defined as time till negative parasitaemia result | Not reported | |
| Median value (h) reported but not described | Median value (h) reported but not described | Median value (h) reported but not described. Every four hours until clearance | Not reported | |
| Mean value (h) reported and defined as the interval between onset of therapy and the attainment of full consciousness | Mean value (h) reported and defined as the interval between the onset of therapy and the time the body temperature is ≤ 37°C and remained so | Defined as two successive thick blood films done at 12 hours interval are negative for asexual forms of plasmodium species | Not reported | |
| Mean value (h) reported and defined as time to regain full consciousness | Mean value (h) reported and defined as the time for temperature to fall below 37.5°C and remain so for at least 48 hours | Mean value (h) reported and defined as the time from start of drug administration to the first of two consecutive negative thick smears remaining negative until day 7 | Not reported | |
| Mean value (h) reported and defined as time to attainment of a Blantyre score of 5 for at least 24 hours from initiation of treatment | Mean value (h) reported but not defined | Mean value (h) reported but not defined. Thick and thin film done on D0 and repeated on Days 3, 7 and 14 | Not reported | |
| Median value (h) reported and defined as time to Glasgow coma score of 15. | Median value (h) reported and defined as the time for temperature to fall below 37.5°C and remain so | Median value (h) reported and defined as the time to clear all parasites | Number of episodes (n/N) reported but not defined | |
| Mean value (h) reported and defined as time to regaining consciousness | Mean value (h) reported and defined as the time for temperature to fall below 37.5°C | Mean value (h) reported and defined as time to clear parasites measured every six hours till clearance | Not reported | |
| Median value (h) reported but not defined | Median value (h) reported and defined as a temperature <37.5 °C on two successive readings | Median value (h) reported and defined as as the time at which the blood films were negative for P. falciparum for at least eight hours | Number of episodes (n/N) reported but not defined | |
| Median value (h) reported and defined as time required for a child to achieve a Blantyre Coma Score of 5 | Median value (h) reported and defined as the time at which the rectal or axillary temperature dropped below 37.5°C and remained < 37.5°C for 24 consecutive hours | Median value (h) reported and defined as the time at which the first of two negative (0 parasites/200 WBC) thick blood films was prepared. Every four hours till clearance | Not reported | |
| Median value (h) reported and defined as time to regain full consciousness | Median value (h) reported and defined as time needed for the rectal temperature to fall below | Median value (h) reported and defined as time needed for all parasites to clear relative to parasite density at admission and assessed every 12 hours till clearance | Number of episodes (n/N) reported and defined as a blood glucose level below 40 mg/dL (2.2 mmol/L) | |
| Median value (h) reported and defined as time to regain full consciousness | Median value (h) reported and defined as time for axillary temperature to fall to, and remain for ≥ 24 hours at 37.5°C or lower | Median value (h) reported and defined as time to clear parasites | Not reported | |
| Mean value (h) reported but not defined | Mean value (h) reported | Mean value (h) reported and defined as the time for parasitaemia to be cleared and to remain so up to Day 7. Assessed every six hours during period of coma and then every 12 hours. | Not reported | |
| WBC = white blood cell. | ||||
| Outcome | Type of test | Proportion in control group3 | Proportion in Intervention group | Estimated RR | Total sample size1,2 |
| Death | Superiority | 0.17 | 0.136 | 0.80 | 3514 |
| Equivalence | 0.17 | 0.14 to 0.204 | ‐ | 6592 | |
| Neurological sequelae | Superiority | 0.25 | 0.20 | 0.80 | 2184 |
| Equivalence | 0.25 | 0.22 to 0.284 | ‐ | 8760 | |
| 1 These calculation were performed using a power calculator available at: http://www.sealedenvelope.com/power/ | |||||
| Outcome | Type of test | Mean in control group3 | Mean in Intervention group4 | SD of outcome | Total sample size1,2 |
| Coma resolution time | Superiority | 25 | 19 | 20 | 350 |
| Equivalence | 25 | 19 to 31 | 20 | 382 | |
| Parasite clearance time | Superiority | 42 | 36 | 20 | 350 |
| Equivalence | 42 | 36 to 48 | 20 | 382 | |
| Fever clearance time | Superiority | 48 | 42 | 20 | 350 |
| Equivalence | 48 | 36 to 54 | 20 | 382 | |
| 1 These calculations were performed using a power calculator available at: http://www.sealedenvelope.com/power/ | |||||
| Pre‐specified outcome | Trial reported outcome | Trial | No. of participants | Artemether | Quinine | Comparative results reported in article |
| Coma resolution time (h) | Median (IQR) | 160 | 12 | 13 | Not significantly different | |
| Median (IQR) | 576 | 26 | 20 | P = 0.046 | ||
| Median (IQR) | 164 | 18 | 20 | Not significantly different | ||
| Coma recovery (%) on Day 3 | 90 | 15.9% | 21.4% | RR = 0.763 (95% CI 0.065 to 9.015) | ||
| Mean (SD) | 32 | 4.5 (13.05) | 9 (24.59) | P = 0.523 | ||
| Mean (SD) | 67 | 30.57 (29.02) | 25.15 (31.62) | P = 0.53 | ||
| Time to hospital discharge | % spending less than one week in hospital | 90 | 61.76% | 71.74% | P = 0.829 | |
| Fever clearance (h) | Median (IQR) | 160 | 32 | 32 | Not significantly different | |
| 576 | 30 | 33 | P = 0.8 | |||
| 164 | 31 | 45 | "Significant" | |||
| Fever clearance (%) on Day 3 | 90 | 90.0% | 87.7% | P = 0.753 | ||
| Parasite clearance (h) | Median (IQR) | 160 | 39.5 | 48 (37 to 56) | P < 0.001 | |
| 576 | 48 | 60 | P < 0.001 | |||
| 164 | 32 | 40 | 'significant' | |||
| Parasite clearance (%) on Day 3 | 90 | 99.0% n = 44 | 96.8% n = 46 | P = 0.422 | ||
| Needing blood transfusion | ‐ | ‐ | ‐ | ‐ | "The two groups were similar in terms of the need for blood transfusions,and the incidence of secondary bacterial infections (data not shown)." | |
| IQR = interquartile range. | ||||||
| Study ID | Sample size | Clinical symptoms monitoring | Biochemistry | Haematological | Electrocardiogram | Additional comments on adverse events |
| 41 | Not reported | Not reported | Not reported | Not reported | "Neurological deficits were not observed in any patient during the follow‐up period" | |
| 90 | Not reported | Not reported | Not reported | Not reported | None | |
| 560 | Clinical assessment every 4 hours for the first 24 hours and 6 hourly afterwards | Blood glucose, lactate and cytokine levels measured 4, 8, 12 and 24 hours after admission | Full blood count on admission | Pre‐treatment and 12 hours after initiation of treatment on Day 0, 4 hours after last dose and at discharge | None | |
| 46 | Lumbar puncture Chest x‐ray on day 0 | Blood Glucose, Renal Function Test, Liver Function Test and Serum Electrolyte on Days 0 and 3 | Full Blood Count on Days 0 and 3 | Day 0 | "No serious side effects of either of the drugs were observed in our study...... Closer and more frequent monitoring and larger sample size would have probably revealed more subtle adverse drug effects." | |
| 26 | Clinical evaluation daily for at least 7 days Lumbar puncture Chest x‐ray on day 0 | Biochemistry on Days 0, 2, 4 and 7 | Full Blood Count on Days 0, 2, 4 and 7 | On admission for all patients; then once daily and every six hours for quinine and artemether patients respectively | "The side effects in the quinine group were dizziness and vertigo. No side effects were detected with artemether". | |
| 102 | Clinical evaluation on admission and twice daily for at least 7 days Lumbar puncture Chest x‐ray on day 0 | Biochemistry on Days 0, 2, 4 and 7 | FBC on Days 0, 2, 4 and 7 | On admission for all patients; then once daily and every six hours for quinine and artemether patients respectively | QTc prolongation and tinnitus were the major adverse events in Quinine arm. Mild transient pain at injection site for approximately 15 mins after artemether treatment. | |
| 67 | Clinical examination daily on Days 1 to7, and 14 | Blood glucose on Days 1, 2, 3, 5, 7 and 14 Urea and Serum Electrolyte, transaminases, phosphatases on Days 1, 3, 5, 7 and 14 | FBC on Days 1, 3, 5, 7 and 14 | Once daily on Days 1, 3, 5, 7 and 14 | None | |
| 160 | Clinical assessment on admission, then at six, then 12 hour intervals till discharge | Blood glucose, urea, electrolytes, blood gases and when clinically indicated | FBC on Day 0 and when clinically indicated Blood cultures on Day 0 | On admission and at 6, 24, 30, 48 and 54 hours | None | |
| 37 | Clinical assessment on Day 0 | Urea and electrolyte Blood sugar and liver function test on Day 0 | FBC on Day 0 | None | None | |
| 103 | Clinical assessments on Days 0, 3, 7, 14, 28 | Blood glucose, Urea and creatinine, electrolytes on Days 0, 3, 7, 14, 28 | WBC count on Days 0, 3, 7, 14, 28 | None | "No adverse reactions to the two drugs were recorded during the study". | |
| 32 | Clinical examination on Days 0 to 7 and 14 | None | None | None | None | |
| 370 | Clinical examination on admission Chest x‐ray on admission Lumbar puncture | Blood urea nitrogen, serum creatinine, aspartate aminotransferase, alanine transaminase, plasma lactate | Full blood count on admission | None | None | |
| 77 | Clinical evaluation on admission and every six hours on Days 0 to 4, and then once daily on Days 14, 21 and 28 | Blood glucose, serum creatinine, serum aspartate, aminotransferase on Day 0 | WBC, Haemoglobin on Days 0 and 3 | None | None | |
| 33 | Chest X‐ray on admission | Renal and Liver function tests on admission, Days 3 and 7 | Full Blood Count on Days 0, 3 and 7 | None | None | |
| 183 | CSF collected on admission | Blood glucose, Blood pH, on D0 (every four hours for the first 24 hours | Haematocrit every eight hours Full Blood Count, urea and electrolytes on Days 0, 3, 7 and 28 | On admission, 6, 48,54 and 96 hours | "Of the initial 127 patients on whom serial electrocardiographic tracings were made, more patients in the quinine group | |
| 576 | Clinical examination on Day 0 Lumbar puncture on admission | Blood glucose on admission, after 4hours and 12 hours | PCV, Haemoglobin, Blood culture on Day 0 | None | None | |
| 124 | Clinical examination on admission | Blood glucose, serum creatinine, serum bilirubin on admission | Full blood count on admission | None | None | |
| 54 | Clinical examination twice daily Spinal taps | Urea and Electrolyte, on days 3, 7, 14, 28 | PCV on days 3, 7, 14, 28 | On admission, at 4 and 6 hours | None |
| Pre‐specified outcome | Trial reported outcome | Trial | No. of participants | Artemether | Quinine | Comparative results reported in article |
| Coma resolution time (h) | Median (IQR) | 560 | 66 (30 to 132) | 48 (20 to 84) | P = 0.003 | |
| Median (Range) | 97 | 48 (6 to 144) | 48 (6 to 144) | Not significantly different | ||
| Fever clearance (h) | Median (IQR) | 560 | 127 (60 to 216) | 90 (54 to 144) | < 0.001 | |
| Median (Range) | 33 | 32 (20 to 112) | 48 (28 to 88) | P = 0.034 | ||
| Median (Range) | 97 | 79 (16 to 147) | 84 (36 to 144) | Not significantly different | ||
| Parasite clearance (h) | Median (IQR) | 560 | 72 (54 to 102) | 90 (66 to 108) | < 0.001 | |
| Median (range) | 33 | 48(4 to 72) | 52 (12 to112) | P = 0.381 | ||
| Median (Range) | 97 | 54 (30 to 164) | 78 (18 to 168) | P = 0.007 | ||
| IQR = interquartile range. | ||||||
| Pre‐specified outcome | Trial reported outcome | Trial | No. of participants | Artemether | Artesunate IM | Artesunate IV | Comparative results reported in article |
| Coma resolution time (h) | Median (range) | 370 | 72(2 to 2232) n = 184 | 60(4 to 2136) n = 186 | ‐ | P = 0.11 | |
| Median (95% CI) | 124 | 47 (31 to 63) | 30 (18 to 42) | 24 (4 to 44) | ‐ | ||
| Fever clearance (h) | Median (range) | 370 | 108 (0 to 888) n = 184 | 108 (0 to 888) n = 186 | ‐ | P = 0.27 | |
| Median (95% CI) | 124 | 48 (38 to 58) | 36 (30 to 42) | 30 (18 to 42) | ‐ | ||
| Parasite clearance (h) | Median (range) | 370 | 72 (2 to 204) | 72 (7 to 330) | ‐ | P = 0.97 | |
| Median (95% CI) | 124 | 30 (26 to 34) | 24 (15 to 33) | 24 (15 to 33) | Not statistically significant | ||
| IM = intramuscular; IV = intravenous. | |||||||
| Outcome or subgroup title | No. of studies | No. of participants | Statistical method | Effect size |
| 1 Death Show forest plot | 16 | Risk Ratio (M‐H, Fixed, 95% CI) | Subtotals only | |
| 1.1 Children | 12 | 1447 | Risk Ratio (M‐H, Fixed, 95% CI) | 0.96 [0.76, 1.20] |
| 1.2 Adults | 4 | 716 | Risk Ratio (M‐H, Fixed, 95% CI) | 0.59 [0.42, 0.83] |
| 2 Death: Time since admission to hospital Show forest plot | 1 | Risk Ratio (M‐H, Fixed, 95% CI) | Subtotals only | |
| 2.1 Death within 24 hours | 1 | 41 | Risk Ratio (M‐H, Fixed, 95% CI) | 0.35 [0.02, 8.10] |
| 3 Coma resolution time (hours) Show forest plot | 6 | Mean Difference (IV, Fixed, 95% CI) | Subtotals only | |
| 3.1 Children | 6 | 358 | Mean Difference (IV, Fixed, 95% CI) | ‐5.45 [‐7.90, ‐1.00] |
| 4 Neurological sequelae at discharge Show forest plot | 8 | Risk Ratio (M‐H, Fixed, 95% CI) | Subtotals only | |
| 4.1 Children | 7 | 968 | Risk Ratio (M‐H, Fixed, 95% CI) | 0.84 [0.66, 1.07] |
| 4.2 Adults | 1 | 560 | Risk Ratio (M‐H, Fixed, 95% CI) | 2.92 [0.31, 27.86] |
| 5 Neurological sequelae at follow‐up Show forest plot | 2 | 566 | Risk Ratio (M‐H, Fixed, 95% CI) | 0.82 [0.49, 1.38] |
| 5.1 Day 7 | 1 | 134 | Risk Ratio (M‐H, Fixed, 95% CI) | 0.76 [0.27, 2.14] |
| 5.2 Day 28 | 1 | 432 | Risk Ratio (M‐H, Fixed, 95% CI) | 0.84 [0.46, 1.53] |
| 6 Parasite clearance time Show forest plot | 8 | 446 | Mean Difference (IV, Fixed, 95% CI) | ‐8.82 [‐11.20, ‐6.45] |
| 6.1 Children | 7 | 420 | Mean Difference (IV, Fixed, 95% CI) | ‐9.03 [‐11.43, ‐6.63] |
| 6.2 Adults | 1 | 26 | Mean Difference (IV, Fixed, 95% CI) | 1.70 [‐15.56, 18.96] |
| 7 Proportion with parasite clearance Show forest plot | 1 | 74 | Risk Ratio (M‐H, Fixed, 95% CI) | 0.88 [0.75, 1.04] |
| 7.1 At 72 hours | 1 | 37 | Risk Ratio (M‐H, Fixed, 95% CI) | 0.88 [0.70, 1.11] |
| 7.2 At 7 days | 1 | 37 | Risk Ratio (M‐H, Fixed, 95% CI) | 0.88 [0.70, 1.11] |
| 8 Fever clearance time (hours) Show forest plot | 9 | Mean Difference (IV, Fixed, 95% CI) | Subtotals only | |
| 8.1 Children | 8 | 457 | Mean Difference (IV, Fixed, 95% CI) | ‐3.73 [‐6.55, ‐0.92] |
| 8.2 Adults | 1 | 26 | Mean Difference (IV, Fixed, 95% CI) | ‐29.70 [‐54.14, ‐5.26] |
| 9 Need for blood transfusion Show forest plot | 2 | Risk Ratio (M‐H, Fixed, 95% CI) | Subtotals only | |
| 9.1 Children | 1 | 103 | Risk Ratio (M‐H, Fixed, 95% CI) | 1.27 [0.62, 2.59] |
| 9.2 Adults | 1 | 560 | Risk Ratio (M‐H, Fixed, 95% CI) | 0.97 [0.73, 1.29] |
| 10 Episodes of hypoglycaemia Show forest plot | 3 | Risk Ratio (M‐H, Fixed, 95% CI) | Subtotals only | |
| 10.1 Children | 2 | 617 | Risk Ratio (M‐H, Fixed, 95% CI) | 0.68 [0.44, 1.05] |
| 10.2 Adults | 1 | 560 | Risk Ratio (M‐H, Fixed, 95% CI) | 0.44 [0.30, 0.64] |
| 11 Adverse events Show forest plot | 6 | Risk Ratio (M‐H, Fixed, 95% CI) | Subtotals only | |
| 11.1 QT prolongation | 2 | 229 | Risk Ratio (M‐H, Fixed, 95% CI) | 3.10 [1.33, 7.19] |
| 11.2 Local skin reactions | 1 | 576 | Risk Ratio (M‐H, Fixed, 95% CI) | 0.12 [0.03, 0.50] |
| 11.3 Abscess | 2 | 1136 | Risk Ratio (M‐H, Fixed, 95% CI) | 0.20 [0.04, 0.90] |
| 11.4 Urticarial rash | 1 | 576 | Risk Ratio (M‐H, Fixed, 95% CI) | 0.33 [0.01, 8.15] |
| 11.5 Supraventricular tachycardia | 1 | 54 | Risk Ratio (M‐H, Fixed, 95% CI) | 0.23 [0.01, 4.59] |
| 11.6 Pruritus | 1 | 67 | Risk Ratio (M‐H, Fixed, 95% CI) | 0.34 [0.01, 8.13] |
| 11.7 Urinary tract infection | 1 | 54 | Risk Ratio (M‐H, Fixed, 95% CI) | 3.46 [0.15, 81.36] |
| 11.8 Induration at injection site | 1 | 33 | Risk Ratio (M‐H, Fixed, 95% CI) | 15.44 [0.94, 253.49] |
| 11.9 Leg discomfort | 1 | 560 | Risk Ratio (M‐H, Fixed, 95% CI) | 0.69 [0.22, 2.16] |
| 11.10 Chest infection | 1 | 560 | Risk Ratio (M‐H, Fixed, 95% CI) | 1.11 [0.81, 1.53] |
| 11.11 GI bleeding | 1 | 560 | Risk Ratio (M‐H, Fixed, 95% CI) | 0.79 [0.52, 1.20] |
| Outcome or subgroup title | No. of studies | No. of participants | Statistical method | Effect size |
| 1 Death Show forest plot | 2 | Risk Ratio (M‐H, Fixed, 95% CI) | Subtotals only | |
| 1.1 Adults | 2 | 494 | Risk Ratio (M‐H, Fixed, 95% CI) | 1.80 [1.09, 2.97] |
| 2 Need for blood transfusion Show forest plot | 1 | Risk Ratio (M‐H, Fixed, 95% CI) | Subtotals only | |
| 2.1 Adults | 1 | 370 | Risk Ratio (M‐H, Fixed, 95% CI) | 1.01 [0.78, 1.32] |
| 3 Episodes of hypoglycaemia Show forest plot | 1 | Risk Ratio (M‐H, Fixed, 95% CI) | Totals not selected | |
| 4 Adverse events Show forest plot | 1 | Risk Ratio (M‐H, Fixed, 95% CI) | Totals not selected | |
| 4.1 Spontaneous bleeding | 1 | Risk Ratio (M‐H, Fixed, 95% CI) | 0.0 [0.0, 0.0] | |