Pengurusan surgikal berbanding bukan surgikal untuk empiema pleural
Abstract
Background
Empyema refers to pus in the pleural space, commonly due to adjacent pneumonia, chest wall injury, or a complication of thoracic surgery. A range of therapeutic options are available for its management, ranging from percutaneous aspiration and intercostal drainage to video‐assisted thoracoscopic surgery (VATS) or thoracotomy drainage. Intrapleural fibrinolytics may also be administered following intercostal drain insertion to facilitate pleural drainage. There is currently a lack of consensus regarding optimal treatment.
Objectives
To assess the effectiveness and safety of surgical versus non‐surgical treatments for complicated parapneumonic effusion or pleural empyema.
Search methods
We searched the Cochrane Central Register of Controlled Trials (CENTRAL) (2016, Issue 9), MEDLINE (Ebscohost) (1946 to July week 3 2013, July 2015 to October 2016) and MEDLINE (Ovid) (1 May 2013 to July week 1 2015), Embase (2010 to October 2016), CINAHL (1981 to October 2016) and LILACS (1982 to October 2016) on 20 October 2016. We searched ClinicalTrials.gov and WHO International Clinical Trials Registry Platform for ongoing studies (December 2016).
Selection criteria
Randomised controlled trials that compared a surgical with a non‐surgical method of management for all age groups with pleural empyema.
Data collection and analysis
Two review authors independently assessed trials for inclusion and risk of bias, extracted data, and checked the data for accuracy. We contacted trial authors for additional information. We assessed the quality of the evidence using the GRADE approach.
Main results
We included eight randomised controlled trials with a total of 391 participants. Six trials focused on children and two on adults. Trials compared tube thoracostomy drainage (non‐surgical), with or without intrapleural fibrinolytics, to either VATS or thoracotomy (surgical) for the management of pleural empyema. Assessment of risk of bias for the included studies was generally unclear for selection and blinding but low for attrition and reporting bias. Data analyses compared thoracotomy versus tube thoracostomy and VATS versus tube thoracostomy. We pooled data for meta‐analysis where appropriate. We performed a subgroup analysis for children along with a sensitivity analysis for studies that used fibrinolysis in non‐surgical treatment arms.
The comparison of open thoracotomy versus thoracostomy drainage included only one study in children, which reported no deaths in either treatment arm. However, the trial showed a statistically significant reduction in mean hospital stay of 5.90 days for those treated with primary thoracotomy. It also showed a statistically significant reduction in procedural complications for those treated with thoracotomy compared to thoracostomy drainage. We downgraded the quality of the evidence for length of hospital stay and procedural complications outcomes to moderate due to the small sample size.
The comparison of VATS versus thoracostomy drainage included seven studies, which we pooled in a meta‐analysis. There was no statistically significant difference in mortality or procedural complications between groups. This was true for both adults and children with or without fibrinolysis. However, mortality data were limited: one study reported one death in each treatment arm, and seven studies reported no deaths. There was a statistically significant reduction in mean length of hospital stay for those treated with VATS. The subgroup analysis showed the same result in adults, but there was insufficient evidence to estimate an effect for children. We could not perform a separate analysis for fibrinolysis for this outcome because all included studies used fibrinolysis in the non‐surgical arms. We downgraded the quality of the evidence to low for mortality (due to wide confidence intervals and indirectness), and moderate for other outcomes in this comparison due to either high heterogeneity or wide confidence intervals.
Authors' conclusions
Our findings suggest there is no statistically significant difference in mortality between primary surgical and non‐surgical management of pleural empyema for all age groups. Video‐assisted thoracoscopic surgery may reduce length of hospital stay compared to thoracostomy drainage alone.
There was insufficient evidence to assess the impact of fibrinolytic therapy.
A number of common outcomes were reported in the included studies that were not directly examined in our primary and secondary outcomes. These included duration of chest tube drainage, duration of fever, analgesia requirement, and total cost of treatment. Future studies focusing on patient‐centred outcomes, such as patient functional scores, and other clinically relevant outcomes, such as radiographic improvement, treatment failure rates, and amount of fluid drainage, are needed to inform clinical decisions.
PICO
Ringkasan bahasa mudah
Rawatan surgikal berbanding bukan surgikal untuk nanah di ruang sekitar paru‐paru.
Soalan sorotan
Kami menyiasat jika terdapat perbezaan hasil dalam kalangan pesakit yang membentuk nanah di ruang sekitar paru‐paru (empiema) yang dirawat secara surgikal berbanding dengan mereka yang dirawat secara bukan surgikal. Kami melihat perbezaan‐perbezaan dalam perkadaran kanak‐kanak dan orang dewasa yang mandiri, tempoh di dalam hospital, dan komplikasi rawatan.
Latar belakang
Nanah boleh terbentuk dalam ruang di sekitar paru‐paru berikutan pneumonia, komplikasi trauma dinding dada, atau surgeri. Pembahagi pepejal yang dipanggil lokulasi boleh terbentuk dalam nanah tersebut. Jangkitan ini biasanya tidak sembuh dengan rawatan antibiotik sahaja.
Terdapat beberapa jenis rawatan surgikal dan bukan surgikal. Rawatan bukan surgikal termasuklah penyaliran nanah melalui jarum yang dimasukkan melalui dinding dada (torasentesis) atau memasukkan tiub melalui dinding dada untuk menyalirkan jangkitan (torakostomi).Jika tiub dimasukkan ke dalam dada, ubat‐ubat boleh disuntik ke dalam ruang di sekitar paru‐paru untuk memecahkan pembahagi‐pembahagi tersebut. Ini dipanggil fibrinolisis. Rawatan bukan surgikal boleh mendatangkan kemudaratan, seperti kemasukan udara ke dalam ruang di sekitar paru‐paru, kerosakan tisu dada, atau paru‐paru dipenuhi bendalir ketika mengembang semula. Rawatan surgikal melibatkan pembukaan kaviti dada dan membersihkan jangkitan (torakotomi), atau pembersihan jangkitan melalui insisi kecil pada dinding dada dengan bantuan kamera, dikenali sebagai surgeri torakoskopik dengan bantuan video (video‐assisted thoracoscopic surgery (VATS). Tiub dada boleh menyalirkan bendalir yang terkumpul selepas surgeri. Risiko surgeri termasuklah udara dalam ruang di sekitar paru‐paru, sakit tulang rusuk, dan komplikasi anestetik.
Tarikh carian
Bukti‐bukti adalah terkini sehingga Oktober 2016.
Ciri‐ciri kajian
Kami memasukkan lapan kajian dengan jumlah 391 peserta. Enam daripada kajian tersebut melibatkan kanak‐kanak, manakala dua kajian melibatkan orang dewasa. Kajian‐kajian tersebut membandingkan penyaliran melalui tiub dada (bukan surgikal), dengan atau tanpa fibrinolisis, dengan salah satu daripada VATS atau torakotomi (surgikal).
Sumber dana kajian
Dua kajian mengisytiharkan tiada kepentingan konflik kewangan; enam kajian lagi tidak melaporkan sumber dana.
Keputusan utama
Tiada perbezaan dalam perkadaran pesakit pada semua umur yang mandiri empiema selepas rawatan surgikal atau bukan surgikal. Namun, dapatan ini berdasarkan data yang terhad: satu kajian melaporkan satu kematian bagi setiap opsyen rawatan, manakala tujuh yang lain melaporkan tiada kematian.Tidak terdapat perbezaan dalam kadar komplikasi antara pesakit yang dirawat secara surgikal dan bukan surgikal.
Terdapat bukti terhad untuk mencadangkan VATS mengurangkan tempoh tinggal di hospital berbanding rawatan bukan surgikal.
Kualiti bukti
Secara keseluruhan kualiti bukti adalah sederhana. Limitasi utama adalah kekurangan bilangan kajian dalam setiap analisis dan ketakkonsistenan antara kajian.
Authors' conclusions
Summary of findings
| Open thoracotomy compared to thoracostomy drainage for pleural empyema | ||||||
| Patient or population: children with pleural empyema | ||||||
| Outcomes | Anticipated absolute effects* (95% CI) | Relative effect | № of participants | Quality of the evidence | Comments | |
| Thoracostomy drainage | Open thoracotomy | |||||
| Mortality Follow‐up: up to 3 months after discharge | Risk in study population | Not estimable | 30 | ⊕⊕⊕⊝ | No deaths occurred in either group. | |
| — | — | |||||
| Length of hospital stay (days) Follow‐up: up to 3 months after discharge | The mean length of hospital stay in the control group was 15.4 days. | The mean length of hospital stay in the intervention group was 5.9 days fewer (7.29 fewer to 4.51 fewer). | — | 30 | ⊕⊕⊕⊝ | |
| Procedural complications Follow‐up: up to 3 months after discharge | Risk in study population | OR 0.10 | 30 | ⊕⊕⊕⊝ | ||
| 600 per 1000 | 130 per 1000 | |||||
| *The risk in the intervention group (and its 95% confidence interval) is based on the assumed risk in the comparison group and the relative effect of the intervention (and its 95% CI). | ||||||
| GRADE Working Group grades of evidence | ||||||
| 1Downgraded one level due to small sample size and only one study. | ||||||
| VATS compared to thoracostomy drainage for pleural empyema | ||||||
| Patient or population: children and adults with pleural empyema | ||||||
| Outcomes | Anticipated absolute effects* (95% CI) | Relative effect | № of participants | Quality of the evidence | Comments | |
| Thoracostomy drainage | VATS | |||||
| Mortality | Risk in study population | OR 0.80 | 361 | ⊕⊕⊝⊝ | Data only for adults | |
| 6 per 1000 | 5 per 1000 | |||||
| Mortality: children | Risk in study population | Not estimable | 271 | ⊕⊕⊕⊝ | No deaths occurred in either group. | |
| Not pooled | Not pooled | |||||
| Mortality: adults Follow‐up: not reported | Risk in study population | OR 0.80 | 90 | ⊕⊕⊕⊝ | No deaths occurred in Bilgin 2006. Data based on Wait 1997 | |
| 23 per 1000 | 18 per 1000 | |||||
| Length of hospital stay (days) Follow‐up: 1 year in Cobanoglu 2011 and 3 months in Marhuenda 2014 | Control group | The mean length of hospital stay in the intervention group was 2.52 days fewer (4.26 fewer to 0.77 fewer). | — | 231 | ⊕⊕⊕⊝ | Note: Follow‐up period not reported in Kurt 2006; Peter 2009; Wait 1997. |
| Procedural complications Follow‐up: 6 months in Bilgin 2006 and not reported in Wait 1997 | Risk in study population | OR 0.46 | 271 | ⊕⊕⊕⊝ | ||
| 23 per 1000 | 11 per 1000 | |||||
| *The risk in the intervention group (and its 95% confidence interval) is based on the assumed risk in the comparison group and the relative effect of the intervention (and its 95% CI). | ||||||
| GRADE Working Group grades of evidence | ||||||
| 1Downgraded two levels due to wide confidence intervals (data from only one study) and indirectness (data only available for adults). | ||||||
Background
Description of the condition
Empyema refers to pus in the pleural space. The pathogenesis of empyema is not well understood, but it is hypothesised to be caused by transmigration of bacteria into the pleural space, most commonly from adjacent lung infection or pneumonia. Other potential causes include penetrating chest wall injuries and thoracic procedures (Ferguson 1996). Approximately 20% to 57% of people with pneumonia develop a parapneumonic effusion, of whom some can progress to pleural empyema (Sahn 2007). Progression of the condition begins with the exudative stage characterised by a shift of pulmonary interstitial fluid into the pleural space from an increased capillary permeability. The second is the fibropurulent stage, where the pleural space becomes infected and loculation (development of separate cavities) occurs. Lastly, organisation of the chronic inflammation results in proliferation of fibroblasts and a thickening of the pleural space, known as a pleural peel, which can be seen on imaging (Light 2006).
Clinically, the three stages can be referred to as uncomplicated parapneumonic effusion (UPPE), complicated parapneumonic effusion (CPPE), and pleural empyema, respectively. Uncomplicated parapneumonic effusion usually resolves with antibiotic therapy alone, but CPPE and empyema require additional interventions. The laboratory diagnosis of CPPE can be made with any one of the following pleural fluid features: positive bacterial studies, glucose level below 60 mg/dL, pH below 7.20, or lactate dehydrogenase (LDH) more than three times the upper normal limit for serum (Light 2006). Medical imaging examination findings of pleural loculations and septations on ultrasound, or pleural thickening and enhancement on computed tomography (CT), can also suggest the diagnosis; however, the definitive diagnosis is a positive culture (Sahn 2007).
This review examined the available evidence for the various treatments of CPPE and empyema. We compared outcomes from surgical and non‐surgical methods of treatment with the aim of determining what constitutes the optimal strategy for management.
Description of the intervention
Surgical interventions include video‐assisted thoracoscopic surgery (VATS) or open thoracotomy (Appendix 1). Non‐surgical management includes thoracentesis and insertion of a chest tube (thoracostomy), with or without the use of intrapleural fibrinolytics (Appendix 1). Descriptions of interventions follow.
Surgical management
Video‐assisted thoracoscopic surgery (VATS) (Appendix 1) enables visualisation of the pleural cavity for drainage of pus and disruption of septations. A temporary chest tube is left in place for postoperative drainage of any re‐accumulated effusions (Light 2006). Open thoracotomy involves surgical exploration of the pleural space and drainage of the empyema (Light 2006). Complications of both VATS and thoracotomy include postoperative pneumothorax, intercostal neuralgia, and associated anaesthetic risks (Yim 1996). Postoperative complications and longer recovery periods are associated with open thoracotomy (Jaffé 2003), hence VATS is the more commonly performed surgical procedure for empyema. Nonetheless, thoracotomy may be the initial choice in select cases, or alternatively, VATS may be converted to open thoracotomy if necessary (Lardinois 2005).
Non‐surgical management
Non‐surgical management of empyema includes thoracentesis and chest tube insertion (thoracostomy). Thoracentesis involves aspirating the pleural fluid through a percutaneously inserted catheter, which can be performed under ultrasound or CT guidance. Potential complications from this procedure include haemothorax, pneumothorax, catheter malposition, and bronchopleural fistula (Jones 2003). Chest tube insertion involves dissection of a small area of the chest wall muscle and the placement of a chest tube (Oddel 1994). Duration of treatment is usually no longer than 7 to 10 days or when drainage is minimal, as guided by evidence from clinical tests or radiographic images, or both, of empyema resolution (Oddel 1994). In patients not responding to treatment or who require a prolonged period of chest tube placement, surgical intervention may be considered. Complications associated with tube thoracostomy include chest tube malposition, tissue trauma, and re‐expansion pulmonary oedema (Miller 1987).
Intrapleural fibrinolysis initially used a combination of streptokinase and streptodornase and is an adjunct to chest tube drainage to facilitate fibrinolysis of loculations (Tillett 1951). Side effects due to impurities led to a decline in its use, but the availability of a more purified form and successful trial of urokinase have led to a re‐appraisal of this modality (Aye 1991; Temes 1996). More recently, a 2008 Cochrane review concluded that intrapleural fibrinolytic therapy conferred significant benefit in reducing the requirement for surgical interventions (Cameron 2008); however, when subgroup analysis was performed on high‐quality trials, the benefit was not significant.
How the intervention might work
A cornerstone of the management of patients with severe infection is source control. This refers to interventions which aim to control the foci of infections (Marshall 2009). There is a long history of the recognition that draining empyema is beneficial, dating back to the time of Hippocrates (Cameron 2008). However, during the progression of empyema there is a tendency for the formation of loculations (separate cavities) and adhesions which may limit the effectiveness of drainage (Light 1985). It is hypothesised that surgical intervention or the addition of intrapleural fibrinolytics to thoracostomy drainage may reduce the impact of loculations and adhesions on the drainage of empyema.
Why it is important to do this review
The British Thoracic Society pleural disease guidelines recommend that patients found to have a significant pleural collection associated with pneumonia should have a diagnostic pleural fluid aspirate performed (Davies 2010). Patients found to have CPPE or empyema would then have chest tube drainage along with appropriate antibiotic therapy. Patients who subsequently have persistent sepsis and pleural collection despite chest tube drainage and antibiotics should be referred for surgical management. However, some institutions proceed directly to surgical management if the initial pleural fluid aspirate is thick pus or there are extensive loculations present on imaging. There is currently no clear consensus as to which patients benefit from primary surgical intervention versus non‐surgical management.
An earlier Cochrane review concluded that there were insufficient large trials to suggest a preference for any particular intervention (Coote 2005). This review aimed to reconcile the issue by comparing the results of surgical and non‐surgical therapies for the treatment of CPPE and empyema, thereby providing clinicians with best evidence for management.
Objectives
To assess the effectiveness and safety of surgical versus non‐surgical treatments for CPPE or pleural empyema.
Methods
Criteria for considering studies for this review
Types of studies
Randomised controlled trials (RCTs) and quasi‐RCTs comparing any surgical intervention to any non‐surgical intervention for the management of CPPE or pleural empyema were eligible for inclusion.
Types of participants
Participants of all ages and either gender with diagnosis of CPPE or empyema. Analysis of pleural aspirates or medical imaging examinations, such as ultrasound or CT, can be used to confirm the diagnosis of CPPE or empyema. The diagnosis of CPPE requires either positive pleural fluid biochemistry (pH < 7.2, glucose < 2.2 mM/L, LDH > 1000 IU/L), confirmation of loculation on imaging examination, or positive culture or gram stain from pleural aspirate. Pus aspirated from the pleural space is indicative of pleural empyema.
Exclusion criteria were any contraindications to either surgery, minimally invasive procedures, or to the fibrinolytic agent. We excluded tuberculous empyemas because of the different clinical presentation, associated severe complications, and poorer outcomes (Chapman 2004; Kundu 2010). We also excluded participants who were immunocompromised or had underlying malignancy (Kaifi 2012). We excluded participants with comorbid conditions who would have required hospitalisation beyond the course of the empyema.
Types of interventions
Surgical interventions
-
Video‐assisted thoracoscopy (VATS).
-
Open thoracotomy.
Comparator: procedural management
-
Thoracocentesis.
-
Chest tube insertion.
We included interventions with or without intrapleural fibrinolytics in the review.
Types of outcome measures
Primary outcomes
-
Mortality.
Secondary outcomes
-
Length of hospital stay (days).
-
Procedural complications.
Search methods for identification of studies
Electronic searches
We searched the Cochrane Central Register of Controlled Trials (CENTRAL, to Issue 9, 2016), part of the Cochrane Library,www.cochranelibrary.com (accessed 19 October 2016), which includes the Cochrane Acute Respiratory Infections Group's Specialised Register, MEDLINE (Ebscohost) (1946 to October 2016), MEDLINE (Ovid) (from 1 May 2013 to July week 1 2015), Embase (2010 to October 2016), CINAHL (Cumulative Index to Nursing and Allied Health Literature) (1981 to October 2016), and LILACS (Latin American and Caribbean Health Sciences Literature) (1982 to October 2016).
We searched CENTRAL and MEDLINE using the search strategy in Appendix 2. The MEDLINE search was combined with the Cochrane highly sensitive search for identifying randomised trials in MEDLINE; sensitivity‐ and precision‐maximising version (2008 revision); Ovid format (Lefebvre 2011). We adapted this search strategy to search Embase (Appendix 3), CINAHL (Appendix 4), and LILACS (Appendix 5). There were no language, publication year, or publication status restrictions on searching.
Searching other resources
We handsearched reference lists of identified publications for additional trials, either published or unpublished, and contacted trial authors where necessary. We searched ClinicalTrials.gov (clinicaltrials.gov/) and the World Health Organization International Clinical Trials Registry Platform (WHO ICTRP) (www.who.int/ictrp/en/) for ongoing trials or trials which may have been published and were missed, on 21 December 2016.
Data collection and analysis
Selection of studies
Two review authors (TC, MR) independently assessed the studies obtained from the searches to determine eligibility. We assessed the full text of studies where abstracts were unavailable. Two review authors (TC, MR) independently assessed the retrieved trials for compliance with the inclusion and exclusion criteria. A third review author (MVD) was available to resolve any disagreements by acting as an arbiter.
Data extraction and management
We designed a standardised data extraction sheet. Two review authors (TC, MR) independently extracted data. A third review author (MVD) was available to act as an arbiter in case of disagreements. Two review authors (TC, MR) entered data into Review Manager 5 (RevMan 2014). One review author (MVD) was available to act as arbiter.
Assessment of risk of bias in included studies
Two review authors (TC, MR) independently assessed included studies for risk of bias using the criteria outlined in the Cochrane Handbook for Systematic Reviews of Interventions (Higgins 2011). We assessed the following domains for each study and deemed them to be low risk, high risk, or unclear risk.
Random sequence generation
-
Low risk: allocation was generated by a computer or random number table algorithm.
-
High risk: any non‐random sequence generation, e.g. dates, names, or identification numbers.
-
Unclear risk: sequence generation not mentioned.
Allocation concealment
-
Low risk: the process used a telephone or central allocation system or sealed, opaque envelopes to prevent participant recruiters, investigators, and participants from knowing the intervention allocation.
-
High risk: other methods of allocation concealment, e.g. open random allocation, unsealed or non‐opaque envelopes, date of birth.
-
Unclear risk: method of allocation concealment not mentioned.
Blinding of participants and outcome assessors
-
Low risk: blinding was performed adequately, or the outcome measurement is not likely to be influenced by lack of blinding.
-
High risk: no blinding or incomplete blinding, and the outcome or the outcome measurement is likely to be influenced by lack of blinding.
-
Unclear risk: there is insufficient information to assess whether the type of blinding used is likely to induce bias in the estimate of effect.
Incomplete outcome data
-
Low risk: there are no missing outcome data; the reasons for missing outcome data were unlikely to be related to a true outcome; or the missing outcome data were balanced in numbers or reasons across intervention groups.
-
High risk: there are missing outcome data that are likely to be related to the true outcome or there is an imbalance in numbers or reasons for missing data across intervention groups.
-
Unclear risk: there are incomplete outcome data that are not addressed.
Selective reporting
-
Low risk: the trial protocol is available and all of the trial's prespecified outcomes that are of interest in the review have been reported.
-
High risk: not all of the prespecified primary outcomes of the trial have been reported.
-
Unclear risk: there is insufficient information to assess whether the magnitude and direction of the observed effect is related to selective outcome reporting.
Other bias
For each study we described any concerns we had about other possible sources of bias. We assessed whether each study was free of other problems that could put it at risk of bias as low risk, high risk, or unclear risk.
Measures of treatment effect
When dealing with dichotomous outcome measures, we calculated a pooled estimate of the treatment effect for each outcome across trials using the odds ratio (OR) (the odds of an outcome among treatment‐allocated participants compared to the corresponding odds among controls) and the 95% confidence interval (CI). For continuous outcomes, we recorded mean postintervention values and standard deviations (SD) for each group. We then calculated a pooled estimate of treatment effect by calculating the mean difference (MD) and 95% CI.
Unit of analysis issues
The unit of analysis was each participant recruited into the trials. We planned to adjust for the cluster effect as described in the Cochrane Handbook for Systematic Reviews of Interventions if the level of analysis was not the same as the level of randomisation, such as in cluster‐RCTs (Higgins 2011). However, this was not required.
Dealing with missing data
We planned to contact the trial authors for missing data when possible. Otherwise, we planned to deal with missing data by performing an intention‐to‐treat (ITT) analysis that considers all missing data as unsuccessful outcomes. As there were no missing data in the included studies, this was not required.
Assessment of heterogeneity
We assessed heterogeneity based on face value (e.g. population, setting, risk of complications) and with the I² statistic (Higgins 2011). We then explored reasons for heterogeneity. A guide to interpretation of the I² statistic is described in the Cochrane Handbook for Systematic Reviews of Interventions (Higgins 2011):
-
0% to 40% might not be important;
-
30% to 60% may represent moderate heterogeneity;
-
50% to 90% may represent substantial heterogeneity; and
-
75% to 100% represents considerable heterogeneity.
The observed importance of the I² statistic depends on factors including the magnitude and direction of effects, and the strength of evidence for heterogeneity determined by the P value from the Chi² test or a CI for the I² statistic (Higgins 2011).
Assessment of reporting biases
We planned to assess reporting bias for each outcome by using funnel plots if there were 10 or more studies; however, only eight studies were included. Asymmetrical funnel plots can indicate outcome reporting bias or heterogeneity. If outcome reporting bias was suspected, we planned to contact study authors. Where the original protocol is not available, outcome reporting bias can be assessed by comparing the methods section of a published trial to the results section.
Data synthesis
We performed a meta‐analysis using Review Manager 5 (RevMan 2014). We planned to describe studies without pooling them if there was obvious face value heterogeneity, but this was not required. We planned to use the fixed‐effect model if there was no statistical heterogeneity. However, we used the random‐effects model because there was statistical heterogeneity (Higgins 2011).
GRADE and 'Summary of findings' table
We created a 'Summary of findings' table using the following outcomes: mortality, length of hospital stay, and procedural complications. We used the five GRADE considerations (study limitations, consistency of effect, imprecision, indirectness, and publication bias) to assess the quality of a body of evidence as it relates to the studies which contribute data to the meta‐analyses for the prespecified outcomes (Atkins 2004). We used methods and recommendations described in Section 8.5 and Chapter 12 of the Cochrane Handbook for Systematic Reviews of Interventions (Higgins 2011). We used GRADEpro GDT software (GRADEpro GDT 2015). We justified all decisions to down‐ or upgrade the quality of studies using footnotes, and we made comments to aid the reader's understanding of the review where necessary.
Subgroup analysis and investigation of heterogeneity
We performed a subgroup analysis for children and adults, with children defined as those under the age of 18 years, and adults as those aged 18 years or over, at the time of diagnosis. This is due to the lower mortality rate of empyema in children, compared to adult empyema, which is estimated at 20% (Balfour‐Lynn 2005; Ferguson 1996).
Sensitivity analysis
We performed a sensitivity analysis for trials involving the use of intrapleural fibrinolytic therapy, because studies have demonstrated an improved outcome with its inclusion in empyema therapy.
We planned to pool studies with a low risk of bias and gradually add studies with a high risk of bias to explore how that changed the overall estimate of effect. However, this was not performed because none of the included studies was assessed to have a high risk of bias. We explored which studies contributed to heterogeneity by gradually adding studies to the pooled analysis.
Results
Description of studies
Results of the search
The search strategy identified 2905 records. A preliminary screening excluded all but 35 records, which were then obtained in full text. Of the 35 studies, we excluded 23 because they compared either two surgical or two non‐surgical methods of pleural empyema management, or were not RCTs. (See Characteristics of excluded studies.)
We allocated four studies to Characteristics of studies awaiting classification (Ahmed 2016; Hasimoto 2015; NCT00234208; Zhang 2011). Zhang 2011 was a summary of a poster presentation with insufficient information to determine study characteristics. Hasimoto 2015 was available only as an abstract, and had insufficient information to assess for inclusion in the review; we contacted the authors for unpublished data. Ahmed 2016 was a RCT, however it was published immediately before publication of this review and will be assessed for inclusion in the update of this review. We identified NCT00234208 by searching ClinicalTrials.gov and WHO ICTRP; we have contacted the authors. We found no ongoing trials. (See Figure 1.)

Study flow diagram.
Included studies
We included eight RCTs in our review. See Characteristics of included studies.
The largest multicentre trial included 103 children (aged under 15 years) recruited from six study centres (Marhuenda 2014). Other trials in children are Cobanoglu 2011, Karaman 2004, Kurt 2006, Peter 2009, and Sonnappa 2006. Two trials included participants under 18 years of age (Kurt 2006; Peter 2009); one trial included participants under 16 years of age (Sonnappa 2006); and two trials stated that they were paediatric studies but did not provide a maximum age (Cobanoglu 2011; Karaman 2004). Two studies included participants over the age of 18 years (Bilgin 2006; Wait 1997).
All eight studies listed specific methods of empyema diagnosis in their inclusion criteria. Seven studies used medical imaging as part of their diagnostic criteria (Bilgin 2006; Karaman 2004; Kurt 2006; Marhuenda 2014; Peter 2009; Sonnappa 2006; Wait 1997). This included chest X‐ray, CT, and ultrasound findings such as effusion size and presence of septations or loculations. Five trials used pleural fluid findings as part of their diagnostic criteria (Bilgin 2006; Cobanoglu 2011; Karaman 2004; Peter 2009; Wait 1997). These findings included biochemistry, gram stain, and culture. Four studies used clinical findings such as persistent fever, tachypnoea, and oxygen requirement to support a diagnosis of empyema (Kurt 2006; Marhuenda 2014; Sonnappa 2006; Wait 1997).
The modes of treatment that were compared varied slightly among the trials. Seven included studies compared VATS against conventional tube thoracostomy (Bilgin 2006; Cobanoglu 2011; Kurt 2006; Marhuenda 2014; Peter 2009; Sonnappa 2006; Wait 1997). Karaman 2004 compared open thoracotomy with tube thoracostomy.
Six trials used intrapleural fibrinolytics as an adjunct (Cobanoglu 2011; Kurt 2006; Marhuenda 2014; Peter 2009; Sonnappa 2006; Wait 1997). In these studies, fibrinolytics were used routinely in the thoracostomy group except for Kurt 2006, in which fibrinolytics were used for cases that had failed to resolve in either treatment arm. The four fibrinolytic agents used were streptokinase, urokinase, reteplase, and tissue plasminogen activator. Each of these studies applied different protocols for the frequency and duration of fibrinolytic therapy. Detailed notes regarding the fibrinolytic agent and treatment protocol used in each study are presented in Characteristics of included studies.
There were a number of commonly reported outcomes among the included studies. All studies included a measure of hospital stay. Seven studies reported total length of hospital stay (Bilgin 2006; Cobanoglu 2011; Karaman 2004; Kurt 2006; Marhuenda 2014; Sonnappa 2006; Wait 1997), of which two studies also reported postintervention length of hospital stay (Marhuenda 2014; Sonnappa 2006). One trial reported only postintervention length of hospital stay (Peter 2009). Other common outcomes included duration of chest tube drainage, duration of fever, analgesia duration, total cost of treatment, and occurrence of complications. One study reported mortality as a specific outcome (Wait 1997). However, the remaining seven studies reported no losses to follow‐up throughout study periods.
Excluded studies
We excluded 23 studies. Of these, 20 were RCTs, but compared either two surgical or two non‐surgical methods of empyema management. One study was not randomised (Nandeesh 2013); one study was a commentary on a RCT (Mathew 2015); and one study evaluated the effect of surgery as a rescue therapy rather than primary therapy (Bagheri 2013).
For further details, see Characteristics of excluded studies.
Risk of bias in included studies
Overall, risk of bias was unclear for selection and blinding but low for attrition and reporting bias. No studies were judged to be at high risk of bias for any of the domains assessed. Please see Figure 2 for 'Risk of bias' percentages and Figure 3 for a summary of the risk of bias.
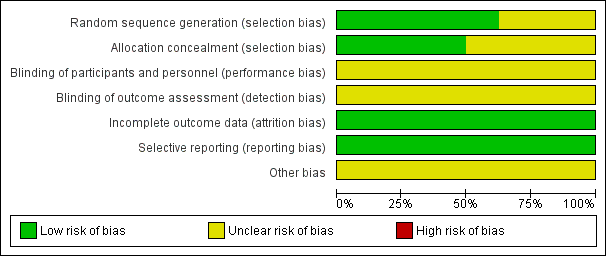
Risk of bias graph: review authors' judgements about each risk of bias item presented as percentages across all included studies.
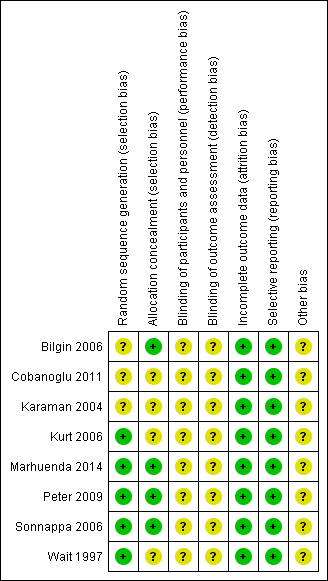
Risk of bias summary: review authors' judgements about each risk of bias item for each included study.
Allocation
Five studies adequately described the generation of the allocation sequence (Kurt 2006; Marhuenda 2014; Peter 2009; Sonnappa 2006; Wait 1997). Three studies did not describe the method of randomisation (Bilgin 2006; Cobanoglu 2011; Karaman 2004).
The method used to conceal allocation was adequately described in four studies (Bilgin 2006; Marhuenda 2014; Peter 2009; Sonnappa 2006), and not described in four studies (Cobanoglu 2011; Karaman 2004; Kurt 2006; Wait 1997).
Additionally, Cobanoglu 2011 did not adequately describe the protocol for exclusion; it is unclear if participants with contraindications to fibrinolysis were excluded before or after randomisation was performed (see Characteristics of included studies).
Three studies adequately described both methods of allocation sequence generation and allocation concealment (Marhuenda 2014; Peter 2009; Sonnappa 2006); the risk of selection bias for the remaining studies was unclear (Bilgin 2006; Cobanoglu 2011; Karaman 2004; Kurt 2006; Wait 1997).
Blinding
Blinding was not possible for either participants or assessors in any of the included studies due to the nature of the trials. As such, the risk for performance and detection bias was unclear. However, participants can potentially be blinded for fibrinolytic therapy.
Incomplete outcome data
In all eight studies, all participants were accounted for in the results published for the outcomes included in the meta‐analysis. In two studies, participants were lost to follow‐up at three and six months' chest X‐ray (Marhuenda 2014; Sonnappa 2006). However, this did not affect any of the main outcomes assessed. We assessed the risk of attrition bias as low for all studies.
Selective reporting
No protocols were published for seven of the eight studies. However, in those seven studies, all outcomes mentioned in the methods sections were included in their results. A brief protocol was published on ClinicalTrials.gov for Marhuenda 2014. All outcomes mentioned in the protocol were included in the results. Hence, we considered the risk of reporting bias to be low in all studies.
Other potential sources of bias
Two studies declared there were no financial conflicts of interest (Marhuenda 2014; Sonnappa 2006). The funding source was unclear for the remaining studies.
Effects of interventions
See: Summary of findings for the main comparison Open thoracotomy compared to thoracostomy drainage for pleural empyema; Summary of findings 2 VATS compared to thoracostomy drainage for pleural empyema
We performed two separate comparisons. One comparison examined open thoracotomy versus thoracostomy drainage for the treatment of pleural empyema and included one study (Karaman 2004). The other comparison examined VATS versus thoracostomy drainage for the treatment of pleural empyema and included seven studies (Bilgin 2006; Cobanoglu 2011; Kurt 2006; Marhuenda 2014; Peter 2009; Sonnappa 2006; Wait 1997). We performed subgroup analyses for children (aged younger than 18 years) and adults for the comparison of VATS versus thoracostomy.
We performed a sensitivity analysis to examine the effect of excluding studies that did not use intrapleural fibrinolytics in the management of participants in the non‐surgical treatment arm. We removed one study from all analyses before conducting the sensitivity analysis because it used fibrinolytics in both treatment arms for people who did not initially respond to treatment (Kurt 2006). Studies that did not use fibrinolytics were then removed from each analysis and the results compared. We did not perform a sensitivity analysis for the comparison of open thoracotomy versus thoracostomy because only one study was included. We also could not perform a sensitivity analysis for the comparison of VATS versus thoracostomy drainage length of hospital stay outcome because all of the included studies used fibrinolysis in the non‐surgical treatment arms. We did not perform the sensitivity analysis in reverse (exclusion of studies that used fibrinolytics) in the comparison of VATS versus thoracostomy drainage because this would have left only one study in the comparison.
We performed sensitivity analyses for analyses that showed considerable heterogeneity. Studies were gradually added to the pool to determine if any particular studies contributed significantly to the heterogeneity.
We did not perform a sensitivity analysis for risk of bias because none of the included studies were deemed to have high risk of bias.
Please see summary of findings Table for the main comparison and summary of findings Table 2.
1. Comparison 1: Open thoracotomy versus thoracostomy drainage
Please see Data and analyses and summary of findings Table for the main comparison for further details.
Primary outcome
1.1. Mortality
Karaman 2004 reported no deaths in either treatment arm, and accordingly the OR for treatment effect on this outcome was not estimable (Analysis 1.1). We downgraded the quality of the evidence for this outcome by one level to moderate due to small sample size (imprecision).
Secondary outcomes
1.2. Length of hospital stay (days)
Karaman 2004 reported on length of hospital stay in 30 participants. Study results showed a statistically significant reduction in mean hospital stay of 5.90 days in those treated with open thoracotomy compared to thoracostomy drainage arm participants (95% CI ‐7.29 to ‐4.51) (Analysis 1.2). We downgraded the quality of the evidence for this outcome to moderate due to small sample size (one study) (imprecision).
1.3. Procedural complications
Karaman 2004 reported on procedural complications such as bronchopleural fistulas, unsuitable tube position, and subcutaneous emphysema. Study results showed a statistically significant reduction in procedural complications in the open thoracotomy group compared to those treated with tube thoracostomy (OR 0.10, 95% CI 0.02 to 0.63; Analysis 1.3). No participants were reported to have experienced more than one complication. We downgraded the quality of the evidence for this outcome to moderate due to small sample size (one study) (imprecision).
2. Comparison 2: VATS versus thoracostomy drainage
Please see Data and analyses for further details.
Primary outcome
2.1. Mortality
We included seven studies in this comparison (Bilgin 2006; Cobanoglu 2011; Kurt 2006; Marhuenda 2014; Peter 2009; Sonnappa 2006; Wait 1997). Six studies reported no deaths in either treatment arm. Wait 1997 reported one death in each treatment arm (Wait 1997). We found no statistically significant difference in mortality for those treated with VATS compared with those treated with thoracostomy drainage (OR 0.80, 95% CI 0.04 to 14.89; Analysis 2.1). We downgraded the quality of the evidence for this outcome to low due to wide confidence intervals (imprecision) and indirectness (data only available for adults). We excluded two studies from the fibrinolytic sensitivity analysis (Bilgin 2006; Kurt 2006). This had no effect on the outcome (OR 0.80, 95% CI 0.04 to 14.89).
Five studies in the mortality comparison investigated children aged less than 18 years (Cobanoglu 2011; Kurt 2006; Marhuenda 2014; Peter 2009; Sonnappa 2006). No deaths were reported in either treatment arm, and accordingly the OR of mortality in children was not estimable.
Two studies in the mortality comparison evaluated adults aged over 18 years (Bilgin 2006; Wait 1997). Bilgin 2006 reported no deaths in either treatment arm; Wait 1997 reported one death in each treatment arm. We found no statistically significant difference in mortality for those treated with VATS compared to those treated with thoracostomy drainage (OR 0.80, 95% CI 0.04 to 14.89). We downgraded the quality of the evidence for this outcome to moderate due to wide confidence intervals (imprecision). We excluded Bilgin 2006 from the fibrinolytic sensitivity analysis, but this had no effect on this analysis.
Secondary outcomes
2.2. Length of hospital stay
We initially included seven studies in this comparison (Bilgin 2006; Cobanoglu 2011; Kurt 2006; Marhuenda 2014; Peter 2009; Sonnappa 2006; Wait 1997). Unfortunately, two studies were excluded because their data were not reported in means and standard deviations and could not be combined with the other studies (Bilgin 2006; Sonnappa 2006). We were unable to contact the trial authors for additional data. When the five remaining studies were combined in the meta‐analysis, a statistically significant reduction in mean length of hospital stay was found for those treated with VATS when compared to those treated with thoracostomy drainage (MD ‐2.52 days, 95% CI ‐4.26 days to ‐0.77 days; Analysis 2.2). However, considerable heterogeneity was present (I² = 81%). We performed a heterogeneity sensitivity analysis, which revealed that no one trial contributed significantly more than the others to the level of heterogeneity. We downgraded the quality of the evidence for this outcome to moderate due to this heterogeneity. We could not perform a fibrinolysis sensitivity analysis for this outcome because all included studies used fibrinolysis in the non‐surgical treatment arm.
We performed a subgroup analysis comparing results in adults and children (Analysis 2.2). The test for subgroup differences showed no difference between subgroups (P = 0.10).
Five studies initially included in the length of hospital stay comparison evaluated children aged up to 18 years (Cobanoglu 2011; Kurt 2006; Marhuenda 2014; Peter 2009; Sonnappa 2006). We excluded Sonnappa 2006 because data were not reported as means and standard deviations. The remaining four studies did not show a statistically significant difference in mean length of hospital stay for those treated with VATS when compared to those treated with thoracostomy drainage (MD ‐1.99 days, 95% CI ‐4.36 days to 0.39 days; Analysis 2.2.1). Considerable heterogeneity was also present (I² = 76%). We performed a heterogeneity sensitivity analysis, which revealed that no one trial contributed significantly more than the others to the level of heterogeneity. We downgraded the quality of the evidence for this outcome to moderate due to this heterogeneity. We could not perform a fibrinolysis sensitivity analysis for this outcome because all included studies used fibrinolysis in the non‐surgical treatment arm.
Two studies initially included in the length of hospital stay comparison investigated adults aged over 18 years (Bilgin 2006; Wait 1997). We excluded Bilgin 2006 because data were not reported as means and standard deviations. Wait 1997 showed a statistically significant reduction in mean length of hospital stay for those treated with VATS compared to those treated with thoracostomy drainage (MD ‐4.10 days, 95% CI ‐4.99 days to ‐3.21 days; Analysis 2.2). We downgraded the quality of the evidence to moderate due to small sample size (one study). We could not perform a fibrinolysis sensitivity analysis for this outcome because all included studies used fibrinolysis in the non‐surgical treatment arm.
2.3. Procedural complications
Five studies reported on procedural complications and were included in this comparison (Bilgin 2006; Kurt 2006; Marhuenda 2014; Sonnappa 2006; Wait 1997). The reported complications included bronchospasm, bronchopleural fistulas, chest tube insertion through diaphragm, and chest tubes requiring re‐insertion after falling out. No participants were reported to have experienced more than one complication. We found no statistically significant difference in procedural complications for those treated with VATS when compared to those treated with thoracostomy drainage (OR 0.46, 95% CI 0.08 to 2.75; Analysis 2.3). The level of heterogeneity in this comparison was low (I² = 0%). We downgraded the quality of the evidence for this outcome to moderate due to wide confidence intervals (imprecision). The fibrinolytic sensitivity analysis excluded two studies (Bilgin 2006; Kurt 2006). This did not produce any statistically significant results (OR 0.54, 95% CI 0.06 to 4.59) (I² = 0%).
We performed a subgroup analysis comparing results in adults and children (Analysis 2.3). The test for subgroup differences showed no difference between subgroups (P = 0.52).
Three studies in the procedural complications comparison evaluated children aged up to 18 years (Kurt 2006; Marhuenda 2014; Sonnappa 2006). When these three studies were combined, no statistically significant difference in procedural complications was found for those treated with VATS compared to those treated with thoracostomy drainage (OR 0.94, 95% CI 0.06 to 15.48; Analysis 2.3.1). We downgraded the quality of the evidence for this outcome to moderate due to wide confidence intervals (imprecision). Sensitivity analysis excluded one study, which had no effect on the results (Kurt 2006).
Two studies in the procedural complications comparison evaluated adults aged over 18 years (Bilgin 2006; Wait 1997). These studies showed no statistically significant difference in procedural complications for those treated with VATS compared to those treated with thoracostomy drainage (OR 0.28, 95% CI 0.03 to 2.88; Analysis 2.3.2). The level of heterogeneity in this comparison was low (I² = 0%). We downgraded the quality of the evidence for this outcome to moderate due to wide confidence intervals (imprecision). The fibrinolytic analysis excluded one study, which produced no statistically significant results (OR 0.25, 95% CI 0.01 to 6.82) (Bilgin 2006).
Discussion
Summary of main results
Mortality
The included studies showed no statistically significant difference in mortality between primary surgical and non‐surgical management of pleural empyema in all age groups. However, mortality data were limited because only one study reported deaths in both treatment arms; the remaining studies reported no deaths.
Length of hospital stay
The data we reviewed showed a statistically significant reduction in length of hospital stay of 2.52 days for those treated with VATS compared to those treated with (non‐surgical) chest tube drainage when we included all age groups. This effect was larger for adults aged over 18 years (4.10 days), but no statistically significant difference in length of hospital stay was found in children. The quality of the data was limited by considerable heterogeneity.
The one included study that compared open thoracotomy to chest tube drainage in children showed a statistically significant reduction in length of hospital stay of 5.90 days for those on the surgical arm. However, data were limited by the small sample size.
Procedural complications
We found no statistically significant difference in procedural complications for participants of all ages treated with VATS compared to those treated with (non‐surgical) chest tube drainage.
The one included study that compared open thoracotomy to chest tube drainage in children showed a statistically significant reduction in procedural complications Karaman 2004. However, data were limited by the small sample size.
Overall completeness and applicability of evidence
We found few RCTs that investigated this topic. Seven studies compared VATS with thoracostomy drainage, of which two investigated adults and the remaining five investigated children. Only one included study compared open thoracotomy with thoracostomy and included children. All included studies had small sample sizes.
Data from two studies could not be included in the length of stay analysis for the comparison of VATS with thoracostomy drainage because means and standard deviations were not reported (Bilgin 2006; Sonnappa 2006). We were unable to obtain additional data from the trial authors.
The included studies used inclusion criteria that confirmed the diagnosis of CPPE/empyema in participants. Some studies based the diagnosis on pleural fluid biochemistry and microscopy, while others relied on imaging findings or a combination of both. As such, we consider the results of this review to be applicable to patients with pleural empyema diagnosed by the criteria listed in Types of participants.
A number of common outcomes were reported in the included studies that were not listed in the outcomes of the protocol for this review. Five trials reported cost of treatment (Cobanoglu 2011; Kurt 2006; Peter 2009; Sonnappa 2006; Wait 1997). Three of these found total cost of treatment to be lower for thoracostomy, with or without fibrinolytics, when compared to VATS (Cobanoglu 2011; Peter 2009; Sonnappa 2006). Two studies showed the cost of thoracostomy to be greater than for VATS (Kurt 2006; Wait 1997). However, these data were not statistically significant (Table 1). Five trials reported duration of chest tube drainage (Cobanoglu 2011; Karaman 2004; Kurt 2006; Marhuenda 2014; Wait 1997). All five studies found the duration to be shorter with surgical management when compared to thoracostomy with or without fibrinolytics; all of these findings were statistically significant (Table 2). Six studies reported on postintervention duration of fever (Cobanoglu 2011; Karaman 2004; Kurt 2006; Marhuenda 2014; Peter 2009; Sonnappa 2006). All showed fever duration to be shorter with surgical management. However, the difference in fever duration was not statistically significant in all trials (Table 3).
| Trial | Total treatment cost (USD): | Total treatment cost (USD): | P value |
| Mean 386.672 ± 72.06 | Mean 957.487 ± 137.238 | < 0.001 | |
| Median (IQR) 21,947 (17,895 to 37,458) | Median (IQR) 19,714 (17,325 to 23,000) | 0.315 | |
| Mean 9127 | Mean 11,379 | < 0.001 | |
| Mean 7600 ± 5400 | Mean 11,700 ± 2900 | 0.02 | |
| Mean 24,052 ± 3466 | Mean 16,642 ± 2841 | 0.11 |
IQR: interquartile range
| Trial | Duration of chest tube | Duration of chest tube drainage: | P value |
| Mean 9.48 ± 2.50 | Mean 6.56 ± 1.55 | < 0.001 | |
| Mean 13.8 ± 2.3 | Mean 7.5 ± 1.1 | < 0.05 | |
| Mean 9.63 ± 5.45 | Mean 2.80 ± 0.63 | < 0.001 | |
| Median (IQR) 5 (4 to 6) | Median (IQR) 4 (3 to 5) | < 0.001 | |
| Mean 9.8 ± 1.3 | Mean 5.8 ± 1.1 | 0.03 |
IQR: interquartile range
| Trial | Postintervention fever duration: | Postintervention fever | P value |
| Mean 3.9 ± 2.1 | Mean 3.4 ± 2.4 | 0.782 | |
| Mean 6.25 ± 4.10 | Mean 3.60 ± 2.95 | 0.146 | |
| Median (IQR) 6 (3 to 7) | Median (IQR) 4 (2 to 7) | 0.62 | |
| Median (range) 2.5 (0 to 25) | Median (range) 2.5 (0 to 10) | 0.635 | |
| Mean 3.8 ± 2.9 | Mean 3.1 ± 2.7 | 0.46 |
IQR: interquartile range
Quality of the evidence
The methodological quality of the included studies was generally good based on the 'Risk of bias' assessment. We assessed no domains as at high risk of bias. Five of the eight included studies reported low‐risk methods of randomisation (Kurt 2006; Marhuenda 2014; Peter 2009; Sonnappa 2006; Wait 1997), and three studies were assessed as at unclear risk of bias because methods were not reported. Four studies demonstrated low‐risk methods of allocation concealment, and four studies did not report methods and were assessed as at unclear risk of bias (Bilgin 2006; Marhuenda 2014; Peter 2009; Sonnappa 2006). All studies had low risk of attrition bias and reporting bias. However, the risk of performance/detection bias was unclear in all studies because blinding methods were not reported.
We downgraded the quality of evidence for mortality, length of hospital stay, and procedural complications in the open thoracotomy versus thoracostomy comparison to moderate due to the small sample size (one study provided data).
We deemed the quality of evidence as low for mortality in the VATS versus thoracostomy comparison due to wide confidence intervals (imprecision) and indirectness (data for adults available from only one study).
We deemed the quality of evidence as moderate for mortality (in children and adults) in the VATS versus thoracostomy comparison due to wide confidence intervals (imprecision) (data for adults available from only one study).
We deemed the quality of evidence as moderate for procedural complications (in children and adults) in the VATS versus thoracostomy comparison due to wide confidence intervals (imprecision).
For children and the total population, we downgraded the quality of evidence for length of hospital stay in the VATS versus thoracostomy comparison to moderate due to considerable heterogeneity. For adults in the same comparison, we downgraded the quality of evidence to moderate due to the small sample size.
Potential biases in the review process
While there is a risk that some studies may have been missed in the search process, we took a number of precautions to minimise this risk. We searched multiple databases with a comprehensive search strategy. We searched clinical trials registers and contacted the authors of relevant trials. We performed an updated search prior to publishing to check for trials published during the review process.
There is a potential for bias in the selection of included studies and data extraction from included studies. To minimise this risk, two review authors independently selected articles from the search results. The review authors compared findings, and a third review author was available as an arbiter for any disagreements. Two review authors then independently extracted data and compared their findings.
For the VATS versus thoracostomy length of hospital stay outcome, one study reported postintervention length of hospital stay (Peter 2009), and four studies reported total hospital stay. We pooled these studies in the meta‐analysis. It is unclear if this had a significant influence on conclusions.
Agreements and disagreements with other studies or reviews
Krenke 2010 conducted a systematic review of RCTs that compared intrapleural fibrinolysis to a range of interventions, one of which was VATS. For their review of fibrinolysis versus VATS, Krenke 2010 found two studies that we also included in our review (Peter 2009; Sonnappa 2006). Krenke 2010 found no significant difference in length of postintervention hospital stay between fibrinolysis and VATS. As both included studies in Krenke 2010 were in children, results from both reviews agree.

Study flow diagram.

Risk of bias graph: review authors' judgements about each risk of bias item presented as percentages across all included studies.

Risk of bias summary: review authors' judgements about each risk of bias item for each included study.
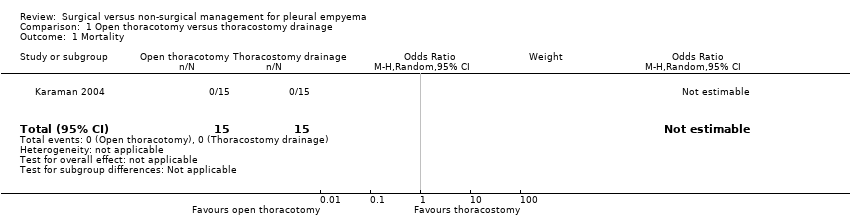
Comparison 1 Open thoracotomy versus thoracostomy drainage, Outcome 1 Mortality.

Comparison 1 Open thoracotomy versus thoracostomy drainage, Outcome 2 Length of hospital stay (days).

Comparison 1 Open thoracotomy versus thoracostomy drainage, Outcome 3 Procedural complications.

Comparison 2 VATS versus thoracostomy drainage, Outcome 1 Mortality.

Comparison 2 VATS versus thoracostomy drainage, Outcome 2 Length of hospital stay (days).

Comparison 2 VATS versus thoracostomy drainage, Outcome 3 Procedural complications.
| Open thoracotomy compared to thoracostomy drainage for pleural empyema | ||||||
| Patient or population: children with pleural empyema | ||||||
| Outcomes | Anticipated absolute effects* (95% CI) | Relative effect | № of participants | Quality of the evidence | Comments | |
| Thoracostomy drainage | Open thoracotomy | |||||
| Mortality Follow‐up: up to 3 months after discharge | Risk in study population | Not estimable | 30 | ⊕⊕⊕⊝ | No deaths occurred in either group. | |
| — | — | |||||
| Length of hospital stay (days) Follow‐up: up to 3 months after discharge | The mean length of hospital stay in the control group was 15.4 days. | The mean length of hospital stay in the intervention group was 5.9 days fewer (7.29 fewer to 4.51 fewer). | — | 30 | ⊕⊕⊕⊝ | |
| Procedural complications Follow‐up: up to 3 months after discharge | Risk in study population | OR 0.10 | 30 | ⊕⊕⊕⊝ | ||
| 600 per 1000 | 130 per 1000 | |||||
| *The risk in the intervention group (and its 95% confidence interval) is based on the assumed risk in the comparison group and the relative effect of the intervention (and its 95% CI). | ||||||
| GRADE Working Group grades of evidence | ||||||
| 1Downgraded one level due to small sample size and only one study. | ||||||
| VATS compared to thoracostomy drainage for pleural empyema | ||||||
| Patient or population: children and adults with pleural empyema | ||||||
| Outcomes | Anticipated absolute effects* (95% CI) | Relative effect | № of participants | Quality of the evidence | Comments | |
| Thoracostomy drainage | VATS | |||||
| Mortality | Risk in study population | OR 0.80 | 361 | ⊕⊕⊝⊝ | Data only for adults | |
| 6 per 1000 | 5 per 1000 | |||||
| Mortality: children | Risk in study population | Not estimable | 271 | ⊕⊕⊕⊝ | No deaths occurred in either group. | |
| Not pooled | Not pooled | |||||
| Mortality: adults Follow‐up: not reported | Risk in study population | OR 0.80 | 90 | ⊕⊕⊕⊝ | No deaths occurred in Bilgin 2006. Data based on Wait 1997 | |
| 23 per 1000 | 18 per 1000 | |||||
| Length of hospital stay (days) Follow‐up: 1 year in Cobanoglu 2011 and 3 months in Marhuenda 2014 | Control group | The mean length of hospital stay in the intervention group was 2.52 days fewer (4.26 fewer to 0.77 fewer). | — | 231 | ⊕⊕⊕⊝ | Note: Follow‐up period not reported in Kurt 2006; Peter 2009; Wait 1997. |
| Procedural complications Follow‐up: 6 months in Bilgin 2006 and not reported in Wait 1997 | Risk in study population | OR 0.46 | 271 | ⊕⊕⊕⊝ | ||
| 23 per 1000 | 11 per 1000 | |||||
| *The risk in the intervention group (and its 95% confidence interval) is based on the assumed risk in the comparison group and the relative effect of the intervention (and its 95% CI). | ||||||
| GRADE Working Group grades of evidence | ||||||
| 1Downgraded two levels due to wide confidence intervals (data from only one study) and indirectness (data only available for adults). | ||||||
| Trial | Total treatment cost (USD): | Total treatment cost (USD): | P value |
| Mean 386.672 ± 72.06 | Mean 957.487 ± 137.238 | < 0.001 | |
| Median (IQR) 21,947 (17,895 to 37,458) | Median (IQR) 19,714 (17,325 to 23,000) | 0.315 | |
| Mean 9127 | Mean 11,379 | < 0.001 | |
| Mean 7600 ± 5400 | Mean 11,700 ± 2900 | 0.02 | |
| Mean 24,052 ± 3466 | Mean 16,642 ± 2841 | 0.11 | |
| IQR: interquartile range | |||
| Trial | Duration of chest tube | Duration of chest tube drainage: | P value |
| Mean 9.48 ± 2.50 | Mean 6.56 ± 1.55 | < 0.001 | |
| Mean 13.8 ± 2.3 | Mean 7.5 ± 1.1 | < 0.05 | |
| Mean 9.63 ± 5.45 | Mean 2.80 ± 0.63 | < 0.001 | |
| Median (IQR) 5 (4 to 6) | Median (IQR) 4 (3 to 5) | < 0.001 | |
| Mean 9.8 ± 1.3 | Mean 5.8 ± 1.1 | 0.03 | |
| IQR: interquartile range | |||
| Trial | Postintervention fever duration: | Postintervention fever | P value |
| Mean 3.9 ± 2.1 | Mean 3.4 ± 2.4 | 0.782 | |
| Mean 6.25 ± 4.10 | Mean 3.60 ± 2.95 | 0.146 | |
| Median (IQR) 6 (3 to 7) | Median (IQR) 4 (2 to 7) | 0.62 | |
| Median (range) 2.5 (0 to 25) | Median (range) 2.5 (0 to 10) | 0.635 | |
| Mean 3.8 ± 2.9 | Mean 3.1 ± 2.7 | 0.46 | |
| IQR: interquartile range | |||
| Outcome or subgroup title | No. of studies | No. of participants | Statistical method | Effect size |
| 1 Mortality Show forest plot | 1 | 30 | Odds Ratio (M‐H, Random, 95% CI) | 0.0 [0.0, 0.0] |
| 2 Length of hospital stay (days) Show forest plot | 1 | 30 | Mean Difference (IV, Random, 95% CI) | ‐5.9 [‐7.29, ‐4.51] |
| 3 Procedural complications Show forest plot | 1 | 30 | Odds Ratio (M‐H, Random, 95% CI) | 0.10 [0.02, 0.63] |
| Outcome or subgroup title | No. of studies | No. of participants | Statistical method | Effect size |
| 1 Mortality Show forest plot | 7 | 361 | Odds Ratio (M‐H, Random, 95% CI) | 0.8 [0.04, 14.89] |
| 1.1 Children | 5 | 271 | Odds Ratio (M‐H, Random, 95% CI) | 0.0 [0.0, 0.0] |
| 1.2 Adults | 2 | 90 | Odds Ratio (M‐H, Random, 95% CI) | 0.8 [0.04, 14.89] |
| 2 Length of hospital stay (days) Show forest plot | 5 | 231 | Mean Difference (IV, Random, 95% CI) | ‐2.52 [‐4.26, ‐0.77] |
| 2.1 Children | 4 | 211 | Mean Difference (IV, Random, 95% CI) | ‐1.99 [‐4.36, 0.39] |
| 2.2 Adults | 1 | 20 | Mean Difference (IV, Random, 95% CI) | ‐4.10 [‐4.99, ‐3.21] |
| 3 Procedural complications Show forest plot | 5 | 271 | Odds Ratio (M‐H, Random, 95% CI) | 0.46 [0.08, 2.75] |
| 3.1 Children | 3 | 181 | Odds Ratio (M‐H, Random, 95% CI) | 0.94 [0.06, 15.48] |
| 3.2 Adults | 2 | 90 | Odds Ratio (M‐H, Random, 95% CI) | 0.28 [0.03, 2.88] |