Ćwiczenia fizyczne jako metoda leczenia przewlekłej niewydolności żylnej bez owrzodzeń
Appendices
Appendix 1. CRS search strategy
| #1 | MESH DESCRIPTOR Varicose Veins EXPLODE ALL TREES | 745 |
| #2 | (varicos* near3 (vein* or veno*)):TI,AB,KY | 758 |
| #3 | (tortu* near3 (vein* or veno*)):TI,AB,KY | 6 |
| #4 | (incomp* near3 (vein* or veno* or saphenous or valv*)):TI,AB,KY | 83 |
| #5 | (insuffic* near3 (vein* or veno* or saphenous)):TI,AB,KY | 133 |
| #6 | (((saphenous or vein* or veno*) near3 reflux)):TI,AB,KY | 121 |
| #7 | MESH DESCRIPTOR Venous Insufficiency EXPLODE ALL TREES | 375 |
| #8 | CVI :TI,AB,KY | 143 |
| #9 | MESH DESCRIPTOR Leg EXPLODE ALL TREES WITH QUALIFIERS BS | 1096 |
| #10 | #1 OR #2 OR #3 OR #4 OR #5 OR #6 OR #7 OR #8 OR #9 | 2518 |
| #11 | MESH DESCRIPTOR Exercise EXPLODE ALL TREES | 15545 |
| #12 | MESH DESCRIPTOR Exercise Therapy EXPLODE ALL TREES | 7938 |
| #13 | MESH DESCRIPTOR Physical Exertion | 3480 |
| #14 | MESH DESCRIPTOR Sports EXPLODE ALL TREES | 11162 |
| #15 | MESH DESCRIPTOR Exercise Movement Techniques EXPLODE ALL TREES | 1258 |
| #16 | MESH DESCRIPTOR Locomotion EXPLODE ALL TREES | 4938 |
| #17 | MESH DESCRIPTOR Leisure Activities EXPLODE ALL TREES | 13147 |
| #18 | MESH DESCRIPTOR Fitness Centers | 30 |
| #19 | ((physical near3 (exertion or endurance or therap* or conditioning or activit* or fitness))):TI,AB,KY | 22520 |
| #20 | exercis*:TI,AB,KY | 47351 |
| #21 | ((fitness near3 (intervention* or protocol* or program* or therap* or activit* or regim* or centre* or center*))):TI,AB,KY | 735 |
| #22 | activit*:TI,AB,KY | 78999 |
| #23 | ((walk* or run* or treadmill or aerobic or swim* or danc*)):TI,AB,KY | 29338 |
| #24 | kinesiotherap*:TI,AB,KY | 1316 |
| #25 | (((endurance or aerobic or cardio*) near3 (fitness or train* or intervention* or protoco* or program* or therap* or activit* or regim*))):TI,AB,KY | 9385 |
| #26 | train* :TI,AB,KY | 41990 |
| #27 | #11 OR #12 OR #13 OR #14 OR #15 OR #16 OR #17 OR #18 OR #19 OR #20 OR #21 OR #22 OR #23 OR #24 OR #25 OR #26 | 157481 |
| #28 | #10 AND #27 | 518 |
Appendix 2. Cochrane's tool for assessing risk of bias
1. Was the allocation sequence randomly generated?
Low risk of bias
The investigators describe a random component in the sequence generation process such as: referring to a random number table; using a computer random number generator; coin tossing; shuffling cards or envelopes; throwing dice; drawing of lots.
High risk of bias
The investigators describe a non‐random component in the sequence generation process. Usually, the description would involve some systematic, non‐random approach, for example: sequence generated by odd or even date of birth; sequence generated by some rule based on date (or day) of admission; sequence generated by some rule based on hospital or clinic record number.
Unclear
Insufficient information about the sequence generation process to permit judgement of low or high risk of bias.
2. Was the treatment allocation adequately concealed?
Low risk of bias
Participants and investigators enrolling participants could not foresee assignment because one of the following, or an equivalent method, was used to conceal allocation: central allocation (including telephone, web‐based and pharmacy‐controlled randomisation); sequentially numbered drug containers of identical appearance; sequentially numbered, opaque, sealed envelopes.
High risk of bias
Participants or investigators enrolling participants could possibly foresee assignments and thus introduce selection bias, such as allocation based on: using an open random allocation schedule (e.g. a list of random numbers); assignment envelopes were used without appropriate safeguards (e.g. if envelopes were unsealed or nonopaque or not sequentially numbered); alternation or rotation; date of birth; case record number; any other explicitly unconcealed procedure.
Unclear
Insufficient information to permit judgement of low or high risk of bias. This is usually the case if the method of concealment is not described or not described in sufficient detail to allow a definite judgement; for example, if the use of assignment envelopes is described, but it remains unclear whether envelopes were sequentially numbered, opaque and sealed.
3. Blinding ‐ was knowledge of the allocated interventions adequately prevented during the study?
Low risk of bias
Any one of the following
-
No blinding, but the review authors judge that the outcome and the outcome measurement are not likely to be influenced by lack of blinding.
-
Blinding of participants and key study personnel ensured, and unlikely that the blinding could have been broken.
-
Either participants or some key study personnel were not blinded, but outcome assessment was blinded and the non‐blinding of others unlikely to introduce bias.
High risk of bias
Any one of the following.
-
No blinding or incomplete blinding, and the outcome or outcome measurement is likely to be influenced by lack of blinding.
-
Blinding of key study participants and personnel attempted, but likely that the blinding could have been broken.
-
Either participants or some key study personnel were not blinded, and the non‐blinding of others likely to introduce bias.
Unclear
Any one of the following.
-
Insufficient information to permit judgement of low or high risk of bias.
-
The study did not address this outcome.
4. Were incomplete outcome data adequately addressed?
Low risk of bias
Any one of the following.
-
No missing outcome data.
-
Reasons for missing outcome data unlikely to be related to true outcome (for survival data, censoring unlikely to be introducing bias).
-
Missing outcome data balanced in numbers across intervention groups, with similar reasons for missing data across groups.
-
For dichotomous outcome data, the proportion of missing outcomes compared with observed event risk not enough to have a clinically relevant impact on the intervention effect estimate.
-
For continuous outcome data, plausible effect size (difference in means or standardised difference in means) among missing outcomes not enough to have a clinically relevant impact on observed effect size.
-
Missing data have been imputed using appropriate methods.
High risk of bias
Any one of the following.
-
Reason for missing outcome data likely to be related to true outcome, with either imbalance in numbers or reasons for missing data across intervention groups.
-
For dichotomous outcome data, the proportion of missing outcomes compared with observed event risk enough to induce clinically relevant bias in intervention effect estimate.
-
For continuous outcome data, plausible effect size (difference in means or standardised difference in means) among missing outcomes enough to induce clinically relevant bias in observed effect size.
-
‘As‐treated’ analysis carried out with substantial departure of the intervention received from that assigned at randomisation.
-
Potentially inappropriate application of simple imputation.
Unclear
Any one of the following.
-
Insufficient reporting of attrition/exclusions to permit judgement of low or high risk of bias (e.g. number randomised not stated, no reasons for missing data provided).
-
The study did not address this outcome.
5. Are reports of the study free of suggestion of selective outcome reporting?
Low risk of bias
Any of the following.
-
The study protocol is available and all of the study’s prespecified (primary and secondary) outcomes that are of interest in the review have been reported in the prespecified way.
-
The study protocol is not available but it is clear that the published reports include all expected outcomes, including those that were prespecified (convincing text of this nature may be uncommon).
High risk of bias
Any one of the following,
-
Not all of the study’s prespecified primary outcomes have been reported.
-
One or more of the primary outcomes are reported using measurements, analysis methods or subsets of the data (e.g. subscales) that were not prespecified.
-
One or more of the reported primary outcomes were not prespecified (unless clear justification for their reporting is provided, such as an unexpected adverse effect).
-
One or more of the outcomes of interest in the review are reported incompletely so that they cannot be entered in a meta‐analysis.
-
The study report fails to include results for a key outcome that would be expected to have been reported for such a study.
Unclear
Insufficient information to permit judgement of low or high risk of bias. It is likely that the majority of studies will fall into this category.
6. Other sources of potential bias:
Low risk of bias
The study appears to be free of other sources of bias.
High risk of bias
There is at least one important risk of bias. For example, the study:
-
had a potential source of bias related to the specific study design used; or
-
had extreme baseline imbalance; or
-
has been claimed to have been fraudulent; or
-
had some other problem.
Unclear
There may be a risk of bias, but there is either:
-
insufficient information to assess whether an important risk of bias exists; or
-
insufficient rationale or evidence that an identified problem will introduce bias.

Study flow diagram.
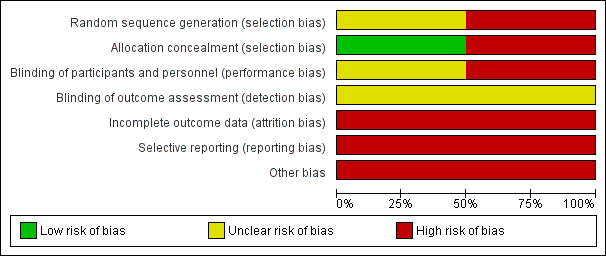
'Risk of bias' graph: review authors' judgements about each risk of bias item presented as percentages across all included studies.

'Risk of bias' summary: review authors' judgements about each risk of bias item for each included study.
![Forest plot of comparison: 1 Ejection fraction, outcome: 1.1 Ejection fraction [%].](/es/cdsr/doi/10.1002/14651858.CD010637.pub2/media/CDSR/CD010637/rel0002/CD010637/image_n/nCD010637-AFig-FIG04.png)
Forest plot of comparison: 1 Ejection fraction, outcome: 1.1 Ejection fraction [%].
![Forest plot of comparison: 2 Venous refilling time, outcome: 2.1 Half refilling time [seconds].](/es/cdsr/doi/10.1002/14651858.CD010637.pub2/media/CDSR/CD010637/rel0002/CD010637/image_n/nCD010637-AFig-FIG05.png)
Forest plot of comparison: 2 Venous refilling time, outcome: 2.1 Half refilling time [seconds].
![Forest plot of comparison: 2 Venous refilling time, outcome: 2.2 Total refilling time [seconds].](/es/cdsr/doi/10.1002/14651858.CD010637.pub2/media/CDSR/CD010637/rel0002/CD010637/image_n/nCD010637-AFig-FIG06.png)
Forest plot of comparison: 2 Venous refilling time, outcome: 2.2 Total refilling time [seconds].
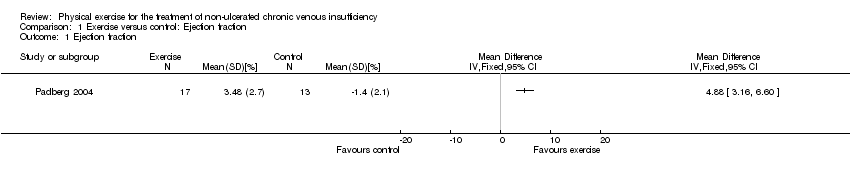
Comparison 1 Exercise versus control: Ejection fraction, Outcome 1 Ejection fraction.
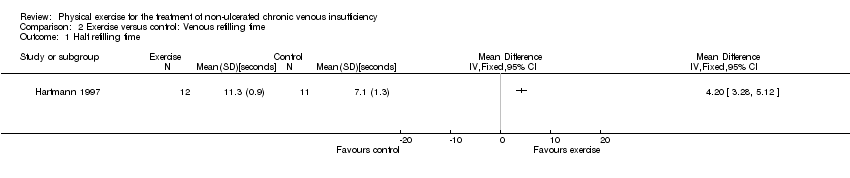
Comparison 2 Exercise versus control: Venous refilling time, Outcome 1 Half refilling time.

Comparison 2 Exercise versus control: Venous refilling time, Outcome 2 Total refilling time.
| Physical exercise compared with no treatment for non‐ulcerated chronic venous insufficiency | |||||
| Population: People with non‐ulcerated chronic venous insufficiency | |||||
| Outcomes | Anticipated absolute effects* (95% CI) | Relative effect | No. of participants | Quality of the evidence | |
| Risk with no exercise | Risk with physical exercise | ||||
| Intensity of disease signs and symptoms1 | see footnotes1 | ||||
| Ejection fraction Follow up: 24 weeks | The mean change in ejection fraction from baseline was ‐1.4% | The mean change in ejection fraction from baseline in the intervention group was 4.88% more (3.16 more to 6.6 more) | 30 | ⊕⊖⊖⊖ | |
| Half refilling time Follow up: 24 weeks | The mean half refilling time was 7.1 seconds | The mean half refilling time in the intervention group was 4.20 seconds more (3.28 more to 5.12 more) | 23 | ⊕⊖⊖⊖ | |
| Total refilling time Follow up: 24 weeks | The mean total refilling time was 16.3 seconds | The mean total refilling time in the intervention group was 9.40 seconds more (7.77 more to 11.03 more) | 23 | ⊕⊖⊖⊖ | |
| Incidence of venous leg ulcer3 | ‐ | ‐ | ‐ | see footnote3 | |
| *The risk in the intervention group (and its 95% confidence interval) is based on the assumed risk in the comparison group and the relative effect of the intervention (and its 95% CI) | |||||
| GRADE Working Group grades of evidence | |||||
| 1 unable to pool data because data were collected using different tools | |||||
| Classification | Description/Definition |
| Clinical | |
| 0 | no visible or palpable signs of venous disease |
| 1 | telangiectases or reticular veins |
| 2 | varicose veins |
| 3 | oedema |
| 4a | pigmentation or eczema |
| 4b | lipodermatosclerosis or atrophie blanchie |
| 5 | healed venous ulcer |
| 6 | active venous ulcer |
| S | symptomatic, including ache, pain, tightness, skin irritation, heaviness, muscle cramp and other complaints attributable to venous dysfunction |
| A | asymptomatic |
| Etiologyl | |
| Ec | congenital (present since birth) |
| Ep | primary |
| Es | secondary (post‐thrombotic, traumatic) |
| En | no venous cause identified |
| Anatomy distribution | |
| As | superficial (great and short saphenous veins) |
| Ap | perforator (thigh and leg perforating veins) |
| Ad | deep (cava, iliac, gonadal, femoral, profunda, popliteal, tibial, and muscular veins) |
| An | no venous location identified |
| Pathophysiology | |
| Pr | reflux (axial and perforating veins) |
| Po | obstruction (acute and chronic) |
| Pr,o | combination of both reflux and obstruction (valvular dysfunction and thrombus) |
| Pn | no venous pathophysiology identified |
| CEAP classification: classification of chronic venous disease according to clinical manifestation, etiologic factors, anatomic distribution of disease, and underlying pathophysiologic findings See Eklof 2004 for further details about CEAP | |
| Clinical descriptor | Absent (0) | Mild (1) | Moderate (2) | Severe (3) |
| Pain | None | Occasional | Daily not limiting | Daily limiting |
| Varicose veins | None | Few | Calf or thigh | Calf and thigh |
| Venous oedema | None | Foot and ankle | Below knee | Knee and above |
| Skin pigmentation | None | Limited perimalleolar | Diffuse lower 1/3 calf | Wider above lower 1/3 calf |
| Inflammation | None | Limited perimalleolar | Diffuse lower 1/3 calf | Wider above lower 1/3 calf |
| Induration | None | Limited perimalleolar | Diffuse lower 1/3 calf | Wider above lower 1/3 calf |
| Number of active ulcers | None | 1 | 2 | 3 or more |
| Ulcer duration | None | < 3 month | 3 ‐ 12 month | > 1 year |
| Active ulcer size | None | < 2 cm | 2 ‐ 6 cm | > 6 cm |
| Compression therapy | None | Intermittent | Most days | Fully comply |
| Outcome or subgroup title | No. of studies | No. of participants | Statistical method | Effect size |
| 1 Ejection fraction Show forest plot | 1 | Mean Difference (IV, Fixed, 95% CI) | Totals not selected | |
| Outcome or subgroup title | No. of studies | No. of participants | Statistical method | Effect size |
| 1 Half refilling time Show forest plot | 1 | Mean Difference (IV, Fixed, 95% CI) | Totals not selected | |
| 2 Total refilling time Show forest plot | 1 | Mean Difference (IV, Fixed, 95% CI) | Totals not selected | |