Scolaris Content Display Scolaris Content Display

Study flow diagram.
Figuras y tablas -
Figure 1

Study flow diagram.

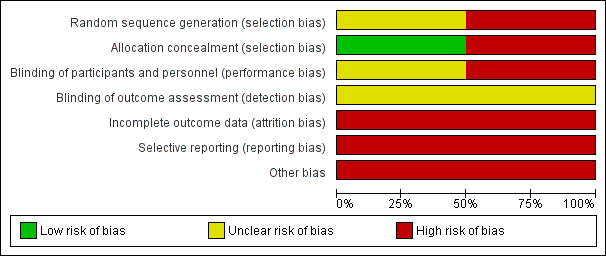
'Risk of bias' graph: review authors' judgements about each risk of bias item presented as percentages across all included studies.
Figuras y tablas -
Figure 2

'Risk of bias' graph: review authors' judgements about each risk of bias item presented as percentages across all included studies.

'Risk of bias' summary: review authors' judgements about each risk of bias item for each included study.
Figuras y tablas -
Figure 3

'Risk of bias' summary: review authors' judgements about each risk of bias item for each included study.

Forest plot of comparison: 1 Ejection fraction, outcome: 1.1 Ejection fraction [%].
Figuras y tablas -
Figure 4

Forest plot of comparison: 1 Ejection fraction, outcome: 1.1 Ejection fraction [%].

Forest plot of comparison: 2 Venous refilling time, outcome: 2.1 Half refilling time [seconds].
Figuras y tablas -
Figure 5

Forest plot of comparison: 2 Venous refilling time, outcome: 2.1 Half refilling time [seconds].

Forest plot of comparison: 2 Venous refilling time, outcome: 2.2 Total refilling time [seconds].
Figuras y tablas -
Figure 6

Forest plot of comparison: 2 Venous refilling time, outcome: 2.2 Total refilling time [seconds].

Comparison 1 Exercise versus control: Ejection fraction, Outcome 1 Ejection fraction.
Figuras y tablas -
Analysis 1.1

Comparison 1 Exercise versus control: Ejection fraction, Outcome 1 Ejection fraction.

Comparison 2 Exercise versus control: Venous refilling time, Outcome 1 Half refilling time.
Figuras y tablas -
Analysis 2.1

Comparison 2 Exercise versus control: Venous refilling time, Outcome 1 Half refilling time.

Comparison 2 Exercise versus control: Venous refilling time, Outcome 2 Total refilling time.
Figuras y tablas -
Analysis 2.2

Comparison 2 Exercise versus control: Venous refilling time, Outcome 2 Total refilling time.

Summary of findings for the main comparison. Summary of findings for primary outcomes

Physical exercise compared with no treatment for non‐ulcerated chronic venous insufficiency

Population: People with non‐ulcerated chronic venous insufficiency
Intervention: Physical exercise
Comparison: No exercise

Outcomes

Anticipated absolute effects* (95% CI)

Relative effect
(95% CI)

No. of participants
(studies)

Quality of the evidence
(GRADE)

Risk with no exercise

Risk with physical exercise

Intensity of disease signs and symptoms1

see footnotes1

Ejection fraction
assessed with: plethysmography

Follow up: 24 weeks

The mean change in ejection fraction from baseline was ‐1.4%

The mean change in ejection fraction from baseline in the intervention group was 4.88% more (3.16 more to 6.6 more)

30
(1 RCT)

⊕⊖⊖⊖
VERY LOW1,2

Half refilling time
assessed with: plethysmography

Follow up: 24 weeks

The mean half refilling time was 7.1 seconds

The mean half refilling time in the intervention group was 4.20 seconds more (3.28 more to 5.12 more)

23
(1 RCT)

⊕⊖⊖⊖
VERY LOW1,2

Total refilling time
assessed with: plethysmography

Follow up: 24 weeks

The mean total refilling time was 16.3 seconds

The mean total refilling time in the intervention group was 9.40 seconds more (7.77 more to 11.03 more)

23
(1 RCT)

⊕⊖⊖⊖
VERY LOW1,2

Incidence of venous leg ulcer3

see footnote3

*The risk in the intervention group (and its 95% confidence interval) is based on the assumed risk in the comparison group and the relative effect of the intervention (and its 95% CI)
CI: Confidence interval; RCT: randomised controlled trial

GRADE Working Group grades of evidence
High quality: We are very confident that the true effect lies close to that of the estimate of the effect
Moderate quality: We are moderately confident in the effect estimate: The true effect is likely to be close to the estimate of the effect, but there is a possibility that it is substantially different
Low quality: Our confidence in the effect estimate is limited: The true effect may be substantially different from the estimate of the effect
Very low quality: We have very little confidence in the effect estimate: The true effect is likely to be substantially different from the estimate of effect

1 unable to pool data because data were collected using different tools
2 downgraded by three levels: presented overall high risk of bias because at least one of the three key criteria (randomisation sequence, allocation concealment and blinded outcome assessment) was at high risk, and it was not possible to verify inconsistency and publication bias because only one study reported on this outcome
3 data were not reported in the two included studies

Figuras y tablas -
Summary of findings for the main comparison. Summary of findings for primary outcomes
Table 1. CEAP classification of chronic venous disease

Classification

Description/Definition

Clinical

0

no visible or palpable signs of venous disease

1

telangiectases or reticular veins

2

varicose veins

3

oedema

4a

pigmentation or eczema

4b

lipodermatosclerosis or atrophie blanchie

5

healed venous ulcer

6

active venous ulcer

S

symptomatic, including ache, pain, tightness, skin irritation, heaviness, muscle cramp and other complaints attributable to venous dysfunction

A

asymptomatic

Etiologyl

Ec

congenital (present since birth)

Ep

primary

Es

secondary (post‐thrombotic, traumatic)

En

no venous cause identified

Anatomy distribution

As

superficial (great and short saphenous veins)

Ap

perforator (thigh and leg perforating veins)

Ad

deep (cava, iliac, gonadal, femoral, profunda, popliteal, tibial, and muscular veins)

An

no venous location identified

Pathophysiology

Pr

reflux (axial and perforating veins)

Po

obstruction (acute and chronic)

Pr,o

combination of both reflux and obstruction (valvular dysfunction and thrombus)

Pn

no venous pathophysiology identified

CEAP classification: classification of chronic venous disease according to clinical manifestation, etiologic factors, anatomic distribution of disease, and underlying pathophysiologic findings

See Eklof 2004 for further details about CEAP

Figuras y tablas -
Table 1. CEAP classification of chronic venous disease
Table 2. Venous Clinical Severity Score

Clinical descriptor

Absent (0)

Mild (1)

Moderate (2)

Severe (3)

Pain

None

Occasional

Daily not limiting

Daily limiting

Varicose veins

None

Few

Calf or thigh

Calf and thigh

Venous oedema

None

Foot and ankle

Below knee

Knee and above

Skin pigmentation

None

Limited perimalleolar

Diffuse lower 1/3 calf

Wider above lower 1/3 calf

Inflammation

None

Limited perimalleolar

Diffuse lower 1/3 calf

Wider above lower 1/3 calf

Induration

None

Limited perimalleolar

Diffuse lower 1/3 calf

Wider above lower 1/3 calf

Number of active ulcers

None

1

2

3 or more

Ulcer duration

None

< 3 month

3 ‐ 12 month

> 1 year

Active ulcer size

None

< 2 cm

2 ‐ 6 cm

> 6 cm

Compression therapy

None

Intermittent

Most days

Fully comply

Figuras y tablas -
Table 2. Venous Clinical Severity Score
Comparison 1. Exercise versus control: Ejection fraction

Outcome or subgroup title

No. of studies

No. of participants

Statistical method

Effect size

1 Ejection fraction Show forest plot

1

Mean Difference (IV, Fixed, 95% CI)

Totals not selected

Figuras y tablas -
Comparison 1. Exercise versus control: Ejection fraction
Comparison 2. Exercise versus control: Venous refilling time

Outcome or subgroup title

No. of studies

No. of participants

Statistical method

Effect size

1 Half refilling time Show forest plot

1

Mean Difference (IV, Fixed, 95% CI)

Totals not selected

2 Total refilling time Show forest plot

1

Mean Difference (IV, Fixed, 95% CI)

Totals not selected

Figuras y tablas -
Comparison 2. Exercise versus control: Venous refilling time